
Chinese vs. US Stock Market Transmission to Australasia, Hong Kong, and the ASEAN Group †


Abstract
:On trade and economic cooperation, China continues to be ASEAN’s largest trading partner since 2009 and we became each other’s top trading partner for the first time in 2020. We commend China’s commitment to long-term prosperity, including in promoting ASEAN-China Sustainable Development Cooperation and being the first Dialogue Partner to have ratified the Regional Comprehensive Economic Partnership (RCEP).
1. Introduction
2. Existing Findings on Regional Co-Movement and Chinese Effects
3. The Markov Switching Framework
4. Methodology and Data
5. Estimation Results
6. Conclusions and Implications
Author Contributions
Funding
Institutional Review Board Statement
Informed Consent Statement
Data Availability Statement
Acknowledgments
Conflicts of Interest
| 1 | Within this grouping, Tang et al. (2024) draw attention to the importance of ASEAN monetary freedom as well as trade freedom for the growth of bilateral trade. |
| 2 | See also their summary of the findings of earlier studies of the region. |
| 3 | Meanwhile, Lean et al. (2024) identify significant US economic policy uncertainty spillovers to the ASEAN stock markets during 2000–2022 (along with some evidence of Chinese policy uncertainty spillovers). |
| 4 | Although the Student’s t-distribution may be better than the normal distribution at capturing the fat tails often seen in stock market returns, Calzolari et al. (2014) find that this comes at the cost of lack of stability under aggregation. Averting this problem would require more sophisticated alternatives, such as a tempered stable distribution (Shi et al., 2020), that lie beyond the scope of our work. |
| 5 | In addition to different market holidays, asynchronous problems stem from the Asian markets closing before the US markets open for trade. With essentially no overlap between their opening hours, utilizing daily stock indices from such disparate time zones would be problematic indeed (cf, Altinkeski et al., 2024). |
| 6 | All market indices in the model are expressed as weekly returns to ensure stationarity. |
References
- Ahmed, A. D., & Huo, R. (2019). Impacts of China’s crash on Asia-Pacific financial integration: Volatility interdependence, information transmission and market co-movement. Economic Modelling, 79, 28–46. [Google Scholar] [CrossRef]
- Altinkeski, B. K., Dibooglu, S., Ismail, E., Kilic, Y., & Bugan, M. F. (2024). Quantile connectedness between VIX and global stock markets. Borsa Istanbul Review, 24, 71–79. [Google Scholar] [CrossRef]
- Anagnostopoulos, A., Atesagaoglu, O. E., Faraglia, E., & Giannitsarou, C. (2022). Cross-country stock market comovement: A macro perspective. Journal of Monetary Economics, 130, 34–48. [Google Scholar] [CrossRef]
- Armstrong, S., & Drysdale, P. (2022). The economic cooperation potential of East Asia’s RCEP agreement. East Asian Economic Review, 26, 3–25. [Google Scholar] [CrossRef]
- Bolkiah, S. H. H. (2021, July 19). Congratulatory message on the occasion of the 30th anniversary of the establishment of ASEAN-China dialogue relations. Available online: https://asean.org/wp-content/uploads/BD-Congratulatory-Message-to-HE-Li-Keqiang_30th-Anniv-AC-Relations-19-J....pdf (accessed on 14 March 2025).
- Budd, B. Q. (2018). The transmission of international stock market volatilities. Journal of Economics and Finance, 42, 155–173. [Google Scholar] [CrossRef]
- Burdekin, R. C. K., Reckers, D., & Tao, R. (2022). Quantifying China’s financial reach up through the pandemic: The African experience. North American Journal of Economics and Finance, 63, 101833. [Google Scholar] [CrossRef]
- Burdekin, R. C. K., & Tao, R. (2021). From Shanghai to Sydney: Chinese stock market influences on Australia. Finance Research Letters, 38, 101502. [Google Scholar] [CrossRef]
- Burdekin, R. C. K., & Tao, R. (2022). Chinese influences on inflation determination in Australia and the ASEAN group: A Markov-switching analysis. Asia and the Global Economy, 2, 100037. [Google Scholar] [CrossRef]
- Calzolari, G., Halbleib, R., & Parrini, A. (2014). Estimating GARCH-type models with symmetric stable innovations: Indirect inference versus maximum likelihood. Computational Statistics and Data Analysis, 76, 158–171. [Google Scholar] [CrossRef]
- Caporale, G. M., Gil-Alana, L. A., & You, K. (2022). Stock market linkages between the ASEAN Countries, China and the US: A fractional integration/cointegration approach. Emerging Markets Finance and Trade, 58(5), 1502–1514. [Google Scholar] [CrossRef]
- Chan, K. F., Treepongkaruna, S., Brooks, R., & Gray, S. (2011). Asset market linkages: Evidence from financial, commodity and real estate assets. Journal of Banking and Finance, 35, 1415–1426. [Google Scholar] [CrossRef]
- Endri, E., Fauzi, F., & Effendi, M. S. (2024). Integration of the Indonesian stock market with eight major trading partners’ stock markets. Economies, 12, 350. [Google Scholar] [CrossRef]
- Guru, B. K., & Yadav, I. S. (2022). Stock market integration and volatility spillovers: New evidence from Asia-Pacific and European markets. Journal of Risk Finance, 24(2), 186–211. [Google Scholar] [CrossRef]
- Hamilton, J. D. (1988). Rational-expectations econometric analysis of changes in regime: An investigation of the term structure of interest rates. Journal of Economic Dynamics and Control, 12, 385–423. [Google Scholar] [CrossRef]
- Johnson, R., & Soenen, L. (2002). Asian economic integration and stock market comovement. Journal of Financial Research, 25, 141–157. [Google Scholar] [CrossRef]
- Le, T., Vo, L. H., & Taghizadeh-Hesary, F. (2024). A study on the nonlinear dynamics of ASEAN financial integration. Journal of Asian Business and Economic Studies, 31(1), 2–14. [Google Scholar] [CrossRef]
- Lean, H. H., Alkhazali, O. M., Gleason, K., & Yeap, X. W. (2024). Connectedness and economic policy uncertainty spillovers to the ASEAN stock markets. International Review of Economics and Finance, 90, 167–186. [Google Scholar] [CrossRef]
- Li, D., Chen, X., & Wohlfarth, P. (2022). Public participation, investment networks, and China’s outward FDI: Evidence from 58 countries along the belt and road. Emerging Markets Review, 51, 100887. [Google Scholar] [CrossRef]
- Narayan, P. K., Rath, B. N., & Syarifuddin, F. (2022). Understanding the role of trade agreements in Indonesia’s FDI. Journal of Asian Economics, 82, 101532. [Google Scholar] [CrossRef]
- Park, Y. C., & Song, C.-Y. (2011). Renminbi internationalization: Prospects and implications for economic integration in East Asia. Asian Economic Papers, 10, 42–72. [Google Scholar] [CrossRef]
- Rahman, M. S. R., & Shahari, F. (2021). Does the financial cooperation agreement increase the interdependency among ASEAN+3 equity markets? A Markov switching approach. International Economics and Economic Policy, 18, 869–899. [Google Scholar] [CrossRef]
- Shahrier, N. A. (2022). Contagion effects in ASEAN-5 exchange rates during the COVID-19 pandemic. North American Journal of Economics and Finance, 62, 101707. [Google Scholar] [CrossRef]
- Shi, Y., Feng, L., & Fu, T. (2020). Markov regime-switching in-mean model with tempered stable distribution. Computational Economics, 55(4), 1275–1299. [Google Scholar] [CrossRef]
- Tang, C., Rosland, A., Li, J., & Yasmeen, R. (2024). The comparison of bilateral trade between China and ASEAN, China and EU: From the aspect of trade structure, trade complementarity and structural gravity model of trade. Applied Economics, 56(9), 1077–1089. [Google Scholar] [CrossRef]
- Verevis, S., & Üngör, M. (2021). What has New Zealand gained from the FTA with China? Two counterfactual analyses. Scottish Journal of Political Economy, 68, 20–50. [Google Scholar] [CrossRef]
- Vo, X. V., & Tran, T. T. A. (2020). Modelling volatility spillovers from the US equity market to ASEAN stock markets. Pacific-Basin Finance Journal, 59, 101246. [Google Scholar] [CrossRef]
- Wang, B., & Xiao, Y. (2023). Risk spillovers from China’s and the US stock markets during high-volatility periods: Evidence from East Asian stock markets. International Review of Financial Analysis, 86, 102538. [Google Scholar] [CrossRef]
- Wu, F. (2020). Stock market integration in East and Southeast Asia: The role of global factors. International Review of Financial Analysis, 67, 101416. [Google Scholar] [CrossRef]
- Zhang, M., & Chen, Q. (2020). New opportunity for RMB internationalization in the post-COVID-19 period. China Economic Transition, 3, 28–40. [Google Scholar]
- Zhou, Q. (2024, November 11). China-Indonesia closer economic ties: Trade and investment opportunities. China Briefing. Available online: https://www.china-briefing.com/news/china-indonesia-trade-and-investment-profile-opportunities/ (accessed on 14 March 2025).

| Country/ Region | Stock Exchange | Market Cap (US Dollars) | Number of Listings |
|---|---|---|---|
| China | Shanghai Stock Exchange (SSE) | USD 7.26 trillion | 1686 |
| Australia | Australian Securities Exchange (ASX) | USD 1.66 trillion | 2121 |
| Hong Kong | Hong Kong Stock Exchange (HKEX) | USD 4.56 trillion | 2265 |
| Indonesia | Indonesia Stock Exchange (IDX) | USD 629 billion | 766 |
| Malaysia | Kuala Lumpur Stock Exchange (KLSE) | USD 361 billion | 788 |
| New Zealand | New Zealand Stock Exchange (NZSX) | USD 165 billion | 184 |
| Philippines | The Philippine Stock Exchange (PSE) | USD 302 billion | 275 |
| Singapore | Singapore Stock Exchange (SGX) | USD 610 billion | 645 |
| Thailand | The Stock Exchange of Thailand (SET) | USD 542 billion | 614 |
| Vietnam | Ho Chi Minh Stock Exchange (HOSE) | USD 171 billion | 533 |
| Panel A: Stock Market Index | ||||
| Index | Mean | Standard Deviation | Minimum | Maximum |
| Shanghai (SSE) | 2907.68 | 518.58 | 1979.21 | 5166.35 |
| Australia (ASX) | 5628.49 | 915.70 | 3903.16 | 7628.92 |
| Hong Kong (HSI) | 23,894.49 | 3260.72 | 14,863.06 | 33,154.12 |
| Indonesia (JCI) | 5141.16 | 1111.75 | 2518.98 | 7242.66 |
| Malaysia (KLCI) | 1631.29 | 142.70 | 1247.90 | 1887.75 |
| New Zealand (NZX) | 7294.17 | 3283.62 | 2938.11 | 13,558.19 |
| Philippines (PSEI) | 6481.95 | 1400.10 | 2855.64 | 9041.20 |
| Singapore (STI) | 3094.16 | 237.19 | 2389.29 | 3577.21 |
| Thailand (SET) | 1417.37 | 259.21 | 691.41 | 1828.88 |
| Vietnam (VNI) | 755.26 | 304.87 | 336.73 | 1528.48 |
| US (SPY) | 239.24 | 98.31 | 102.20 | 474.96 |
| Panel B: Weekly Returns of Each Index | ||||
| Index | Mean | Standard Deviation | Minimum | Maximum |
| Shanghai (SSE) | 0.000 | 0.027 | −0.130 | 0.090 |
| Australia (ASX) | 0.001 | 0.021 | −0.130 | 0.080 |
| Hong Kong (HSI) | 0.000 | 0.027 | −0.090 | 0.110 |
| Indonesia (JCI) | 0.002 | 0.023 | −0.150 | 0.090 |
| Malaysia (KLCI) | 0.000 | 0.015 | −0.090 | 0.060 |
| New Zealand (NZX) | 0.002 | 0.016 | −0.151 | 0.079 |
| Philippines (PSEI) | 0.002 | 0.025 | −0.180 | 0.110 |
| Singapore (STI) | 0.000 | 0.020 | −0.110 | 0.100 |
| Thailand (SET) | 0.001 | 0.022 | −0.170 | 0.080 |
| Vietnam (VNI) | 0.001 | 0.028 | −0.150 | 0.110 |
| US (SPY) | 0.002 | 0.023 | −0.150 | 0.120 |
| Panel A: China FDI Stock in Each Country/Region | ||||
| Index | Mean | Standard Deviation | Minimum | Maximum |
| Australia | 27.163 | 11.030 | 7.868 | 38.379 |
| Hong Kong | 848.110 | 507.387 | 199.056 | 1588.670 |
| Indonesia | 10.448 | 7.290 | 1.150 | 24.270 |
| Malaysia | 5.053 | 4.167 | 0.709 | 12.050 |
| New Zealand | 1.666 | 1.131 | 0.159 | 3.129 |
| Philippines | 0.726 | 0.180 | 0.387 | 1.113 |
| Singapore | 36.745 | 22.905 | 6.069 | 73.450 |
| Thailand | 5.065 | 3.235 | 1.080 | 10.570 |
| Vietnam | 5.077 | 3.566 | 0.987 | 11.660 |
| Panel B: China FDI Flow in Each Country/Region | ||||
| Index | Mean | Standard Deviation | Minimum | Maximum |
| Australia | 2.302 | 2.586 | −3.629 | 6.433 |
| Hong Kong | 109.552 | 54.909 | 34.557 | 200.521 |
| Indonesia | 1.805 | 1.015 | 0.351 | 4.190 |
| Malaysia | 0.890 | 1.097 | −0.464 | 3.473 |
| New Zealand | 0.200 | 0.317 | −0.438 | 0.894 |
| Philippines | 0.075 | 0.108 | −0.166 | 0.245 |
| Singapore | 5.276 | 3.418 | 1.212 | 11.345 |
| Thailand | 0.779 | 0.400 | 0.227 | 1.640 |
| Vietnam | 0.841 | 0.669 | −0.018 | 2.278 |
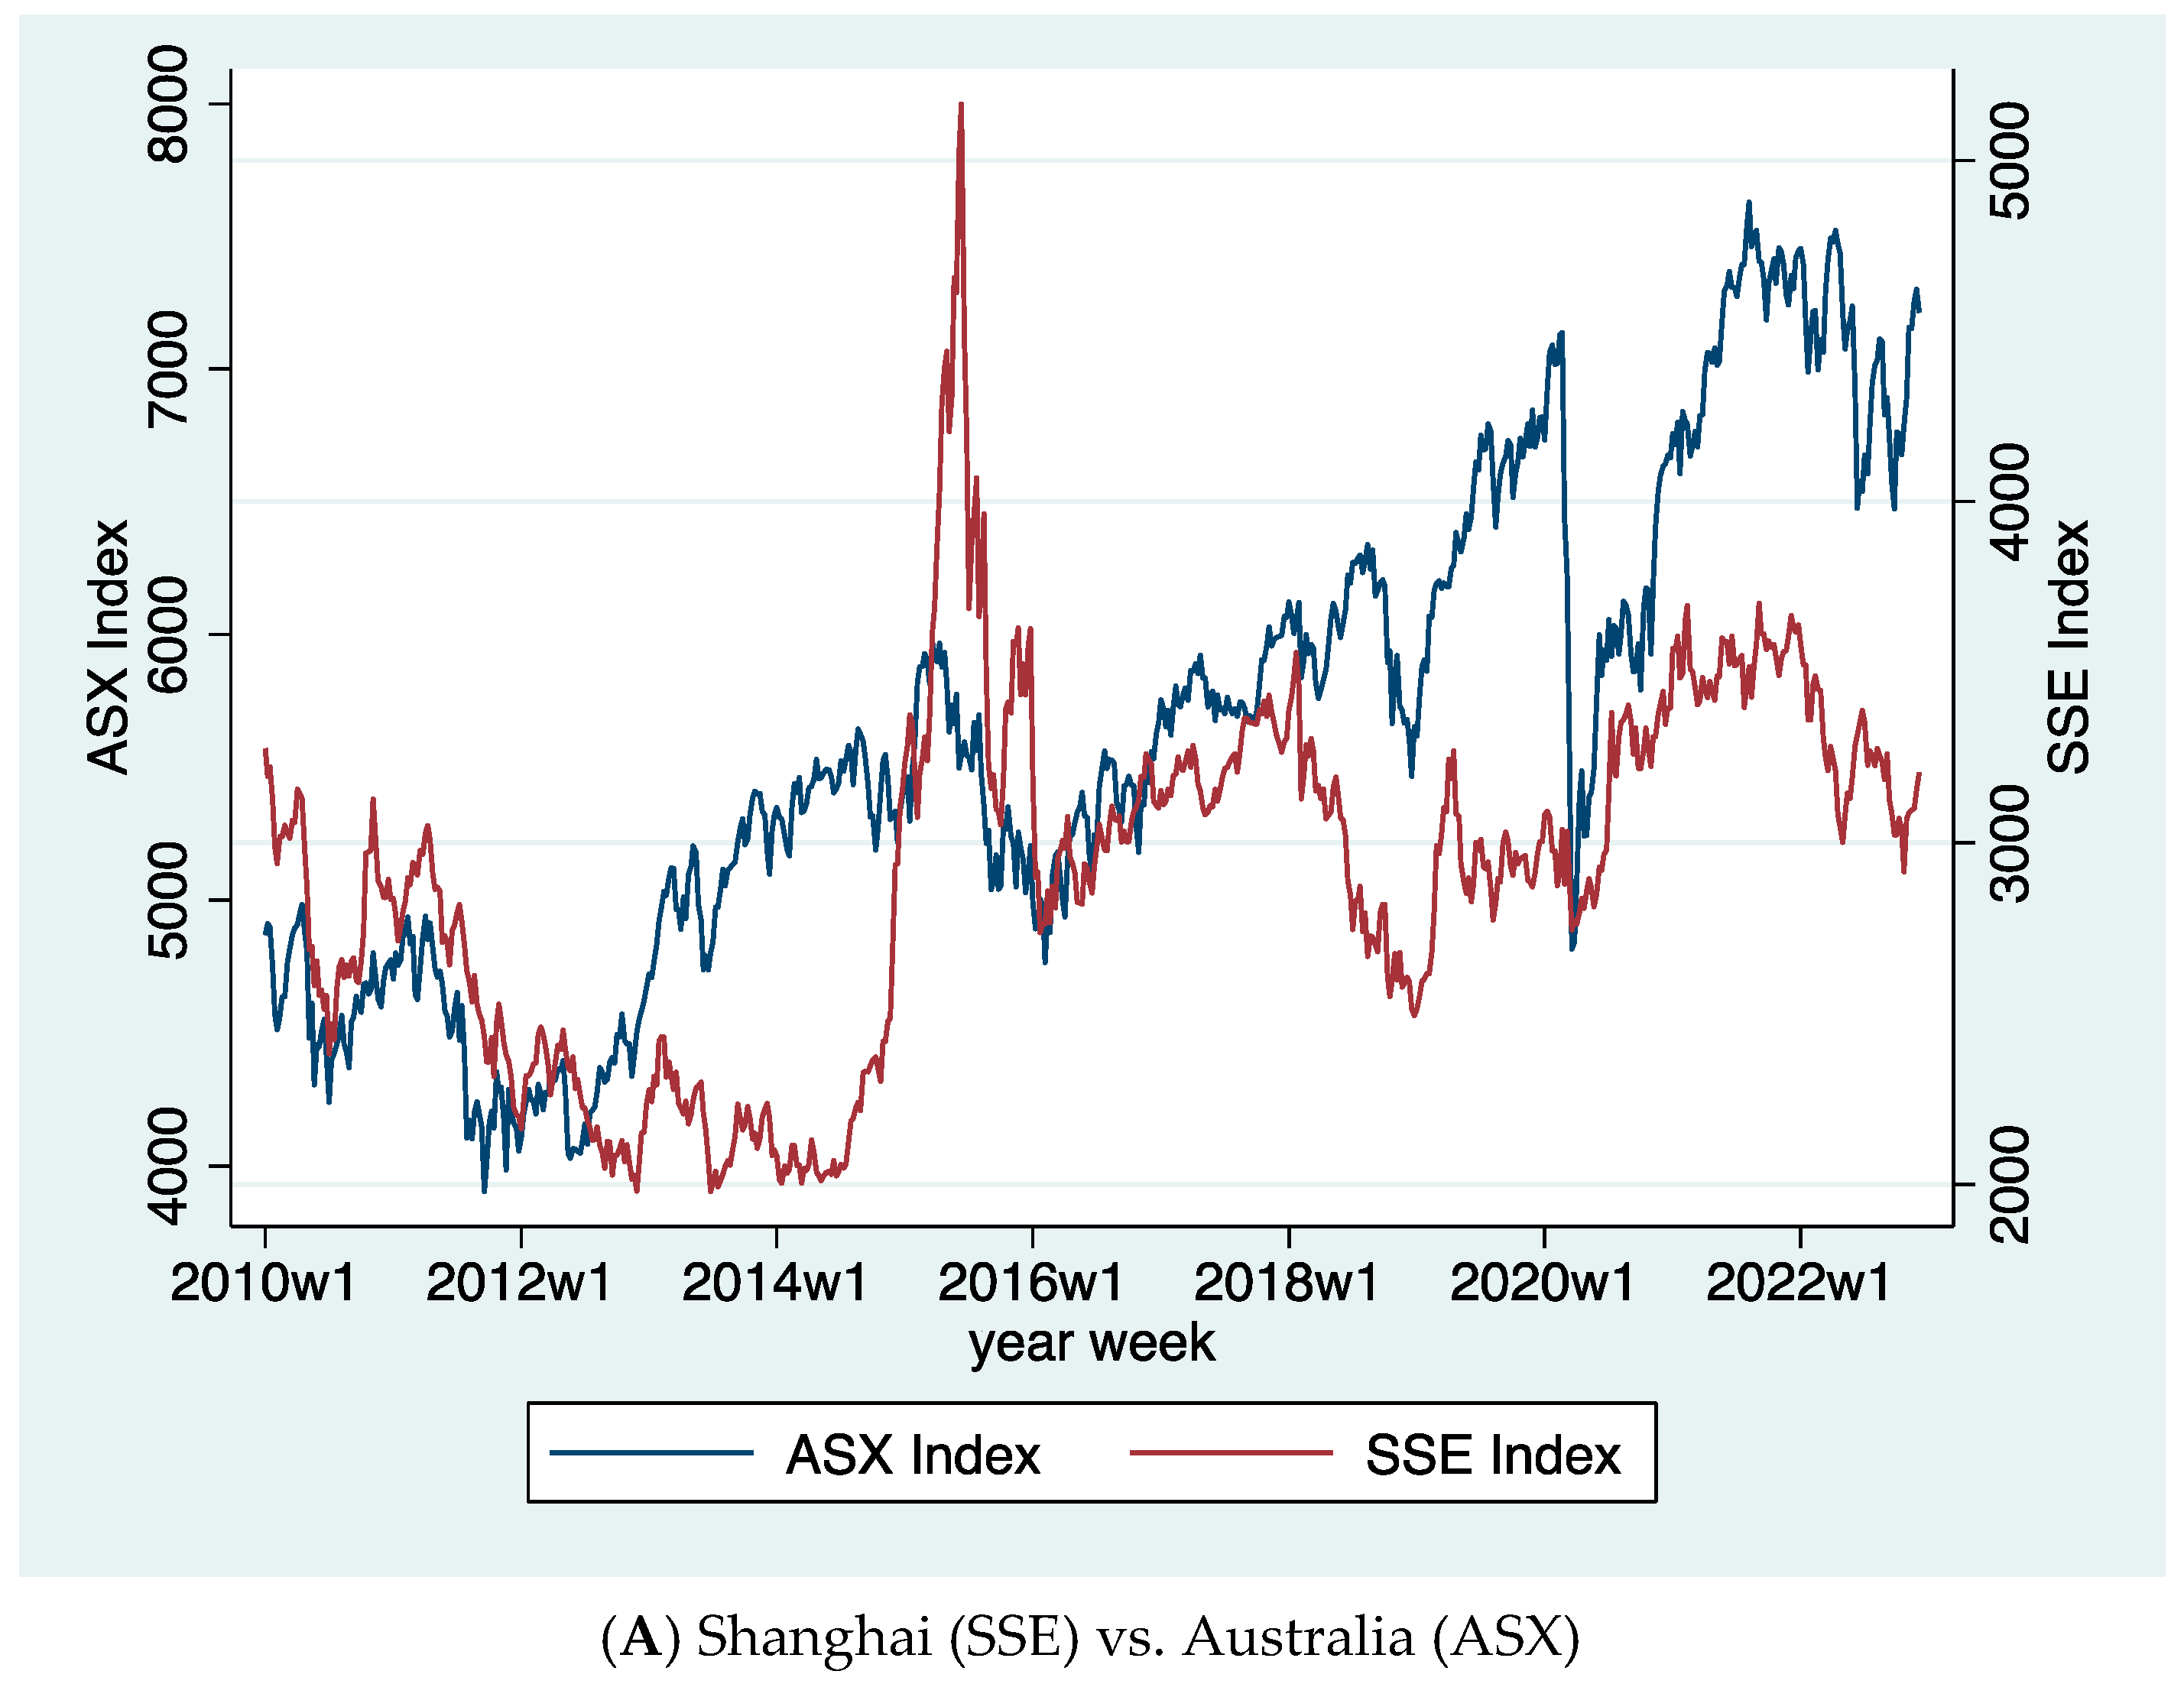
| A. Shanghai (SSE) vs. Australia (ASX) | ||||
 | ||||
| Full sample | Pre-COVID Sample | |||
| High-Volatility Regime | Low-Volatility Regime | High-Volatility Regime | Low-Volatility Regime | |
| ASXt−1 | −0.117 | −0.172 ** | −0.232 *** | −0.0324 |
| (0.0780) | (0.0704) | (0.0739) | (0.0926) | |
| SSEt | 0.0857 * | −0.0196 | 0.0148 | 0.0258 |
| (0.0472) | (0.0342) | (0.0378) | (0.0456) | |
| SSEt−1 | −0.0176 | 0.0352 | 0.0443 | 0.0373 |
| (0.0429) | (0.0334) | (0.0332) | (0.0323) | |
| SPX | 0.640 *** | 0.489 *** | 0.811 *** | 0.206 *** |
| (0.0466) | (0.0446) | (0.0607) | (0.0468) | |
| SPXt−1 | 0.364 *** | −0.0861 | 0.0501 | 0.145 *** |
| (0.0770) | (0.0730) | (0.0668) | (0.0518) | |
| Coronavirus | 0.001 (0.00) | |||
| With FDI flow added as non-switching variable | ||||
| Full sample | Pre-COVID Sample | |||
| High-Volatility Regime | Low-Volatility Regime | High-Volatility Regime | Low-Volatility Regime | |
| ASXt−1 | −0.117 | −0.174 ** | −0.232 *** | −0.0324 |
| (0.0755) | (0.0716) | (0.0740) | (0.0923) | |
| SSEt | 0.0840 * | −0.0210 | 0.0148 | 0.0257 |
| (0.0461) | (0.0346) | (0.0378) | (0.0455) | |
| SSEt−1 | −0.0171 | 0.0371 | 0.0442 | 0.0373 |
| (0.0417) | (0.0347) | (0.0333) | (0.0324) | |
| SPX | 0.638 *** | 0.488 *** | 0.811 *** | 0.206 *** |
| (0.0461) | (0.0459) | (0.0608) | (0.0467) | |
| SPXt−1 | 0.358 *** | −0.0934 | 0.0503 | 0.145 *** |
| (0.0774) | (0.0829) | (0.0670) | (0.0518) | |
| FDI | 0.194 (0.03) | 0.007 (0.03) | ||
| Coronavirus | −0.0004 (0.002) | |||
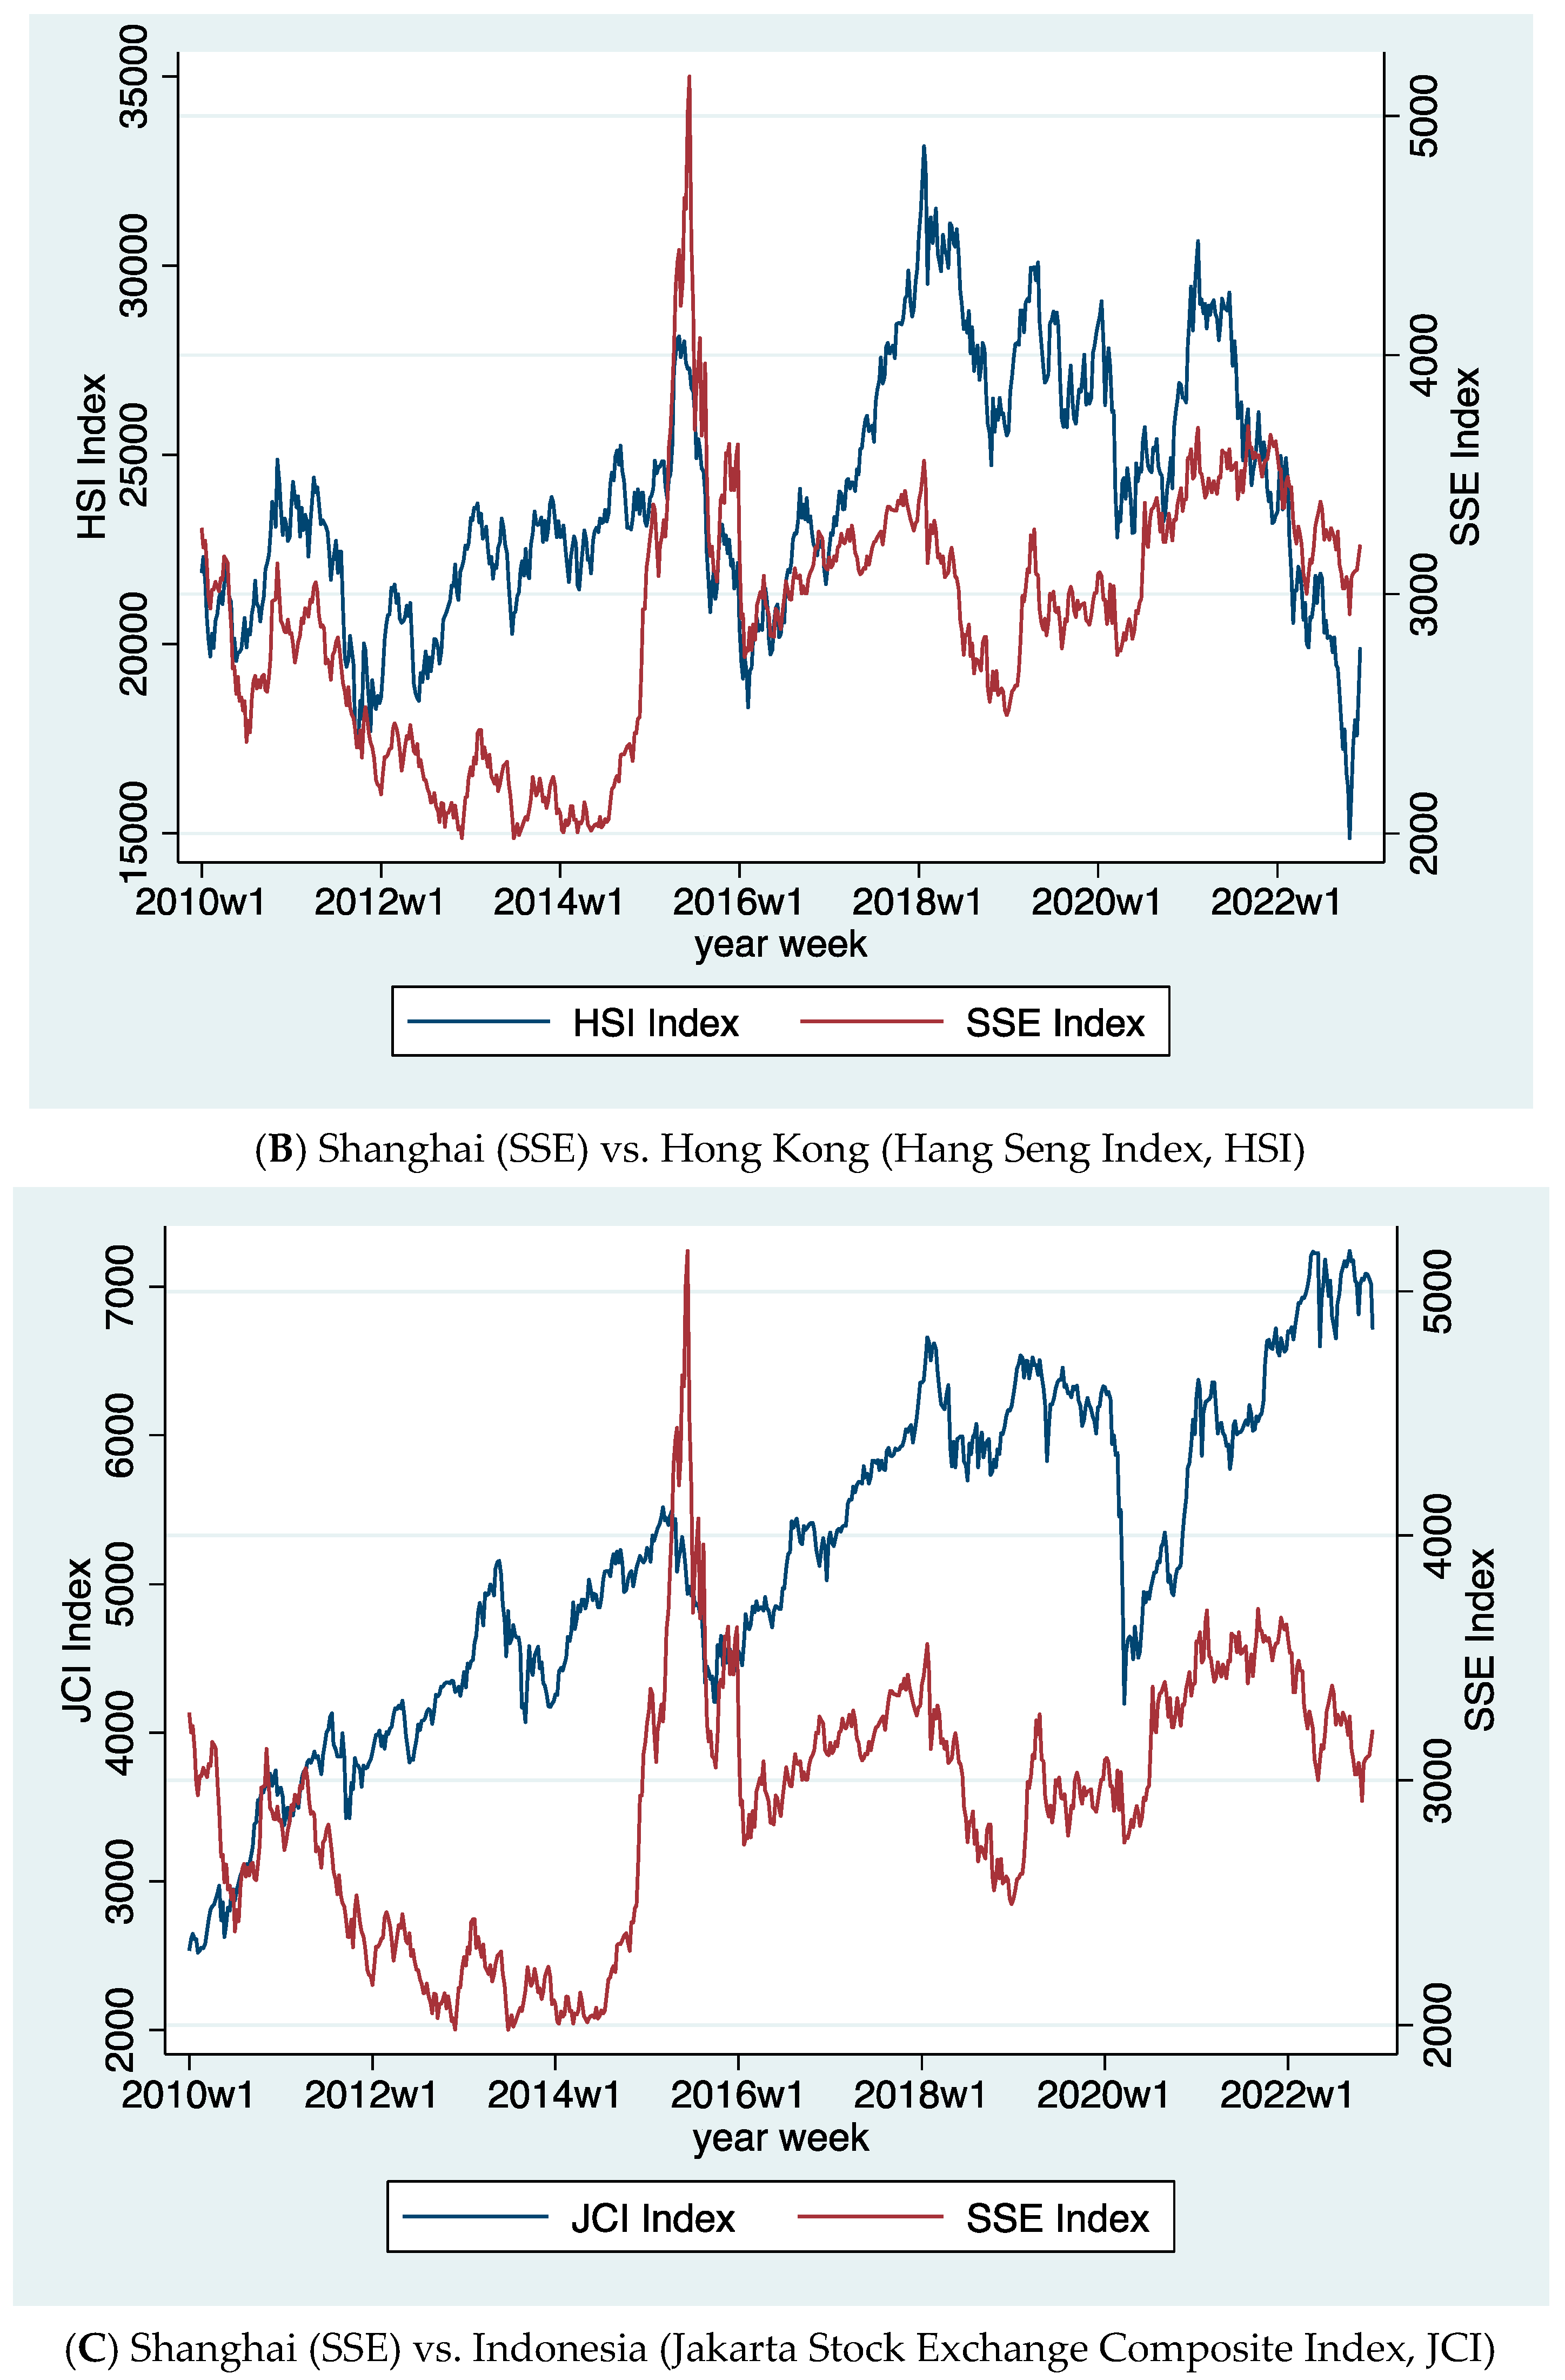
| B. Shanghai (SSE) vs. Hong Kong (Hang Seng Index, HSI) | ||||
 | ||||
| Full sample | Pre-COVID Sample | |||
| High-Volatility Regime | Low-Volatility Regime | High-Volatility Regime | Low-Volatility Regime | |
| HSIt−1 | 0.444 *** | −0.222 *** | 0.103 | −0.153 * |
| (0.164) | (0.0660) | (0.117) | (0.0792) | |
| SSEt | 0.727 *** | 0.316 *** | 0.357 *** | 0.303 *** |
| (0.209) | (0.0398) | (0.0955) | (0.0559) | |
| SSEt−1 | 0.0238 | 0.0172 | −0.0719 | 0.0756 |
| (0.186) | (0.0452) | (0.128) | (0.0850) | |
| SPX | 0.0918 | 0.562 *** | 0.281 *** | 0.782 *** |
| (0.110) | (0.0616) | (0.0874) | (0.0670) | |
| SPXt−1 | −0.363 ** | 0.262 *** | 0.110 | 0.136 * |
| (0.165) | (0.0628) | (0.113) | (0.0724) | |
| Coronavirus | −0.003 (0.002) | |||
| With FDI flow added as non-switching variable | ||||
| Full sample | Pre-COVID Sample | |||
| High-Volatility Regime | Low-Volatility Regime | High-Volatility Regime | Low-Volatility Regime | |
| HSIt−1 | 0.399 *** | −0.204 *** | 0.102 | −0.152 * |
| (0.152) | (0.0764) | (0.117) | (0.0806) | |
| SSEt | 0.684 *** | 0.330 *** | 0.355 *** | 0.304 *** |
| (0.200) | (0.0408) | (0.0954) | (0.0567) | |
| SSEt−1 | 0.192 | −0.0122 | −0.0690 | 0.0739 |
| (0.269) | (0.0522) | (0.131) | (0.0877) | |
| SPX | 0.0851 | 0.559 *** | 0.282 *** | 0.782 *** |
| (0.114) | (0.0624) | (0.0874) | (0.0672) | |
| SPXt−1 | −0.369 ** | 0.259 *** | 0.110 | 0.136 * |
| (0.168) | (0.0647) | (0.113) | (0.0724) | |
| FDI | 0.009 (0.015) | 0.002 (0.002) | ||
| Coronavirus | −0.0004 (0.002) | |||
| C. Shanghai (SSE) vs. Indonesia (Jakarta Stock Exchange Composite Index, JCI) | ||||
 | ||||
| Full sample | Pre-COVID Sample | |||
| High-Volatility Regime | Low-Volatility Regime | High-Volatility Regime | Low-Volatility Regime | |
| JCIt−1 | −0.216 *** | −0.00675 | −0.265 *** | −0.0422 |
| (0.0766) | (0.0667) | (0.0934) | (0.0736) | |
| SSEt | 0.0518 | 0.0884 *** | 0.0165 | 0.0880 ** |
| (0.0667) | (0.0273) | (0.0829) | (0.0356) | |
| SSEt−1 | 0.000544 | −0.0587 ** | −0.0116 | −0.0560 |
| (0.0641) | (0.0290) | (0.0792) | (0.0372) | |
| SPX | 0.692 *** | 0.144 *** | 0.645 *** | 0.186 *** |
| (0.0880) | (0.0363) | (0.147) | (0.0575) | |
| SPXt−1 | 0.157 * | 0.0402 | 0.165 | 0.0514 |
| (0.0900) | (0.0319) | (0.138) | (0.0466) | |
| Coronavirus | −0.001 (0.00) | |||
| With FDI flow added as non-switching variable | ||||
| Full sample | Pre-COVID Sample | |||
| High-Volatility Regime | Low-Volatility Regime | High-Volatility Regime | Low-Volatility Regime | |
| JCIt−1 | −0.232 *** | 0.00850 | −0.268 *** | −0.0565 |
| (0.0794) | (0.0641) | (0.0903) | (0.0719) | |
| SSEt | 0.0487 | 0.0907 *** | 0.0166 | 0.0936 *** |
| (0.0687) | (0.0275) | (0.0823) | (0.0339) | |
| SSEt−1 | 0.00353 | −0.0605 ** | −0.00810 | −0.0540 |
| (0.0663) | (0.0294) | (0.0789) | (0.0357) | |
| SPX | 0.706 *** | 0.148 *** | 0.631 *** | 0.184 *** |
| (0.0878) | (0.0370) | (0.137) | (0.0541) | |
| SPXt−1 | 0.162 * | 0.0375 | 0.163 | 0.0495 |
| (0.0934) | (0.0320) | (0.136) | (0.0457) | |
| FDI | −0.750 (0.89) | −2.90 *** (1.06) | ||
| Coronavirus | −0.0004 (0.002) | |||
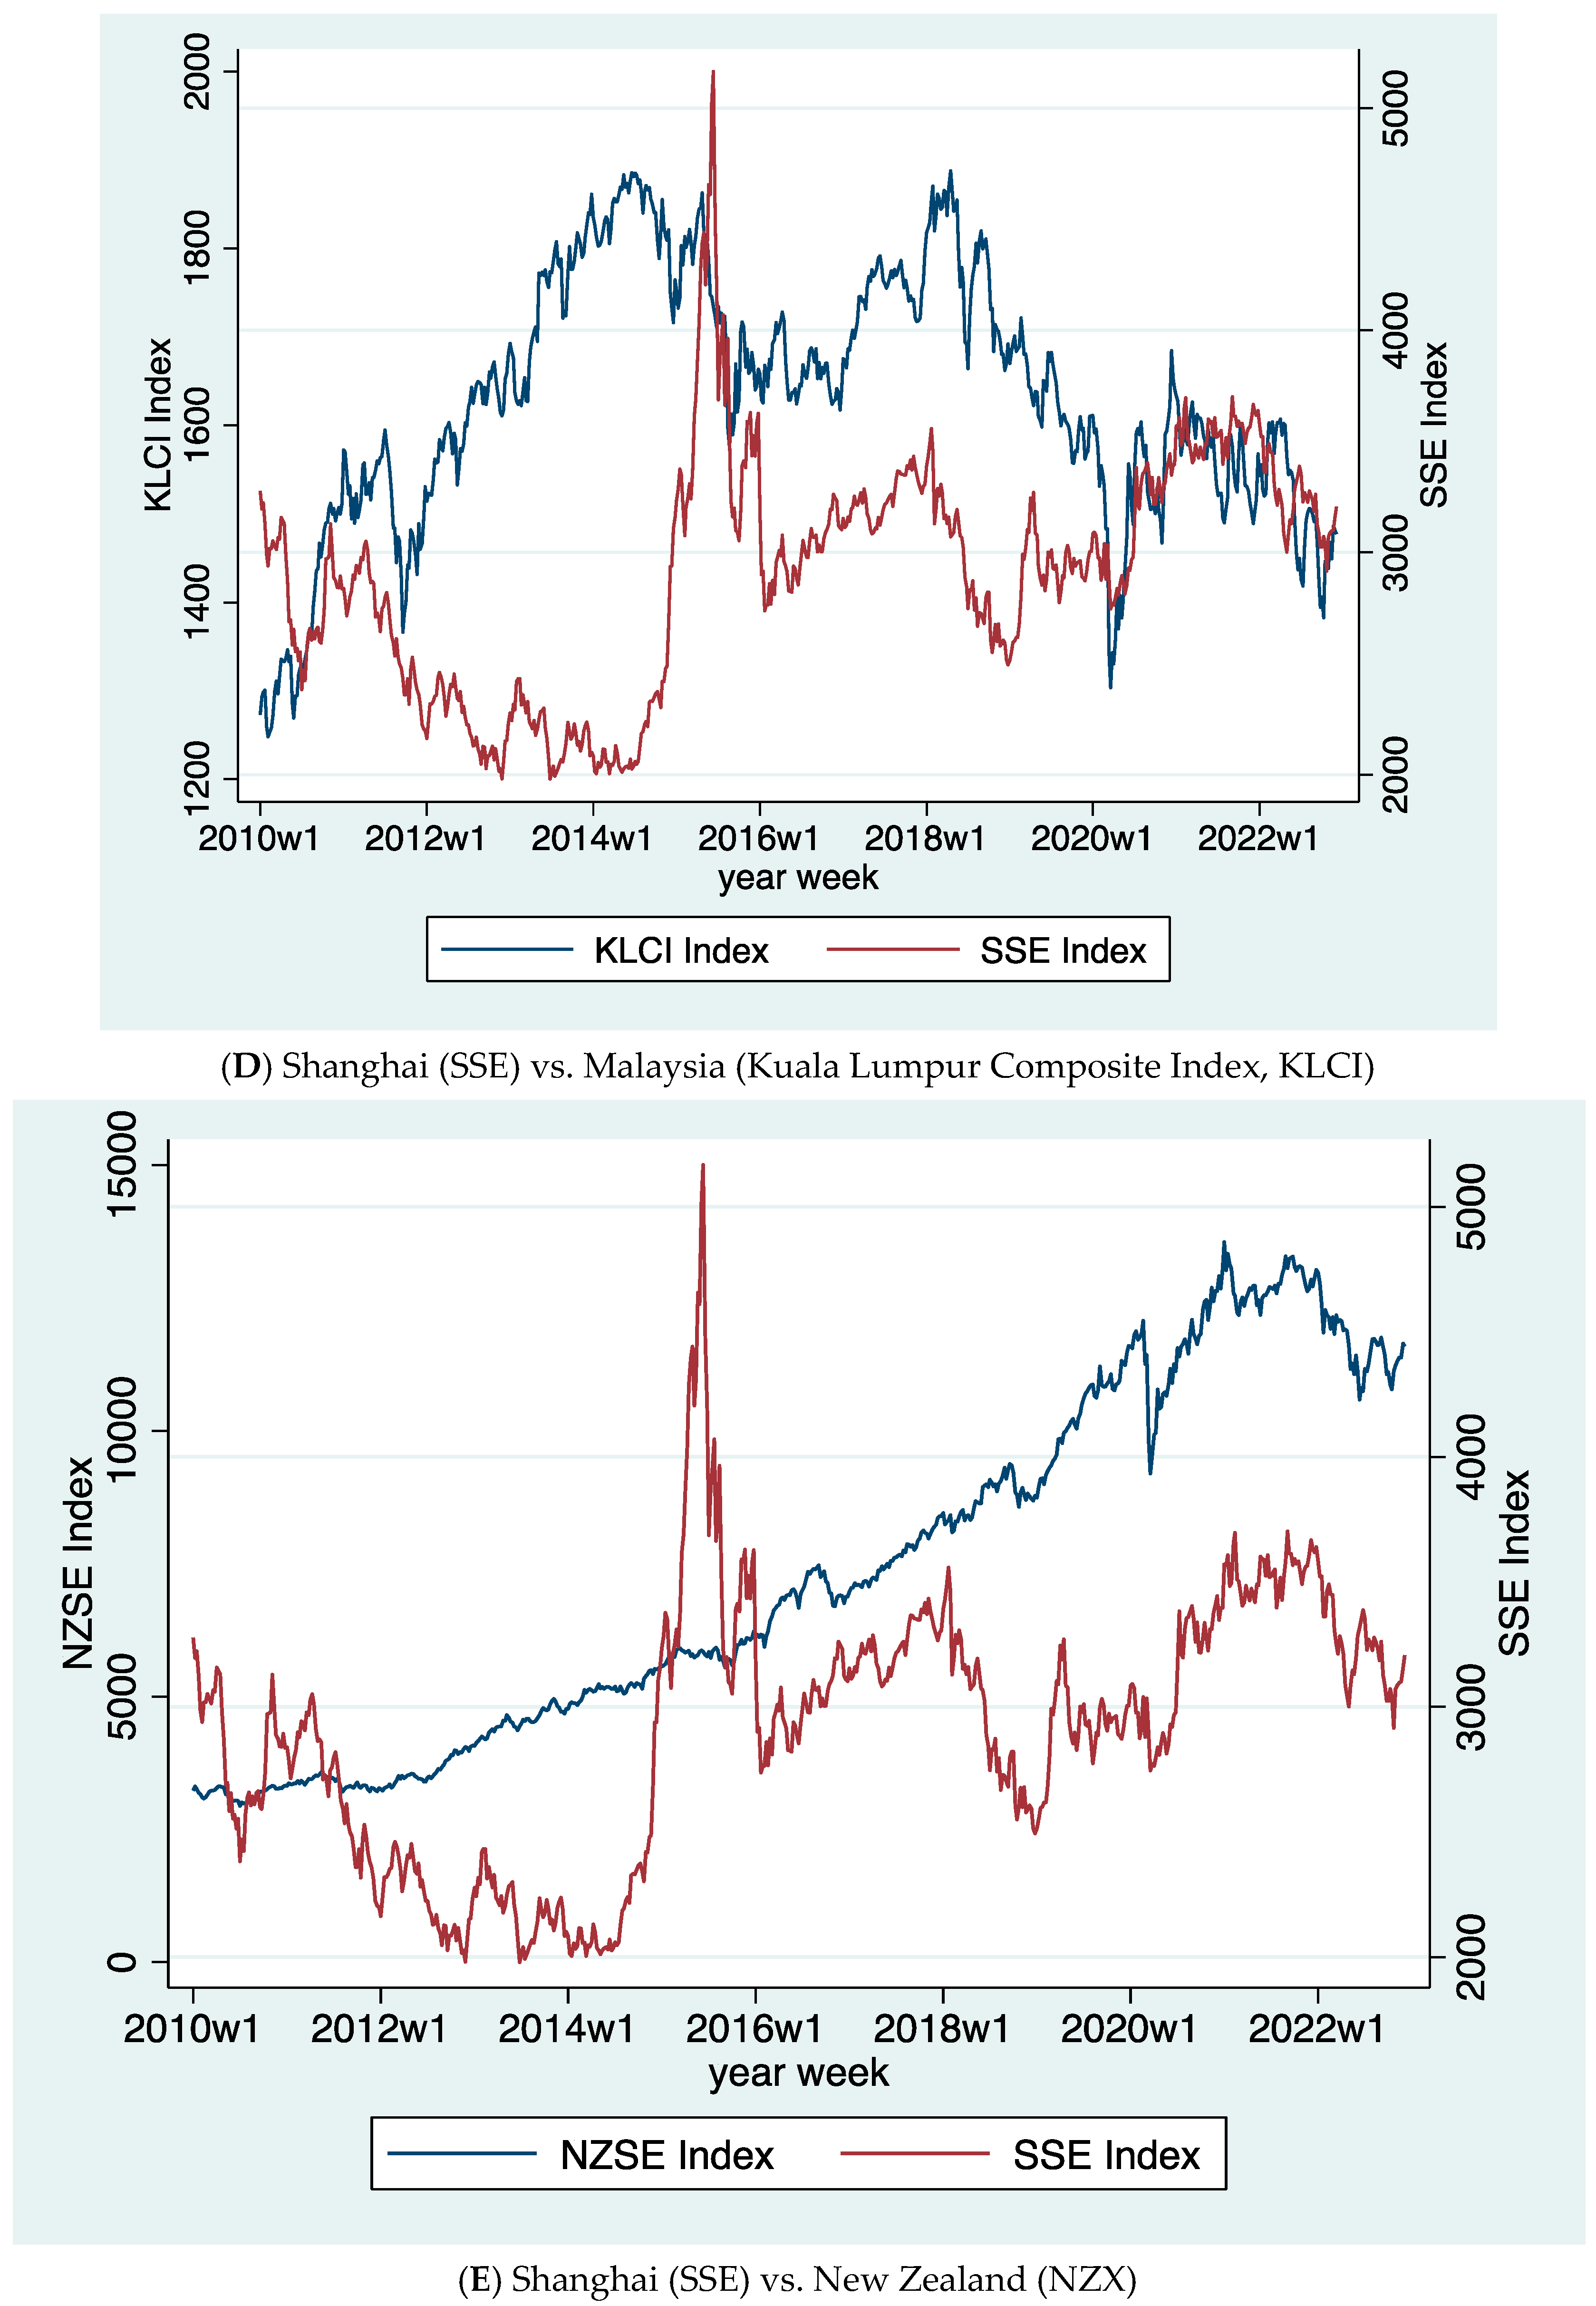
| D. Shanghai (SSE) vs. Malaysia (Kuala Lumpur Composite Index, KLCI) | ||||
 | ||||
| Full sample | Pre-COVID Sample | |||
| High-Volatility Regime | Low-Volatility Regime | High-Volatility Regime | Low-Volatility Regime | |
| KLCIt−1 | −0.127 * | 0.0500 | −0.133 | 0.0516 |
| (0.0753) | (0.0580) | (0.0881) | (0.0623) | |
| SSEt | 0.0337 | 0.0589 *** | −0.00603 | 0.0679 ** |
| (0.0466) | (0.0228) | (0.0463) | (0.0264) | |
| SSEt−1 | −0.0179 | −0.0202 | −0.0113 | −0.0122 |
| (0.0467) | (0.0226) | (0.0455) | (0.0245) | |
| SPX | 0.357 *** | 0.135 *** | 0.353 *** | 0.114 ** |
| (0.0520) | (0.0377) | (0.0770) | (0.0550) | |
| SPXt−1 | 0.110 ** | 0.0722 ** | 0.112 | 0.0571 |
| (0.0551) | (0.0330) | (0.0800) | (0.0441) | |
| Coronavirus | −0.003 ** (0.00) | |||
| With FDI flow added as non-switching variable | ||||
| Full sample | Pre-COVID Sample | |||
| High-Volatility Regime | Low-Volatility Regime | High-Volatility Regime | Low-Volatility Regime | |
| KLCIt−1 | −0.125 * | 0.0485 | −0.129 | 0.0479 |
| (0.0748) | (0.0576) | (0.0884) | (0.0622) | |
| SSEt | 0.0349 | 0.0588 ** | −0.00494 | 0.0670 *** |
| (0.0464) | (0.0229) | (0.0469) | (0.0258) | |
| SSEt−1 | −0.0173 | −0.0198 | −0.0101 | −0.0120 |
| (0.0464) | (0.0226) | (0.0462) | (0.0242) | |
| SPX | 0.356 *** | 0.136 *** | 0.350 *** | 0.118 ** |
| (0.0514) | (0.0373) | (0.0769) | (0.0524) | |
| SPXt−1 | 0.108 ** | 0.0745 ** | 0.107 | 0.0615 |
| (0.0545) | (0.0329) | (0.0789) | (0.0425) | |
| FDI Flow | −0.264 (0.451) | 0.219 (0.478) | ||
| Coronavirus | −0.003 ** (0.001) | |||
| E. Shanghai (SSE) vs. New Zealand (NZX) | ||||
 | ||||
| Full sample | Pre-COVID Sample | |||
| High-Volatility Regime | Low-Volatility Regime | High-Volatility Regime | Low-Volatility Regime | |
| NZXt−1 | −0.340 *** | −0.126 ** | −0.0817 | −0.219 * |
| (0.110) | (0.0496) | (0.0646) | (0.125) | |
| SSEt | 0.195 * | 0.00198 | 0.0488 | −0.0472 |
| (0.117) | (0.0188) | (0.0301) | (0.0307) | |
| SSEt−1 | −0.212 | 0.0295 | −0.0214 | 0.105 *** |
| (0.134) | (0.0184) | (0.0316) | (0.0334) | |
| SPX | 0.456 *** | 0.281 *** | 0.312 *** | 0.190 *** |
| (0.0762) | (0.0321) | (0.0404) | (0.0551) | |
| SPXt−1 | 0.360 *** | 0.122 *** | 0.188 *** | −0.0388 |
| (0.0898) | (0.0316) | (0.0461) | (0.0633) | |
| Coronavirus | −0.00132 | |||
| (0.00127) | ||||
| With FDI flow added as non-switching variable | ||||
| Full sample | Pre-COVID Sample | |||
| High-Volatility Regime | Low-Volatility Regime | High-Volatility Regime | Low-Volatility Regime | |
| NZXt−1 | −0.341 *** | −0.129 *** | −0.0819 | −0.222 * |
| (0.110) | (0.0492) | (0.0635) | (0.123) | |
| SSEt | 0.191 | 0.00228 | 0.0485 | −0.0474 |
| (0.117) | (0.0187) | (0.0300) | (0.0305) | |
| SSEt−1 | −0.213 | 0.0294 | −0.0203 | 0.105 *** |
| (0.132) | (0.0184) | (0.0316) | (0.0330) | |
| SPX | 0.459 *** | 0.280 *** | 0.312 *** | 0.187 *** |
| (0.0762) | (0.0316) | (0.0400) | (0.0557) | |
| SPXt−1 | 0.363 *** | 0.121 *** | 0.187 *** | −0.0412 |
| (0.0902) | (0.0314) | (0.0457) | (0.0632) | |
| FDI Flow | 1.412 (1.71) | −0.405 (1.93) | ||
| Coronavirus | −0.001 * (0.001) | |||
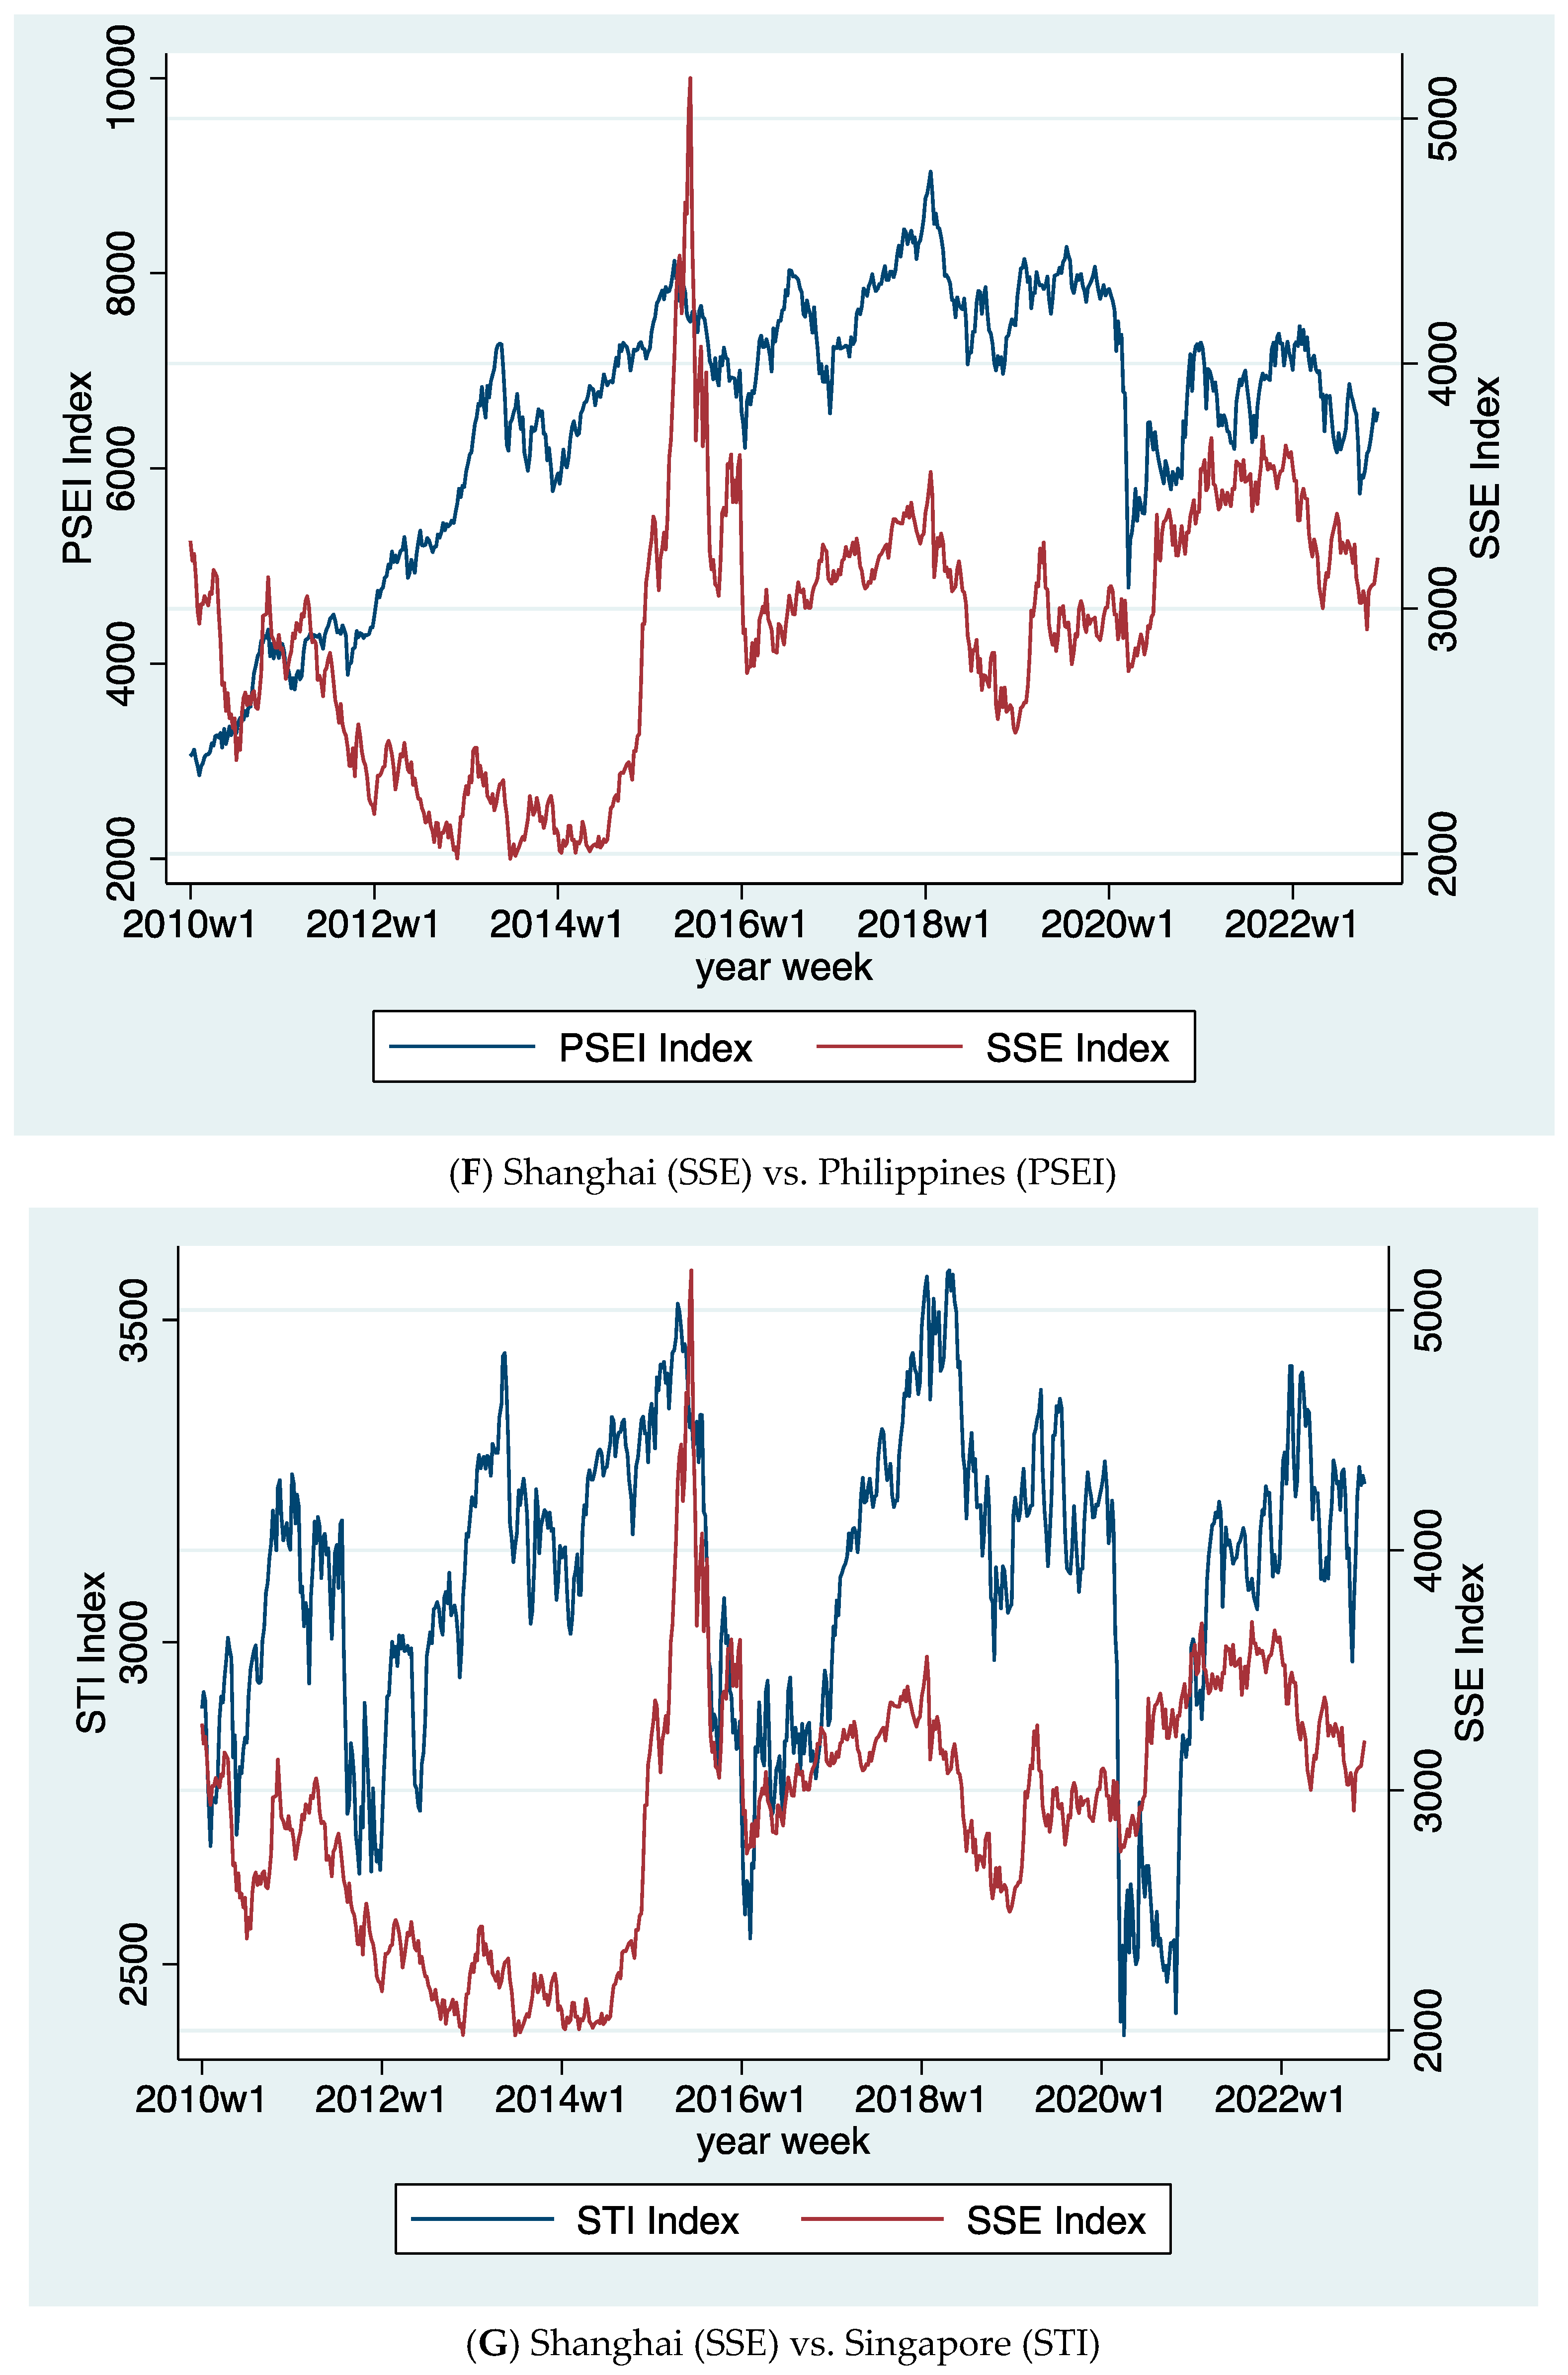
| F. Shanghai (SSE) vs. Philippines (PSEI) | ||||
 | ||||
| Full sample | Pre-COVID Sample | |||
| High-Volatility Regime | Low-Volatility Regime | High-Volatility Regime | Low-Volatility Regime | |
| PSEIt−1 | −0.0997 | −0.0890 * | −0.169 *** | 0.893 *** |
| (0.0967) | (0.0537) | (0.0424) | (0.0139) | |
| SSEt | 0.0298 | 0.0898 *** | 0.0550 * | 0.676 *** |
| (0.119) | (0.0323) | (0.0306) | (0.0119) | |
| SSEt−1 | 0.0686 | −0.0201 | 0.0186 | −0.0716 *** |
| (0.126) | (0.0313) | (0.0312) | (0.00800) | |
| SPX | 0.839 *** | 0.236 *** | 0.285 *** | 0.359 *** |
| (0.147) | (0.0398) | (0.0458) | (0.0104) | |
| SPXt−1 | 0.0837 | 0.167 *** | 0.135 *** | −0.744 *** |
| (0.133) | (0.0438) | (0.0469) | (0.0125) | |
| Coronavirus | −0.004 ** (0.002) | |||
| With FDI flow added as non-switching variable | ||||
| Full sample | Pre-COVID Sample | |||
| High-Volatility Regime | Low-Volatility Regime | High-Volatility Regime | Low-Volatility Regime | |
| PSEIt−1 | −0.113 | −0.111 ** | −0.238 *** | 0.605 *** |
| (0.0948) | (0.0549) | (0.0523) | (0.124) | |
| SSEt | 0.0678 | 0.0882 *** | 0.0426 | 0.587 *** |
| (0.122) | (0.0310) | (0.0331) | (0.100) | |
| SSEt−1 | 0.0706 | −0.0168 | 0.0302 | −0.00752 |
| (0.125) | (0.0304) | (0.0320) | (0.132) | |
| SPX | 0.796 *** | 0.242 *** | 0.284 *** | 0.448 ** |
| (0.140) | (0.0404) | (0.0473) | (0.179) | |
| SPXt−1 | 0.117 | 0.163 *** | 0.177 *** | −0.681 *** |
| (0.129) | (0.0436) | (0.0510) | (0.219) | |
| FDI Flow | 25.581 *** (7.65) | 26.95 *** (7.98) | ||
| Coronavirus | −0.007 *** (0.002) | |||
| G. Shanghai (SSE) vs. Singapore (STI) | ||||
 | ||||
| Full sample | Pre-COVID Sample | |||
| High-Volatility Regime | Low-Volatility Regime | High-Volatility Regime | Low-Volatility Regime | |
| STIt−1 | 0.0120 | 0.00613 | −0.0878 | −0.0152 |
| (0.0652) | (0.0577) | (0.0804) | (0.0571) | |
| SSEt | 0.218 *** | 0.0570 * | 0.262 *** | 0.0395 |
| (0.0639) | (0.0342) | (0.0503) | (0.0262) | |
| SSEt−1 | −0.0642 | 0.00917 | 0.0001 | 0.0089 |
| (0.0488) | (0.0262) | (0.052) | (0.025) | |
| SPX | 0.450 *** | 0.447 *** | 0.443 *** | 0.496 *** |
| (0.0473) | (0.0452) | (0.0629) | (0.0401) | |
| SPXt−1 | 0.0591 | 0.223 *** | 0.0605 | 0.304 *** |
| (0.0560) | (0.0522) | (0.0764) | (0.0520) | |
| Coronavirus | −0.002 (0.002) | |||
| With FDI flow added as non-switching variable | ||||
| Full sample | Pre-COVID Sample | |||
| High-Volatility Regime | Low-Volatility Regime | High-Volatility Regime | Low-Volatility Regime | |
| STIt−1 | 0.0152 | 0.0001 | −0.0853 | −0.0182 |
| (0.065) | (0.059) | (0.0808) | (0.0569) | |
| SSEt | 0.218 *** | 0.0534 * | 0.261 *** | 0.0386 |
| (0.0598) | (0.0322) | (0.0500) | (0.0259) | |
| SSEt−1 | −0.0654 | 0.0104 | −0.000958 | 0.00863 |
| (0.0482) | (0.0260) | (0.0520) | (0.0250) | |
| SPX | 0.448 *** | 0.452 *** | 0.443 *** | 0.499 *** |
| (0.0458) | (0.0435) | (0.0626) | (0.0397) | |
| SPXt−1 | 0.0598 | 0.228 *** | 0.0612 | 0.308 *** |
| (0.0548) | (0.0515) | (0.0766) | (0.0515) | |
| FDI Flow | 0.123 (0.152) | 0.106 (0.151) | ||
| Coronavirus | −0.002 (0.002) | |||
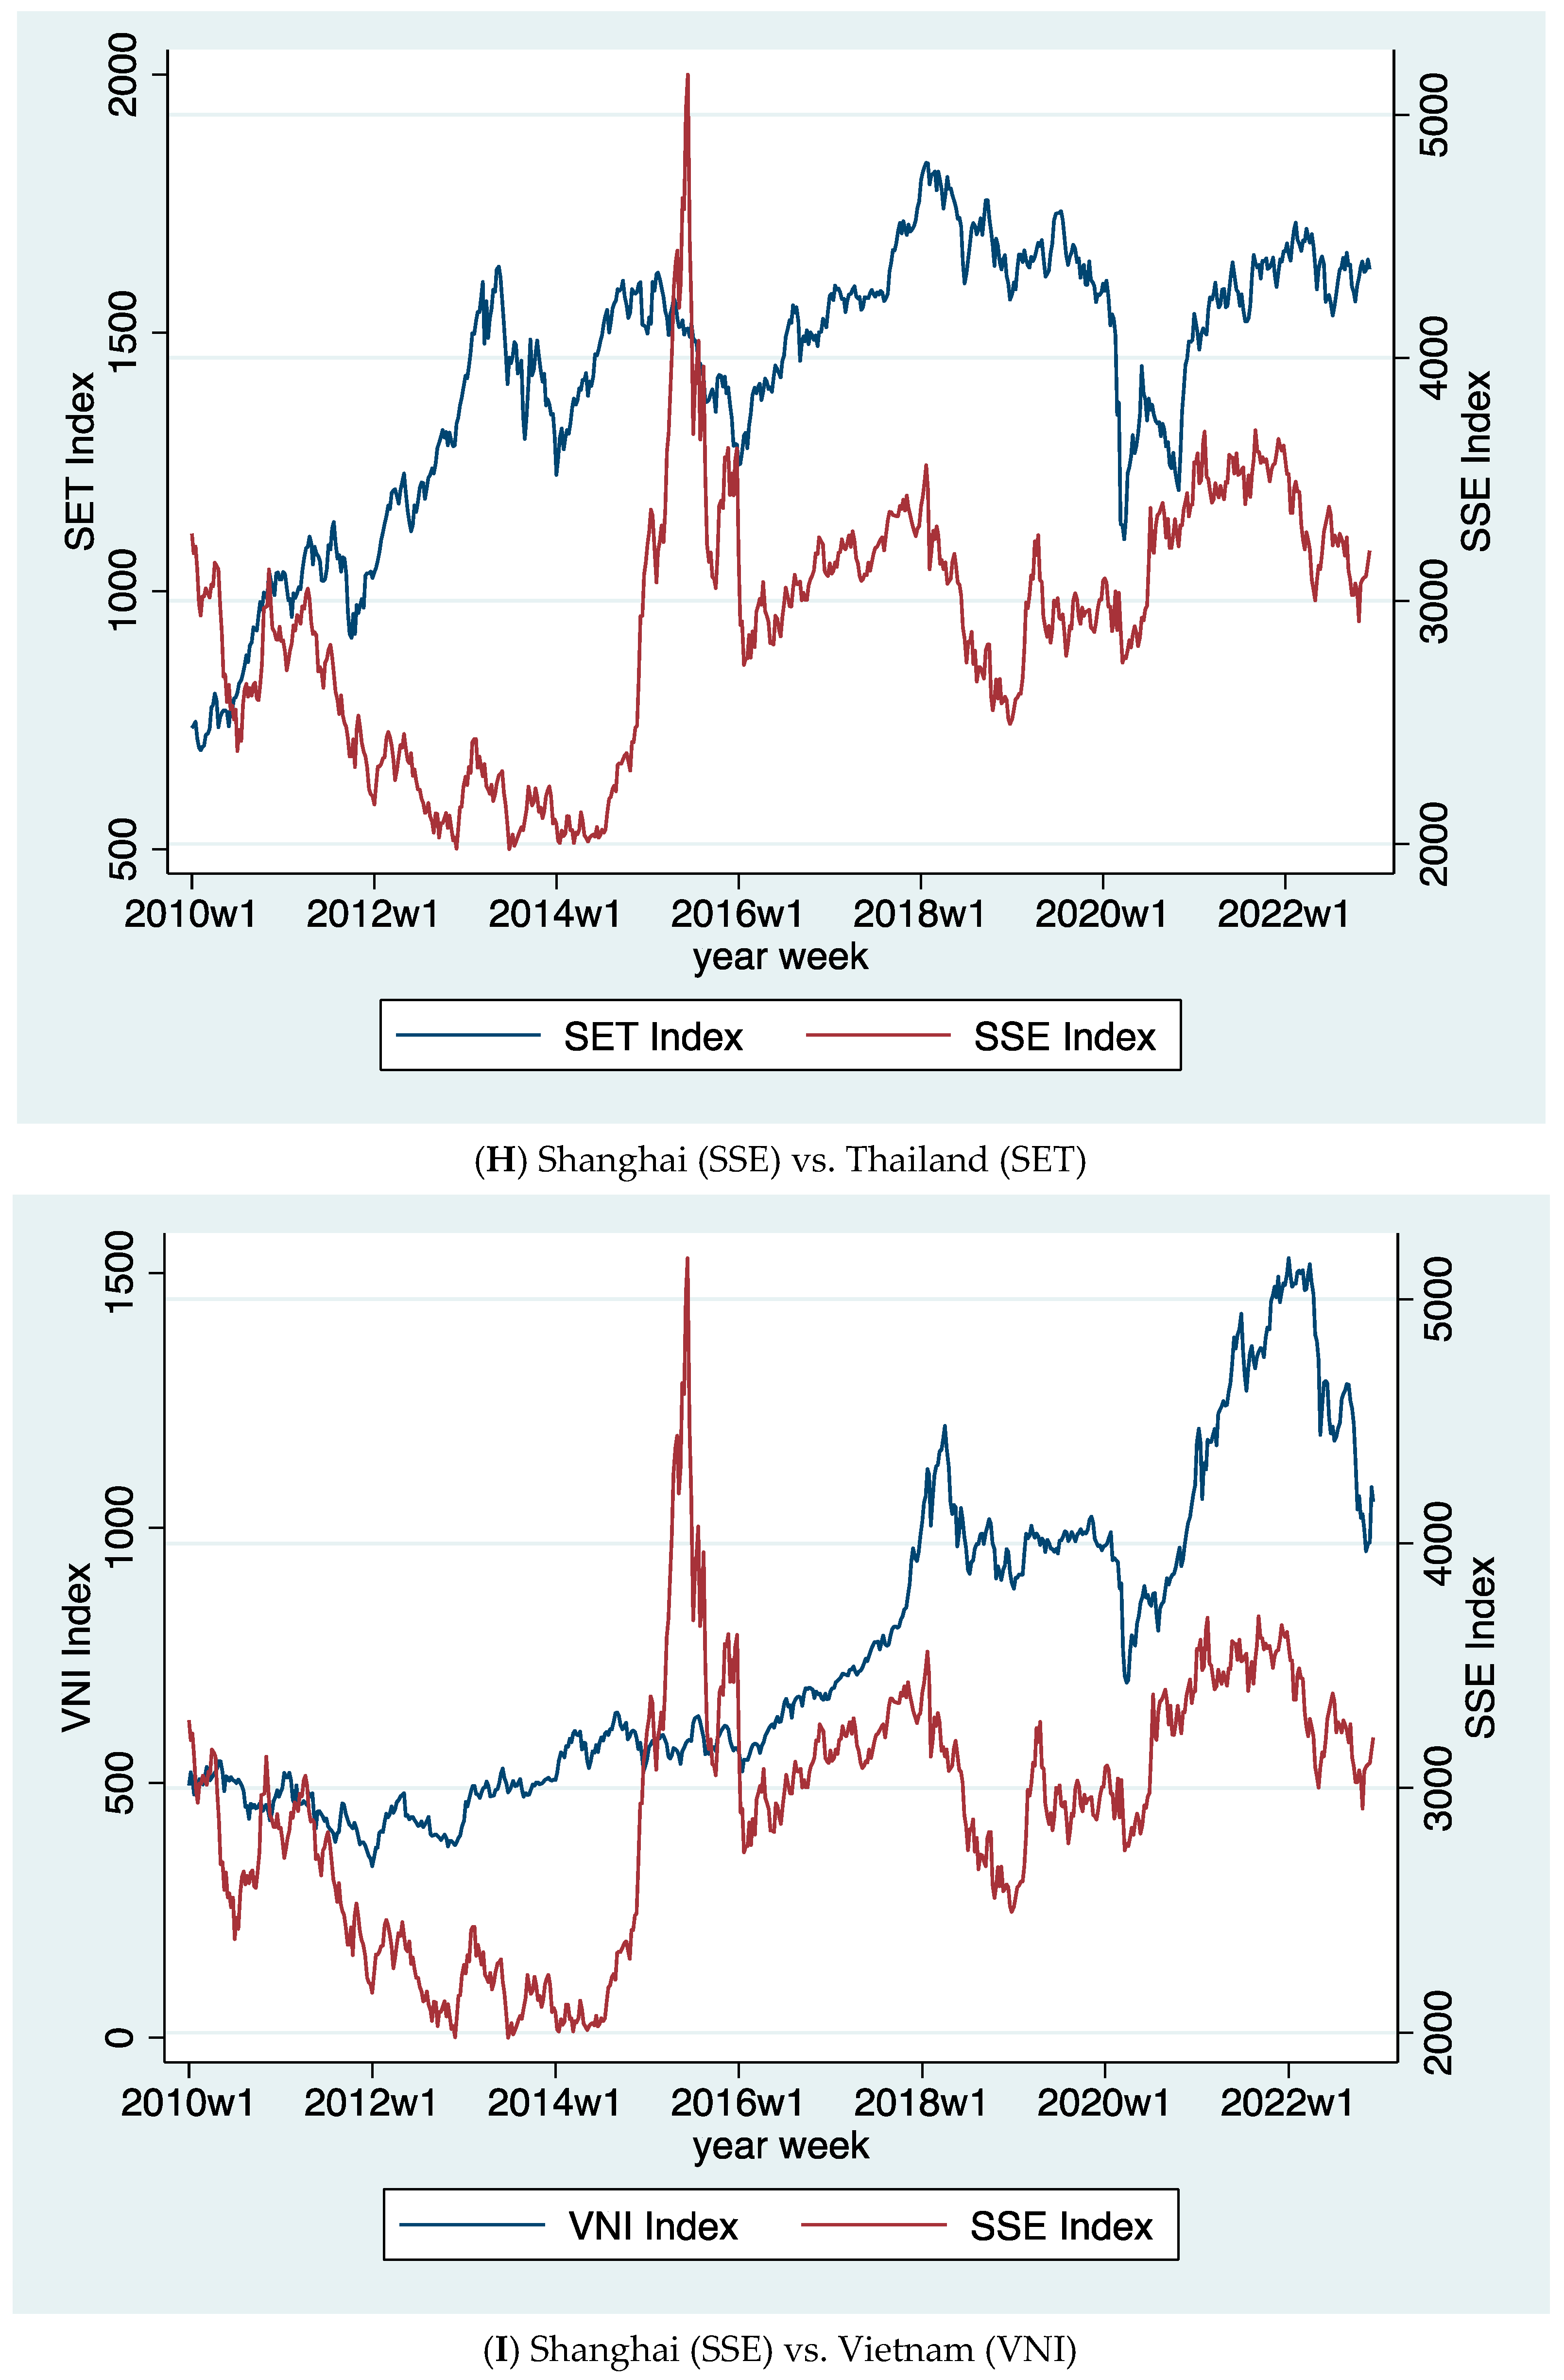
| H. Shanghai (SSE) vs. Thailand (SET) | ||||
 | ||||
| Full sample | Pre-COVID Sample | |||
| High-Volatility Regime | Low-Volatility Regime | High-Volatility Regime | Low-Volatility Regime | |
| SETt−1 | −0.206 *** | 0.0456 | −0.147 * | −0.001 |
| (0.0726) | (0.0461) | (0.0826) | (0.0522) | |
| SSEt | 0.0934 | 0.0772 *** | 0.0794 | 0.0608 ** |
| (0.0872) | (0.0232) | (0.0952) | (0.0248) | |
| SSEt−1 | −0.0113 | −0.0403 * | 0.129 | −0.0364 |
| (0.0866) | (0.0233) | (0.0945) | (0.0247) | |
| SPX | 0.496 *** | 0.314 *** | 0.400 *** | 0.377 *** |
| (0.0748) | (0.0326) | (0.102) | (0.0418) | |
| SPXt−1 | 0.209 ** | 0.0974 *** | 0.103 | 0.141 *** |
| (0.0813) | (0.0356) | (0.108) | (0.0464) | |
| Coronavirus | −0.001 (0.001) | |||
| With FDI flow added as non-switching variable | ||||
| Full sample | Pre-COVID Sample | |||
| High-Volatility Regime | Low-Volatility Regime | High-Volatility Regime | Low-Volatility Regime | |
| SETt−1 | −0.206 *** | 0.0455 | −0.147 * | −0.001 |
| (0.0727) | (0.0461) | (0.0823) | (0.052) | |
| SSEt | 0.0938 | 0.0771 *** | 0.0786 | 0.0616 ** |
| (0.0875) | (0.0232) | (0.0946) | (0.0249) | |
| SSEt−1 | −0.0110 | −0.0403 * | 0.128 | −0.0358 |
| (0.0868) | (0.0233) | (0.0939) | (0.0248) | |
| SPX | 0.496 *** | 0.315 *** | 0.400 *** | 0.374 *** |
| (0.0748) | (0.0329) | (0.101) | (0.0421) | |
| SPXt−1 | 0.209 ** | 0.0976 *** | 0.103 | 0.139 *** |
| (0.0814) | (0.0357) | (0.108) | (0.0465) | |
| FDI Flow | 0.138 (2.02) | 1.51 (2.48) | ||
| Coronavirus | −0.001 (0.002) | |||
| I. Shanghai (SSE) vs. Vietnam (VNI) | ||||
 | ||||
| Full sample | Pre-COVID Sample | |||
| High-Volatility Regime | Low-Volatility Regime | High-Volatility Regime | Low-Volatility Regime | |
| VNIt−1 | −0.0424 | 0.123 * | −0.0208 | 0.100 |
| (0.0647) | (0.0706) | (0.0825) | (0.0795) | |
| SSEt | 0.111 | 0.116 ** | 0.0590 | 0.167 *** |
| (0.0740) | (0.0482) | (0.0964) | (0.0559) | |
| SSEt−1 | −0.0555 | 0.0482 | −0.133 | 0.0784 |
| (0.0780) | (0.0467) | (0.108) | (0.0529) | |
| SPX | 0.475 *** | 0.111 * | 0.540 *** | 0.0371 |
| (0.0941) | (0.0588) | (0.181) | (0.0679) | |
| SPXt−1 | 0.262 *** | 0.161 *** | 0.347 ** | 0.0446 |
| (0.0909) | (0.0525) | (0.163) | (0.0647) | |
| Coronavirus | 0.002 (0.002) | |||
| With FDI flow added as non-switching variable | ||||
| Full sample | Pre-COVID Sample | |||
| High-Volatility Regime | Low-Volatility Regime | High-Volatility Regime | Low-Volatility Regime | |
| VNIt−1 | −0.0419 | 0.124 * | −0.020 | 0.101 |
| (0.0645) | (0.0708) | (0.08) | (0.0814) | |
| SSEt | 0.112 | 0.116 ** | 0.0635 | 0.164 *** |
| (0.0736) | (0.0478) | (0.0979) | (0.0587) | |
| SSEt−1 | −0.0550 | 0.0483 | −0.128 | 0.0764 |
| (0.0773) | (0.0462) | (0.110) | (0.0546) | |
| SPX | 0.473 *** | 0.112 * | 0.532 *** | 0.0343 |
| (0.0935) | (0.0588) | (0.188) | (0.0687) | |
| SPXt−1 | 0.262 *** | 0.161 *** | 0.340 ** | 0.0456 |
| (0.0901) | (0.0523) | (0.167) | (0.0662) | |
| FDI Flow | −0.388 (1.37) | −1.25 (1.62) | ||
| Coronavirus | 0.003 (0.002) | |||
Disclaimer/Publisher’s Note: The statements, opinions and data contained in all publications are solely those of the individual author(s) and contributor(s) and not of MDPI and/or the editor(s). MDPI and/or the editor(s) disclaim responsibility for any injury to people or property resulting from any ideas, methods, instructions or products referred to in the content. |
© 2025 by the authors. Licensee MDPI, Basel, Switzerland. This article is an open access article distributed under the terms and conditions of the Creative Commons Attribution (CC BY) license (https://creativecommons.org/licenses/by/4.0/).
Share and Cite
Burdekin, R.C.K.; Tao, R. Chinese vs. US Stock Market Transmission to Australasia, Hong Kong, and the ASEAN Group. J. Risk Financial Manag. 2025, 18, 162. https://doi.org/10.3390/jrfm18030162
Burdekin RCK, Tao R. Chinese vs. US Stock Market Transmission to Australasia, Hong Kong, and the ASEAN Group. Journal of Risk and Financial Management. 2025; 18(3):162. https://doi.org/10.3390/jrfm18030162
Chicago/Turabian StyleBurdekin, Richard C. K., and Ran Tao. 2025. "Chinese vs. US Stock Market Transmission to Australasia, Hong Kong, and the ASEAN Group" Journal of Risk and Financial Management 18, no. 3: 162. https://doi.org/10.3390/jrfm18030162
APA StyleBurdekin, R. C. K., & Tao, R. (2025). Chinese vs. US Stock Market Transmission to Australasia, Hong Kong, and the ASEAN Group. Journal of Risk and Financial Management, 18(3), 162. https://doi.org/10.3390/jrfm18030162