Article

Heterogeneous Links Between Corruption and Innovation in a Global Economy

by
Roberto Iorio
1,* and
Maria Luigia Segnana
2,*
1
Department of Political and Social Studies, University of Salerno, 84084 Fisciano, Italy
2
Department of Economics and Management, University of Trento, 38122 Trento, Italy
*
Authors to whom correspondence should be addressed.
J. Risk Financial Manag. 2025, 18(3), 164; https://doi.org/10.3390/jrfm18030164
Submission received: 28 November 2024 / Revised: 12 March 2025 / Accepted: 13 March 2025 / Published: 19 March 2025
(This article belongs to the Special Issue Globalization and Economic Integration)

Abstract

:
This study examines the impact of corruption on business innovation from a comparative perspective and shows that this relationship is inherently heterogeneous across firms and countries. It addresses two main research questions: (i) Does corruption facilitate or hinder innovation in the countries studied? (ii) To what extent is the relationship between corruption and innovation mediated/shaped by countries’ institutional configurations and firm characteristics (foreign and domestic ownership)? We analyze data from the fifth and sixth waves (2012–2016 and 2018–2019) of the EBRD’s World Bank Business Environment and Enterprise Performance Survey (BEEPS), using a balanced panel of 3584 establishments in 22 Eastern European and Central Asian economies. The results provide two key insights into the relationship between corruption and innovation. First, the institutional setting plays a crucial role in shaping both the strength and the direction of this relationship, for example, when comparing EU and non-EU countries. Second, the impact of corruption at the firm level varies depending on the ownership structure: the ‘greasing’ effect is particularly relevant for foreign firms operating in weak institutional environments, but appears to be ineffective—if not ‘sanding’—for foreign firms in contexts with stronger anti-corruption controls.

1. Introduction

This paper explores the impact of corruption-related issues on innovation. Globalization has driven international business researchers to examine the causes, characteristics, models, and theories of corruption, as well as its relationship with legal frameworks and firm-level outcomes. Given the challenges of the global economy, it is crucial to conceptualize corruption1 as a source of economic risk and uncertainty.
Corruption is an international concern as it creates uneven competition, potentially hindering or facilitating the implementation of global economic strategies. Its complexity is further heightened by digitalization, which can serve both as a deterrent to corruption and as a catalyst for new risks.
The literature presents two opposing perspectives on corruption’s impact. Scholars debate whether corruption “greases the wheels”, fostering economic activity, or “sands them down”, impeding growth and efficiency:
At the macro level, a limited number of empirical studies suggest that corruption can stimulate economic growth, particularly in environments with weak or ineffective institutions. At the micro (firm) level, a growing body of research on firm performance has yielded mixed, ambiguous, and sometimes contradictory findings.2
Overall, the relationship between corruption and the likelihood of innovation, particularly at the firm level and in poor and emerging countries, has not been fully explored. Despite the consensus on the negative country-level implications of corruption, its consequences for firms are less understood. In emerging markets, corruption remains a ubiquitous feature of conducting business (Cuervo-Cazurra, 2016). Additionally, a number of theoretical frameworks from different research streams have been applied in the literature3; nevertheless, the majority of studies did not expressly state which theoretical framework the authors had employed. To tackle these concerns, we are required to look into how corruption affects a company’s ability to innovate.
A number of puzzles have been identified in the literature and in addressing these puzzles, we investigate the effect of corruption on firms’ innovation from a comparative perspective by showing that the link is surely not uniform across firms and countries (Iorio & Segnana, 2021) and that in emerging markets, corruption remains a ubiquitous feature of conducting business (Cuervo-Cazurra, 2006). Two main research questions are addressed in the present study: (a) Has corruption boosted or harmed the firm innovative activities in countries under inspection? (b) To what extent is the link between corruption and innovation mediated/shaped by the countries’ institutional configurations and business characteristics (foreign and domestic ownership)?
Corruption continues to be a major challenge for innovation in Eastern Europe and Central Asia despite institutional reforms and global integration. Little progress was achieved in these areas to reduce corruption, and non-market strategies so that bribery and non-market strategies remain common, creating regional disparities in institutional quality, innovation performance, and tolerance for non-market strategies, including corrupt activities (Krammer, 2009). In many developing countries, innovators face pressure from corruption, either as victims or targets of rent-seeking (Ayyagari et al., 2014). This stifles innovation, underscoring the need for stronger anti-corruption efforts and institutional improvements to support a fair environment for innovation.
Given their relatively similar historical backgrounds and large variations in institutional quality, pervasiveness of corruption, and innovation performance, these countries are undoubtedly the ideal setting for business research (Meyer & Peng, 2016) and testing the relationship between corruption and innovation. Additionally, comparing the nations that have joined the EU can provide a helpful comparison of how, over time, and in different countries, due to various institutional contexts, the relationship between innovation and corruption varies, in the presence of new European rules and incentives.
The rest of the paper is organized as follows. Section 2 picks up some theoretical suggestions on macro and micro mechanisms for coping with corruption and bribery at the country and firm level and identifies the main hypotheses. Section 3 explores the balanced panel that we utilize, and the main variables. Section 4 looks at data in the quest for an explanation. Section 5 introduces the empirical strategy and examines the main empirical findings. Section 6 concludes and discusses the policy implications.

2. Literature Review

Comprehensive reviews of the literature are available from various perspectives; therefore, we will focus here on some suggestions that emerge from these different viewpoints. We have picked some theoretical suggestions deriving from institutional and agency theory standpoints. They both offer macro and micro mechanisms for coping with corruption and bribery.
The institutional and new-institutional theories address legal and regulatory frameworks, government statutes and rules, and courts as establishments of social, political, and legal norms that influence behavior and decision-making. The institutional framework affects firms’ strategies and grants them legitimacy (North, 1990), addressing the role of formal and informal institutional factors in shaping firms’ activities4. Even the micro-perspective offered by new comparative economics can be considered as part of new institutional economics (Dallago & Casagrande, 2021).
Firms’ activities are strongly influenced by the interactions between institutions (formal and informal) and firms, under legal and social pressures, to accept the standards, values, and beliefs of their surroundings. Analyzed through the lens of transaction cost economics, corruption can be seen from a cost/benefit perspective; that is, it will discourage (encourage) firms and investors when the costs of the potential deal exceed (fall behind) its benefits (Rose-Ackerman, 2008). Corruption can either “sand” or “grease” the wheels of business. When it “greases the wheels”, it enhances the performance and productivity of firms, representing a faster and less uncertain means to deal with bureaucratic obstacles. Conversely, corruption can “sand the wheels” by hindering firms’ ordinary and innovative activities by imposing supplementary costs, thereby amplifying uncertainty.
Institutional and neo-institutional theories present questions regarding the ways in which a corrupt, formal, and informal institutional environment affects organizational legitimacy, values, corporate social responsibility, profitability, and strategic decision-making (Keig et al., 2015; Pantzalis et al., 2008). The impact on innovation is discussed by Krammer (2019) by examining how bribery can sometimes act as a workaround for innovators facing bureaucratic red tape, lack of political or familial connections, and uncertain political environments in emerging markets. Similarly, Krammer and Jimenez (2020) emphasize the significance of political ties for firms engaged in innovation, reinforcing the idea that political connections can shape business strategies and innovation outcomes. Even corporate innovations in the USA are affected by corruption that negatively shifts the entire distribution of innovation (Ellis et al., 2020).
From an international business viewpoint, institutional approaches suggest that the institutional environment of the host and home countries matters. The host country, which controls corruption and upholds the rule of law, has a significant influence on the firms’ mode-of-entry decision (Rodriguez et al., 2005), partner selection criteria decisions about international joint ventures (Roy & Oliver, 2009), the boards of the joint ventures (Hearn, 2015), the selection of national managers (Muellner et al., 2017), and the practice of bribery in cross-border transactions (Baughn et al., 2010; Yi et al., 2018). The impact is also identified on a firm’s export performance (Krammer et al., 2018), its earnings management (Bao & Lewellyn, 2017), and foreign direct investment location, all affected by the institutional environment of the host and home countries, of which the extent of corruption is one factor.
According to these theoretical suggestions, the quality of institutions defines the level of corruption in the host and home country, which influences the nation’s and firms’ behavior. The suggestion is that by improving the quality of institutions, the adverse effects of corruption can be minimized in international business.
Agency theory has treated the agency problem in international business, focusing on managers diverting corporate resources to maximize private benefits at the cost of shareholders because incentives are misaligned. Political institutions and the degree of corruption influencing business risk-taking decisions are related to this behavior (Boubakri et al., 2013). This clarifies the possible conflict that can arise in situations where the company’s foreign subsidiaries provide bribes because of their political links with the company’s headquarters (Yi et al., 2018).
In the presence of competing interests, agency theory postulates that manager-controlled businesses bribe more than shareholder-controlled businesses; empirical support for this idea is provided (Chen et al., 2015). Bribery and corrupt business practices have also been linked to board features, including management or shareholder-controlled enterprises, and show that bribing by firms varies based on ownership structure.
To date, the literature on the effects of foreign firms on corruptive practices in host instances has produced contrasting conclusions; the literature on the effects of economies is inconclusive. For corruption on FDI, there is a negative (Cuervo-Cazurra, 2006; Javorcik & Wei, 2009) and a positive relationship (Barassi & Zhou, 2012) between corruption and FDI. Existing studies are divided between those that argue that multinational enterprises can bring about a reduction in bribery and those that argue the firms operating in international markets adapt to local conditions, norms, and practices, with foreign-owned firms paying larger bribes compared to domestically owned firms (Ashyrov & Masso, 2020). By studying the adjustments of multinational enterprises to corrupt environments, local market adaptation seems to prevail after entry (Couttenier & Toubal, 2017), while in other cases, the adjustment mechanism that originates in the previous investment in a corrupt system prevails before entry (Thede & Karpaty, 2023). Thus, past corruption experiences drive competitive advantage. In this last case, corruption appears to play a “sanding or greasing the wheels” role, which depends on the timing and the enterprise’s objectives. This is the case, for instance, when considering different firms’ objectives: when corruption is associated with export decisions (Ha et al., 2021) in developing markets where corruption has been affirmed as a common issue and even an accepted norm (Nguyen et al., 2016), a positive impact emerges, particularly in the case of powerful, large-sized firms or those facing no institutional constraints. However, the impact is negative on the likelihood of innovation (Lee et al., 2020).
When applying these suggestions to the relationship between corruption and innovation, a challenge arises from the two conflicting perspectives on corruption.
On the one hand, innovation is impeded by corruption. An example is offered by emerging and transitional countries: corruption at the firm level, in the manufacturing industry, and in regions with the worst governance or those that are more corrupt, has a significant negative impact on innovation (Lee et al., 2020). More contract-dependent firms are characterized by lower investments in R&D in Central and Eastern Europe (Athanasouli & Goujard, 2015), and the effects on innovation vary significantly across regions (Bukari & Atta Anaman, 2021).
But in the USA too, increased corruption seems to reduce innovation output—both on average and for the most innovative firms (Ellis et al., 2020).
On the other hand, as bribery makes it possible for more businesses to get beyond bureaucratic red tape and legislative barriers and speed up transactions, corruption can actually help a company innovate more quickly rather than stand in the way of it. This is the case in 30 emerging markets examined by Krammer (2019) where bribery helps product innovations or in some country cases such as India and Vietnam (Sharma & Mitra, 2015; Nguyen et al., 2016).

The Main Hypotheses

Theoretical considerations suggest that corruption can act as both a ‘sanding’ and ‘greasing’ mechanism for innovation. However, empirical evidence does not clarify the conditions under which corruption hinders (‘sanding’) or facilitates (‘greasing’) innovation, as well as the likely heterogeneous effects at different levels of analysis. This leads us to develop two hypotheses connecting innovation to institutional settings and specific business characteristics when this heterogeneity is taken into account, with hypotheses subject to empirical testing with multivariate analysis. An analysis devoted to identifying the impact of corruption in the presence of different institutional settings at a country level (in our case, the control of corruption) and different business characteristics at a firm level (in our case, different ownerships) points to the coexistence of both sanding and greasing effects.
Hypothesis 1.
Corruption has a heterogeneous impact on innovation across countries. The relationship between corruption and innovation at the firm level is significantly influenced by country institutional control.
Hypothesis 2.
Corruption has a heterogeneous impact on innovation across firms, when the different characteristics of firms are taken into account. When cross-border transactions are considered, firm attributes can either strengthen or weaken the link between corruption and innovation.
The first hypothesis suggests that corruption can be positively or negatively associated with firms’ innovative activities in countries with very different institutional controls over corruption. The second hypothesis suggests that in the presence of specific firm characteristics when home and foreign institutional environments come into play in the presence of foreign and domestic ownership and cross-border transactions, the positive (negative) link could be either reinforced or undermined. So, corruption’s role in innovation is context-dependent, shaped by both institutional settings at a country level and firm-specific factors at a company level.
The empirical regularities in Section 4 and the multivariate analysis in Section 5 reveal the coexistence of two contrasting average effects: an overall sanding effect at a country level, where higher corruption correlates with lower innovation, and a greasing effect at a firm level, where more corrupt firms tend to be more innovative. However, if we examine the average greasing effects, the results reveal heterogeneity at a firm level (across firms).
First, in terms of the institutional environment, the greasing effect is evident in contexts with weak corruption control, where corruption facilitates innovation by helping firms bypass bureaucratic inefficiencies. However, in stronger institutional environments, corruption becomes ineffective and does not contribute to innovative activities. Second, the characteristics of firms—specifically, foreign versus domestically controlled ownership—further shape this relationship. In weak institutional environments, the greasing effect is more pronounced among foreign firms than domestic ones. To be innovative, foreign firms must adapt to the host country’s conditions, including its corrupt practices. Conversely, in environments with strong corruption control, corruption impedes innovation: it is unhelpful for domestic firms and even more detrimental to foreign firms.
Ultimately, the impact of corruption on innovation is context-dependent, varying across countries and firms. Whether corruption is a facilitator or a hindrance to innovation depends on the institutional framework and the degree of adaptation required by firms operating within it.

3. Data and Main Variables

Our source of data is the EBRD’s World Bank Business Environment and Performance Survey (BEEPS), an initiative jointly launched by The European Bank for Reconstruction and Development and the World Bank group5. We used data from 22 nations, all emerging markets, including more developed Central and Eastern European nations, transition economies from the Balkans and Central Asia, as well as Turkey. We used firm-level data on innovation and corruption from this survey. The main benefit of utilizing BEEPS is that data are gathered in a methodical manner using standardized questionnaires and stratified sample methodologies, which provide cross-country comparability and national representativeness. We combined the surveys V and VI, which covered the years 2012–2016 and 2018–2019, respectively, using each firm’s identification number. This produced a balanced panel with 3584 establishments that belonged to registered enterprises.
The UNCTADSTAT categorizes seven countries (mainly from Asia and transcontinental nations like Turkey, Georgia, and Kazakhstan) as developing and fifteen countries (mainly European, including Russia) as developed. Six of the developed countries—Russia, Latvia, Lithuania, Estonia, Slovenia, and Poland—are classified as high-income by the World Bank. Some of these countries have undergone significant transitions from socialist to market economies, especially as part of their integration into the European Union.
The Appendix A’s Table A1 lists companies by the nation that is being examined. The surveys analyze companies by country, focusing on establishments, which are individual units where business activities occur, such as service provision or industrial processes. Firms can consist of one or more establishments; about 10% of the cases of these surveys involve establishments that are part of larger firms. Even though the data are surveyed at the establishment level, we nevertheless refer to firms. The study also incorporates control over corruption data from the World Bank’s Worldwide Governance Indicators, one of the six aspects of governance from the World Bank’s Worldwide Governance Indicators, in the Appendix A’s Table A3 lists each country’s values for the control of corruption in 2013 and 2018.

Main Variables

The relationship between corruption and innovation involves two key variables essential to our analysis.
Innovations are commonly associated with major changes to a firm’s products, services, and processes, typically building upon new knowledge. We consider product innovation. Data on new product introduction are obtained from BEEPS using the answers obtained from the question, “In the last three years, has this establishment introduced new products or services?” This variable (named Innoprod in the following analyses) is binary, as it assumes a value of 1 if a new product or service has been introduced; it will be 0 otherwise. The introduction of new products represents a central aspect of a firm’s strategy and not only enables organizations to bring new products to the market but also challenges organizations to renew their technological capabilities (Krammer, 2019; Wang & Chen, 2018). It provides avenues to diversify and adapt to evolving markets and determines their subsequent survival and success.
The other crucial variable is corruption. The measure of corruption records bribes at a firm level. Our bribery metric is based on the question, “On average, what percentage of total annual sales, or estimated total annual value, is paid by firms such as this one, to public officials in the form of informal payments or gifts?”. Firm corruption is a dichotomous variable that assumes values of 1 and 0 depending on whether the firm claims it has paid anything or nothing and has made an informal payment of any amount.
The following analysis shows that this dichotomous variable has a considerable impact on innovation, yet variations in a bribe’s value have no discernible impact on the likelihood of innovation: what matters is not the amount that firms pay but whether they pay bribes or not.
We further hypothesize that the relationship between corruption and innovation is influenced by the institutional context in which the firm works. As a relevant measure of the quality of the institutional context, we consider the control of corruption one of the World Bank Worldwide Governance Indicators (we call it Controlcorr), and we suppose that the higher the level of the country’s control of corruption, the lower the impact of firm corruption on innovation. To test this hypothesis, an interaction is introduced between corruption at the firm level and the control of corruption (FirmCorruption*Controlcorr).
In the preliminary analysis with the purpose of clarifying this link, we categorize countries into three groups based on the descending level of control of corruption.
More precisely, we consider the level of control of corruption in 2013 and 2018, and we classify countries according to the average between those two values:
Country Group 1 includes the seven countries with the highest average value of Control of Corruption (Estonia, Slovenia, Poland, Georgia, Lithuania, Latvia, and Croatia), Country Group 2 includes eight countries with an intermediate value (Montenegro, Turkey, Belarus, Serbia, Bosnia and Herzegovina, Mongolia, Kosovo, Albania) and Country Group 3 includes the seven countries with the lowest average value (Kazakhstan, Moldova, Russia, Kyrgyzstan, Ukraine, Uzbekistan, and Tajikistan)6.
We are also interested in comparing the impact of corruption on innovation between domestic and foreign firms. (Foreign firms are owned at least by 10% by private foreign individuals, companies or organization, according to the FDI international accounts standards; the firms which are not foreign are considered as domestic firms). Therefore, we have created the dummy variable Foreign, having a value of 1 for foreign firms and 0 otherwise; we then interact this variable with FirmCorruption (FirmCorruption*Foreign).
In order to lessen the possibility of confounding effects and to capture additional company characteristics that might be connected to innovation and corruption, control variables will be incorporated in the multivariate analysis7. We have taken into account the basic innovation input, research and development (R&D), and other elements of the company’s knowledge capital, such as staff training (Training) and ownership of foreign technology (Fortech).
The market’s competitive landscape, including the primary market’s competitor count, is also vital for evaluating product innovation: the number of competitors is a key control variable affecting product innovation according to how many companies reported the number of competitors in their primary market—with one option being “Too many to count”8. We have categorized competition into three levels: Competition_1 (0–5 competitors, the benchmark), Competition_2 (more than 5 countable competitors9), and Competition_3 (uncountable competitors).
In the first part of the empirical analysis, the firm’s ownership (Foreign) is included among the control variables. In addition, we include a dummy variable on the firm’s presence in international markets (Export), the size of the company (Size), expressed as the log of the number of employees, sectorial variables, and a dummy variable for waves10.

4. Institutional Quality, Corruption, and Innovation: Some Stylized Facts

As reported in the previous section, countries are organized into three groups according to their level of control of corruption. Table 1 reports the number of countries and firms in the sample for each group of countries.
For each group of countries, the corruption control averages11 are reported in Table 2, together with the percentage of firms paying bribes and the percentage of innovative firms. This table highlights the negative relationship between corruption and innovation across different country groups. As institutional quality—measured by the corruption control—declines from Group 1 to Group 3, corruption becomes more prevalent, and firms’ innovative performance diminishes.
Table 3 below highlights the link between innovation and corruption by comparing innovative firms that engage in bribery with those that do not. This difference may indicate the impact of corruption at the firm level, both within specific groups and across the entire sample.
Although there is a positive correlation between corruption and innovation, its strength varies significantly across the three country groups. In Group 1, where institutional quality is highest, firms that do not pay bribes are almost as innovative as those that do. However, in Group 2—and even more so in Group 3, where institutional quality deteriorates—the innovation gap between firms that pay bribes and those that do not widen. This suggests that as institutional quality declines, the effect of corruption on innovation shifts from almost neutral to positive, with bribery becoming an increasingly important driver of innovation in weaker institutional environments.
The link between corruption and innovation is possibly different when we disentangle domestic and foreign firms. The distinction between domestic and foreign firms is based on ownership: firms with at least 10% foreign ownership are classified as foreign, while all others are considered domestic. Table 4 indicates that foreign firms are most prevalent in Group 1, where corrupt activities are less common compared to domestic firms. In contrast, Groups 2 and 3 show a lower presence of foreign firms, which correlates with more frequent corrupt practices. Additionally, within each group, foreign firms exhibit significantly higher levels of innovative activity than domestic firms.
By looking at the “effect” of corruption on innovation for both domestic and foreign firms (Table 5), the impact of corruption on innovation varies significantly depending on the group of countries being examined. While the overall effect appears to be positive and similar for both domestic and foreign firms, distinct patterns emerge within different groups. In Group 1, corruption has a negligible effect on innovation for domestic firms, but a strongly negative effect for foreign firms. This suggests that the foreign firms paying a bribe do not include any innovative firms. In Group 2, corruption has a positive effect on innovation for both domestic and foreign firms, with similar magnitudes. This indicates that in these countries, bribery may facilitate innovation in a comparable way for both types of firms. In Group 3 the positive effect of corruption on innovation is stronger for foreign firms than for domestic ones. This implies that, in these countries, foreign firms may benefit more from corruption in terms of innovation, possibly by gaining access to key resources or overcoming bureaucratic hurdles.
These findings highlight the complex relationship between corruption and innovation, suggesting that, while corruption might sometimes serve as a “grease” for innovation, its impact varies based on the firm type and the country’s institutional context.
Some empirical regularities clearly emerge, related to countries and firms under inspection and in search of an explanation. First, as Table 2 and Table 3 showed, in our sample the institutional settings matter for the link between corruption and innovation. At the firm level (within country) there is a growing positive link (greasing) when the institutional corruption control is very weak so that corruption is a sort of necessary vehicle for innovations.
Second, as Table 4 and Table 5 show, corruption could be helpful for innovative activities not only for domestic but also for foreign firms. When the overall greasing effect at the firm level is distinguished between firms with a significant share of foreign ownership and domestically controlled firms, the intensity of the link is magnified when corruption control is weak.

5. Estimation Strategy

In the multivariate estimation, we use a panel data model with random effects, which for our case is appropriate for only two time periods. The fixed effects model is less reliable with limited time periods, as noted by Hill et al. (2020). Additionally, when comparing domestic and foreign firms, the fixed effects model does not capture much within-firm variability, as few firms in time change their status from domestic to foreign. Thus, a random effects model is a better fit in this scenario.
As the dependent variable product innovation (Innoprod), is binary, probit is an appropriate model. The interaction effect between Firm corruption and the control of corruption is estimated through the following Model (1):
Innoprodi,t = Φ {α0 + β1FirmCorruptioni,t + β2Controlcorri + β3FirmCorruptioni,t × Controlcorri + β6wavei + + λs + ui + vit}
where i and t are, respectively, firms and time. Φ denotes the cumulative standard normal distribution; Innoprod stands for the binary variable, if a product innovation has been introduced or not in the past 3 years; FirmCorruption is the binary variable with value 1 if the firm paid a bribe, Controlcorr is the control of corruption of the country where the firm is located (we adopt the value in 2013 for the first wave and the value in 2018 for the second wave of our dataset), X is the matrix of control variables (details in Section 3) with their vector of coefficients γ; wave is the time dummy variable (observation from survey V or VI); λs are sector dummies; the error term has an individual-specific time-invariant component (ui) and an idiosyncratic component (vit).
The interaction effect between Firm corruption and the kind of firm (domestic or foreign) is estimated through the following Model (2a):
Innoprodi,t = Φ {α0 + β1FirmCorruptioni,t + β2Controlcorri + β3FirmCorruptioni,t × Controlcorri + β4Foreign i,t + β5FirmCorruptioni,t × Foreigni,t + β6wavei + + λs + ui + vit}
Foreigni,t is the binary variable with value 1 if the firm has at least 10% of foreign property.
This model is estimated for each of the three nation groups independently as well as for the entire dataset. The modest variability and low number of observations implies that the interaction effect of FirmCorruption on innovation cannot be estimated for foreign firms in CountryGroup 1. Conversely, a linear probability model can be estimated for each country group. This is the rationale behind using the model known as (2b) for group comparisons.
Innoprodi,t = α0 + β1FirmCorruptioni,t + β2Controlcorri + β3FirmCorruptioni,t × Controlcorri + β4Foreigni,t + β5FirmCorruptioni,t × Foreigni,t + β6wavei+ + λs + ui + vit
In non-linear models, like probit, it is impossible to determine with accuracy the sign and significance of interactions by simply looking at the sign, entity, and significance of their coefficients: the marginal effects of each variable at different levels need to be estimated separately (Ai & Norton, 2003). Therefore, estimates are made up of the marginal effects of FirmCorruption on Innoprod at different levels of Controlcorr (Model 1) and of Foreign (Model 2a). In contrast, the coefficients in the linear probability model directly represent the size, sign, and significance of the marginal effects. The next section displays each marginal effect, along with its confidence interval, for the linear probability model and the probit model using several graphs.

5.1. Results

As a first step, in order to analyze whether firm corruption has a different effect on innovation at different levels of corruption control, we estimate Model (1). Table 6 reports the results of the estimation of Model 1. The average marginal effect of FirmCorruption, separately calculated, is positive (0.085) and significant at 5%. (If not differently specified, in the data below, the term significant means significant at a 5% level). Figure 1 reports the estimated marginal effect of FirmCorruption at different levels of Controlcorr. It shows that the impact of firm corruption on product innovation decreases as the control of corruption increases. From a greatly favorable influence when control of corruption is low to a negative (albeit insignificant) impact when control of corruption is strong, the effect of company corruption on product innovation declines as the corruption control grows12.
As a second step, we have evaluated whether or not the impact of corruption on the share of innovative firms is different between foreign and domestic units of analysis. To evaluate if the impact of FirmCorruption on product innovation is different between foreign and domestic firms, Model 2 is estimated, in both the whole sample and in the three country groups. Both the probit model (2a) and linear probability model (2b) are estimated. Coefficients of FirmCorruption among domestic (on the left) and foreign (on the right) firms are illustrated by Figure 2, Figure 3, Figure 4 and Figure 5 as results of the probit model for the whole sample (Figure 2), of the linear probability model for Country Group 1 (Figure 3) and of the probit model for Country Group 2 and 3 (Figure 4 and Figure 5)13.
There is no discernible difference in the impact between domestic and foreign enterprises when looking at the entire sample (Figure 2), but some intriguing differences show up when looking at country groups: in Country Group 1 (Figure 3) the effect of FirmCorruption on Innoprod is positive and significant for domestic firms while for foreign firms it is negative and significant; the difference in corruption effect between domestic and foreign firm is also significant. Similarly to Country Group 1, in Country Group 2 (Figure 4) the corruption effect is positive and significant for domestic firms and negative for foreign firms, but the effect for foreign firms and the difference in corruption effect are not significant here. In contrast to the other country groups, in Country Group 3 the impact of Firm Corruption on Innoprod is positive for both domestic and foreign firms and significant for domestic and foreign (in case of linear probability model14) with a bigger influence for foreign firms (the difference is not significant) (Figure 5)15.
Table 7 gives a detailed framework of the marginal effects. For both domestic firms and foreign firms, it displays the estimated marginal effects of FirmCorruption, according to the probit model and the linear probability model, along with their significance, for the various groups of countries and the entire sample.
In conclusion, with regard to domestic firms, the relationship between corruption and innovation is always positive in the whole sample and in each country group, while remarkably, the same relationship changes across groups for foreign firms: it is negative and significant in Group 1, negative but non-significant in Group 2, positive and, according to the linear probability model, significant in Group 3.
Summing up, we can conclude that both bivariate and multivariate analyses show two heterogeneous aspects of the link between corruption and innovation.
The former regards the heterogeneous link in the country-comparison perspective in line with hypothesis 1. The overall effect of corruption on innovation is positive (in the entire sample), but it is not uniform across the sample. Descriptive statistics indicate that when countries are grouped according to decreasing levels of corruption control, the impact of corruption on product innovation is nearly neutral in the group with the highest level of control, positive but relatively limited in the group with intermediate control, and very high in the group with the lowest level of control. The inverse relationship between the intensity of the corruption–innovation link and the level of control of corruption is thoroughly and confirmed by multivariate analysis.
The second aspect of heterogeneity is at the firm level and concerns the ownership of the enterprises, whether domestic or foreign; it correlated with hypothesis 2. In this situation, looking at the entire sample, the direction and intensity of the link between corruption and innovation do not differ significantly across domestic and foreign enterprises. However, inside each group of countries, interesting differences emerge. For domestic firms, the link between paying a bribe and innovative capacity is positive throughout the sample; for foreign firms, when the country’s institutional quality is high, such a link is negative; when the country’s institutional quality is low, paying a bribe is a vehicle for innovation, in the same way, and even more than for domestic firms.

5.2. Alternative Methods

When analyzing panel data, the traditional choice is between fixed effects and random effects models, each with distinct advantages and limitations. Fixed effects models control for time-invariant individual characteristics but only capture within-group variation. In contrast, random effects models allow for both within- and between-group variation but are more susceptible to omitted variable bias. Given that our dataset includes only two time periods, within-group variation is limited, making a fixed effects model less suitable. A Hausman test comparing fixed and random effects models further supports the choice of a random effects model. Alternatively, a non-panel probit model could be used, treating the data as a pooled cross-section without accounting for individual effects16.
Appendix A Figure A1 and Figure A2 display the coefficients for FirmCorruption across varying levels of Controlcorr, estimated using a fixed-effects logit model and a non-panel (pooled) probit model with clustered errors, where countries serve as clusters. Both models produce consistent interaction patterns: as Controlcorr increases, the coefficient of FirmCorruption declines, shifting from significantly positive to statistically insignificant. This effect is significant at the 10% level in the non-panel probit model and approaches significance in the fixed effects model17. In summary, despite varying levels of statistical significance, results from bivariate and multivariate analyses consistently converge and indicate that the relationship between corruption and firm-level innovation strengthens in weaker institutional contexts.
In addition to these alternative functional forms, we also incorporate additional country-level variables to account for institutional quality, macroeconomic performance, and development. Specifically, we considered the rule of law, regulatory quality, and government effectiveness from the Worldwide Governance Indicators, along with GDP per capita, the Doing Business Index, and the Human Development Index, either as complements or substitutes to Controlcorr. However, their simultaneous inclusion with Controlcorr is not feasible due to high correlation, and replacing Controlcorr with one or more of these variables does not enhance the model’s explanatory power.

6. Conclusions

Corruption has been widely studied in the literature because, to varying degrees, it poses a significant challenge to economies and societies worldwide. The paradoxical coexistence of a positive impact on business performance and a negative effect on national economic growth makes tackling corruption necessary, yet highly complex.
Globalization and digitalization can act both as deterrents to corruption and as catalysts for new threats. Many anti-corruption programs operate on the assumption that openness, liberalization, and privatization are essential tools for combating corruption. By connecting the seemingly separate discussions of corruption and globalization, it becomes clear that corruption is a major obstacle to the effective implementation of international economic strategies aimed at fostering innovation—an issue further compounded by the potentials and pitfalls of digitalization (Malik & Froese, 2022). However, a crucial aspect is often overlooked: the institutional and political roots of corruption. These factors must be carefully considered when designing policies (Rose-Ackerman & Truex, 2012; Ohnsorge & Yu, 2021) to better understand their impact on politically connected firms (Colonnelli & Prem, 2022; Xu & Yang, 2024) and to gain deeper insight into how corruption influences resource allocation within firms.
Our results reveal a first heterogeneous effect of corruption—both “sanding” and “greasing”—depending on the level of analysis (country vs. firm level). On average, countries with higher levels of corruption tend to be less innovative. However, at the firm level, corruption is, on average, positively associated with firms’ innovative activities. These average effects, however, mask significant differences across institutional contexts. In countries with weak institutional control, corruption often functions as an informal mechanism that facilitates innovation by helping firms circumvent bureaucratic inefficiencies. In contrast, in countries with strong anti-corruption measures (for instance, EU member states in our sample), corruption has no significant impact or may even hinder innovation.
Additionally, when distinguishing a second heterogeneous result, the greasing effect is magnified in foreign firms in countries with a poor corruption control. In these contexts, foreign enterprises must adapt to local conditions, often engaging in corrupt practices to remain competitive and innovative. Conversely, in countries with strong anti-corruption enforcement, corruption is not only ineffective but actually detrimental to innovation, particularly for foreign firms.
These findings align with existing research on foreign firms in host countries, indicating that businesses operating in global markets must often adjust to local norms and institutional conditions to drive innovation. Our results further support the view that corruption can serve as both a necessary enabler of innovation in certain settings and an ineffective tool in others.
In summary, the lesson for policymakers is that addressing corruption and its relationship to innovation is a complicated issue with unintended consequences arising from the interplay between macro-institutional variables and firm-level business characteristics.
As a result, anti-corruption policies must be carefully tailored to market and non-market business strategies: not all anti-corruption efforts are effective in breaking the nexus between government and business or in reducing rent-seeking expenditures in favor of innovation.
While our study provides valuable insights, several limitations remain. Firstly, although the panel data allows us to draw long-term implications of bribery strategies, future research should go into greater detail, by for instance including a better understanding of the methods for reticence-adjusted estimates of corruption. Secondly, although the BEEPS dataset is widely recognized as one of the best sources of data for detecting firm-level corruption, it is prone to measurement challenges. This requires utilizing microdata to overcome the limitations of cross-country macro data, as well as determining the best technique for evaluating corruption in both observational and experimental settings.

Author Contributions

R.I. and M.L.S. conceived the presented idea. M.L.S. developed the theoretical suggestions drawn from the literature and R.I. applied the methodology, performed the computations and verified the analytical methods. Both authors contributed to the design and implementation of the research, to the analysis of the results and to the writing of the manuscript. All authors have read and agreed to the published version of the manuscript.

Funding

This research received no external funding.

Institutional Review Board Statement

Not applicable.

Informed Consent Statement

To gain full access to the firm-level data of the EBRD-World Bank Business Environment and Enterprise Performance Survey (BEEPS), registration is required. This includes signing the BEEPS Data Confidentiality Agreement, which can be accessed at BEEPS Terms and Conditions (https://www.beeps-ebrd.com/terms-and-conditions/ last accessed on 12 March 2025).

Data Availability Statement

The raw data supporting the conclusions of this article will be made available by the authors on request.

Acknowledgments

We wish to thank Giuseppe Lubrano Lavadera from Link Campus University for his assistance in the construction of the panel. We also appreciate the constructive feedback from the participants at the 46th EBES Conference 2024 (Rome). Furthermore, the insightful comments provided by the referees of this journal have significantly contributed to enhancing this paper.

Conflicts of Interest

The authors declare no conflict of interest.

Appendix A

Table A1. Firms by country, percentage of innovative firms (product innovation), of firms paying bribes and of foreign firms.
CountriesNumber of Firms% Innovative Firms (Product)%
Firms Paying
Bribes
%
Foreign Firms
Albania15223.3621.218.22
Belarus15835.244.4112.66
Bosnia and Herz.15143.676.207.28
Croatia7139.446.827.75
Estonia6329.372.0411.11
Georgia11025.4505.91
Kazakhstan14017.699.132.86
Kosovo7848.087.690
Kyrgyzstan14740.2932.7619.34
Latvia9040.001.9914.44
Lithuania7530.143.914.00
Moldova14232.167.758.80
Mongolia17236.6316.874.65
Montenegro6921.0112.508.70
Poland19431.957.044.12
Russia40016.948.443.12
Serbia14538.546.939.31
Slovenia7854.256.8716.03
Tajikistan11519.6510.814.35
Turkey60911.083.392.79
Ukraine16833.2327.345.36
Uzbekistan17011.501.8812.35
TOTAL3.58426.278.406.61
Source: EBRD’s World Bank Business Environment and Performance Survey (BEEPS).
Table A2. Control of corruption by country.
Countries20132018
Albania−0.70−0.52
Belarus−0.47−0.19
Bosnia and Herz.−0.24−0.57
Croatia0.120.13
Estonia1.191.51
Georgia0.470.71
Kazakhstan−0.93−0.50
Kosovo−0.65−0.52
Kyrgyzstan−1.16−0.95
Latvia0.330.33
Lithuania0.430.50
Moldova−0.75−0.73
Mongolia−0.48−0.43
Montenegro−0.250.02
Poland0.600.64
Russia−1.01−0.85
Serbia−0.30−0.37
Slovenia0.730.87
Tajikistan−1.28−1.42
Turkey−0.09−0.34
Ukraine−1.26−0.87
Uzbekistan−1.26−1.07
Source: World Bank Worldwide Governance Indicators. Values of such index range from −2.5 (minimum control of corruption) to +2.5 (maximum level of control of corruption).
Table A3. Description of variables.
Variable NameKind of VariableDescription
Country GroupCategorical1. The establishment is located in one of the following countries: Latvia, Lithuania, Estonia, Poland, or Slovenia.
2. The establishment is located in one of the following countries: Croatia, Serbia, Bosnia and Herzegovina, Montenegro, Albania, Kosovo, Ukraine, Belarus, Moldova, Georgia, or Turkey.
3. The establishment is located in one of the following countries: Russia, Uzbekistan, Tajikistan, Kazakhstan, Kyrgyzstan, or Mongolia.
InnoprodBinary1 = In the last three years, the establishment has introduced new products or services.
0 = otherwise
FirmCorruptionBinary1 = In the last three years, the establishment has paid an informal payment “to get things done”.
0 = otherwise
ControlcorrContinuousValue of the Control of Corruption index of the country where the firm is located (See Table A2)
ForeignBinary1. Ten percent of the firm is owned by private foreign individuals, companies or organizations.
0. Otherwise
CompetitionOrdered categorical1. Low: in the last fiscal year, in the market where the establishment sells its main product, it faced from 0 to 5 competitors.
2. Medium: the establishment faced more than 5 competitors (but still countable)
3. High: the establishment faced uncountable competitors (“too many to count”).
RDBinary1. In the last three years, the firm has spent money on R&D activities, either in-house or contracted with other companies (outsourced).
0. Otherwise
TrainBinary1. In the last fiscal year, the establishment had formal training programs for its permanent, full-time employees.
0. Otherwise
FortechBinary1. The establishment uses technology licensed from a foreign-owned company, excluding office software.
0. Otherwise
ExportBinary1. In the last fiscal year, a positive percentage of the establishment’s sales are direct or indirect exports.
0. Otherwise
SizeContinuousNatural logarithm of the number of employees.
WaveBinary 1. Survey VI
0. Survey V
Figure A1. Marginal effects of firm corruption on product innovation at different levels of control of corruption. Panel logit model with fixed effects (90% confidence intervals).
Jrfm 18 00164 g0a1
Figure A2. Marginal effects of firm corruption on product innovation at different levels of control of corruption. Pooled probit model with clustered (countries) standard errors (90% confidence intervals).
Jrfm 18 00164 g0a2

Notes

1
Transparency International defines corruption as; the abuse of entrusted power for private gain https://www.transparency.org/en/what-is-corruption (accessed on 12 March 2025); and bribery is a subset of corruption defined as the offering, promising, or giving of something to influence an official. Corrupt transactions can be extremely simple or extremely complex. They include both grand (political) and petty (administrative) corruption, as well as organized and disorganized corruption. In any case, no definition of corruption is fully clearly-cut. It also has many different interpretations, varying over time and context as well as by discipline. Notwithstanding the differences in definition between corruption and bribery, in this work we use the two terms as synonymous.
2
Among the 50 micro-level empirical studies analyzed by Martins et al. (2020) focusing mostly on single countries, 31 studies have concluded that corruption (mostly bribery) is harmful to firm performance, whereas 19 suggest the opposite.
3
Bahoo et al. (2021) in the bibliometric analysis of the literature on corruption in the discipline of economics between 1968–2019 identify seven streams of the literature.
4
Voigt (2012) focus on how to measure institutions and updates the North’ view of formal and informal institutions and later Voigt (2018) identifies the difficulties in measuring informal institutions.
5
Original data can be downloaded at the link https://www.beeps-ebrd.com/data/ (Last accessed by the authors on 12 March 2025).
6
From the perspective of their locations and histories, the three groupings of nations -based on their ranking of their control over corruption- appear to align closely: all the countries in the sample that are part of the European Union, along with Georgia, are categorized in CountryGroup 1. Meanwhile, all countries from the former Soviet Union, except for Belarus (which ranks significantly higher in terms of control over corruption) and the Baltic states (which share much of their history with Western Europe), are placed in CountryGroup 3.
7
The choice of control variables has been spearheaded by the literature in this area: size, R&D investments, foreign ownership, competition, and exporting are also included by Krammer (2019) as control variables; Karaman Kabadurmus and Sylwester (2022) include licenses for foreign technology.
8
The complete question, numbered E2 in the Questionnaire, is: “In regard to the main market to which this establishment sold its main product, how many competitors did this establishment’s main product face?”
9
5 is chosen because it is the median among the firms declaring a countable number of competitors.
10
Country dummy variables are not utilized, because their inclusion would prevent evaluating the effects of the between variability of Controlcorr.
11
Weighted mean of the Control of Corruption for each country reported by the Worldwide Governance Indicator of the World Bank Group. Data by country are reported in Table A2 in the Appendix A. The range for Control of Corruption is from −2.5 (minimum control of corruption) to +2.5 (maximum control, of corruption), Weights are the number of firms for each country included in the sample.
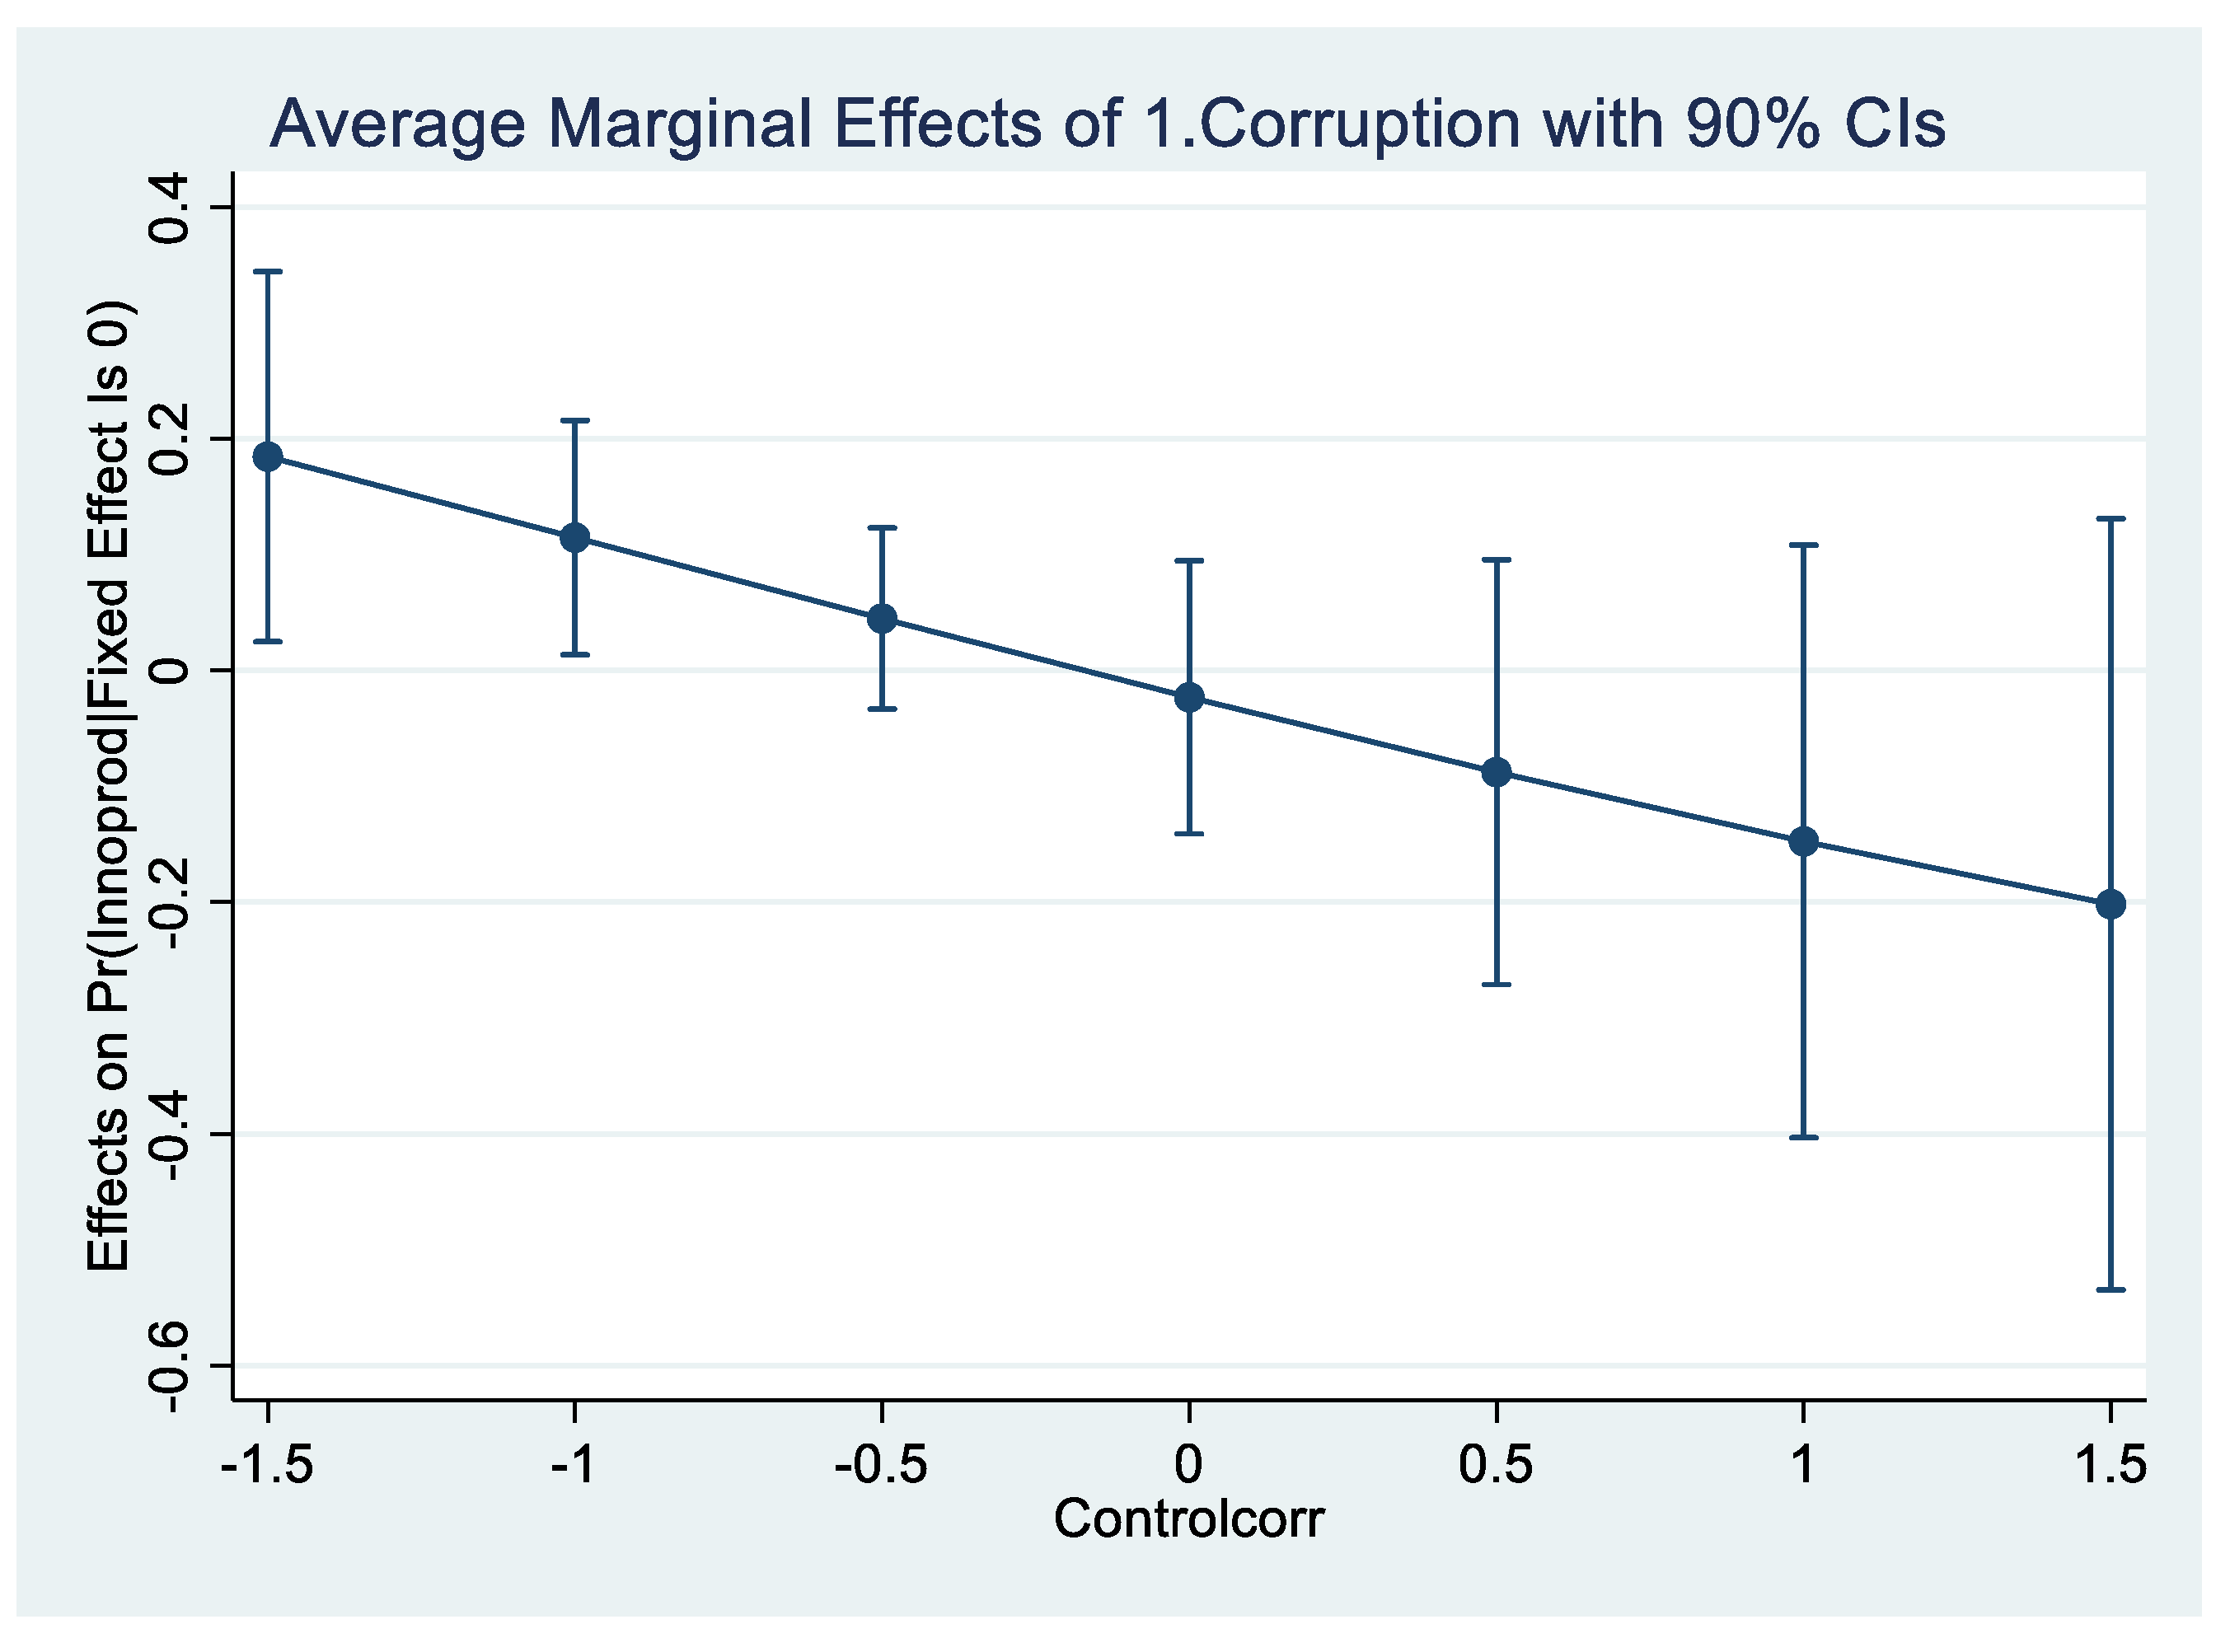
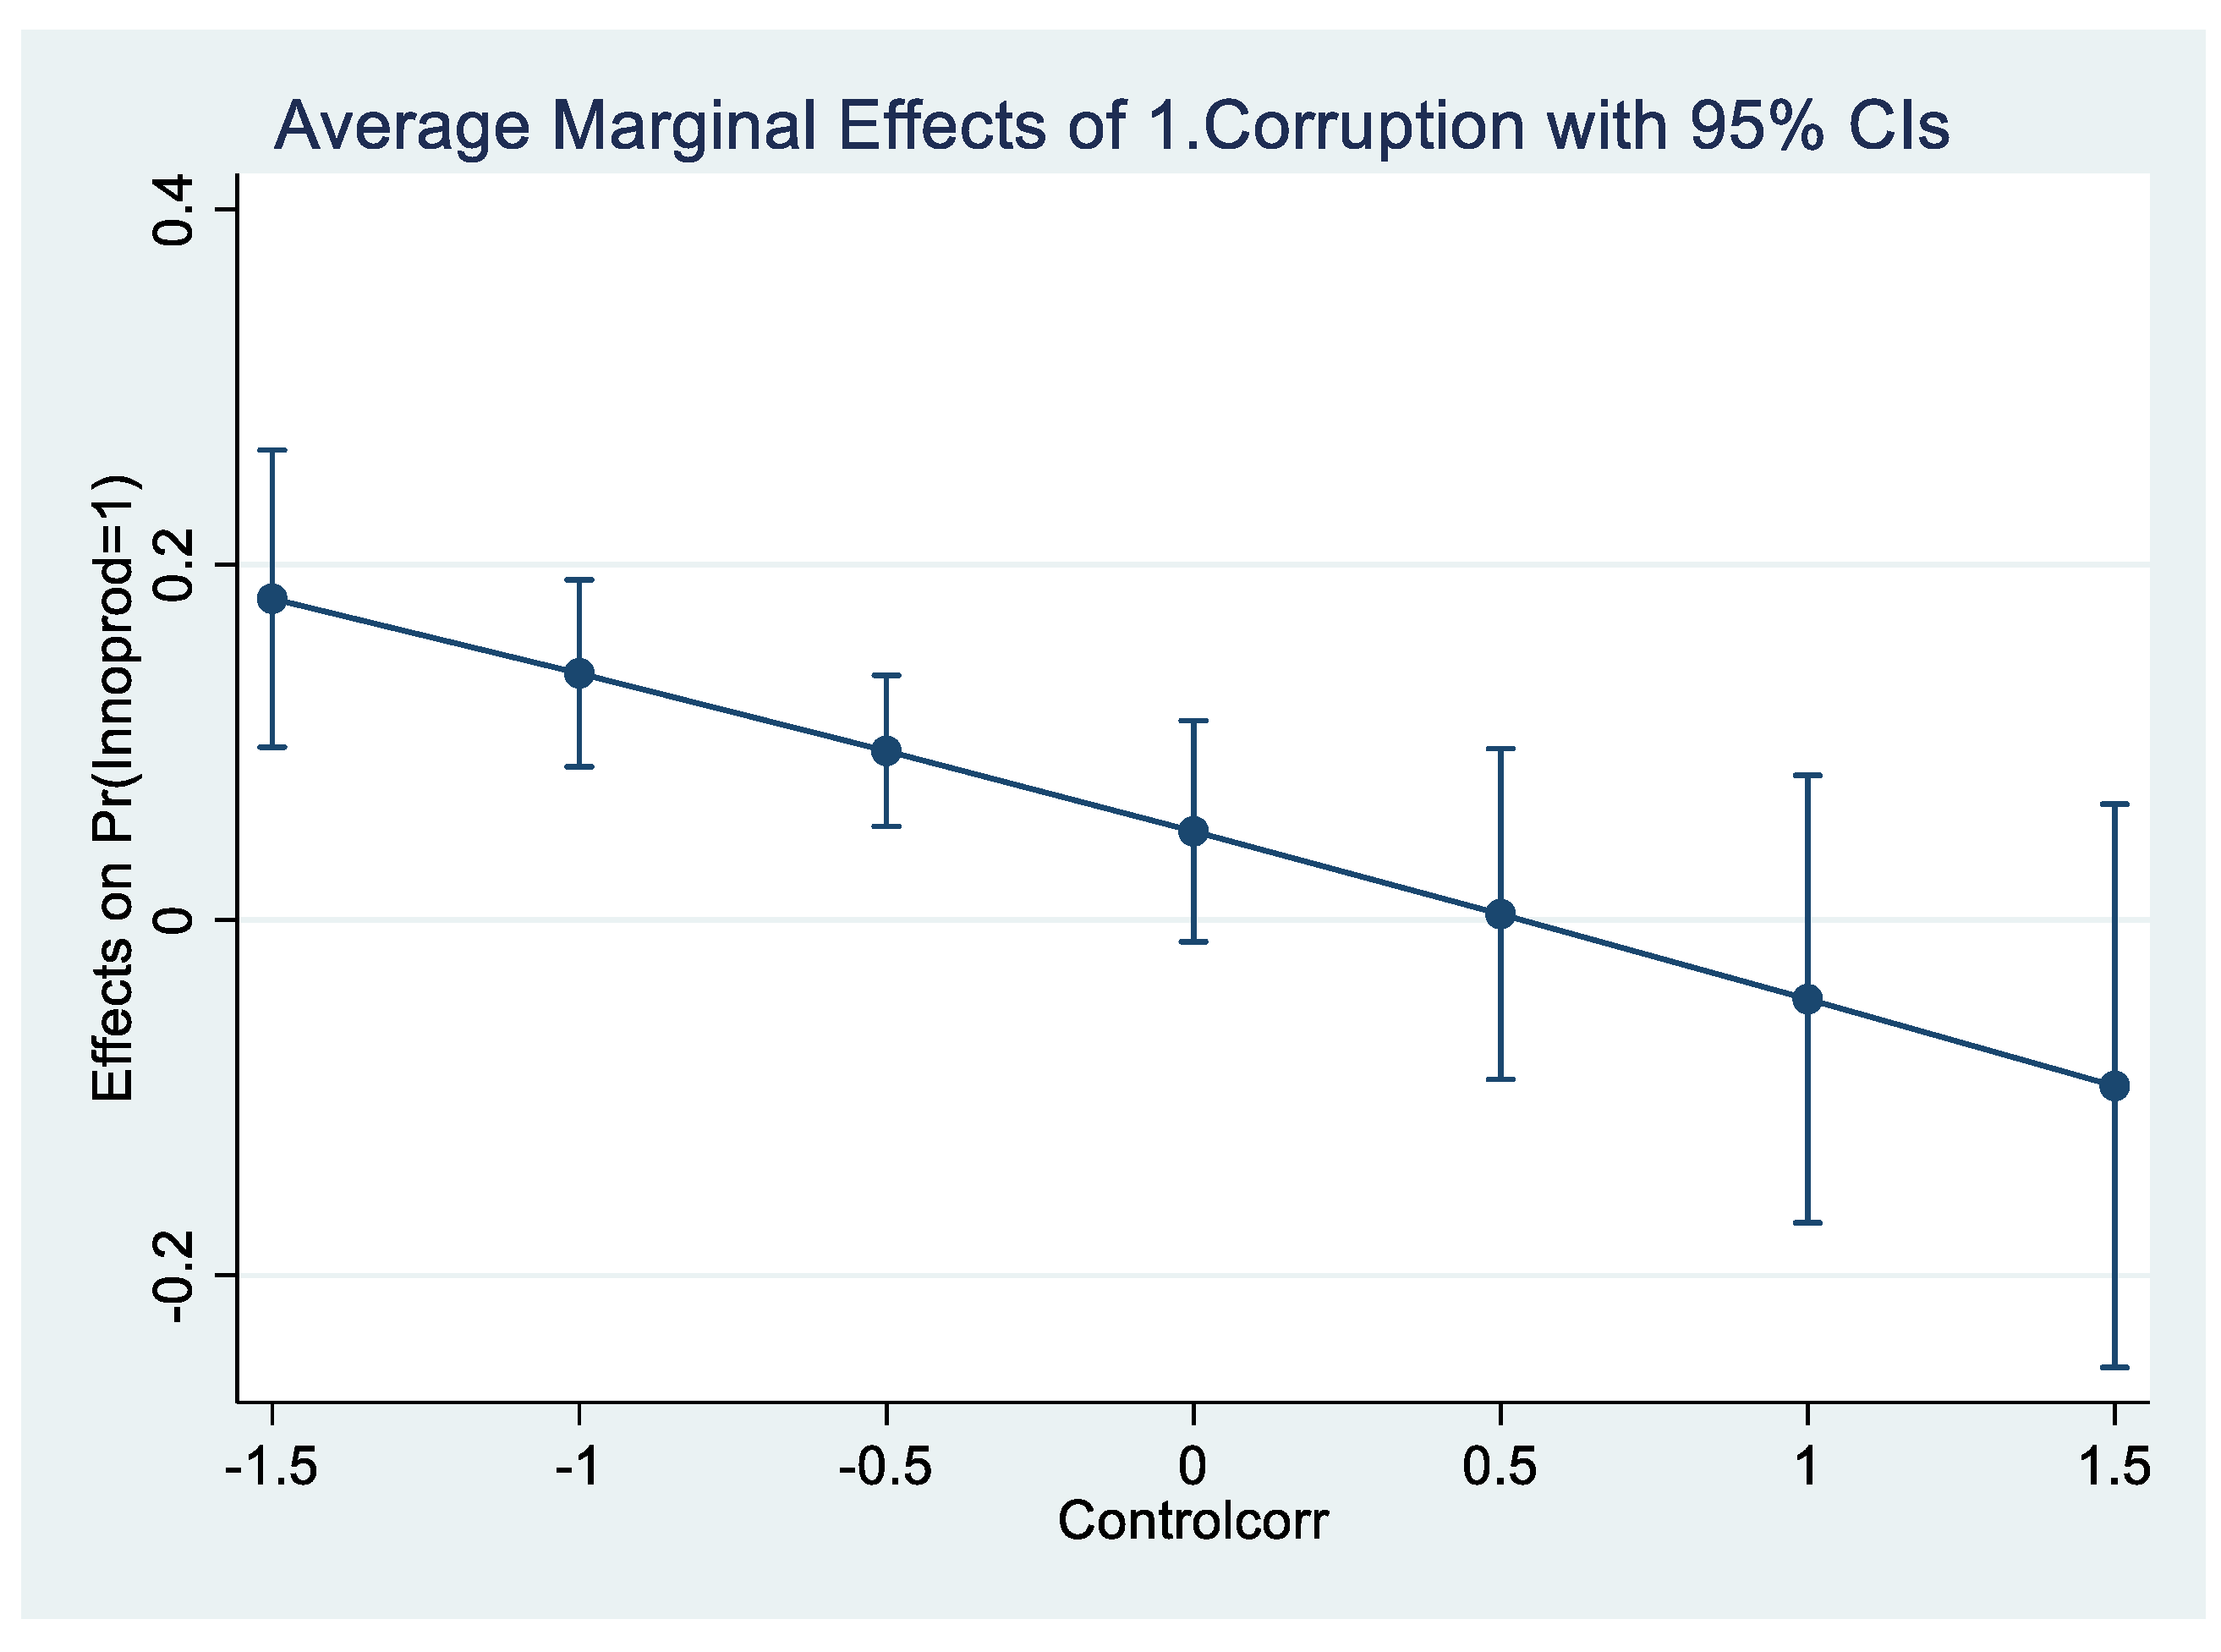
12
The 95% confidence intervals do not overlap when comparing the lowest and highest Controlcorr levels, indicating that the decreasing effect of FirmCorruption as Controlcorr increases is statistically significant at a level of 5%.
13
Results of probit model are more reliable than results of linear probability model. Nevertheless, due to the limited number of cases, probit model was not estimable in CountryGroup 1.
14
According to the probit model, this result is very close to the 10% significance threshold: p = 0.103.
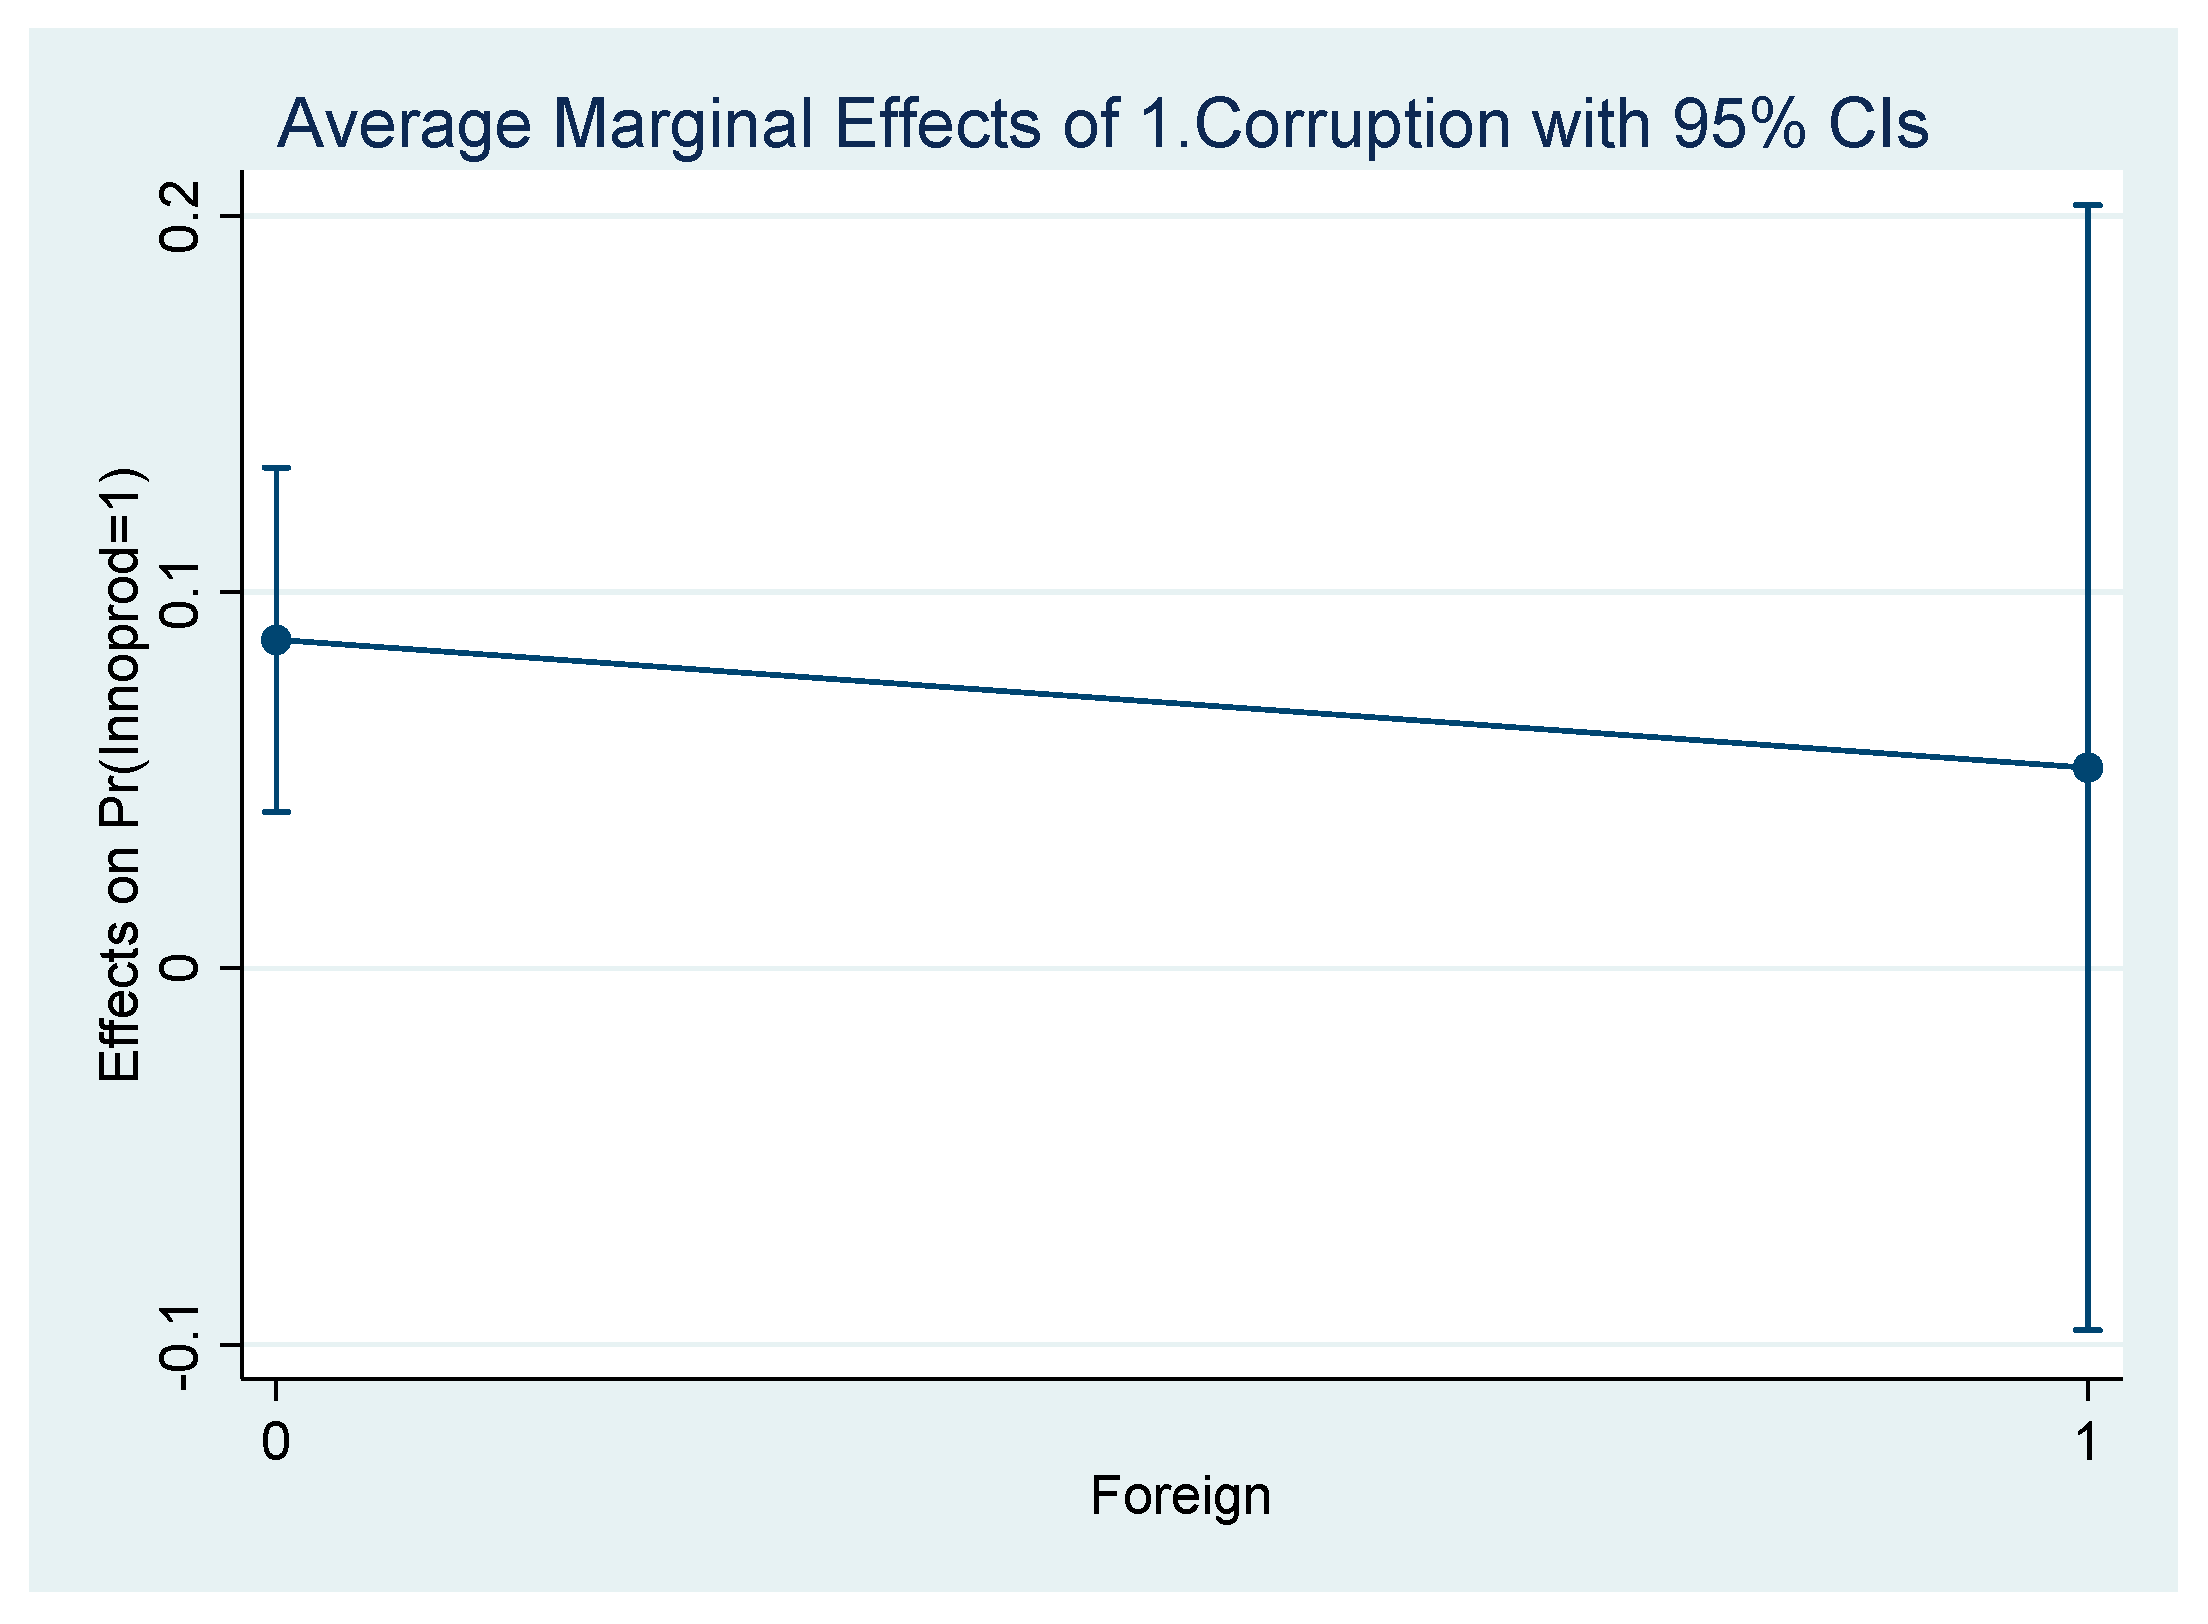
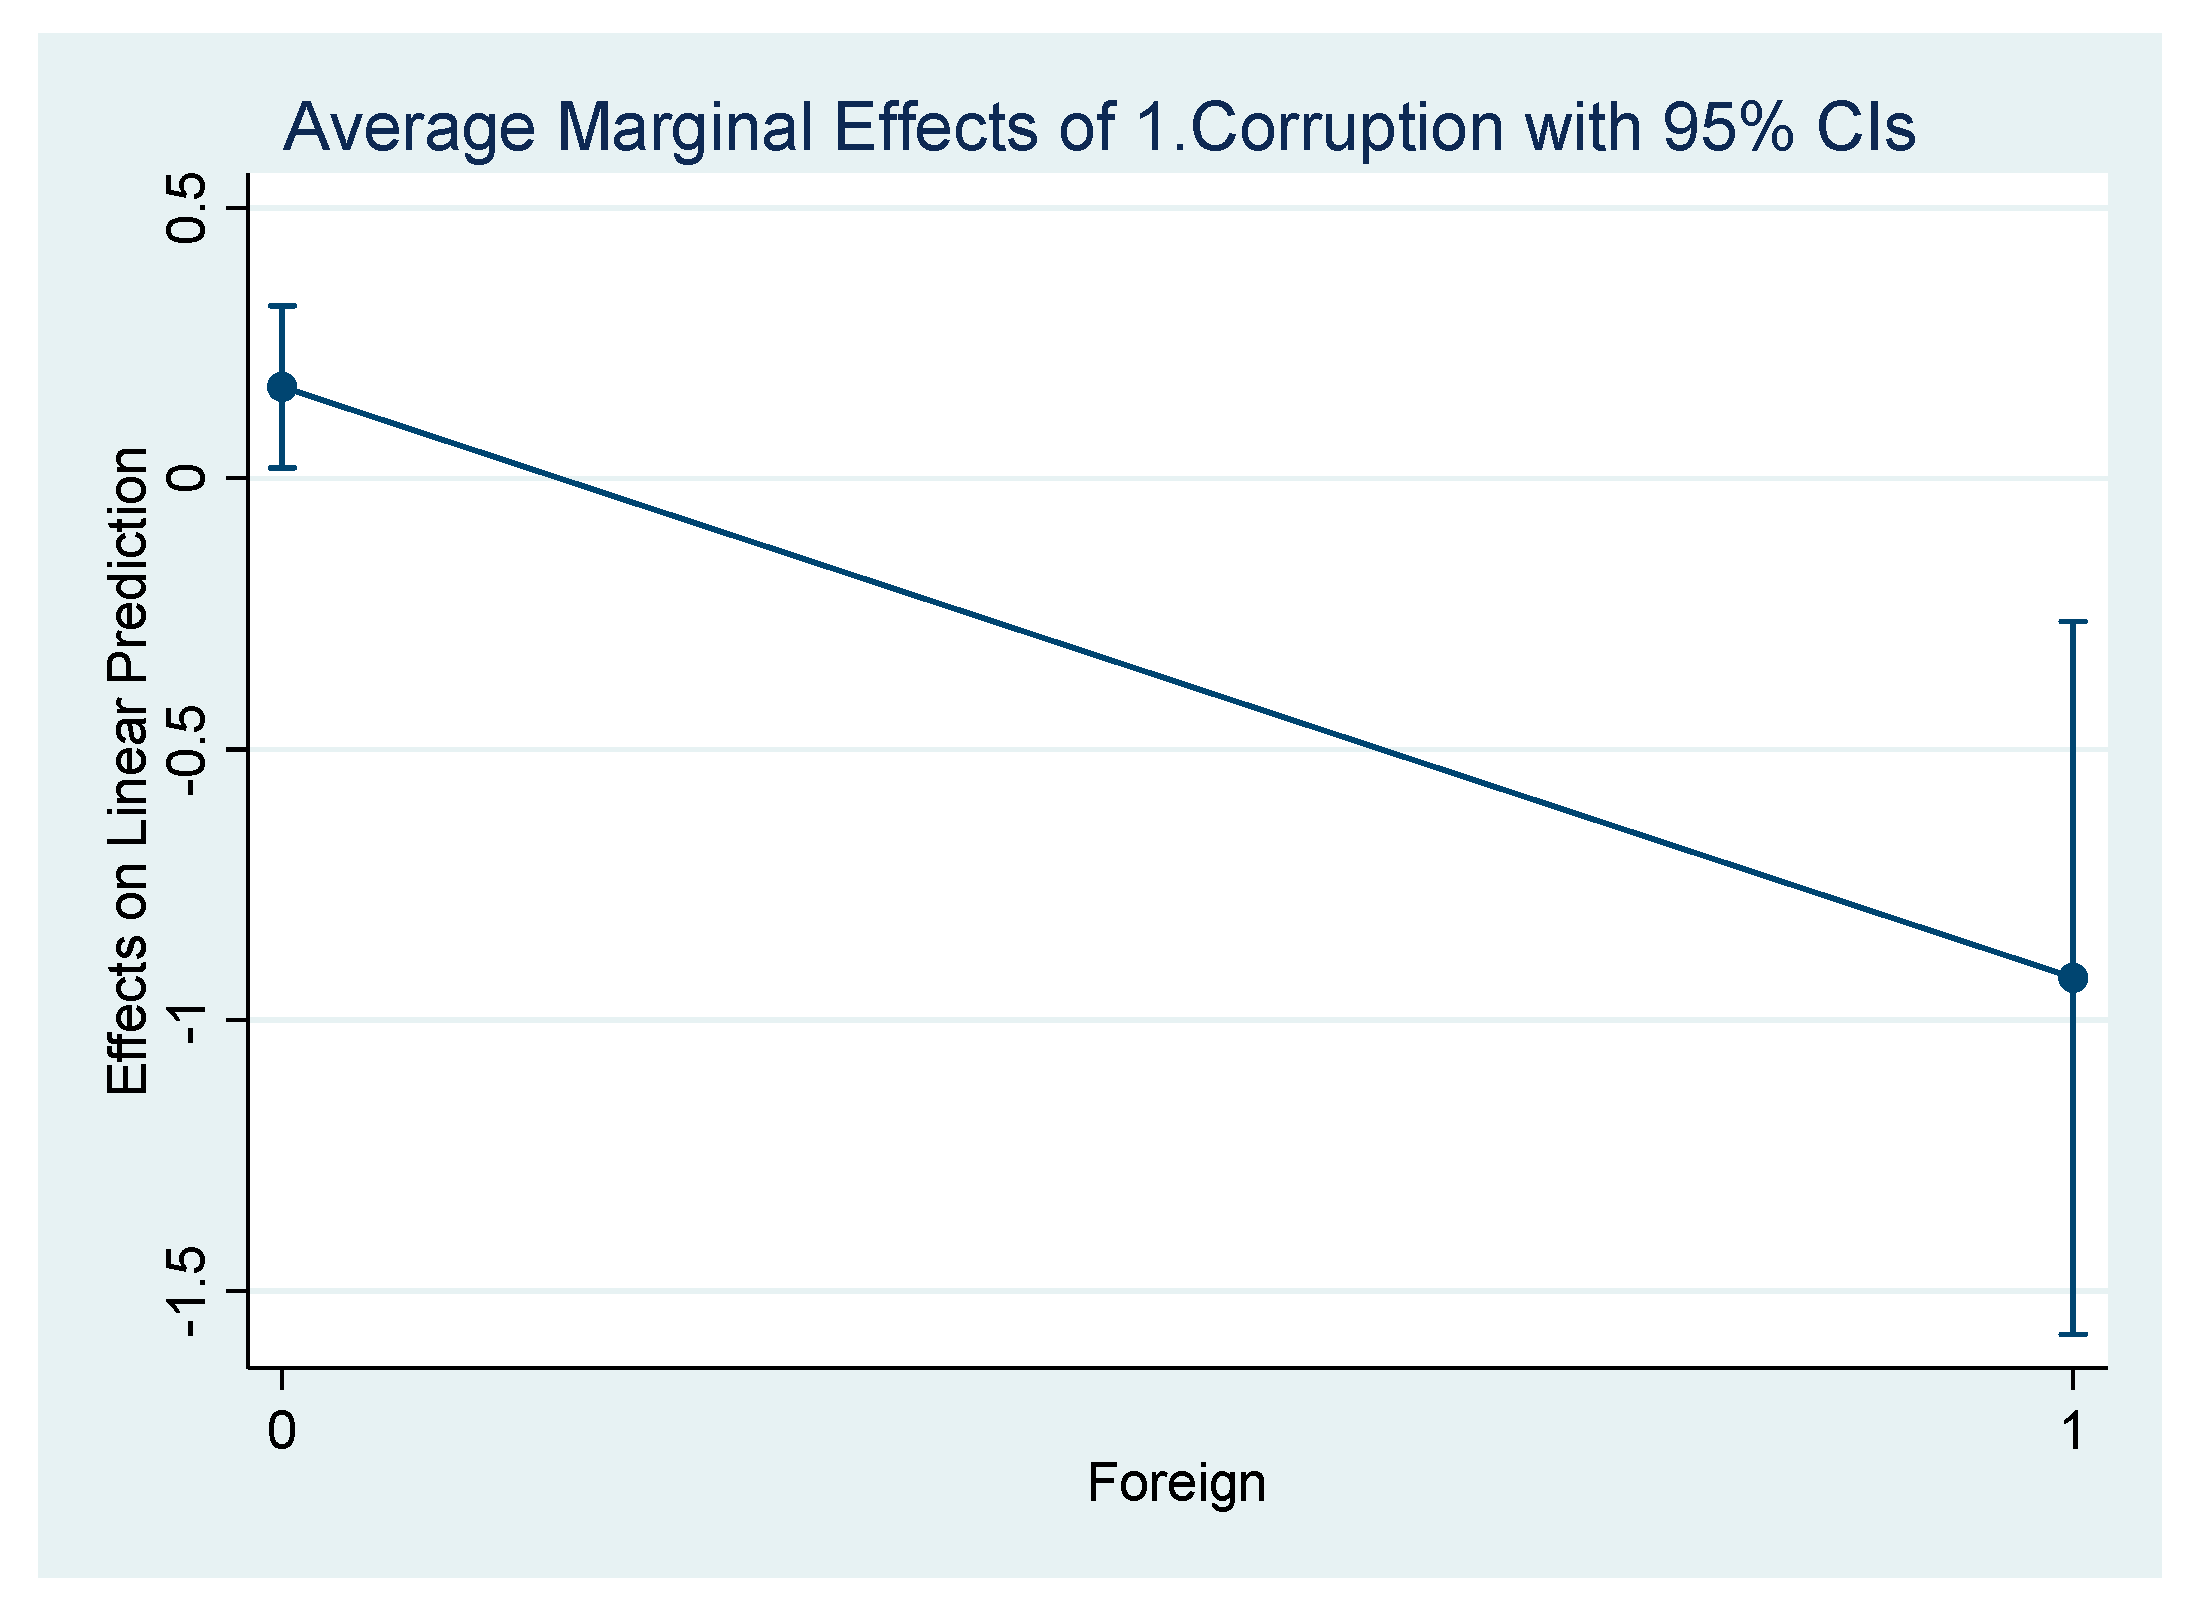
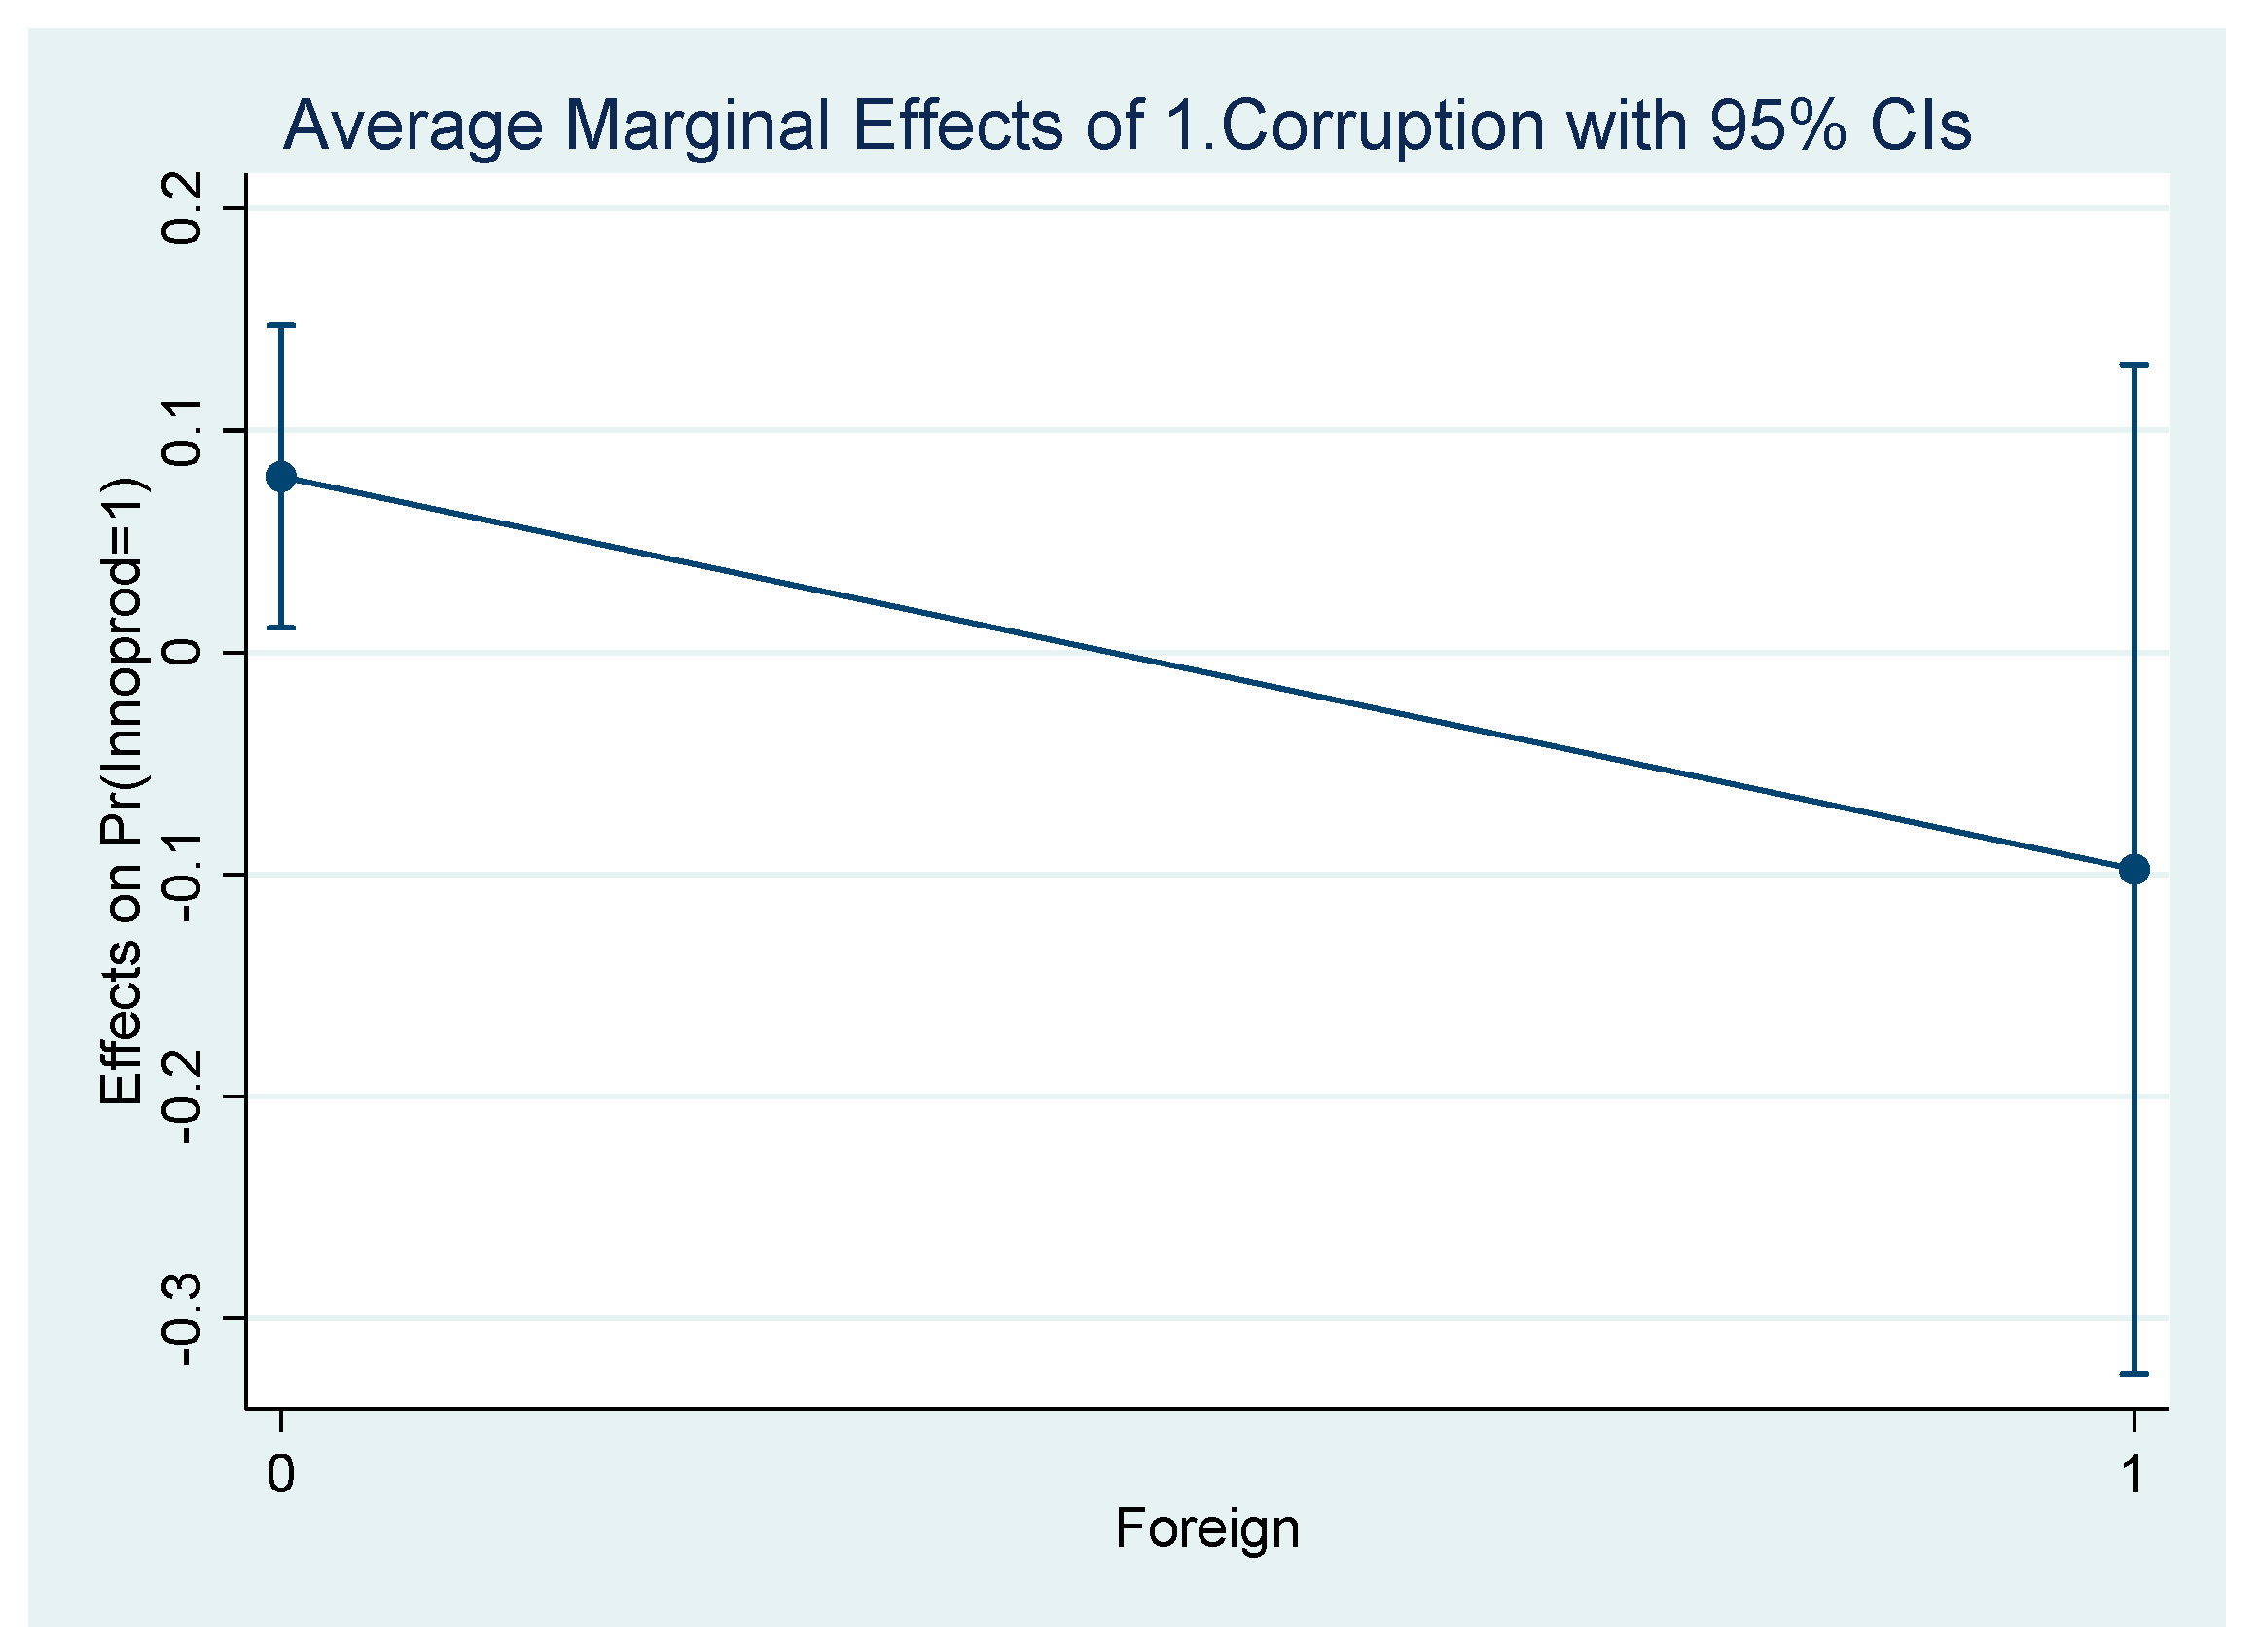
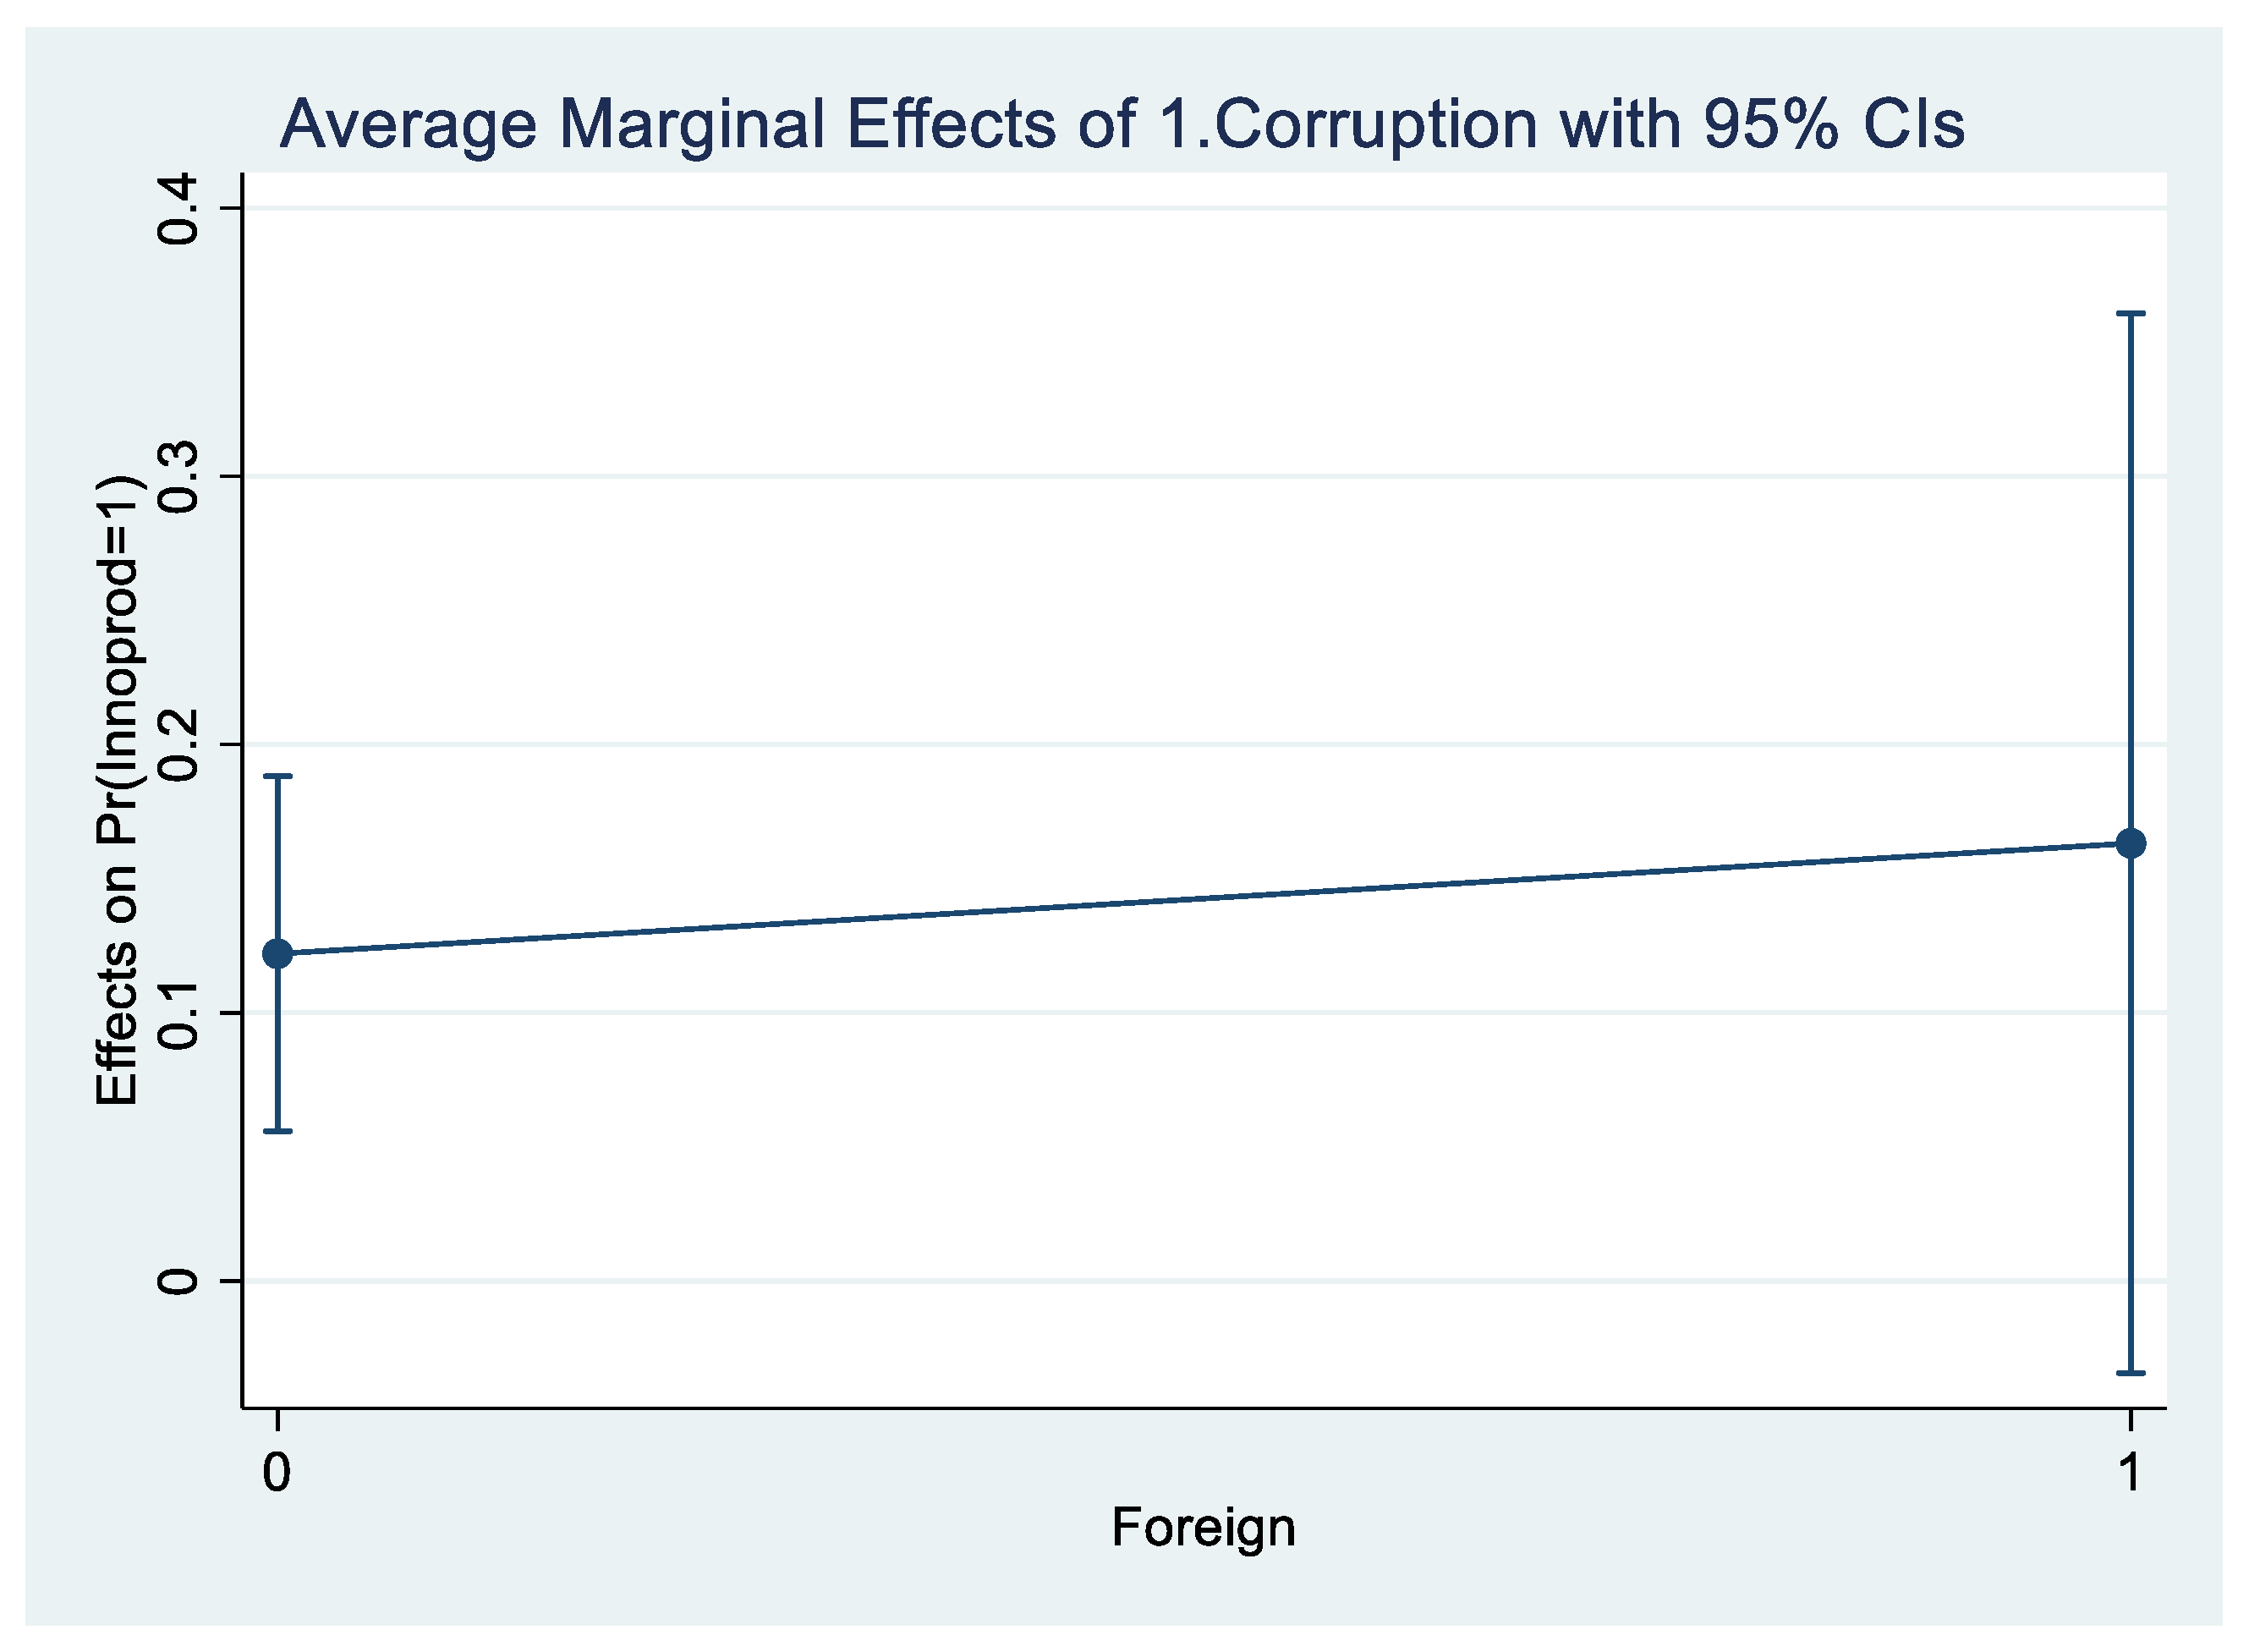
15
These findings hold regardless of the composition and size of country groups. We estimated a model incorporating a triple interaction between FirmCorruption, Controlcorr, and Foreign across the entire sample. The estimated marginal effect of FirmCorruption on innovation was then computed for both domestic and foreign firms at different levels of Control of Corruption (high, intermediate, and low). The results remain consistent with previous findings.
16
The likelihood ratio test of rho = 0 applied on the estimation of the random effect probit model (results in Table 6) is inconclusive (close to 5% threshold) on the importance of panel-level component of variance; hence the legitimacy of non panel probit estimation.
17
If the non-panel probit model is estimated using ordinary or robust standard errors, the interaction effect between FirmCorruption and Controlcorr is significant at a 5% level. Similarly, the interaction between FirmCorruption and Controlcorr remains significant at 5% when estimated using a linear probability model with standard OLS. Although the linear probability model is generally considered unsuitable for a binary dependent variable, this result is noteworthy in the context of omitted variable issues: as Bun and Harrison (2019) demonstrate, an OLS estimator remains consistent when estimating the interaction between an endogenous and an exogenous variable—where Controlcorr can reasonably be considered exogenous.

References

  1. Ai, C., & Norton, E. C. (2003). Interaction terms in logit and probit models. Economics Letters, 80, 123–129. [Google Scholar] [CrossRef]
  2. Ashyrov, G., & Masso, J. (2020). Does corruption affect local and foreign-owned companies differently? Evidence from the BEEPS survey. Post-Communist Economies, 32, 306–329. [Google Scholar] [CrossRef]
  3. Athanasouli, D., & Goujard, A. (2015). Corruption and management practices: Firm level evidence. Journal of Comparative Economics, 43, 1014–1034. [Google Scholar] [CrossRef]
  4. Ayyagari, M., Demirgüç-Kunt, A., & Maksimovic, A. (2014). Bribe payments and innovation in developing countries: Are innovating firms disproportionately affected? Journal of Financial and Quantitative Analysis, 9, 51–75. [Google Scholar] [CrossRef]
  5. Bahoo, S., Ilan, A., & Paltrinieri, A. (2021). Corruption in international business: A review and research agenda. International Business Review, 29, 101660. [Google Scholar] [CrossRef]
  6. Bao, S. R., & Lewellyn, K. B. (2017). Ownership structure and earnings management in emerging markets. An institutionalized agency perspective. International Business Review, 26, 828–838. [Google Scholar] [CrossRef]
  7. Barassi, M. R., & Zhou, Y. (2012). The effect of corruption on FDI: A parametric and non-parametric analysis. European Journal of Political Economy, 28, 302–312. [Google Scholar] [CrossRef]
  8. Baughn, C., Bodie, N., Buchanan, M. A., & Bixby, M. B. (2010). Bribery in international business transactions. Journal of Business Ethics, 92, 15–32. Available online: https://www.jstor.org/stable/25621541 (accessed on 12 March 2025). [CrossRef]
  9. Boubakri, N., Mansi, S., & Saffar, W. (2013). Political institutions, connectedness, and corporate risk-taking. Journal of International Business Studies, 44, 195–215. [Google Scholar] [CrossRef]
  10. Bukari, C., & Atta Anaman, E. (2021). Corruption and firm innovation: A grease or sand in the wheels of commerce? Evidence from lower-middle and upper-middle income economies. Eurasian Business Review, 11, 267–302. [Google Scholar] [CrossRef]
  11. Bun, M. J. C., & Harrison, T. D. (2019). OLS and IV estimation of regression models including endogenous interaction terms. Econometric Reviews, 38, 814–827. [Google Scholar] [CrossRef]
  12. Chen, C., Cullen, J. B., & Parboteeah, K. B. (2015). Are manager-controlled firms more likely to bribe than shareholder-controlled firms: A cross-cultural analysis. Management and Organization Review, 11, 343–365. [Google Scholar] [CrossRef]
  13. Colonnelli, E., & Prem, M. (2022). Corruption and firms. The Review of Economic Studies, 89, 695–732. [Google Scholar] [CrossRef]
  14. Couttenier, M., & Toubal, F. (2017). Corruption for sales. Journal of Comparative Economics, 45, 56–66. [Google Scholar] [CrossRef]
  15. Cuervo-Cazurra, A. (2006). Who cares about corruption? Journal of International Business Studies, 37, 803–822. [Google Scholar] [CrossRef]
  16. Cuervo-Cazurra, A. (2016). Corruption in international business. Journal of World Business, 51, 35–49. [Google Scholar] [CrossRef]
  17. Dallago, B., & Casagrande, S. (2021). The “new comparative economics”: A critical review. In E. Douarin, & O. Havrylyshyn (Eds.), The palgrave handbook of comparative economics. Palgrave Macmillan. [Google Scholar] [CrossRef]
  18. Ellis, J. A., Smith, J. D., & White, R. M. (2020). Corruption and corporate innovation. Journal of Financial and Quantitative Analysis, 55, 2124–2149. [Google Scholar] [CrossRef]
  19. Ha, L. T., Thanh, T. T., Thang, D. N., & Anh, P. T. H. (2021). Bribery, export decisions, and institutional constraints: Evidence from cross-country firm-level data. Economic Analysis and Policy, 69, 585–612. [Google Scholar] [CrossRef]
  20. Hearn, B. (2015). Institutional influences on board composition of international joint venture firms listing on emerging stock exchanges: Evidence from Africa. Journal of World Business, 50, 205–219. [Google Scholar] [CrossRef]
  21. Hill, T. D., Davis, A. P., & French, M. T. (2020). Limitations of fixed-effects models for panel data. Sociological Perspectives, 63, 357–369. [Google Scholar] [CrossRef]
  22. Iorio, R., & Segnana, M. L. (2021). Is paying bribes worthwhile? Corruption and innovation in middle-income countries. Eurasian Business Review, 12, 475–504. [Google Scholar] [CrossRef]
  23. Javorcik, B. S., & Wei, S.-J. (2009). Corruption and cross-border investment in emerging markets: Firm level evidence. Journal of International Money and Finance, 28, 605–624. [Google Scholar] [CrossRef]
  24. Karaman Kabadurmus, F. N., & Sylwester, K. (2022). Corruption and innovation: The importance of competition. International Journal of Emerging Markets, 17, 766–788. [Google Scholar] [CrossRef]
  25. Keig, D. L., Brouthers, L. E., & Marshall, V. B. (2015). Formal and informal corruption environments and multinational enterprise social irresponsibility. Journal of Management Studies, 52, 89–116. [Google Scholar] [CrossRef]
  26. Krammer, S. M. (2009). Drivers of national innovation in transition: Evidence from a panel of Eastern European countries. Research Policy, 38, 845–860. [Google Scholar] [CrossRef]
  27. Krammer, S. M. (2019). Greasing the wheels of change: Bribery, institutions, and new product introductions in emerging markets. Journal of Management, 45, 1889–1926. [Google Scholar] [CrossRef]
  28. Krammer, S. M., & Jimenez, A. (2020). Do political connections matter for firm innovation? Evidence from emerging markets in Central Asia and Eastern Europe. Technological Forecasting and Social Change, 151, 119669. [Google Scholar] [CrossRef]
  29. Krammer, S. M., Strange, R., & Lashitew, A. (2018). The export performance of emerging economy firms: The influence of firm capabilities and institutional environments. International Business Review, 27, 218–230. [Google Scholar] [CrossRef]
  30. Lee, C. C., Wang, C. W., & Ho, S.-J. (2020). Country governance, corruption, and the likelihood of firms’ innovation. Economic Modelling, 92, 326–338. [Google Scholar] [CrossRef]
  31. Malik, A., & Froese, F. J. (2022). Corruption as a perverse Innovation: The dark side of digitalization and corruption in international business. Journal of Business Research, 145, 682–693. [Google Scholar] [CrossRef]
  32. Martins, L., Cerdeira, J., & Teixeira, A. (2020). Does corruption boost or harm firms’ performance in developing and emerging economies? A firm-level study. World Economics, 43, 2119–2152. [Google Scholar] [CrossRef]
  33. Meyer, K., & Peng, M. (2016). Theoretical foundations of emerging economy business research. Journal of International Business Studies, 47, 3–22. [Google Scholar] [CrossRef]
  34. Muellner, J., Klopf, P., & Nell, P. C. (2017). Trojan horses or local allies: Host-country national managers in developing market subsidiaries. Journal of International Management, 23, 306–325. [Google Scholar] [CrossRef]
  35. Nguyen, N. A., Doan, Q. H., & Nguyen, N. M. (2016). Tran-Nam B. The impact of petty corruption on firm innovation in Vietnam. Crime Law Soc Change, 65, 377–394. [Google Scholar] [CrossRef]
  36. North, D. C. (1990). Institutions, institutional change and economic performance. Cambridge University Press. [Google Scholar] [CrossRef]
  37. Ohnsorge, F., & Yu, S. (Eds.). (2021). The long shadow of informality. Challenges and policies. World Bank Publications. Available online: http://hdl.handle.net/10986/35782 (accessed on 12 March 2025).
  38. Pantzalis, C., Park, J. C., & Sutton, N. (2008). Corruption and valuation of multinational corporations. Journal of Empirical Finance, 15, 387–417. [Google Scholar] [CrossRef]
  39. Rodriguez, P., Uhlenbruck, K., & Eden, L. (2005). Government corruption and the entry strategies of multinationals. Academy of Management Review, 30, 383–396. [Google Scholar] [CrossRef]
  40. Rose-Ackerman, S. (2008). Corruption and government. Journal of International Peacekeeping, 15, 328–343. [Google Scholar] [CrossRef]
  41. Rose-Ackerman, S., & Truex, R. (2012). Corruption and policy reform. Yale Law & Economics Research Paper. No. 444. Available online: https://doi.org/10.2139/ssrn.2007152 (accessed on 12 March 2025). [CrossRef]
  42. Roy, J. P., & Oliver, C. (2009). International joint venture partner selection: The role of the host-country legal environment. Journal of International Business Studies, 40, 779–801. [Google Scholar] [CrossRef]
  43. Sharma, C., & Mitra, A. (2015). Corruption, governance and firm performance: Evidence from Indian enterprises. Journal of Policy Modeling, 37, 835–851. [Google Scholar] [CrossRef]
  44. Thede, S., & Karpaty, P. (2023). Effects of corruption on foreign direct investment: Evidence from Swedish multinational enterprises. Journal of Comparative Economics, 51, 348–371. [Google Scholar] [CrossRef]
  45. Voigt, S. (2012). How (not) to measure institutions. Journal of Institutional Economics, 9, 1–26. [Google Scholar] [CrossRef]
  46. Voigt, S. (2018). How to measure informal institutions. Journal of Institutional Economics, 14, 1–22. [Google Scholar] [CrossRef]
  47. Wang, T., & Chen, Y. (2018). Capability stretching in product innovation. Journal of Management, 44, 784–810. [Google Scholar] [CrossRef]
  48. Xu, S., & Yang, Z. (2024). Anti-corruption and firm innovation: Political path dependence perspective. Post-Communist Economies, 36, 906–929. [Google Scholar] [CrossRef]
  49. Yi, J., Teng, D., & Meng, S. (2018). Foreign ownership and bribery: Agency and institutional perspectives. International Business Review, 27, 34–45. [Google Scholar] [CrossRef]
Figure 1. Marginal effects of firm corruption on product innovation at different levels of control of corruption. Panel probit model with random effects.
Jrfm 18 00164 g001
Figure 2. Marginal effects of firm corruption on product innovation in domestic and foreign firms. Panel probit model with random effects. All countries.
Jrfm 18 00164 g002
Figure 3. Marginal effect of firm corruption on product innovation in domestic and foreign firms. Panel linear probability model with random effects. Country Group 1.
Jrfm 18 00164 g003
Figure 4. Marginal effects of firm corruption on product innovation in domestic and foreign firms. Panel probit model with random effects. Country Group 2.
Jrfm 18 00164 g004
Figure 5. Marginal effects of firm corruption on product innovation in domestic and foreign firms. Panel probit model with random effects. Country Group 3.
Jrfm 18 00164 g005
Table 1. Sample of BEEPS dataset.
Number of CountriesNumber of Firms
Country Group 171362
Country Group 283068
Country Group 372738
All countries227168
Source: EBRD’s World Bank Business Environment and Performance Survey (BEEPS).
Table 2. Control of corruption, bribery, and innovation between groups of countries.
Control of Corruption (Average)% Firms Paying a Bribe “to Get Things Done” *% Innovative Firms **
Country Group 10.5964.40%34.82%
Country Group 2−0.3377.68%25.85%
Country Group 3−0.98211.41%22.50%
All countries−0.3758.40%26.27%
* Percentage of firms where FirmCorruption = 1. ** Percentage of firms where Innoprod = 1. Source: World Bank Worldwide Governance Indicators (column 2) and EBRD’s World Bank Business Environment and Performance Survey (BEEPS), columns 3 and 4. Detailed information by country is reported in the Appendix A (Table A1 and Table A2).
Table 3. Corruption and innovative firms within each group.
% Innovative Firms Among Firms Paying Bribes (a) *% Innovative Firms Among Firms not Paying Bribes (b) **“Effect” of Corruption (a)–(b)
Country Group 138.46%34.97%+3.49%
Country Group 235.85%24.20%+11.40%
Country Group 340.32%19.61%+21.19%
All countries38.30%24.75%+13.55%
* Percentage of firms where Innoprod = 1 among the firms where FirmCorruption = 1. ** Percentage of firms where Innoprod = 1 among the firms where FirmCorruption = 0. Source: EBRD’s World Bank Business Environment and Performance Survey (BEEPS).
Table 4. Foreign and domestic firms: corruption and innovation activities in each group of countries.
% Foreign Firms *% Corruption (Domestic Firms) **% Corruption (Foreign Firms) ***% Innovation (Domestic Firms) ****% Innovation (Foreign Firms) *****
Country Group 18.15%4.50%3.19%33.23%53.27%
Country Group 25.74%7.57%9.62%25.17%36.93%
Country Group 36.83%10.71%20.65%21.12%41.40%
All countries6.61%8.12%12.35%25.13%42.43%
* Percentage of firms where Foreign = 1. ** Percentage of firms where FirmCorruption = 1 among the firms where Foreign = 0. *** Percentage of firms where FirmCorruption = 1 among the firms where Foreign = 1. **** Percentage of firms where Innoprod = 1 among the firms where Foreign = 0. ***** Percentage of firms where Innoprod = 1 among the firms where Foreign = 1. Source: EBRD’s World Bank Business Environment and Performance Survey (BEEPS).
Table 5. Corruption between domestic and foreign firms by groups of countries.
% Innovative Firms Among Firms Paying a Bribe
(a) *
% Innovative Firms Among Firms NOT Paying a Bribe
(b) **
“Effect” of Corruption
(a)–(b)
Country Group 1
Domestic firms40.82%33.27%+7.55%
Foreign firms0.00%54.44%−54.44%
Country Group 2
Domestic firms35.03%23.36%+11.67%
Foreign firms46.67%38.30%+8.37%
Country Group 3
Domestic firms36.65%18.63%+18.02%
Foreign firms65.63%34.43%+31.20%
All countries
Domestic firms36.40%23.65%+12.75%
Foreign firms56.00%41.08%+14.92%
* Percentage of firms where Innoprod = 1 among the firms where FirmCorruption = 1 and Foreign = 0 (row above) or Foreign = 1 (row below). ** Percentage of firms where Innoprod = 1 among the firms where FirmCorruption = 0 and Foreign = 0 (row above) or Foreign = 1 (row below). Source: EBRD’s World Bank Business Environment and Performance Survey (BEEPS).
Table 6. Model 1: panel probit model with random effects.
VariablesMODEL1
(Dependent.Var: Innoprod)
FirmCorruption0.176
(0.043)
Controlcorr0.224 ***
(0.041)
FirmCorruption * Controlcorr−0.330 **
(0.136)
Foreign0.272 ***
(0.086)
Competition_20.105
(0.055)
Competition_3−0.378 ***
(0.053)
R&D0.792 ***
(0.061)
Training0.400 ***
(0.048)
Fortech0.203 ***
(0.061)
Export0.243 ***
(0.057)
Size0.027
(0.020)
Wave0.132 ***
(0.043)
Industry dummiesIncluded
Constant−0.518
(0.625)
Statistics
Number of observations5206
Number of groups (firms)3241
Log likelihood −2519.6499
Wald chi2
Prob > chi2
(160) 578.38
0.0000
LR test of rho = 0Chibar2(01) = 2.50
Prob ≥ chibar(2) = 0.057
*** p < 0.01; ** p < 0.05. Standard error in brackets.
Table 7. Estimated marginal effects of FirmCorruption in panel probit (first row) and panel linear probability model (second row).
Domestic Firms
(a)
Foreign Firms
(b)
Country Group 1+0.176 **Not estimable
+0.170 **−0.922 ***
Country Group 2+0.079 **−0.098
+0.070 **−0.093
Country Group 3+0.122 ***+0.163
+0.119 ***+0.170 **
All countries+0.087 ***+0.053
+0.086 ***+0.054
*** p < 0.01; ** p < 0.05.
Disclaimer/Publisher’s Note: The statements, opinions and data contained in all publications are solely those of the individual author(s) and contributor(s) and not of MDPI and/or the editor(s). MDPI and/or the editor(s) disclaim responsibility for any injury to people or property resulting from any ideas, methods, instructions or products referred to in the content.

