Article

US Bank Lending to Small Businesses: An Analysis of COVID-19 and the Paycheck Protection Program

by
Benjamin A. Abugri
1,* and
Theophilus T. Osah
2,*
1
Department of Finance, School of Business, Southern Connecticut State University, New Haven, CT 06515, USA
2
Department of Business Administration, Texas Lutheran University, Seguin, TX 78155, USA
*
Authors to whom correspondence should be addressed.
J. Risk Financial Manag. 2025, 18(5), 231; https://doi.org/10.3390/jrfm18050231 (registering DOI)
Submission received: 28 February 2025 / Revised: 16 April 2025 / Accepted: 24 April 2025 / Published: 26 April 2025
(This article belongs to the Special Issue Contemporary Studies on Corporate Finance and Business Research)

Abstract

:
This paper examines the characteristics of banks and their lending behavior in relation to Paycheck Protection Program (PPP) loans and commercial and industrial (C&I) loans to small businesses during the COVID-19 pandemic. Our findings show that lenders facing greater risk tended to lend more PPP loans, consistent with the risk-aversion theory. Specifically, banks with a higher loan–deposit ratio, lower overall profitability, poorer loan quality, and higher exposure to risks in business (C&I) loans are characterized by higher PPP loans. C&I loans to all businesses are negatively related to the loan–deposit ratio and loan loss allowance ratio, but are positively linked with the capital ratio. However, we find important differences in C&I lending to small businesses versus large businesses. Furthermore, there is evidence regarding the success of targeting PPP loans towards more productive sectors of the US economy. Using FDIC-defined banks’ lending specializations, we show that banks focused on international lending had a limited role in PPP lending.

1. Introduction

The COVID-19 pandemic was different from other economic crises (Berger & Demirgüç-Kunt, 2021; Beck & Keil, 2022). In contrast to most earlier crises, this crisis was an exogenous public health shock that was not engendered by economic or financial forces1; this begs the question of how this shock was transmitted to banks’ lending activities. In other words, established economic relationships may have changed and become convoluted during such crisis episodes. Thus, we address the question of how bank characteristics impacted lending to small businesses over the period of the COVID-19 pandemic.
It is documented that small businesses contribute enormously to product innovation, entrepreneurship, employment, and economic development (Acs & Audretsch, 1990; Rajan & Zingales, 1998; Dilger, 2018; Headd, 2010). However, it is widely reported that while large firms have access to a wide range of financing options, including capital markets, small businesses are mostly limited to bank loans due to higher information asymmetries, high issuing costs, and greater credit risk (Mkhaiber & Werner, 2021; Diamond, 1991). The outbreak of the COVID-19 pandemic potentially exposed and exacerbated the vulnerability of small businesses to this financing structure. This motivates our focus on small businesses, which were arguably the most affected during the COVID-19 crisis. Following the onset of the COVID-19 pandemic, small businesses were confronted with significant declines in demand, inability to organize work remotely using technology, and lack of capacity for social distancing (Berger & Demirgüç-Kunt, 2021). According to Humphries et al. (2020), 60% of small businesses laid off at least one worker as of March 2020.2
In response to crippling financial strains on small businesses caused by the pandemic, the government introduced the Paycheck Protection Program (PPP). This credit guarantee program, administered by the SBA, was created through Section 1102 of the Coronavirus Aid, Relief, and Emergency Services Act (CARES Act) to offer forgivable, guaranteed loans, with a one percent interest rate and a maturity of 2–5 years to small businesses. The program disbursed 954 billion USD mainly through banks and had as its central goal the provision of liquidity to small businesses and the protection of jobs in small businesses.
Using a sample of 5141 banks over the second quarter of 2020 to the fourth quarter of 2021, we examine bank characteristics that affected both Payment Protection Program (PPP) lending and commercial and industrial (C&I) loans to small businesses over the period of the COVID-19 pandemic. Preliminary results through univariate tests suggest that relative to low-PPP lending banks, high-PPP lending banks are characterized by poorer loan quality, lower overall profitability, and a higher loan–deposit ratio. These results appear to offer some preliminary evidence of risk aversion by banks (among others, Marsh & Sharma, 2024; Beck & Keil, 2022; Beauregard et al., 2020) where more (less) risky banks lend more (less) PPP loans. However, high-PPP banks also have higher capital ratios. Banks with high (low) C&I lending to small businesses are associated with higher (lower) loan quality and have higher (lower) equity capital ratios. They also have higher (lower) net interest margins, higher (lower) unused credit line commitments, and are more (less) diversified. In terms of liquidity, banks with high liquidity are more associated with high growth in PPP loans, though these banks were also associated with low growth in commercial and industrial loans to small businesses.
In formal tests, we find that banks that are characterized by lower overall profitability and poor loan quality are associated with higher PPP growth as a percentage of the previous quarter’s total assets. In line with Boeckx et al. (2020), higher loan–deposit ratio banks extended more PPP loans. These results are consistent with the risk-aversion argument postulated by Marsh and Sharma (2024) for US community banks. Interestingly, the capital ratio is not significant, suggesting that the long-term viability of banks did not impact their PPP lending. Furthermore, we find that more diversified banks and more liquid banks in the prior quarter increase PPP lending. Banks with greater exposure to risk in business loans in the previous quarter intensify PPP loans; it is noteworthy that Chodorow-Reich et al. (2022) report an inverse relationship when a contemporaneous relationship is modeled. Therefore, temporal effects may have some moderation on empirically established relationships.
Moreover, we find that, unlike PPP, commercial and industrial loans to all businesses were negatively and significantly related to the loan–deposit ratio and loan loss allowance ratio. Additionally, the coefficient of capital (equity) ratio is positive and significant, while it is not significant for PPP. These results lend some support to the risk aversion theory; that is, banks facing greater solvency risk reduce commercial and industrial loans to both small and large businesses since this loan market bears credit risk, unlike PPP loans.
Detailed analyses reveal that using the aggregated commercial and industrial loans, to some extent, mask interesting differences between loans directed to large and small businesses. First, banks with higher overall profitability increased commercial and industrial loans to large businesses while reducing the same to small businesses that were potentially more exposed to credit risk during the crisis. Second, more diversified banks increased commercial and industrial loans to small businesses. Third, banks with higher liquidity reduced lending, in general, to small businesses; however, these liquid banks channeled more of their cash towards the safer PPP relative to the riskier commercial and industrial loans to small businesses.
We verify the robustness of our main results in a variety of ways. First, we re-examine our inferences by including direct measures of bank risk, namely, z-score and coefficient of variation. These analyses reveal two main findings. That is, our inferences are largely unaffected. Moreover, banks facing higher insolvency risk increased PPP lending relative to the riskier commercial and industrial lending. In other tests, we employ a one-step difference Generalized Method of Moments (GMM) model to re-estimate our baseline regression. Next, we include state fixed effects to account for heterogeneity in infection rates across states in the US. Though scaling lending with total assets controls size differences across banks, we include the logarithm of total assets to further verify that size differences are not leading to spurious results. Strikingly, by including size in the regressions, the capital ratio becomes negative and statistically significant in the PPP regression, while it is still positive for the commercial and industrial lending regression specifications. These suggest that banks with a lower equity capital–total assets ratio intensified PPP lending while reducing commercial and industrial loans lending, in line with the risk aversion supposition.
Using a subsample analysis where banks are stratified by the level of Tier 1 capital ratio, our conclusion about the risk aversion argument is corroborated, though it is unclear for commercial and industrial loans to small businesses. To be precise, for less capitalized banks relative to more capitalized banks, the banks with a higher loan–deposit ratio, lower overall profitability, and higher loan loss provision experience a higher speed of adjustment to PPP and commercial and industrial loans to large businesses. We also provide further analyses on how the lending specialization of banks, as defined by the FDIC, impacted their lending behavior to small businesses during the pandemic. We find that banks with a focus on agriculture and commercial and industrial loans offered considerably higher PPP loans as a percentage of total assets. The economic significance of this result is that it highlights an outcome that is consistent with the intended policy of the PPP to target the productive sectors of the economy to save jobs.
The remainder of this paper is organized as follows: Section 2 presents some of the literature and background on the Small Business Administration, as well as small business and PPP lending. Section 3 describes the data and presents descriptive analysis; Section 4 introduces the estimation model; Section 5 presents the empirical results; and Section 6 presents the conclusions and policy implications.

2. Literature Review

Despite the enormous impact of small businesses on the economy through entrepreneurial activity, innovation, and job creation (Acs & Audretsch, 1990; Kuratko & Hodges, 1998; Headd, 2010; Kobe, 2012), they are confronted with unique challenges in terms of access to finance, compared with large businesses. Thus, they are typically limited to bank loans due to higher information asymmetries, lack of collateral security, and more ‘erratic’ cash flows (Orzechowski, 2020; Mkhaiber & Werner, 2021; Diamond, 1991). The outbreak of the coronavirus disease pandemic, COVID-19, in March 2020, greatly compounded the challenge of access to financing confronting small businesses. Furthermore, economic activities took a drastic downturn with the attendant loss of sales and employment as firms, mostly small businesses, failed or faced bankruptcy. The Paycheck Protection Program (PPP), as part of the CARES ACT enacted in March 2020, was thus designed to alleviate the economic quagmire of small businesses by protecting jobs.3 The PPP was administered by the Small Business Administration (SBA).
In total, Congress has appropriated a total of 954 billion USD in funds for PPP on three separate occasions since March of 2020, inclusive of the CARES Act funding.4 Eligible U.S. firms are required to have 500 or fewer employees, while borrowing limits were determined largely by average monthly payroll costs. Though PPP was intended to cover employee expenses or payroll, it could also cover rent, mortgage interest on existing loans and leases, and utility payments. However, forgiveness requires that a substantial part of the funds be used for payroll costs. The PPP initially relied on banks to fund loans with private capital. Subsequently, as the loans were forgiven or defaulted, the initial private capital investment by the banks was reimbursed by the SBA.
The PPP has spawned a burgeoning body of literature since it was introduced. Several studies have attempted to understand the impact and implications of PPP. A large stream of studies examines the effects of the program on labor employment—firm-level or aggregate employment (among others, Autor et al., 2022; Chetty et al., 2023; Hubbard & Strain, 2020; Li & Strahan, 2021). Berger et al. (2021) observe that the effects of PPP—better access to credit and stable employment—were only short-term in nature, consistent with the inherent short-term design of the program. Other studies find that PPP increased firms’ probabilities of survival (Bartik et al., 2020; Hubbard & Strain, 2020). Additionally, researchers consider the lending behavior of banks in relation to PPP. Li and Strahan (2021) find that banks utilized existing relationships to make PPP lending decisions, while Chodorow-Reich et al. (2022) report that PPP alleviated lending supply contraction experienced by small firms as a result of the COVID-19 shock. Marsh and Sharma (2024) consider US community banks to study the factors underlying the decision to participate in the PPP and the determinants of the intensity of participation by banks. They document that banks with lower leverage capital ratios, and, therefore, ex-ante riskier banks, were more likely to participate in and originate more PPP loans relative to the size of their total lending portfolio. Thus, they suggest that a risk-aversion channel drives PPP decision-making by community banks. Unlike Marsh and Sharma (2024), who concentrate on PPP and commercial and industrial lending by community banks, we consider all US banks. Our consideration of all banks is motivated by our interest in conducting sub-sample analysis for large banks, including systemically important banks (SIBs), thus improving on the Marsh and Sharma (2024) study. We also separately examine commercial and industrial lending to small businesses relative to large businesses.
The risk aversion theory is further supported by Beck and Keil (2022), who examine how loan portfolio performance and growth in PPP and small business lending vary with banks’ geographic exposure to the COVID-19 outbreak and lockdown policies. They find that total small business lending volume growth, including PPP loans, increased but decreased when PPP lending is excluded. According to the authors, a possible explanation is that banks whose loan portfolios were more negatively impacted may tend to switch towards PPP lending; thus, PPP essentially served as a subsidy for banks with deteriorating financial conditions. Beauregard et al. (2020) also find results that align with this line of reasoning; they report that banks with fewer core deposits and lower capital ratios intensify PPP lending. The findings by Boeckx et al. (2020) offer some support to the risk-aversion argument. Their study of credit support policies by the European Central Bank to banks during the Global Financial Crisis suggests that smaller banks that depended on unsecured wholesale funding increased lending; however, banks with low levels of capital responded less to the credit policies, contrary to the risk-aversion channel.
There are papers that suggest that PPP had a substitution or complementary effect on conventional lending (Beck & Keil, 2022). Possibly, PPP may essentially substitute for other loans from financial institutions, while impacting only minimally on small business funding. Thus, some empirical studies suggest substitution effects of PPP (Chodorow-Reich et al., 2022). Conversely, PPP funds likely improved the creditworthiness of beneficiaries, thus enabling them to borrow more conventional credit (Karakaplan, 2021). Therefore, PPP may have a complementary effect on conventional lending (Karakaplan, 2021; Berger et al., 2023; Marsh & Sharma, 2024). There are also studies that highlight whether PPP has reached the appropriate sectors or regions. A theoretical study by Joaquim and Netto (2021) points out the potential for misallocation of the PPP funds to firms by banks. Granja et al. (2022) find evidence that PPP funds were utilized for non-payroll fixed payments and to build up buffer savings, and that this misuse can account for small employment effects. Griffin et al. (2023) find that fraud was considerably prevalent in the distribution of PPP funds by FinTech firms. Some empirical studies also report evidence in line with PPP disbursements prioritizing firms with existing bank relationships (e.g., Amiram & Rabetti, 2020; Bartik et al., 2020; Balyuk et al., 2021; Li & Strahan, 2021), which, according to Granja et al. (2022), helps explain why some funds initially flowed to regions that were less adversely impacted by the pandemic. Berger and Demirgüç-Kunt (2021) contend that while priorities given to relationship borrowers make it more efficient to lend to known borrowers with histories of repayment, this could also aggravate existing inequities in the distribution of conventional bank loans. Additional research suggests that PPP funds may have been allocated to some extent according to political connections (Duchin & Hackney, 2021; Berger et al., 2023).

3. Methodology

3.1. Data and Sample

We downloaded quarterly data on individual banks’ PPP, commercial and industrial loans to all businesses (CIL), commercial and industrial loans to small businesses (CILS), and balance sheets from the Federal Deposit Insurance Corporation (FDIC) website. These data come from the Reports of Condition and Income filed by each bank with the Federal Reserve System. Initially, our sample was made up of 40,387 bank-quarter observations covering data from 5141 banks over the first quarter of 2020, when COVID-19 struck, to the fourth quarter of 2021. However, after addressing missing PPP data for some banks in the sample, we ended up with 34,827 bank-quarter observations. Data on real GDP growth rate was sourced from the Bureau of Economic Analysis of the US Department of Commerce, and data on total COVID-19 cases is from the US Center for Disease Control and Prevention.
Table 1 presents summary statistics for variables used in the study, as well as preliminary evidence of differences in bank characteristics with regard to PPP and commercial and industrial loans to small businesses. Panel A shows that the average loan loss allowance, LLOSS, is 1.35% of the total loan and lease. The average capital ratio of 11.2% is quite high. Banks experienced an average overall profitability of 1.08%, though profit from their intermediation activities (NIM) was relatively and considerably higher at 3.4%. NONII, income from non-interest income comprised 0.7% of total assets, while the average LIQUIDITY is 27.3%. The average LDR is 71.1%, which is lower than the typical optimal average, according to anecdotal evidence, of 80–90% for US banks. The average growth rate in PPP as a percentage of the previous quarter’s total assets (G_PPP) is 0.19%, while the corresponding rate for CILS (G_CILS) is 0.29%. However, G_CILL is −0.14%, which indicates that lending to large businesses experienced a decline, on average, over the sample period.
Panel B in Table 1 presents the mean differences in the characteristics of banks with low versus high lending to small businesses. High (low) PPPs are those with growth in PPP-to-assets ratio higher (lower) than the sample median. Similarly, high (low) CILS are banks with growth in the CILS-to-assets ratio higher (lower) than the sample median. In Panel B1, we observe that relative to low PPP banks, high PPP banks have poorer loan quality (LLOSS), lower capital ratio (CARATIO), lower overall profitability (ROA), more unused credit lines (UCLN), and are more diversified (NONII). Furthermore, high PPP banks use less core deposit funding (LDR), suggesting that these banks rely more heavily on non-deposit sources of funds, which are riskier because their availability and price are much more sensitive to changing economic or financial conditions. The viability of such banks was threatened following the failure of the investment banking giant Lehman Brothers in September 2008. Characteristics of high PPP banks, such as poorer loan quality, lower overall profitability, and higher loan-deposit ratios, seem to suggest that these banks are riskier relative to low PPP banks, although high PPP banks also have higher capital ratios. Panel B2 shows that banks with high CILS are associated with higher loan quality (lower LLOSS) and have higher capital ratios (CARATIO). They also have higher net interest margins (NIM), higher unused credit line commitments (UCLN), and are more diversified (higher NONII). In terms of the LIQUIDITY variable, the preliminary results in Table 1 indicate that banks with high liquidity are more associated with high growth in PPP loans and are, on the other hand, associated with low growth in commercial and industrial loans to small businesses.

3.2. Trends in Lending

We begin by examining the trends in key variables used in the study. Figure 1 shows the movements in five aggregate variables of lending by US banks to businesses over 2020Q1 to 2021Q4. The variables are commercial and industrial loans to all businesses (CIL), PPP loans to small businesses (PPP), commercial and industrial loans to small businesses (CILS), CIL excluding PPP (NCIL), and CIL to large businesses (CILL).
Figure 1 indicates that after the COVID-19 outbreak in 2020Q1, CIL, surprisingly, increased substantially by 340 m USD in 2020Q2 and only began to fall subsequently. However, we observe that when we account for PPP, the drop in actual CIL (NCIL) occurred earlier, immediately after 2020Q1. Specifically, NCIL experienced a sharp fall from a high of 2570 m USD in 2020Q1 to 2210 m USD in 2020Q2. NCIL continues to decline between 2020Q2 and 2020Q3, though the rate of decline decreases considerably; the reduction in the rate of decline coincides with the introduction of the PPP in 2020Q2. The decrease in CIL and NCIL observed during this period is likely attributable to many businesses using the cheaper PPP instead of relatively expensive commercial and industrial loans. From the lenders’ perspective, the sharp decline in commercial and industrial loans suggests a risk-aversion behavior by banks. They opted to lend less of the riskier commercial and industrial loans and substituted them with the less risky PPP federally guaranteed loans. This conjecture is supported by some recent studies that find that PPP lending to small businesses led to a contraction in demand for commercial and industrial loans while banks tightened their term lending (Ennis & Jarque, 2021; Chodorow-Reich et al., 2022; Greenwald et al., 2020). Marsh and Sharma (2024) also suggest that PPP allowed banks to earn a modest amount of income without risking their own capital.
The total PPP was 485 m USD at the start of the program in 2020Q2, as the first and second rounds of PPP were implemented. It increased marginally to 491 million USD in 2020Q3, before declining to 408 million USD in 2020Q4 after the end of initial disbursements of the PPP on August 8 (See note 4 above). However, PPP rose to 471 million USD in 2021Q1 after the enactment of the Consolidated Appropriations Act in December 2020 for a third round of disbursement of an amount of 284 billion USD. Subsequently, banks’ PPP outstanding loan balances decline for the rest of the sample period due to repayment by borrowers and forgiveness of Paycheck Protection Program (PPP) loans by the Small Business Administration.
As NCIL dropped dramatically in the first half of 2020, CILS experienced a marked upturn over the same period and subsequently decreased when PPP was introduced. For most of the period, total CILS balances have fluctuated; however, we observe an interesting trend. Starting from the second quarter of 2021, both CILS and PPP have generally trended downward at a time when the COVID-19 panic and the attendant uncertainties started to subside with the introduction of COVID vaccines, which helped stabilize the economy; almost at the same time, NCIL started to experience an uptick. Thus, it appears the substitution effect was not only limited to CIL-PPP (Ennis & Jarque, 2021; Chodorow-Reich et al., 2022) but was also prevalent between CIL and CILS. We also note that the recovery in NCIL may be driven by a dramatic increase of 223 m USD in 2021Q3 in CILL. It is noteworthy that CILL only reduced marginally over the sample period after the COVID-19 outbreak. A possible explanation is that large businesses are safer relative to small businesses, and this distinction becomes even more pronounced during crisis periods since large businesses have better access to the capital market. This observation further motivates this paper’s emphasis on small businesses.

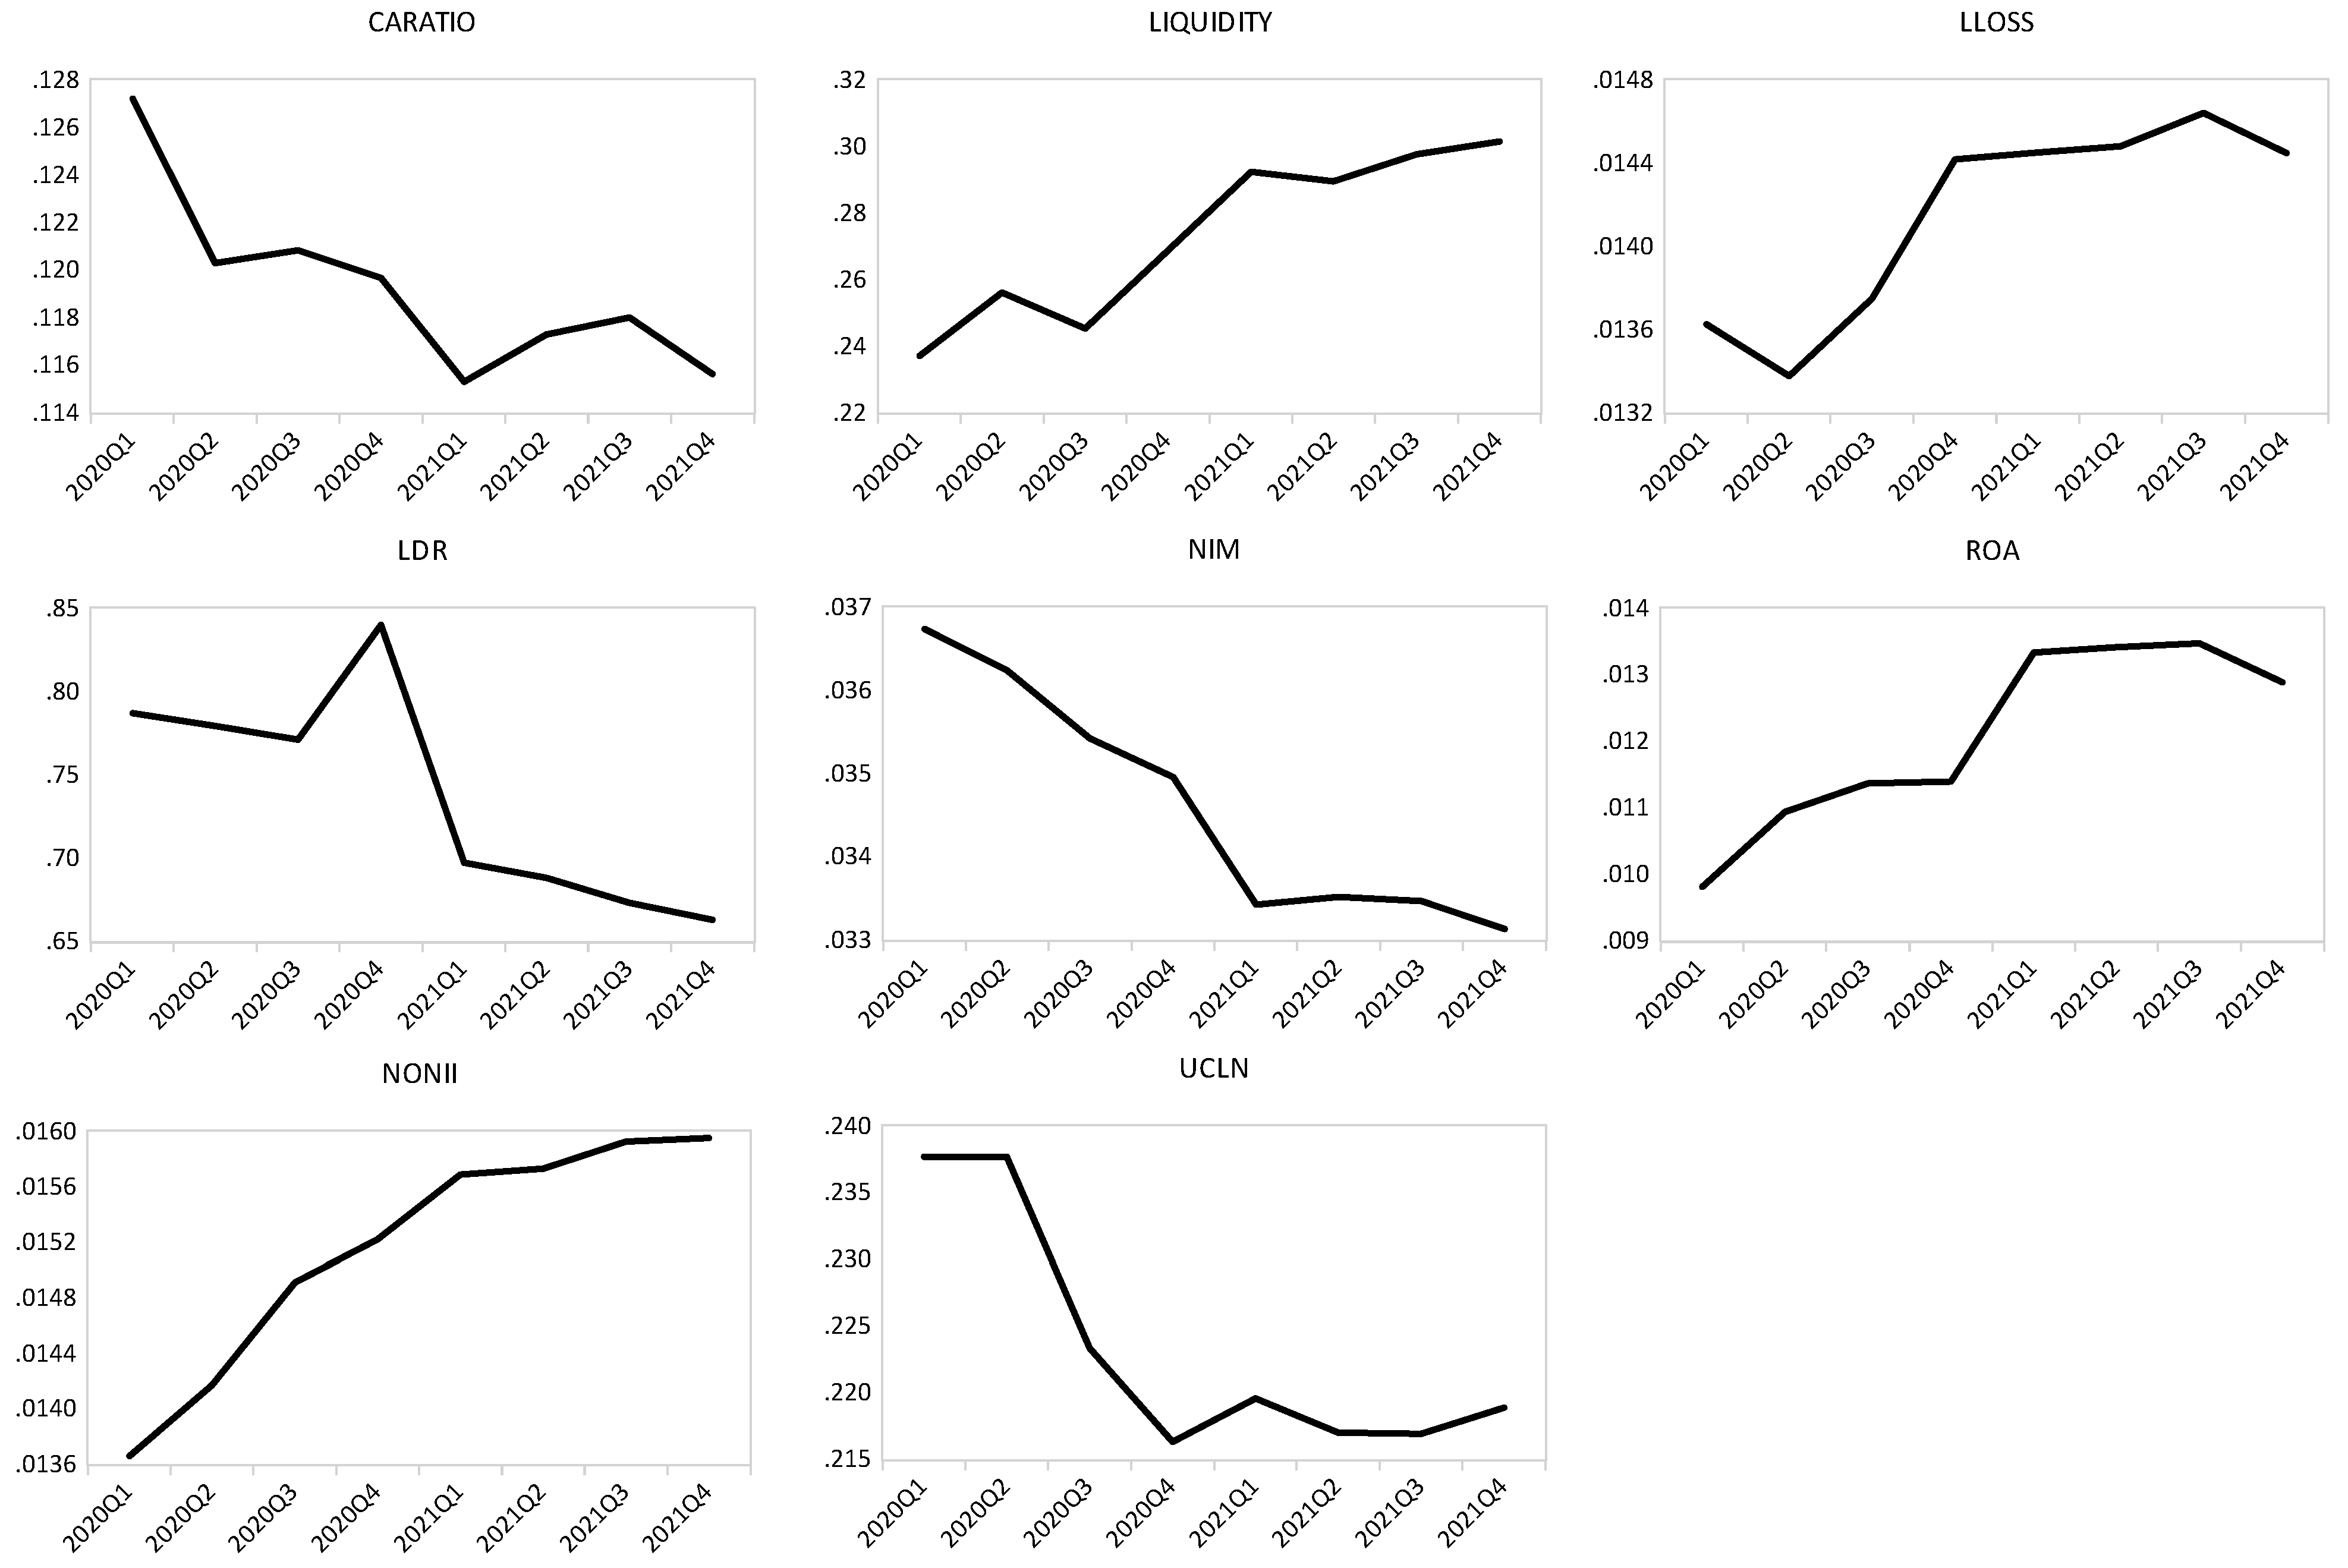
3.3. Trends in Key Bank Characteristics

Figure 2 provides a visual representation of movements in industry-wide bank characteristics, including risk indicators, profitability, and liquidity. We observe that capital ratio (CARATIO) and loan–deposit ratio (LDR) generally decreased while liquidity (LIQUIDITY) increased over the period. According to S&P Global5, aggregate loan-to-deposit ratio at U.S. banks has dropped sharply since the onset of the COVID-19 pandemic and reached 58% in the second quarter of 2021; this is attributable to a surge in deposits from government relief efforts and an increase in the savings rate. Aggregate loan loss allowance ratio (LLOSS) initially decreased in 2020Q2 as the PPP was implemented, but rose as the market realized the COVID-19 pandemic was going to last much longer than expected; this may have compelled banks to increase their provisions for losses due to potential defaults. This corroborates the 2020 November Financial Stability Report of the Board of Governors of the Federal Reserve System, which documents that the quality of commercial and industrial loans in banks’ portfolios deteriorated noticeably in the second and third quarters of 2020. The average loan-to-deposit ratio (LDR) generally dropped but experienced a sharp increase in 2020Q4. Surprisingly, overall profitability, ROA, grew over the period despite the heightened uncertainties. We determined that this was due to increases in non-interest income, NONII, as profits from core activities of banks, NIM, declined. Similarly, Sengupta and Byrdak (2021) report that, over the period, ROA increased possibly because of a rising NONII, though NIM was on a downward trajectory. Declining loan yields compounded by near-zero rates on PPP and a slowdown in loan growth resulted in reduced NIMs overall (Sengupta & Byrdak, 2021). Measures undertaken by the Federal Reserve to reduce interest rates in the wake of the COVID-19 outbreak also contributed to the fall in NIM. It appears in Figure 2 that there is a negative relationship between NIM and NONII. Unused credit lines, UCLN, experienced a marked downturn between 2020Q2 and 2020Q4 as businesses rushed to take down their credit lines for much-needed funds to cushion their liquidity.

Estimation Model

The univariate results reported in Table 1 do not directly test relationships between variables or account for other potential relationships. Thus, we formally examine the impact of the previous quarter’s firm-level bank characteristics on lending during the COVID-19 period from 2020Q1 to 2021Q4. Our estimated model is specified in Equation (1) below:
G _ L E N D i , t = β 0 + β 1 L D R i , t 1 + β 2 C A R A T I O i , t 1 + β 3 N I M i , t 1 + β 4 R O A i , t 1 + β 5 L L O S S i , t 1 + β 6 U C L N i , t 1 + β 7 N O N I I i , t 1 + β 8 L I Q U I D I T Y i , t 1 + β 9 G _ G D P t 1 + β 10 G _ C O V I D t 1 + ε i , t 1
A complete list of all variables and their definitions is presented in Appendix A, Table A1. In Equation (1), we account for a set of bank characteristics that are known to influence bank lending. Generally, banks with greater liquidity (LIQUIDITY), higher overall profitability (ROA), and net interest margin (NIM) are expected to increase lending. Banks that have a weaker capital position (CARATIO) have higher bankruptcy risk and, thus, have less capacity to increase lending (Sharpe & Acharya, 1992; Brewer et al., 2000). LLOSS (loan loss allowance-to-previous quarter’s total assets) controls for credit risk. An increase in LLOSS reflects an expected increase in credit risk and so is associated with a decrease in a bank’s willingness to lend, reducing commercial and industrial loan growth (Sharpe & Acharya, 1992). Loan-deposit ratio (LDR) relates a bank’s loans to its deposits. Deposits are regarded as a source of fundamental and steady funding for banks. Therefore, if a bank overextends deposits, they must resort to non-deposit sources of funds such as the interbank market, repurchase agreements, commercial paper and others, of which the availability and price are more sensitive to economic conditions relative to deposit funds (Disalvo & Johnston, 2017); hence, in a sense this ratio is like the leverage ratio. For example, banks with higher LDR were substantially more vulnerable to bankruptcy risk during the global financial crisis (Cecchetti et al., 2011). Banks with higher LDR are presumed to be riskier and are expected to lend less. From the lender’s perspective, UCLN (unused credit line-to-previous quarter’s total assets) is an off-balance sheet measure for risk taking. Generally, risk-seekers are expected to increase lending growth (Brewer et al., 2000); however, it is also possible that in economic downturns with resultant new credit squeeze, borrowers begin to draw down on unused credit lines, leading to a positive impact on outstanding bank loans. Increased non-interest income (NONII) may allow banks to maintain profitability by stabilizing income through diversification, potentially resulting in aggressive lending in the future. However, the relationship between non-interest income and bank risk is mixed (Abedifar et al., 2018; Calmès & Théoret, 2015; Santomero & Chung, 1992); thus, the coefficient of NONII may be positive or negative.
Real GDP growth rate, G_GDP, should be positively associated with conventional lending, such as commercial and industrial loans. On the other hand, we expect G_GDP to be negatively associated with the PPP that was introduced as the economy experienced a downturn. Given the supply chain constraints and general economic disruptions during the pandemic, we expect the growth in COVID-19 cases (G_COVID) to be negatively associated with conventional bank lending but positively related to PPP loans. In addition to using these theoretically and empirically relevant variables, our model specifications include year and bank fixed effects. Inclusion of time and firm fixed effects is a generalization of the difference-in-differences, which improves causal interpretation in a regression (See Bertrand & Mullainathan, 2003; Angrist & Pischke, 2009; Armstrong et al., 2012; Khan et al., 2016). Fixed effects models also control for omitted variable bias.

4. Empirical Results

As a starting point of our empirical investigation, we estimate Equation (1) and report the results in Table 2. First, we consider the growth in PPP lending as a percentage of the previous quarter’s total assets (G_PPP) in Column 1. Consistent with the univariate analyses in Table 1, we find that banks with greater LDR and higher LLOSS participate more intensively in PPP lending. Specifically, a one-standard deviation (285.83%) increase in LDR (coef. = 0.013, t-stat. = 3.80) is associated with a 3.72%6 increase in G_PPP. Similarly, a one standard deviation (1.04%) increase in LLOSS (coef. = 0.332; t-stat. = 2.49) raises G_PPP by 0.35%. In contrast, the impact of ROA is significant and negative; that is, a one-standard deviation (5.77%) decline in overall profitability (coef. = −0.391, t-stat. = −5.92) leads to a 2.26% increase in G_PPP. In sum, these results lend support to the risk-aversion channel of PPP (among others, Marsh & Sharma, 2024; Beck & Keil, 2022; Beauregard et al., 2020); that is, lenders facing greater risk in terms of higher loan–deposit ratio, lower overall profitability, and poorer loan quality were likely to lend more PPP loans. This is because the guaranteed PPP loans allow banks to earn a modest income while not risking their own capital. Additionally, a PPP loan may minimize the need for borrowing firms to draw down their existing line of credit. Consequently, a riskier bank would prefer to extend PPP loans, which protect against capital loss and drawdown of unused loan commitments in the face of escalating borrower uncertainty.
Furthermore, we find that more diversified banks (higher NONII) increase PPP lending. Since expected loan default risk increased during the pandemic, more diversified banks, relative to less diversified banks, were more likely to invest in other sources of income besides traditional lending. In this vein, these banks might have decided to capitalize on fees from PPP lending, which may be considered non-traditional lending. To explain this finding through the lens of risk-aversion, we argue that NONII makes banks riskier and therefore encourages them to intensify PPP lending. However, pre-COVID-19 empirical evidence on the relationship between non-interest income and bank risk is inconclusive (Abedifar et al., 2018; Calmès & Théoret, 2015; Santomero & Chung, 1992).
Additionally, in line with Marsh and Sharma (2024), we find that more liquid banks in the prior quarter tend to intensify PPP lending. Beauregard et al. (2020) also find that banks with more liquid assets were associated with higher PPP lending as a percentage of total small business and farm lending. Moreover, they explain that the Federal Reserve actions, including the availability of the PPP Liquidity Facility for banks and stimulus payments to households, made more funds available for banks to lend to PPP borrowers. In Column 2 of Table 2, we account for exposure to risks in business loans by including NCIL as an additional control variable in the G_PPP specification. According to the FDIC, PPP loans are included within the balances on the Net Loans and Leases Report (FFIEC Call Report Schedule RC-C). Therefore, to calculate NCIL, we exclude PPP from commercial and industrial loans. We find that our inferences above do not change.
Banks with greater NCIL in the previous quarter intensified PPP lending, consistent with the risk aversion proposition. Banks with higher exposure to risks in business loans (NCIL) face an elevation in that exposure because of potential defaults by businesses in a crisis such as the pandemic, hence the increase in the less-risky PPP lending. However, Chodorow-Reich et al. (2022) suggest a contemporaneous and inverse relationship between PPP and NCIL, consistent with our observation in Figure 1. Thus, we use a contemporaneous NCIL in Column 3 instead of a lagged NCIL. We find a significant and negative contemporaneous effect of NCIL on PPP lending, indicating that the link between PPP and NCIL depends on whether it is modeled as a lagged or contemporaneous relationship.
Next, we turn to the growth in commercial and industrial loans to small businesses as a percentage of last quarter’s total assets (G_CILS) in Column 4. LIQUIDITY is found to be negative and significantly related to G_CILS. This corroborates the preliminary evidence in Table 1, which suggests that more liquid banks are positively associated with growth in PPP loans while negatively related to growth in CILS. We also observe that banks with lower overall profitability (ROA) tend to lend more commercial and industrial loans to small businesses, as in the case of PPP. However, the risk aversion channel is largely unsupported for CILS because LDR and LLOSS have significant and negative relationships with CILs, while the impact of CARATIO is positive and significant. This is not surprising given that CILS are conventional commercial and industrial loans to small businesses, which carry credit risk, unlike the safe PPP lending. In other words, CILS behavior is more likely to reflect conventional commercial and industrial loans to large businesses (CILL) since they both bear credit risk. Thus, we verify the implication of credit risk for the CILL loan market by using G_CILL, which is computed by first subtracting both PPP and CILS from CIL. We then calculate G_CILL as the change in CILL as a percentage of the previous quarter’s total assets. Without excluding small business loans and PPP, we note in Column 5 that commercial and industrial lending behavior generally corresponds with that of PPP. That is, G_CIL is positively and significantly related to LDR, LLOSS, NONII, and LIQUIDITY, while it is negatively and significantly associated with ROA. On the other hand, CARATIO is positively associated with G_CIL. In Column 6, when we use G_CILL instead, CARATIO maintains its positive impact. However, it is noteworthy that the sign of several variables flips. For instance, LDR is now negative, implying that banks that relied more on core deposits as a source of funds increased lending to larger businesses. Therefore, the results suggest a similar lending behavior for both CILL and CILS. The point of departure is in their response to ROA. Higher overall profitability (ROA) increases CILL but decreases CILS. This suggests that while more profitable banks extended more lending to large businesses, they were less motivated to lend to small businesses that were riskier during the crisis of the COVID-19 pandemic. Taken together, the results for commercial and industrial lending, in general, lend support to the risk aversion channel. The intuition is that if weaker banks intensify the less-risky PPP lending, then we should expect that stronger banks would be more willing to lend to the riskier commercial and industrial loans market, as our results suggest.
We find that the growth in COVID-19 cases, G_COVID, is positively related to PPP but negatively associated with CILL over the period, as expected. Interestingly, the coefficient of G_COVID is positive in the CILS specification. Though credit line drawdowns may be a plausible explanation, there may be other contributory causes, given that large loans experience declines despite credit line drawdowns. PPP lending enabled small businesses to pay off existing bank credit loans, thus improving their credit quality to access more CILS (Chodorow-Reich et al., 2022).
As a robustness check, we account for wide variation in the number of COVID-19 cases across states—for instance, in 2021Q1, Arkansas had a total of 60,538 COVID-19 cases relative to the astronomical number, 2,783,305 cases, in Texas. When we include state fixed effects, in addition to bank and year fixed effects, we find that the results, available upon request, are both quantitatively and qualitatively similar to the baseline results without state fixed effects in Table 2.

4.1. Further Analyses of the Risk Aversion Channel

Our findings, thus far, suggest a risk-aversion channel where riskier banks intensified PPP lending while scaling down commercial and industrial lending. We explore this argument further through a subsample analysis where we classify banks with common equity tier 1 capital ratio above (below) the sample median as low risk (high risk) banks in Table 3.7 Next, we re-estimate Equation (1) for the three types of loans: PPP, CILS, and CILL. We posit that the risk-aversion argument suggested in Table 2 should be stronger for banks that are less capitalized, that is, the high-risk group of banks. We confirmed the significance of the difference in coefficients between the subsamples of low-risk and high-risk banks using chi-square tests8. Panel A shows that high-risk banks, as proxied by higher LDR, lower ROA, and higher LLOSS, adjust to PPP lending faster than low-risk banks. For CILS in Panel B, the risk aversion argument is unclear. For instance, while lower overall profitability raises the speed of adjustment of high-risk banks to CILS, lower capital ratios and higher loan–deposit ratios achieve the opposite effect, contrary to the risk aversion theory. On the other hand, though, Panel C suggests that banks reduce the riskier CILL in response to higher loan–deposit ratio, lower overall profitability, and poorer loan portfolio quality, and the speed of adjustment is greater for high-risk banks. This further corroborates the risk aversion story. An alternative explanation instead of the risk aversion argument is that small banks, relative to large banks, may be more likely to serve small and medium-sized enterprises, and since small banks have higher risks in various aspects, this ultimately leads to positive association between bank risk and lending for small business, in particular, PPP lending.9 First, it is noteworthy that the results in Table 2, Table 3, Table 4, Table 5 and Table 6 include large banks, and this somewhat alleviates this possibility. Second, going by this line of reasoning, we should not expect a significant difference in the PPP lending behavior between our low- and the safer high-tier 1 capital group. However, in unreported results, we find the exact opposite result, consistent with the subsample inferences in Table 3, after excluding large banks10 and re-estimating the regressions in Table 3. Beck and Keil (2022) also examine subsamples of banks with high pre-COVID-19 capitalization (above median) and low pre-COVID-19 capitalization (below median). They report some evidence that less capitalized banks tended to intensify PPP lending more.
Additionally, we examine the risk aversion argument by using more direct proxies and traditional measures of bank risk, namely, z-score and coefficient of variation. Z-score is widely used in studies of bank risk and insolvency. It reflects a bank’s probability of insolvency (Sinkey & Nash, 1993). Other studies consider it a measure of risk-adjusted performance (De Nicoló, 2000; Stiroh, 2004a, 2004b). The underlying principle of the z-score measure is to determine to what extent a bank’s earning variability can be absorbed by its capital and ROA without becoming insolvent. Higher values of z-score imply lower bankruptcy risk. In line with Lepetit and Strobel (2015), Beck and Laeven (2006), and Hesse and Čihák (2007), we define Z-SCORE as the sum of current period values of ROA and equity-to-asset ratio, scaled by the standard deviation of ROA computed over the full sample.
We augment Equation (1) with Z-SCORE and report the results in Table 4. In Column 1, we find that banks with a higher risk of bankruptcy (lower Z-SCORE) are associated with higher growth in PPP lending (coef. = −0.028; t-stat. = −14.05). Conversely, Column 3 shows that these high insolvency risk banks tend to reduce C&I lending to large businesses (coefficient = 1.147; coefficient = 4.75) as expected, since market conditions and uncertainties were aggravated during the outbreak of the COVID-19 pandemic. The coefficient on Z-SCORE for C&I lending to small businesses is, however, not significant. In an alternative test, we use the coefficient of variation, CV, as a measure of bank risk. CV is measured as the standard deviation of quarterly net income, divided by the mean over the past 12 quarters. Column 4 indicates that CV has a positive and statistically significant relationship (Coef. = 0.600; t-stat. = 2.78) with PPP lending, though the relationship is not significant for C&I lending to small businesses and large businesses in Columns 5 and 6, respectively. Collectively, using direct proxies of bank risk, we find evidence that riskier banks intensified the safer PPP lending relative to the riskier C&I loans to small businesses, thus lending some support to the risk aversion argument. It is likely that during the COVID-19 pandemic, some businesses identified the risk to banks and thus reduced their CIL; however, this was more likely to be the case for G_CILL than for G_CILS. However, initial evidence from the current shock suggests that loan demand has increased substantially, with many firms drawing down credit lines or tapping capital markets (Acharya & Steffen, 2020).

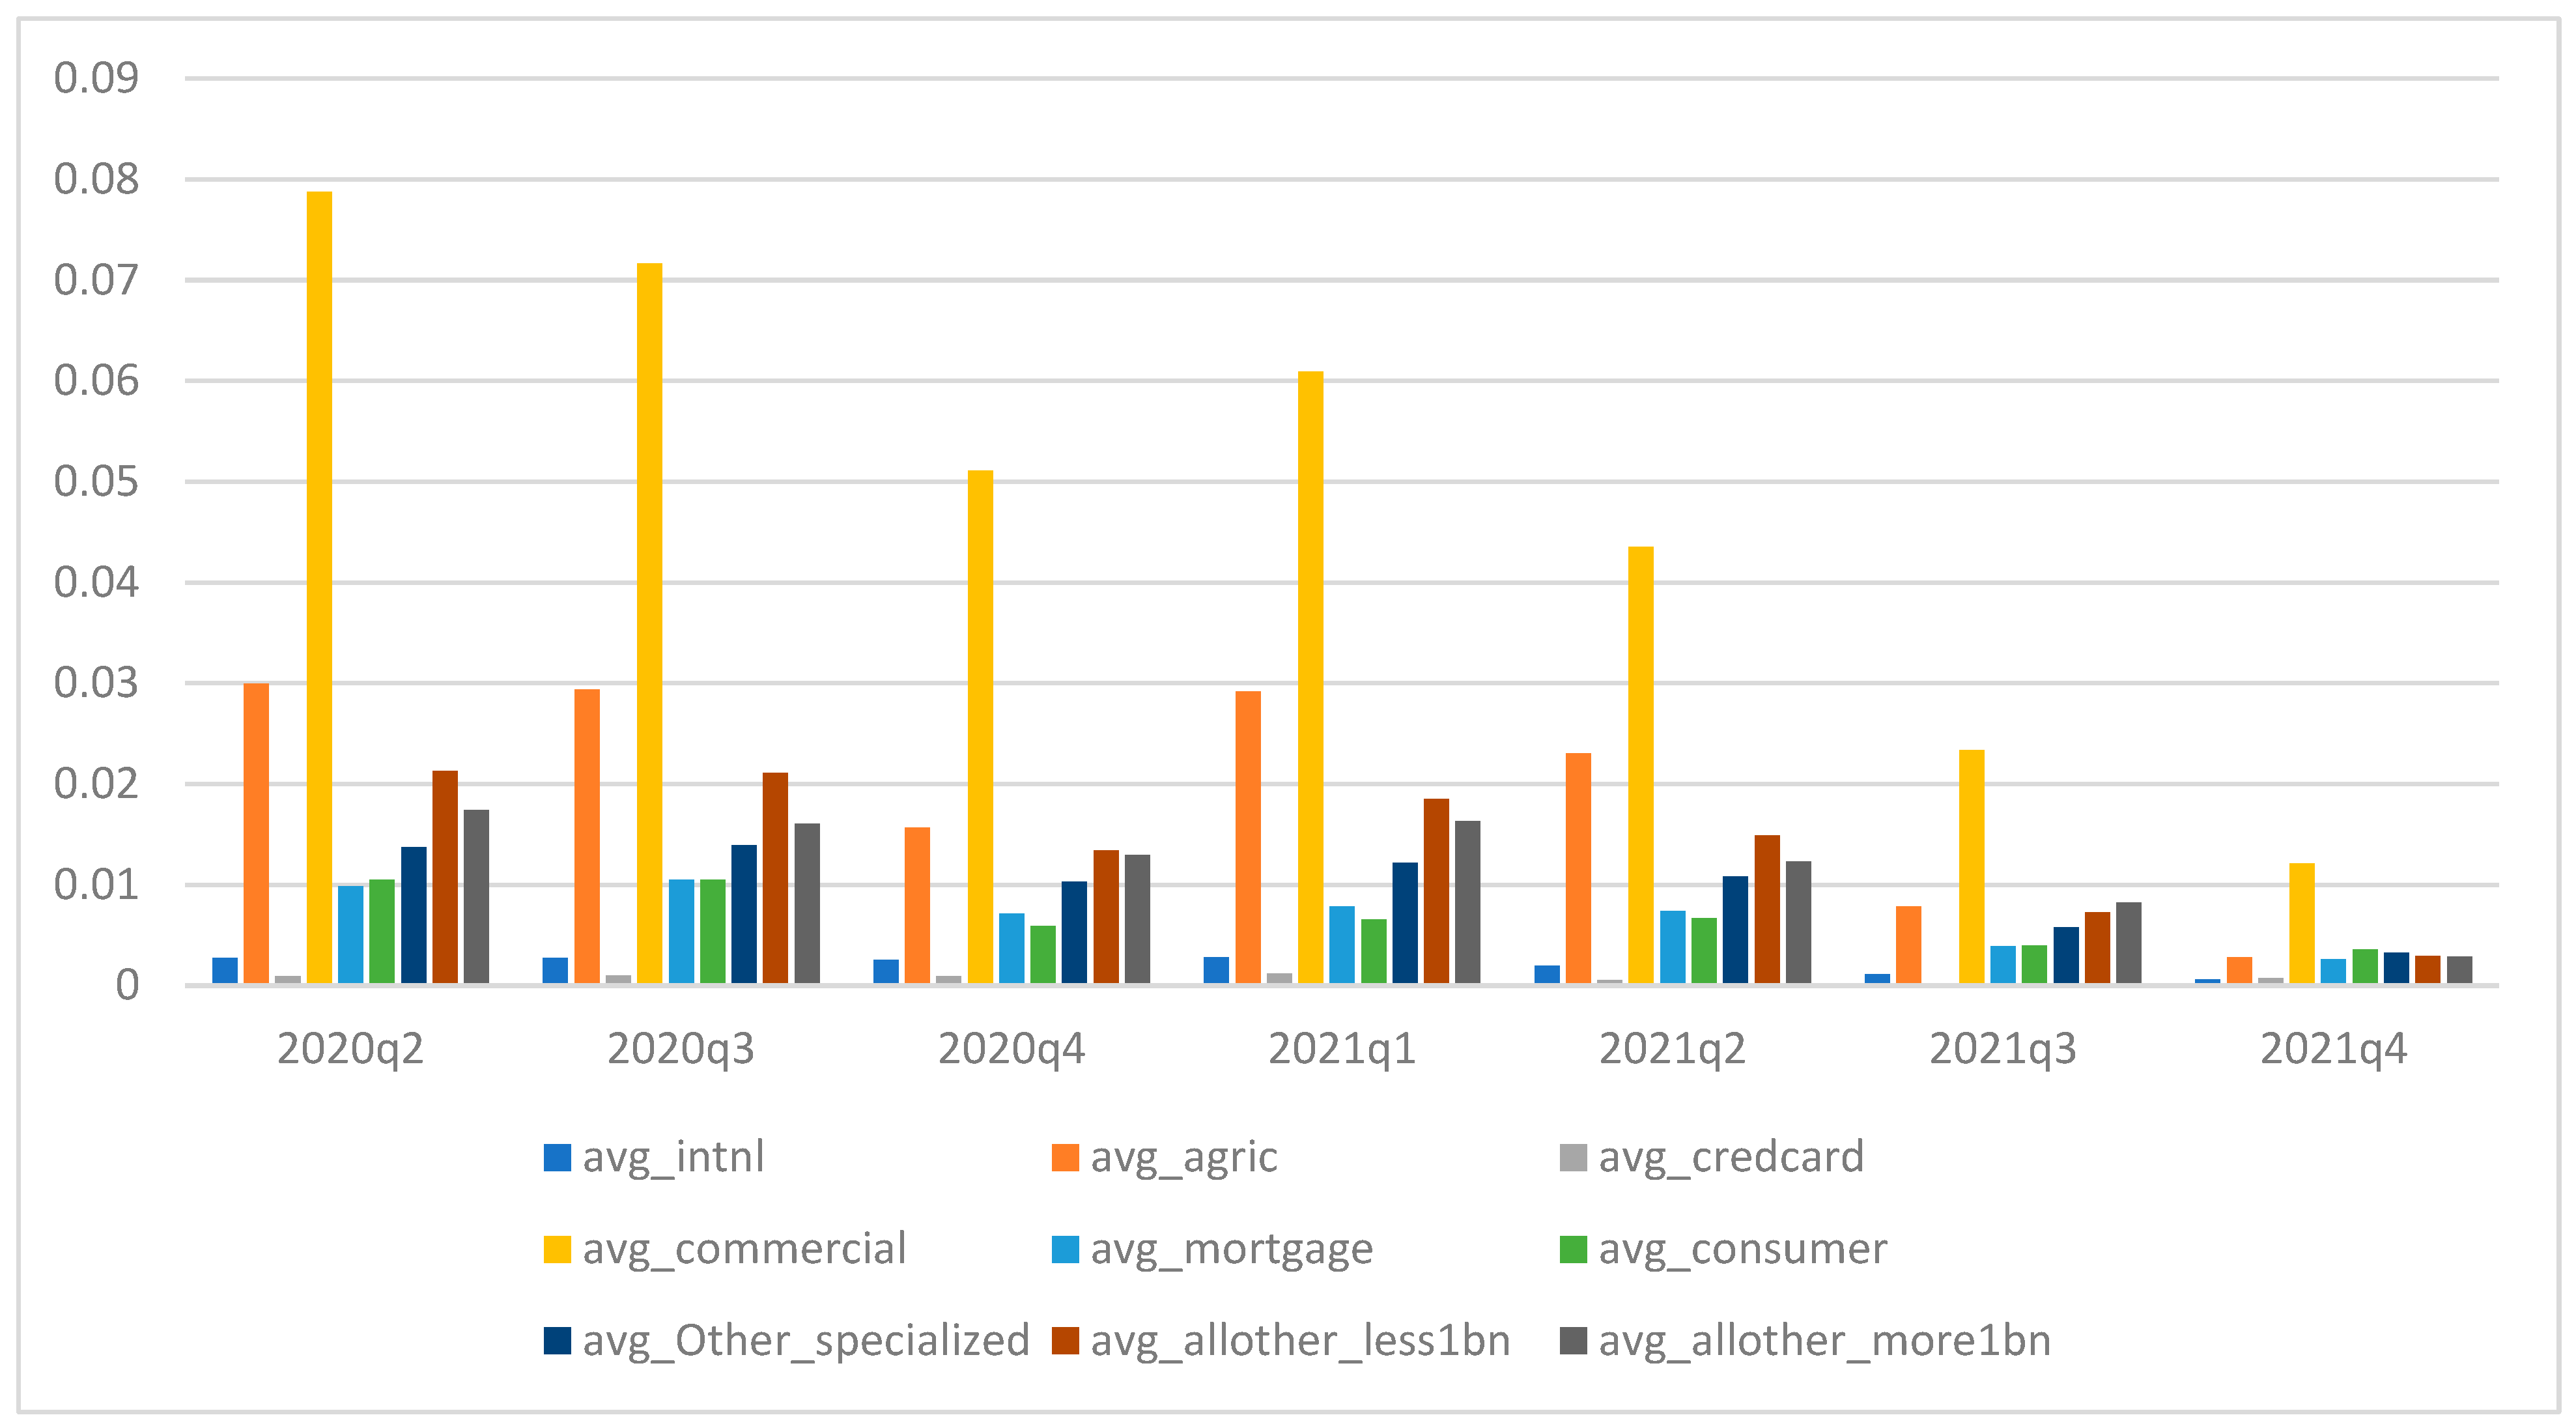
4.2. PPP and Bank Specialization

The Paycheck Protection Program was targeted at small businesses to forestall their collapse and the loss of jobs, and to support the main productive sectors of the economy. In this section, we examine US banks’ lending with the goal of understanding the extent to which the productive sectors were beneficiaries of the program. We conduct our examination using PPP lending by banks in different FDIC-defined specializations: (1) international; (2) agricultural; (3) credit card; (3) commercial; (4) mortgage; (5) consumer; (6) other specialized with assets greater than one billion USD; (7) all other with assets less than one billion USD; and (8) all other with assets greater than one billion USD. Banks belong to a particular specialization where they have the largest concentrations of loans.
In conducting this analysis, we note that it is misleading to use aggregate PPP in this analysis. For instance, international banks have one of the highest aggregate amounts of PPP lending, which is likely because they are larger and thus have more branches. Thus, we scale PPP to total assets and present the results for each specialization by quarter in Figure 3. We observe that for every quarter, banks specializing in commercial and industrial loans lend the most PPP as a percentage of total assets. For example, PPP accounted for 7.8% of total assets in 2020Q2 for ‘Commercial’ banks relative to 3% by ‘Agric’ banks, the next highest category. Banks with an international focus and credit card banks have the least proportion of 0.3% and 0.1%, respectively. These results show that commercial and agricultural banks, representing the most productive sectors of the US economy, participated in PPP more intensely and in line with the PPP policy of mainly protecting jobs at small businesses. As expected, the PPP-assets ratio declines over the period as the PPP winds down.
We also examine whether there are heterogeneous effects of bank characteristics on PPP across the different types of bank specializations and present the results in Table 5. The positive and significant LDR and LLOSS but negative ROA show support for the risk-aversion channel for agricultural (Column 2) and Commercial (Column 4) specialization groups; however, CARATIO is significantly positive and positive but not significantly different from zero for the agricultural and commercial groups, respectively. The risk-aversion hypothesis is relatively weak for the credit card category, where the impact of LDR is positive but insignificant, while LLOSS is positive but considerably lower (that is, 0.058, compared to, for instance, 0.221 for agricultural-focused banks). An interesting observation in Table 6 is that the impact of bank characteristics is completely non-existent for international (Column 1), mortgage (Column 5), and consumer (Column 6) categories. Taken together, the findings in Table 5 and Figure 3 suggest that relative to other bank specializations, banks with a focus on agriculture and commercial sectors experienced considerably higher PPP as a percentage of total assets. International and consumer-focused banks appear to have had a limited role in PPP lending. This aligns with the presumed policy of the PPP to target productive sectors of the domestic economy to protect jobs.

5. Robustness

We conduct additional robust tests of our main results in Table 2. First, we include lagged G_LEND as an independent variable to account for the possibility that loan growth may be influenced by the previous year’s quarter growth. We do this by estimating Equation (1) augmented with G_LENGt−1 and reporting the results in Table 6. As reported in Panel A, we find that the risk aversion argument still holds for both PPP and CILL. However, the result for our dynamic specification may be biased due to the endogenous G_LENDt−1. This is because the lagged dependent variable depends on the previous error term, which is a function of the current error term, thus causing a correlation between G_LENDt−1 and the current error term. Therefore, in Panel B, we employ a one-step difference Generalized Method of Moments (GMM) model which is known to address endogeneity issues in dynamic panel models; GMM removes endogeneity by first differencing the data to eliminate unobserved banks-specific effects and reduce omitted variable bias and measurement errors (Arellano & Bond, 1991; Blundell & Bond, 1998; Bond et al., 2001). We find that our inferences remain unchanged. Specifically, banks that are characterized by higher loan-deposit ratios, lower overall profitability, and poorer loan quality adjusted faster to PPP and large business loans. Marsh and Sharma also suggest that NIM is endogenous in the PPP specification. Thus, in unreported tables, we treat both PPP and NIM as endogenous variables in the GMM model and find qualitatively similar results.
We note that scaling the dependent variable, lending, with total assets controls for size differences in the lending specification in Equation (1); however, if this scaling does not adequately account for size, there may be concerns of an omitted variable bias. Thus, we also estimate additional lending specifications that include the natural logarithm of total assets. The results, documented in Table 7, show that our main inferences from Table 2 remain unaffected even with the inclusion of SIZE. However, we find that CARATIO becomes negative and significant (coef. = −0.116; t-stat. = −5.01) in the PPP specification compared to when it is positive but insignificant in Table 2. On the other hand, CARATIO maintains its positive and significant relation with both C&I lending to small businesses (Column 2) and C&I lending to large businesses (Column 3). This suggests that when we control for SIZE, the coefficient of CARATIO shows further evidence that riskier (less risky) banks tend to lend more PPP (CILS and CILL). It is also noteworthy that SIZE is negatively and significantly associated with PPP. This may be explained by the fact that the PPP government intervention targeted small businesses, and these are the firms that are mostly served by small banks. As expected, the coefficient on SIZE is positive for the G_CILL specification, suggesting that increases in C&I lending to large businesses are associated with larger banks.
Moreover, in Table 8, we replicate our baseline analysis for PPP, G_CILS, and G_CILL, after excluding the largest banks defined by three different criteria. To do this, we first drop banks with total assets of more than 1 bn USD in Columns 1–3. Second, we use a threshold of 10 bn USD to exclude very large banks in Columns 4–6. Lastly, we drop systematically important banks (SIBs) in Columns 7–9. SIBs include banks that have been classified as globally-SIBsby the Financial Stability Board11 or that have been subjected to stress tests (due to a larger than 50 billion USD balance sheet) in compliance with stringent standards imposed by the Financial Stability Oversight Council12 over the period of 2020 to 2021 (See Appendix A, Table A2 for a list of SIBs). The results after excluding the largest banks in Table 8 are both qualitatively and quantitatively similar to those in our baseline analyses. Collectively, controlling for size (Table 4) and excluding too-big-to-fail banks (Table 8), we demonstrate that our results are not simply capturing differences between large banks and small banks, such as greater access to financing or implicit too-big-to-fail guarantees.

6. Conclusions and Policy Implications

The COVID-19 crisis that caused massive economic repercussions globally was considered unique because it was an exogenous public health shock, a crisis not triggered by economic or financial forces (Berger & Demirgüç-Kunt, 2021; Beck & Keil, 2022). This leads us to ask how this shock affected banks’ lending; specifically, we examine how bank-level characteristics affected US banks’ PPP and C&I lending to small businesses using the COVID-19 crisis as a quasi-natural experiment laboratory.
Our findings show that lenders facing greater risk lend more PPP loans, consistent with the risk-aversion channel as posited by Marsh and Sharma (2024) using the capital ratio as the main risk measure. We offer strong support for this argument by showing that banks with a higher loan–deposit ratio, lower overall profitability, poorer loan quality, higher exposure to risks in commercial and industrial loans, and higher insolvency risk are characterized by higher PPP lending. If, according to the risk-aversion argument, weaker banks intensify PPP lending because it is safer relative to conventional lending, then we should expect stronger banks to be more willing to lend more C&I loans, which are relatively riskier. Our results support that line of argument. In contrast to PPP lending, commercial and industrial loans to all businesses were negatively and significantly related to the loan–deposit ratio and loan loss provision ratio, while the capital ratio was positive and significant. Additionally, in robustness tests, we proxy for bank risk directly in our lending specifications, using the z-score and coefficient of variation. We find that banks facing higher insolvency risk increased PPP lending relative to the riskier commercial and industrial lending. Moreover, we group our sample banks using the sample median of the Tier 1 capital ratio. We find that the risk-aversion argument is stronger for banks in the high-risk subsample, namely, less capitalized banks.
Further analysis of C&I lending to small businesses relative to large businesses presents some interesting findings. More profitable banks increased commercial and industrial loans to large businesses while reducing them to small businesses. More diversified banks are associated with higher C&I lending to small businesses. In addition, banks with higher liquidity reduced their C&I lending to small businesses. In other analyses, we document those banks with a focus on agriculture and commercial and industrial loans that extended considerably higher PPP loans as a percentage of total assets, consistent with the policy of the PPP to save jobs by targeting productive sectors of the economy. Our results are largely robust to a variety of checks.
In terms of policy implications, the findings in this paper strengthen our understanding of how non-financial or macroeconomic crises can affect the lending channel from banks to businesses, in general, and small businesses in particular. In addition, our findings that the PPP targeted the productive sectors of the US economy have obvious practical implications for future policy interventions during a crisis. Because the guaranteed PPP loans allow banks to earn a modest income while not risking their own capital, participating riskier banks originated more PPP loans, as our results show. This suggests that PPP helped mitigate risk for weaker banks at a time of high economic and financial uncertainty. Thus, it is likely that riskier banks may have used the program to “gamble for resurrection” (Marsh & Sharma, 2024). Other evidence shows that guarantee programs in Japan during the COVID-19 pandemic crisis may have motivated banks to transfer significant risks to the government by lending to poor credit quality firms, including firms being kept on temporary life support but facing liquidation in the long-run (Honda et al., 2023; Hoshi et al., 2023). This moral hazard may have been pronounced given the generous nature of the PPP compared to non-forgivable loans under European guarantee programs during the pandemic and earlier programs in Japan (Ono et al., 2013; Core & De Marco, 2021). We acknowledge, however, that the low interest rates of PPP loans as well as the need to use the banks’ own capital initially to originate the PPP loans may have mitigated these moral hazards. Nevertheless, for future guarantee programs, policymakers need to ensure greater parity between participation incentives and underwriting, given the experience of Japan. Due to the limitations in our dataset, we were unable to examine the quality of firms that ultimately received the PPP loans. We encourage future research to investigate this important issue.

Author Contributions

Conceptualization, B.A.A. and T.T.O.; methodology, B.A.A. and T.T.O.; software, B.A.A. and T.T.O.; validation, B.A.A. and T.T.O.; formal analysis, B.A.A. and T.T.O.; investigation, B.A.A. and T.T.O.; resources, B.A.A. and T.T.O.; data curation, v; writing—original draft preparation, B.A.A. and T.T.O.; writing—review and editing, B.A.A. and T.T.O.; visualization, B.A.A. and T.T.O.; supervision, B.A.A. and T.T.O.; project administration, B.A.A. and T.T.O. All authors have read and agreed to the published version of the manuscript.

Funding

This research received no external funding.

Institutional Review Board Statement

Not Applicable.

Informed Consent Statement

Not Applicable.

Data Availability Statement

The data used in this study was derived from the FDIC, the BEA of the US Department of Commence and the US Center for Disease Control and Prevention.

Conflicts of Interest

The authors declare no conflicts of interest.

Appendix A

Table A1. Variable definitions.
Variables AbbreviationDefinitionData Source
LendingCILCommercial and industrial loans to all businesses. This variable includes PPP loans.FDIC
LendingCILSCommercial and industrial loans to small businessesFDIC
LendingPPPPaycheck Protection Program loansFDIC
LendingNCILNet CIL, calculated as CIL minus PPPFDIC
LendingCILLCommercial and industrial loans to large businesses, calculated as CIL minus PPP minus CILSFDIC
Growth in LendingG_LENDGrowth in lending as a percent of the previous quarter’s total assets;
where lending is CILS, PPP, NCIL, or CILL.
FDIC
Growth in LendingG_CILGrowth in CIL as a percent of the previous quarter’s total assets.FDIC
Growth in LendingG_CILSGrowth in CILS as a percent of the previous quarter’s total assets.FDIC
Growth in LendingG_PPPGrowth in PPP as a percent of the previous quarter’s total assets.FDIC
Growth in LendingG_CILLGrowth in CILL as a percent of the previous quarter’s total assets.FDIC
Growth in LendingG_NCILGrowth in NCIL as a percent of the previous quarter’s total assets.FDIC
Net Loans and Leases to DepositsLDRLoans and lease financing receivables net of unearned income, allowances, and reserves as a percent of total deposits.FDIC
Capital RatioCARATIOTotal equity capital as a percent of total assets.FDIC
Intermediation ProfitabilityNIMTotal interest income less total interest expense (annualized) as a percent of average earning assets.FDIC
Overall ProfitabilityROANet income after taxes and extraordinary items (annualized) as a percent of total assets.FDIC
Credit QualityLLOSSAllowance for loan and lease losses as a percent of total loan and lease financing receivables, excluding unearned income.FDIC
Unused Credit LineUCLNUnused credit line as a percent of total assets.FDIC
Non-Interest IncomeNONIIIncome derived from bank services and sources other than interest-bearing assets (annualized) as a percent of total assets.FDIC
Insolvency RiskZ-SCORESum of current period values of PROFITABILITY and equity-to-asset ratio, as a percent of the standard deviation of PROFITABILITY computed over the full sample.Authors’ computation; FDIC
Earnings VariabilityCVStandard deviation of quarterly net income, as a percent of the mean over the past 12 quarters.Authors’ computation; FDIC
Bank SizeSIZENatural logarithm of total assets.FDIC
LiquidityLIQUIDITYSum of cash, federal funds sold, and securities purchased to resell as a percent of total assets.FDIC
Economic ConditionG_GDPQuarterly growth rate in real GDP.Bureau of Economic Analysis
COVID-19G_COVIDQuarterly growth rate in the number of total COVID-19 cases.US Center for Disease Control and Prevention
Table A2. List of Banks—Stress Test 2020–2021 (see note 13 above). These are banks stress-tested by the Financial Stability Oversight Council (FSOC) over the period from 2020 to 2021.
Financial Institution Financial Institution
Ally Financial Inc., Detriot, MI USADiscover Financial Services, Riverwoods, IL, USASantander Holdings USA, Inc., Boston, MA, USA *
American Express Company, New York, NY USAFifth Third Bancorp, Cincinnati, OH, USAState Street Corporation, Boston, MA, USA *
Bank of America Corporation, Charlotte, NC USA *HSBC North America Holdings Inc.,
New York, NY, USA *
TD Group US Holdings LLC, Cherry Hill, NJ, USA
Barclays US LLC, Philadelphia, PA, USA. *Huntington Bancshares Incorporated, Columbus, OH, USAThe Bank of New York Mellon Corporation, New York, NY, USA *
BMO Financial Corp., Chicago, IL, USAJPMorgan Chase & Co., New York, NY, USA *The Charles Schwab Corporation, Westlake, Texas, USA
BNP Paribas USA, Inc. New York, NY, USA *KeyCorp, Cleveland, OH, USAThe Goldman Sachs Group, Inc., New York, NY, USA *
Capital One Financial Corporation, McLean, VA, USAM&T Bank Corporation, Bufalo, NY, USAThe PNC Financial Services Group, Inc., Pittsburg, PA, USA
Citigroup Inc., New York, NY, USA *Morgan Stanley, New York, NY, USA *Truist Financial Corporation, Charlotte, NC, USA
Citizens Financial Group, Inc., Providence, RI, USANorthern Trust Corporation, Chicago, IL, USAU.S. Bancorp, Minneapolis, MN, USA
Credit Suisse Holdings (USA), Inc., Madison, NY, USA *RBC US Group Holdings LLC, Raleigh, NC, USA *UBS Americas Holding LLC, New York, NY, USA *
DB USA Corporation, New York, NY, USARegions Financial Corporation, Birmingham, AL, USAWells Fargo & Company, San Francisco, CA, USA *
* These are financial institutions that are also classified as globally-systematically important banks by the Financial Stability Board. See “2021 list of global systemically important banks (G-SIBs)”, Financial Stability Board. https://www.fsb.org/wp-content/uploads/P231121.pdf (accessed on 15 May 2023); “2020 list of global systemically important banks (G-SIBs)” (PDF). Financial Stability Board. https://www.fsb.org/wp-content/uploads/P111120.pdf (accessed on 15 May 2023).

Notes

1
According to Berger and Demirgüç-Kun (2021) and Beck and Keil (2022), the COVID-19 pandemic was also different from other economic crises for the following reasons. (i) it has been identified as a global crisis that featured the most unanticipated large and widespread economic shocks; (ii) though the COVID-19 crisis triggered declines in aggregate demand, this was rapid and transient, leading to increases rather than decreases in business loans as firms required liquidity buffers to ride the storm; (iii) the crisis prompted the swiftest and largest set of policy responses including the PPP bailout that was several times larger than the Troubled Asset Relief Program (TARP) bank bailout during the 2007–2009 credit crunch.
2
The Wall Street Journal chronicles reported that about 200,000 small businesses folded up during the first year of the pandemic (https://www.wsj.com/articles/small-businesses-on-one-chicago-street-struggle-to-meet-demand-as-COVID-19-restrictions-end-11624267802, accessed on 20 November 2024).
3
By design, the PPP was generally directed towards small businesses with at most 500 employees. Numerous prior studies have considered PPP as representing lending to small businesses (Chodorow-Reich et al., 2022; Karakaplan, 2021; Marsh & Sharma, 2024; Lopez & Spiegel, 2023).
4
First round: CARES Act enacted on 27 March 2020—349 billion USD; second round: PPP and Healthcare Enhancement Act enacted on 24 April 2020—321 billion USD; and third round: Consolidated Appropriations Act enacted on 21 December 2020—284 billion USD.
5
6
285.83% × 0.013 = 3.72%. The standard deviation of 285.83% is from Table 1. See papers such as Ivashina and Scharfstein (2010), Brogaard and Detzel (2015), and Javadi et al. (2017), which use a similar interpretation.
7
Due to missing data for common equity tier 1 capital ratio which we used to categorize banks into high or low risk, the number of observations drops to 18,011 in Table 3, compared with about 29,000 for the baseline regression in Table 2.
8
The results of the chi-square tests are available upon request.
9
We thank an anonymous reviewer for pointing this out.
10
We use various definitions of ‘large banks’ specified in the robustness section.
11
“2021 list of global systemically important banks (G-SIBs)” Financial Stability Board. https://www.fsb.org/wp-content/uploads/P231121.pdf, accessed on 20 November 2024.
“2020 list of global systemically important banks (G-SIBs)” (PDF). Financial Stability Board. https://www.fsb.org/wp-content/uploads/P111120.pdf, accessed on 20 November 2024.
12

References

  1. Abedifar, P., Molyneux, P., & Tarazi, A. (2018). Non-interest income and bank lending. Journal of Banking and Finance, 87, 411–426. [Google Scholar] [CrossRef]
  2. Acharya, V. V., & Steffen, S. (2020). The risk of being a fallen angel and the corporate dash for cash in the midst of COVID. The Review of Corporate Finance Studies, 9(3), 430–471. [Google Scholar] [CrossRef]
  3. Acs, Z., & Audretsch, D. (1990). Innovation and small firms. MIT Press. [Google Scholar]
  4. Amiram, D., & Rabetti, D. (2020). The relevance of relationship lending in times of crisis. Working Paper. Available online: https://www.researchgate.net/publication/344415359_The_Relevance_of_Relationship_Lending_in_Times_of_Crisis (accessed on 20 November 2024).
  5. Angrist, J., & Pischke, J. (2009). Mostly harmless econometrics: An empiricist’s companion. Princeton University Press. [Google Scholar]
  6. Arellano, M., & Bond, S. (1991). Some tests of specification for panel data: Monte Carlo evidence and an application to employment equations. Review of Economic Studies, 58, 277–297. [Google Scholar] [CrossRef]
  7. Armstrong, C., Balakrishnan, K., & Cohen, D. (2012). Corporate governance and the information environment: Evidence from State antitakeover laws. Journal of Accounting and Economics, 53, 185–204. [Google Scholar] [CrossRef]
  8. Autor, D., Cho, D., Crane, L. D., Goldar, M., Lutz, B., Montes, J., Peterman, W. B., Ratner, D., Villar, D., & Yildirmaz, A. (2022). An evaluation of the paycheck protection program using administrative payroll microdata. Journal of Public Economics, 211, 104664. [Google Scholar] [CrossRef]
  9. Balyuk, T., Prabhala, N. R., & Puri, M. (2021). Small bank financing and funding hesitancy in a crisis: Evidence from the paycheck protection program. Working Paper. Available online: https://papers.ssrn.com/sol3/papers.cfm?abstract_id=3717259 (accessed on 20 November 2024).
  10. Bartik, A. W., Cullen, Z. B., Glaeser, E. L., Luca, M., Stanton, C. T., & Sunderam, A. (2020). The targeting and impact of paycheck protection program loans to small businesses (Technical report, NBER, working paper 27623). National Bureau of Economic Research.
  11. Beauregard, R., Lopez, J. A., & Spiegel, M. M. (2020). Small Business Lending during COVID-19. Federal Reserve Bank of San Francisco. Economic Letter November 23. Small, 2020, 35. [Google Scholar]
  12. Beck, T., & Keil, J. (2022). Are banks catching corona? Effects of COVID on lending in the US. Journal of Corporate Finance, 72, 102160. [Google Scholar] [CrossRef]
  13. Beck, T., & Laeven, L. (2006). Resolution of failed banks by deposit insurers: Cross–country evidence (World Bank policy research working paper 3920). World Bank Publications.
  14. Berger, A. N., & Demirgüç-Kunt, A. (2021). Banking research in the time of COVID-19. Journal of Financial Stability, 57, 100939. [Google Scholar] [CrossRef]
  15. Berger, A. N., Freed, P. G., Scott, J. A., & Zhang, S. (2021). The Paycheck Protection Program (PPP) from the small business perspective: Did the PPP help alleviate financial and economic constraints? Working Paper. Available online: https://papers.ssrn.com/sol3/papers.cfm?abstract_id=3908707 (accessed on 20 November 2024).
  16. Berger, A. N., Karakaplan, M. U., & Roman, R. A. (2023). Whose bailout is it anyway? The roles of politics in PPP bailouts of small businesses vs. banks. Journal of Financial Intermediation, 56, 101044. [Google Scholar] [CrossRef]
  17. Bertrand, M., & Mullainathan, S. (2003). Enjoying the quiet life? Corporate governance and managerial preferences. Journal of Political Economy, 111, 1043–1075. [Google Scholar] [CrossRef]
  18. Blundell, R., & Bond, S. (1998). Initial conditions and moment restrictions in dynamic panel data models. Journal of Econometrics, 87(1), 115–143. [Google Scholar] [CrossRef]
  19. Boeckx, J., de Sola Perea, M., & Peersman, G. (2020). The transmission mechanism of credit support policies in the euro area. European Economic Review, 124, 103403. [Google Scholar] [CrossRef]
  20. Bond, S. R., Hoeffler, A., & Temple, J. R. W. (2001). GMM estimation of empirical growth models. CEPR Discussion Paper 3048. Available online: https://papers.ssrn.com/sol3/papers.cfm?Abstract_id=290522 (accessed on 20 November 2024).
  21. Brewer, E., III, Minton, B. A., & Moser, J. T. (2000). Interest-rate derivatives and bank lending. Journal of Banking and Finance, 24, 353–379. [Google Scholar] [CrossRef]
  22. Brogaard, J., & Detzel, A. (2015). The asset-pricing implications of government economic policy uncertainty. Management Science, 61(1), 3–18. [Google Scholar] [CrossRef]
  23. Calmès, C., & Théoret, R. (2015). Product-mix and bank performance: New U.S. and Canadian evidence. Managerial Finance, 41(8), 773–805. [Google Scholar] [CrossRef]
  24. Cecchetti, S. G., King, M. R., & Yetm, J. (2011). Weathering the financial crisis: Good policy or good luck? BIS Working Paper No. 351. Available online: https://papers.ssrn.com/sol3/papers.cfm?abstract_id=1942165 (accessed on 20 November 2024).
  25. Chetty, R., Friedman, J. N., & Stepner, M. (2023). The economic impacts of COVID-19: Evidence from a new public database built using private sector data. Quarterly Journal of Economics, 139(2), 829–889. [Google Scholar] [CrossRef]
  26. Chodorow-Reich, G., Darmouni, O., Luck, S., & Plosser, M. C. (2022). Bank liquidity provision across the firm size distribution. Journal of Financial Economics, 144(3), 908–932. [Google Scholar] [CrossRef]
  27. Core, F., & De Marco, F. (2021). Public guarantees for small businesses in Italy during COVID-19. CEPR Discussion Paper No. DP15799. Available online: https://www.bundesbank.de/resource/blob/875918/de7856951091081783b1fdaf01b37aa7/mL/2021-09-27-online-core-data.pdf (accessed on 20 November 2024).
  28. De Nicoló, G. (2000). Size, charter value and risk in banking: An international perspective (International Finance Discussion Papers No. 689). Board of Governors of the Federal Reserve System (U.S.).
  29. Diamond, D. (1991). Monitoring and reputation: The choice between bank loans and directly placed debt. Journal of Political Economy, 99(4), 689–721. [Google Scholar] [CrossRef]
  30. Dilger, R. (2018). Small business administrative and job creation. Congressional Research Service. [Google Scholar]
  31. Disalvo, J., & Johnston, R. (2017). The rise in loan-to-deposit ratios: Is 80 the new 60? Federal Reserve Bank of Philadelphia, 2(3), 18–23. [Google Scholar]
  32. Duchin, R., & Hackney, J. (2021). Buying the vote? The economics of electoral politics and small-business loans. Journal of Financial and Quantitative Analysis, 56(7), 2439–2473. [Google Scholar] [CrossRef]
  33. Ennis, H., & Jarque, A. (2021). Bank lending in the time of COVID. Richmond Fed Economic Brief. Available online: https://www.richmondfed.org/publications/research/economic_brief/2021/eb_21-05 (accessed on 20 November 2024).
  34. Granja, J., Makridis, C., Yannelis, C., & Zwick, E. (2022). Did the paycheck protection program hit the target? Journal of Financial Economics, 145(3), 725–761. [Google Scholar] [CrossRef] [PubMed]
  35. Greenwald, D. L., Krainer, J., & Paul, P. (2020). The credit line channel (Working paper series). Federal Reserve Bank of San Francisco. [Google Scholar]
  36. Griffin, J. M., Kruger, S., & Mahajan, P. (2023). Did FinTech lenders facilitate PPP fraud? The Journal of Finance, 78(3), 1777–1827. [Google Scholar] [CrossRef]
  37. Headd, B. (2010). An analysis of small business and jobs. US Small Business Administration, Office of Advocacy. [Google Scholar]
  38. Hesse, H., & Čihák, M. (2007). Cooperative banks and financial stability (IMF working paper 07/2). International Monetary Fund.
  39. Honda, T., Hosono, K., Miyakawa, D., Ono, A., & Uesugi, I. (2023). Determinants and effects of the use of COVID-19 business support programs in Japan. Journal of The Japanese and International Economies, 67, 101239. [Google Scholar] [CrossRef]
  40. Hoshi, T., Kawaguchi, D., & Ueda, K. (2023). Zombies, again? The COVID-19 business support programs in Japan. Journal of Banking & Finance, 147, 106421. [Google Scholar]
  41. Hubbard, R. G., & Strain, M. R. (2020). Has the paycheck protection program succeeded? Technical Report, NBER, Working Paper 28032. Available online: https://www.nber.org/papers/w28032 (accessed on 20 November 2024).
  42. Humphries, J. E., Neilson, C. A., & Ulyssea, G. (2020). Information frictions and access to the paycheck protection program. Journal of Public Economics, 190, 104244. [Google Scholar] [CrossRef]
  43. Ivashina, V., & Scharfstein, D. (2010). Bank lending during the financial crisis of 2008. Journal of Financial Economics, 97(3), 319–338. [Google Scholar] [CrossRef]
  44. Javadi, S., Kim, S., Krehbiel, T., & Nejadmalyeri, A. (2017). Measuring correlated default risk: A new metric and validity tests. Journal of Fixed Income, 27(2), 1–24. [Google Scholar] [CrossRef]
  45. Joaquim, G., & Netto, F. (2021). Bank incentives and the impact of the paycheck protection program. Working Paper. Available online: https://papers.ssrn.com/sol3/papers.cfm?abstract_id=3704518 (accessed on 20 November 2024).
  46. Karakaplan, M. U. (2021). This time is really different: The multiplier effect of the Paycheck Protection Program (PPP) on small business bank loans. Journal of Banking and Finance, 133, 106223. [Google Scholar] [CrossRef]
  47. Khan, M., Serafeim, G., & Yoon, A. (2016). Corporate sustainability: First evidence on materiality. Accounting Review, 91(6), 1697–1724. [Google Scholar] [CrossRef]
  48. Kobe, K. (2012). How did the financial crisis affect small business lending in the United States? Research Issue No. 10-M-0258. Small Business Administration Office of Advocacy. [Google Scholar]
  49. Kuratko, D. F., & Hodges, R. M. (1998). Entrepreneurship: A contemporary approach. Dryden Press. [Google Scholar]
  50. Lepetit, L., & Strobel, F. (2015). Bank insolvency risk and Z-score measures: A refinement. Finance Research Letters, 13, 214–224. [Google Scholar] [CrossRef]
  51. Li, L., & Strahan, P. (2021). Who supplies PPP loans (and does it matter)? Banks, relationships, and the COVID crisis. Journal of Financial and Quantitative Analysis, 56(7), 2411–2438. [Google Scholar] [CrossRef]
  52. Lopez, J. A., & Spiegel, M. M. (2023). Small business lending under the PPP and PPPLF programs. Journal of Financial Intermediation, 53, 101017. [Google Scholar] [CrossRef]
  53. Marsh, W. B., & Sharma, P. (2024). Loan guarantees in a crisis: An antidote to a credit crunch? Journal of Financial Stability, 72, 101244. [Google Scholar] [CrossRef]
  54. Mkhaiber, A., & Werner, R. A. (2021). The relationship between bank size and the propensity to lend to small firms: New empirical evidence from a large sample. Journal of International Money and Finance, 110, 102281. [Google Scholar] [CrossRef]
  55. Ono, A., Uesugi, I., & Yasuda, Y. (2013). Are lending relationships beneficial or harmful for public credit guarantees? Evidence from Japan’s emergency credit guarantee program. Journal of Financial Stability, 9(2), 151–167. [Google Scholar] [CrossRef]
  56. Orzechowski, P. E. (2020). U.S. small business administration loans and U.S. state-level employment. Journal of Economics and Finance, 44, 486–505. [Google Scholar] [CrossRef]
  57. Rajan, R. G., & Zingales, L. (1998). Financial dependence and growth. American Economic Review, 88(3), 559–586. [Google Scholar]
  58. Santomero, A. W., & Chung, E.-J. (1992). Evidence in support of broader banking powers. Financial markets. Institutions and Instruments, 1, 1–69. [Google Scholar]
  59. Sengupta, R., & Byrdak, A. 2021 November. Bank profitability rebounds despite compressed interest margins. Economic Bulletin, Federal Reserve Bank of Kansas City. [Google Scholar]
  60. Sharpe, S. A., & Acharya, S. (1992). Loan losses, bank capital, and the credit crunch. Federal Reserve Board of Governors. [Google Scholar]
  61. Sinkey, J. F., & Nash, R. C. (1993). Assessing the riskiness and profitability of credit-card banks. Journal of Financial Services Research, 7(2), 127–150. [Google Scholar] [CrossRef]
  62. Stiroh, K. J. (2004a). Diversification in banking: Is noninterest income the answer? Journal of Money, Credit and Banking, 36(5), 853–882. [Google Scholar] [CrossRef]
  63. Stiroh, K. J. (2004b). Do community banks benefit from diversification? Journal of Financial Services Research, 25(2–3), 135–160. [Google Scholar] [CrossRef]
Figure 1. Trends in lending. This figure shows the trend in aggregate lending over the sample period, 2020Q1 to 2021Q4. The right-hand axis pertains to CIL, NCIL, and CILL. The left-hand axis pertains to PPP and CILS. AGG_PPP, AGG_CIL, AGG_CILL, AGG_CILS, and AGG_NCIL are aggregate lending for PPP, CIL, CILL, CILS, and NCIL, respectively.
Jrfm 18 00231 g001
Figure 2. Trends in key bank characteristics. This figure presents movements in average bank characteristics over the sample period 2020Q1 to 2021Q4. Table A1 in Appendix A provides detailed descriptions of all variables.
Jrfm 18 00231 g002
Figure 3. PPP lending to various bank specializations. This figure shows the average PPP lending as a percentage of total assets for each bank specialization. PPP disbursements started in 2020Q2. Table A1 provides FDIC definitions of bank specializations.
Jrfm 18 00231 g003
Table 1. Summary statistics and mean difference tests.
Panel A: Descriptive Statistics
NMeanMedianMinMaxStd
G_PPP (%)29,0670.1870.000−7.32514.8193.492
G_CILS (%)34,6920.285−0.075−3.9776.2362.555
G_CILL (%)29,819−0.1360.015−13.0608.8553.736
LDR (%)34,82571.05572.18333.884103.58218.956
CARATIO (%)34,78211.20110.5207.63518.5672.818
NIM (%)34,7753.3953.3932.1094.7060.676
ROA (%)34,7821.0841.059−3.2193.7710.803
LLOSS (%)34,5201.3511.2720.5832.5360.493
UCLN (%)34,82711.0839.8431.20944.3777.601
NONII (%)34,7820.7060.5270.0962.4440.597
LIQUIDITY (%)34,8270.2730.2530.0860.5610.130
G_GDP (%)34,8271.2270.550−9.08012.2306.441
G_COVID (%)34,8272.1240.868−0.69310.6793.651
Panel B: Mean Difference Tests
B1: G_PPPB2: G_CILS
Low High Low CILSHigh CILS
MeanMeanDifferenceMeanMeanDifference
LDR69.14578.2329.087 ***75.06673.590−1.476 ***
CARATIO12.0019.333−2.668 ***11.14212.4111.269 ***
ROA1.3221.165−0.157 ***1.0851.051−0.033 ***
LLOSS1.4031.4380.035 **1.4511.379−0.072 ***
UCLN9.43312.5403.107 ***0.1210.3250.203 ***
NONII0.7210.8340.113 ***0.9822.0681.086 ***
NIM2.2942.8530.563 ***3.4193.4830.064 ***
LIQUIDITY0.2680.2900.022 ***0.2850.271−0.013 ***
N14,27814,280 17,35117,349
This table (based on banks with PPP data available) presents descriptive statistics of key variables (Panel A) used in the study, as well the mean differences (Panel B) in characteristics of banks with high small business lending growth verses those with low small business lending growth over 2020Q2 to 2021Q4. N is the bank-quarter observations. High G_PPP (High G_CILS) banks are defined as those with G_PPP (G_CILS) above the sample median, while low G_PPP (low G_CILS) banks are those below the sample median. Table A1 in Appendix A provides detailed descriptions of all variables. **, and *** indicate statistical significance at the 10%, 5%, and 1% levels, respectively.
Table 2. Baseline regression—determinants of lending.
123456
VARIABLESG_PPPG_PPPG_PPPG_CILSG_CILG_CILL
LDRt−10.013 ***0.026 ***0.013 ***−0.026 ***0.007 **−0.028 ***
(3.80)(3.23)(3.58)(−3.07)(2.14)(−3.42)
CARATIOt−10.0130.0100.0310.040 ***0.107 ***0.036 **
(0.70)(0.54)(1.61)(4.35)(3.57)(2.06)
NIMt−10.1080.1070.0580.060−0.1270.420 ***
(0.90)(0.88)(0.49)(0.77)(−0.94)(3.43)
ROAt−1−0.391 ***−0.377 ***−0.371 ***−0.097 ***−0.300 ***0.130 ***
(−5.92)(−5.71)(−5.78)(−3.35)(−4.65)(3.59)
LLOSSt−10.332 **0.274 **0.326 **−0.105 **0.280 **−0.248 ***
(2.49)(2.54)(2.53)(−2.04)(2.49)(−3.16)
UCLNt−1−0.004−0.0040.0060.0060.047 ***0.008
(−0.43)(−0.39)(0.70)(0.49)(3.45)(0.87)
NONIIt−10.231 ***0.219 ***0.215 ***0.059 ***0.158 ***−0.053
(4.61)(4.43)(4.40)(3.11)(3.02)(−1.60)
LIQUIDITYt−10.748 *1.818 **1.166 **−1.632 **2.262 ***0.418
(1.67)(2.57)(2.57)(−2.09)(4.70)(0.74)
G_NCILt−1 0.026 *
(1.82)
G_NCILt −0.244 ***
(−9.36)
G_GDPt−1−0.127 ***−0.128 ***−0.127 ***0.285 ***−0.130 ***0.722 ***
(−25.82)(−23.69)(−25.97)(25.70)(−21.88)(43.93)
G_COVIDt−10.557 ***0.556 ***0.551 ***1.103 ***0.556 ***−2.063 ***
(35.76)(33.98)(35.67)(25.90)(30.07)(−42.67)
Constant−2.651 ***−3.730 ***−2.682 ***−1.222 *−2.603 ***−0.910
(−4.13)(−4.27)(−4.21)(−1.78)(−3.98)(−1.12)
Observations28,56128,56128,56129,44029,44029,440
Adj. R-squared0.1180.1190.1430.0920.1080.179
Bank FEYesYesYesYesYesYes
Year FEYesYesYesYesYesYes
Bank clusteringYesYesYesYesYesYes
This table reports results from regressions relating lending growth to firm and macroeconomic characteristics in Equation (1) for PPP (Columns 1–3), CILS (Columns 4), CIL (Columns 5), and C&I lending net of PPP and CILS, that is, CILL (Column 6). Table A1 in Appendix A provides detailed descriptions of all variables. T-statistics are in parentheses. *, **, and *** indicate statistical significance at the 10%, 5%, and 1% levels, respectively.
Table 3. Subsample analysis—risk aversion channel.
12345 6
Panel A: G_PPPPanel B: G_ CILSPanel C: G_CILL
Low RiskHigh RiskLow RiskHigh RiskLow RiskHigh Risk
LDRt−10.0130.057 ***−0.026 **−0.016 *−0.019 *−0.025 ***
(0.94)(3.62)(−2.35)(−1.81)(−1.73)(−2.71)
CARATIOt−10.0380.127 **0.052 ***0.088 ***0.137 ***0.196 ***
(1.50)(2.04)(2.91)(3.04)(4.21)(2.81)
NIMt−1−0.0000.424 **0.0920.100−0.190 **−0.284 ***
(−0.00)(2.40)(1.05)(0.62)(−2.04)(−2.84)
ROAt−1−0.265 ***−0.609 ***−0.088 **−0.321 ***0.0090.169 ***
(−3.36)(−4.40)(−2.14)(−3.97)(0.18)(2.67)
LLOSSt−10.1640.605 ***−0.070−0.079−0.299−0.252
(1.54)(3.24)(−1.16)(−0.79)(−1.33)(−1.04)
UCLNt−10.000−0.026 ***−0.0060.9120.0170.060 ***
(1.00)(−2.80)(−0.82)(1.49)(1.01)(3.76)
NONIIt−10.161 ***0.361 ***0.054 **0.120 ***0.004−0.102
(2.93)(2.69)(1.98)(2.82)(0.04)(−0.78)
LIQUIDITYt−11.5055.292 ***−1.171−0.6471.0631.036
(1.32)(3.11)(−1.13)(−0.75)(1.28)(1.06)
G_GDPt−1−0.112 ***−0.164 ***0.279 ***0.296 ***0.010−0.005
(−10.33)(−16.31)(11.23)(18.18)(1.44)(−0.72)
G_COVIDt−10.479 ***0.698 ***1.067 ***1.211 ***−0.039 *−0.008
(14.74)(22.76)(11.14)(20.28)(−1.93)(−0.38)
Constant−2.504−9.337 ***−1.552 *−3.114 ***0.3070.576
(−1.54)(−5.54)(−1.83)(−3.69)(0.30)(0.57)
Observations900790049007900490079004
Adj. R-squared0.0390.2230.0740.1380.2860.094
Bank FEYesYesYesYesYesYes
Year FEYesYesYesYesYesYes
Bank clusteringYesYesYesYesYesYes
This table presents the results of estimating Equation (1) for different lending categories: PPP, CILS, and CILL in Panels A, B, and C, respectively. For each group, we stratify banks based on those with a common equity tier 1 capital ratio above (low risk) or below (high risk) the sample median. Table A1 in Appendix A provides detailed descriptions of all variables. T-statistics are in parentheses. *, **, and *** indicate statistical significance at the 10%, 5%, and 1% levels, respectively.
Table 4. Bank risk and lending.
123456
G_PPPG_CILSG_CILLG_PPPG_CILSG_CILL
Z-SCOREt−1−0.028 ***−0.0141.147 ***
(−14.05)(−0.90)(4.75)
CVt−1 0.600 ***0.228−0.335
(2.78)(1.29)(−1.20)
Constant−0.060−1.195 *−1.905 **−4.042 ***−1.322 **−0.812
(−0.09)(−1.73)(−2.34)(−4.42)(−2.01)(−0.96)
Observations28,56129,44029,44028,56129,44029,440
Adj. R-squared0.1330.0920.1810.1200.0920.179
ControlsYesYesYesYesYesYes
Bank FEYesYesYesYesYesYes
Year FEYesYesYesYesYesYes
Bank clusteringYesYesYesYesYesYes
This table augments Equation (1) with Z-SCORE to examine the impact of bank risk on G_PPP, G_CILS, and G_CILL in Columns 1, 2, and 3, respectively. We replicate the analyses with the coefficient of variation, CV, in lieu of Z-SCORE in Columns 4–6. Table A1 in Appendix A provides detailed descriptions of all variables. T-statistics are in parentheses. *, **, and *** indicate statistical significance at the 10%, 5%, and 1% levels, respectively.
Table 5. PPP and bank specialization.
123456789
InterAgricCredit CardComm-ercialMortgageConsumerOther SpecializedAll Other Less1bnAll Other More1bn
LDRt−10.0080.051 ***0.0020.022 *0.000−0.0070.001−0.0010.018 **
(0.66)(6.83)(1.69)(1.89)(0.03)(−0.68)(1.00)(−0.06)(2.01)
CARATIOt−1−0.0280.164 **0.0000.014−0.0040.0090.0100.083 *0.082 **
(−0.40)(2.28)(0.08)(0.52)(−0.23)(0.55)(0.91)(1.73)(2.42)
NIMt−10.764−0.122−0.018 **0.398 ***0.0160.0750.0620.193 *0.205
(1.91)(−0.38)(−2.46)(2.63)(0.18)(0.95)(0.69)(1.93)(1.62)
ROAt−1−0.001−0.786 ***0.029 ***−0.804 ***−0.022−0.061−0.024 *−0.231 **0.013
(−0.00)(−4.85)(3.31)(−6.13)(−1.25)(−1.25)(−1.70)(−2.09)(0.19)
LLOSSt−1−0.0660.226 *0.054 ***0.887 ***0.109−0.0550.0200.1850.023 **
(−1.17)(1.80)(3.55)(3.21)(1.24)(−0.70)(0.55)(1.02)(2.00)
UCLNt−1−1.6470.821 *−0.015−2.960 ***−1.0490.0940.003−0.790−1.812 ***
(−1.09)(1.72)(−0.49)(−3.17)(−1.08)(0.24)(0.65)(−1.25)(−3.07)
NONIIt−1−0.021−0.036−0.0050.333 **0.012−0.0110.0150.074 *−0.013
(−0.05)(−0.23)(−1.64)(2.10)(1.59)(−0.37)(1.51)(1.75)(−0.25)
LIQUIDITYt−1−0.8624.845 ***0.0481.038−0.3121.4000.5861.290 *2.061 **
(−1.73)(7.49)(0.25)(0.94)(−0.51)(0.89)(0.89)(1.72)(2.39)
G_GDPt−1−0.003−0.119 ***−0.018−0.167 ***−0.012 **−0.008−0.029 ***−0.035 ***−0.056 ***
(−1.32)(−12.08)(−1.67)(−18.70)(−2.30)(−0.59)(−2.81)(−4.49)(−6.49)
G_COVIDt−10.0020.513 ***0.0580.721 ***0.077 ***0.0650.159 ***0.214 ***0.217 ***
(0.24)(17.97)(1.76)(26.60)(4.48)(1.62)(5.14)(8.92)(8.15)
Constant−0.047−6.187 ***−0.582 **−4.721 ***−0.177−0.120−1.056 **−2.510 ***−3.173 ***
(−0.09)(−5.76)(−2.66)(−3.26)(−0.28)(−0.10)(−2.38)(−2.81)(−3.35)
Observations3068076615,413161519415732821458
Adj. R-squared0.5610.1420.1720.1320.2000.2070.2890.2140.476
Bank FEYesYesYesYesYesYesYesYesYes
Year FEYesYesYesYesYesYesYesYesYes
Bank clusteringYesYesYesYesYesYesYesYesYes
This table examines whether there are heterogeneous effects of bank characteristics on G_PPP across the different types of bank specializations. Specifically, we estimate Equation (1) for each bank group, namely international, agricultural, credit card, commercial, mortgage, consumer, other specializations, all other banks with assets less than 1 billion USD, and all other banks with assets greater than 1 billion USD. Table A1 in Appendix A provides detailed definitions of these specializations as well as the variables used in Table 5. T-statistics are in parentheses. *, **, and *** indicate statistical significance at the 10%, 5%, and 1% levels, respectively.
Table 6. Dynamic panel estimations—determinants of lending.
123456
Panel A: Panel Fixed EffectsPanel B: GMM
G_PPPG_CILSG_CILLG_PPPG_CILSG_CILL
PPPt−10.058 *** 0.007
(4.83) (0.13)
G_CILSt−1 −0.145 *** −0.409 ***
(−2.86) (−3.87)
G_CILLt−1 −0.398 *** −0.125 ***
(−29.24) (−2.62)
LDRt−10.010 ***−0.029 ***−0.001 ***0.581 ***−0.343 ***−0.242 **
(3.69)(−2.79)(−4.52)(4.75)(−4.82)(−2.41)
CARATIOt−10.030 **0.045 ***0.0410.6770.164 *0.315 ***
(2.05)(5.31)(1.29)(0.48)(1.67)(2.76)
NIMt−10.0970.0550.087−0.477−0.142 **−0.078
(0.83)(1.03)(0.67)(−0.82)(−2.46)(−0.03)
ROAt−1−0.350 ***−0.061 **0.339 ***−0.434 **−0.172 ***0.117
(−5.91)(−2.50)(5.30)(−2.19)(−4.42)(0.67)
LLOSSt−10.322 ***−0.106 **−0.1260.334 ***0.150 **−0.422 ***
(2.64)(−2.30)(−1.20)(3.45)(2.43)(−7.57)
UCLNt−10.0070.361 **2.818 ***1.4230.8900.196 ***
(0.93)(2.33)(2.80)(1.36)(0.31)(6.04)
NONIIt−10.204 ***0.030 **−0.171 ***0.364 **0.103 ***−0.321 ***
(4.52)(1.98)(−4.22)(2.34)(3.66)(−2.70)
LIQUIDITYt−10.619 *−2.032 **2.802 ***0.787 ***−0.441 **0.643
(1.66)(−2.12)(4.71)(3.37)(−2.53)(0.33)
G_GDPt−1−0.161 ***0.0040.006 ***−0.172 **0.737 ***0.022 ***
(−17.59)(1.61)(3.21)(−2.09)(5.65)(3.18)
G_COVIDt−10.626 ***0.197 ***−0.236 ***0.701 **−0.126 ***−0.235 ***
(27.36)(13.77)(−19.87)(2.39)(−3.62)(−3.03)
Constant−2.420 ***1.296−0.809
(−4.26)(1.46)(−1.41)
       
Observations29,44029,44029,44028,56129,44029,440
p-val (AR (2)) 0.5770.2170.939
p-val (Hansen Stat) 0.2040.1900.482
Adj. R-Square0.1290.1030.211
Bank FEYesYesYes
Year FEYesYesYes
Bank ClusteringYesYesYes
This table presents regression results for G_PPP, G_CILS, and G_CILL estimated from Equation (1) augmented with lagged lending growth. Panel A uses the ordinary least squares method while Panel B is based on the GMM technique. Table A1 in Appendix A provides detailed descriptions of all variables. AR (2) is a second-order serial correlation test. Hansen’s statistics provide tests of overidentifying restrictions. T-statistics are in parentheses. *, **, and *** indicate statistical significance at the 10%, 5%, and 1% levels, respectively.
Table 7. Controlling for size differences in the lending specifications.
(1)(2)(3)
G_PPPG_CILSG_CILL
LDRt−10.009 ***−0.026 ***−0.028 ***
(2.58)(−3.08)(−3.39)
CARATIOt−1−0.116 ***0.041 ***0.049 ***
(−5.01)(4.39)(2.70)
NIMt−1−0.0750.0660.432 ***
(−0.63)(0.83)(3.47)
ROAt−1−0.312 ***−0.097 ***0.126 ***
(−5.81)(−3.36)(3.43)
LLOSSt−10.197 **−0.109 **−0.239 ***
(2.17)(−2.07)(−3.20)
UCLNt−1−0.001 ***0.0040.019 *
(−7.06)(0.41)(1.89)
NONIIt−10.162 ***0.059 ***−0.049
(3.83)(3.12)(−1.46)
LIQUIDITYt−12.143 ***−1.586 **0.304
(4.40)(−2.06)(0.54)
SIZEt−1−7.397 ***0.0270.773 *
(−11.33)(1.58)(1.75)
G_GDPt−1−0.159 ***0.285 ***0.714 ***
(−27.98)(25.65)(42.98)
G_COVIDt−10.606 ***1.104 ***−2.032 ***
(37.65)(25.82)(−41.20)
Constant94.002 ***−1.590 **−10.971 *
(10.99)(−2.43)(−1.86)
Observations28,56129,44029,440
Adj. R-squared0.1720.0920.180
Bank FEYesYesYes
Year FEYesYesYes
Bank clusteringYesYesYes
This table augments Equation (1) with SIZE to check the robustness of our results to further controls for size differences. Columns 1, 2, and 3 deal with G_PPP, G_CILS, and G_CILL, respectively. Table A1 in Appendix A provides detailed descriptions of all variables. T-statistics are in parentheses. *, **, and *** indicate statistical significance at the 10%, 5%, and 1% levels, respectively.
Table 8. Baseline regression with the largest banks excluded.
123456789
Excl. 1 bn USDExcl. 10 bn USDExcl. SIBs
G_PPPG_CILSG_CILLG_PPPG_CILSG_CILLG_PPPG_CILSG_CILL
LDRt−10.015 ***−0.014 ***−0.037 ***0.016 ***−0.029 ***−0.027 ***0.014 ***−0.026 ***−0.029 ***
(4.67)(−4.21)(−4.80)(4.15)(−3.53)(−3.37)(3.87)(−3.09)(−3.41)
CARATIOt−10.0290.044 ***0.0300.0070.044 ***0.037 **0.0120.040 ***0.035 **
(1.56)(4.56)(1.64)(0.35)(4.79)(2.12)(0.64)(4.37)(1.99)
NIMt−10.032−0.0720.450 ***0.1390.0690.413 ***0.1100.0590.422 ***
(0.27)(−1.25)(3.35)(1.11)(0.86)(3.32)(0.91)(0.75)(3.43)
ROAt−1−0.384 ***−0.062 ***0.135 ***−0.442 ***−0.101 ***0.140 ***−0.402 ***−0.098 ***0.131 ***
(−5.24)(−2.65)(2.69)(−5.50)(−3.38)(3.28)(−5.87)(−3.36)(3.55)
LLOSSt−10.460 ***−0.090 *−0.427 ***0.379 **−0.133 **−0.282 ***0.343 **−0.112 **−0.245 ***
(3.43)(−1.66)(−3.64)(2.44)(−2.43)(−3.12)(2.50)(−2.14)(−3.12)
UCLNt−10.000−0.0040.004−0.0000.0030.008−0.0000.0050.007
(0.39)(−1.04)(0.42)(−0.75)(0.32)(0.94)(−0.50)(0.48)(0.79)
NONIIt−10.224 ***0.037 **−0.0620.262 ***0.061 ***−0.059 *0.238 ***0.059 ***−0.053
(4.45)(2.36)(−1.57)(4.53)(3.13)(−1.70)(4.62)(3.13)(−1.59)
LIQUIDITYt−11.012 **−0.5760.2590.876 *−1.867 **0.2580.744 *−1.639 **0.381
(2.23)(−1.60)(0.40)(1.85)(−2.50)(0.44)(1.65)(−2.10)(0.66)
G_GDPt−1−0.111 ***0.300 ***0.743 ***−0.127 ***0.291 ***0.734 ***−0.128 ***0.286 ***0.724 ***
(−21.13)(26.14)(40.17)(−24.96)(26.51)(43.69)(−25.72)(25.68)(43.84)
G_COVIDt−10.513 ***1.104 ***−2.112 ***0.558 ***1.120 ***−2.094 ***0.558 ***1.107 ***−2.066 ***
(30.93)(26.13)(−39.15)(34.72)(26.53)(−42.46)(35.65)(25.86)(−42.54)
Constant−2.928 ***−1.885 ***−0.316−2.917 ***−1.005−0.960−2.675 ***−1.210 *−0.873
(−5.22)(−5.42)(−0.39)(−4.34)(−1.50)(−1.20)(−4.14)(−1.76)(−1.06)
Observations22,81526,58026,53427,62928,97628,97528,41729,23029,255
Adj. R-squared0.1400.0900.1600.1280.0980.1790.1180.0920.179
Bank FEYesYesYesYesYesYesYesYesYes
Year FEYesYesYesYesYesYesYesYesYes
Bank clusteringYesYesYesYesYesYesYesYesYes
This table reports results from consecutively estimating Equation (1) for G_PPP, G_CILS, and G_CILL, when we exclude very large banks. Specifically, Columns 1–3 drop banks with total assets greater than 1 billion USD (10 billion USD), whereas Columns 6–9 exclude systematically important banks. Table A1 in Appendix A provides detailed descriptions of all variables. T-statistics are in parentheses. *, **, and *** indicate statistical significance at the 10%, 5%, and 1% levels, respectively.
Disclaimer/Publisher’s Note: The statements, opinions and data contained in all publications are solely those of the individual author(s) and contributor(s) and not of MDPI and/or the editor(s). MDPI and/or the editor(s) disclaim responsibility for any injury to people or property resulting from any ideas, methods, instructions or products referred to in the content.

