
The Accuracy of an Optical White Light Desktop 3D Scanner and Cone Beam CT Scanner Compared to a Multi-Slice CT Scanner to Digitize Anatomical 3D Models: A Pilot Study

 , , , and
Abstract
1. Introduction
2. Materials and Methods
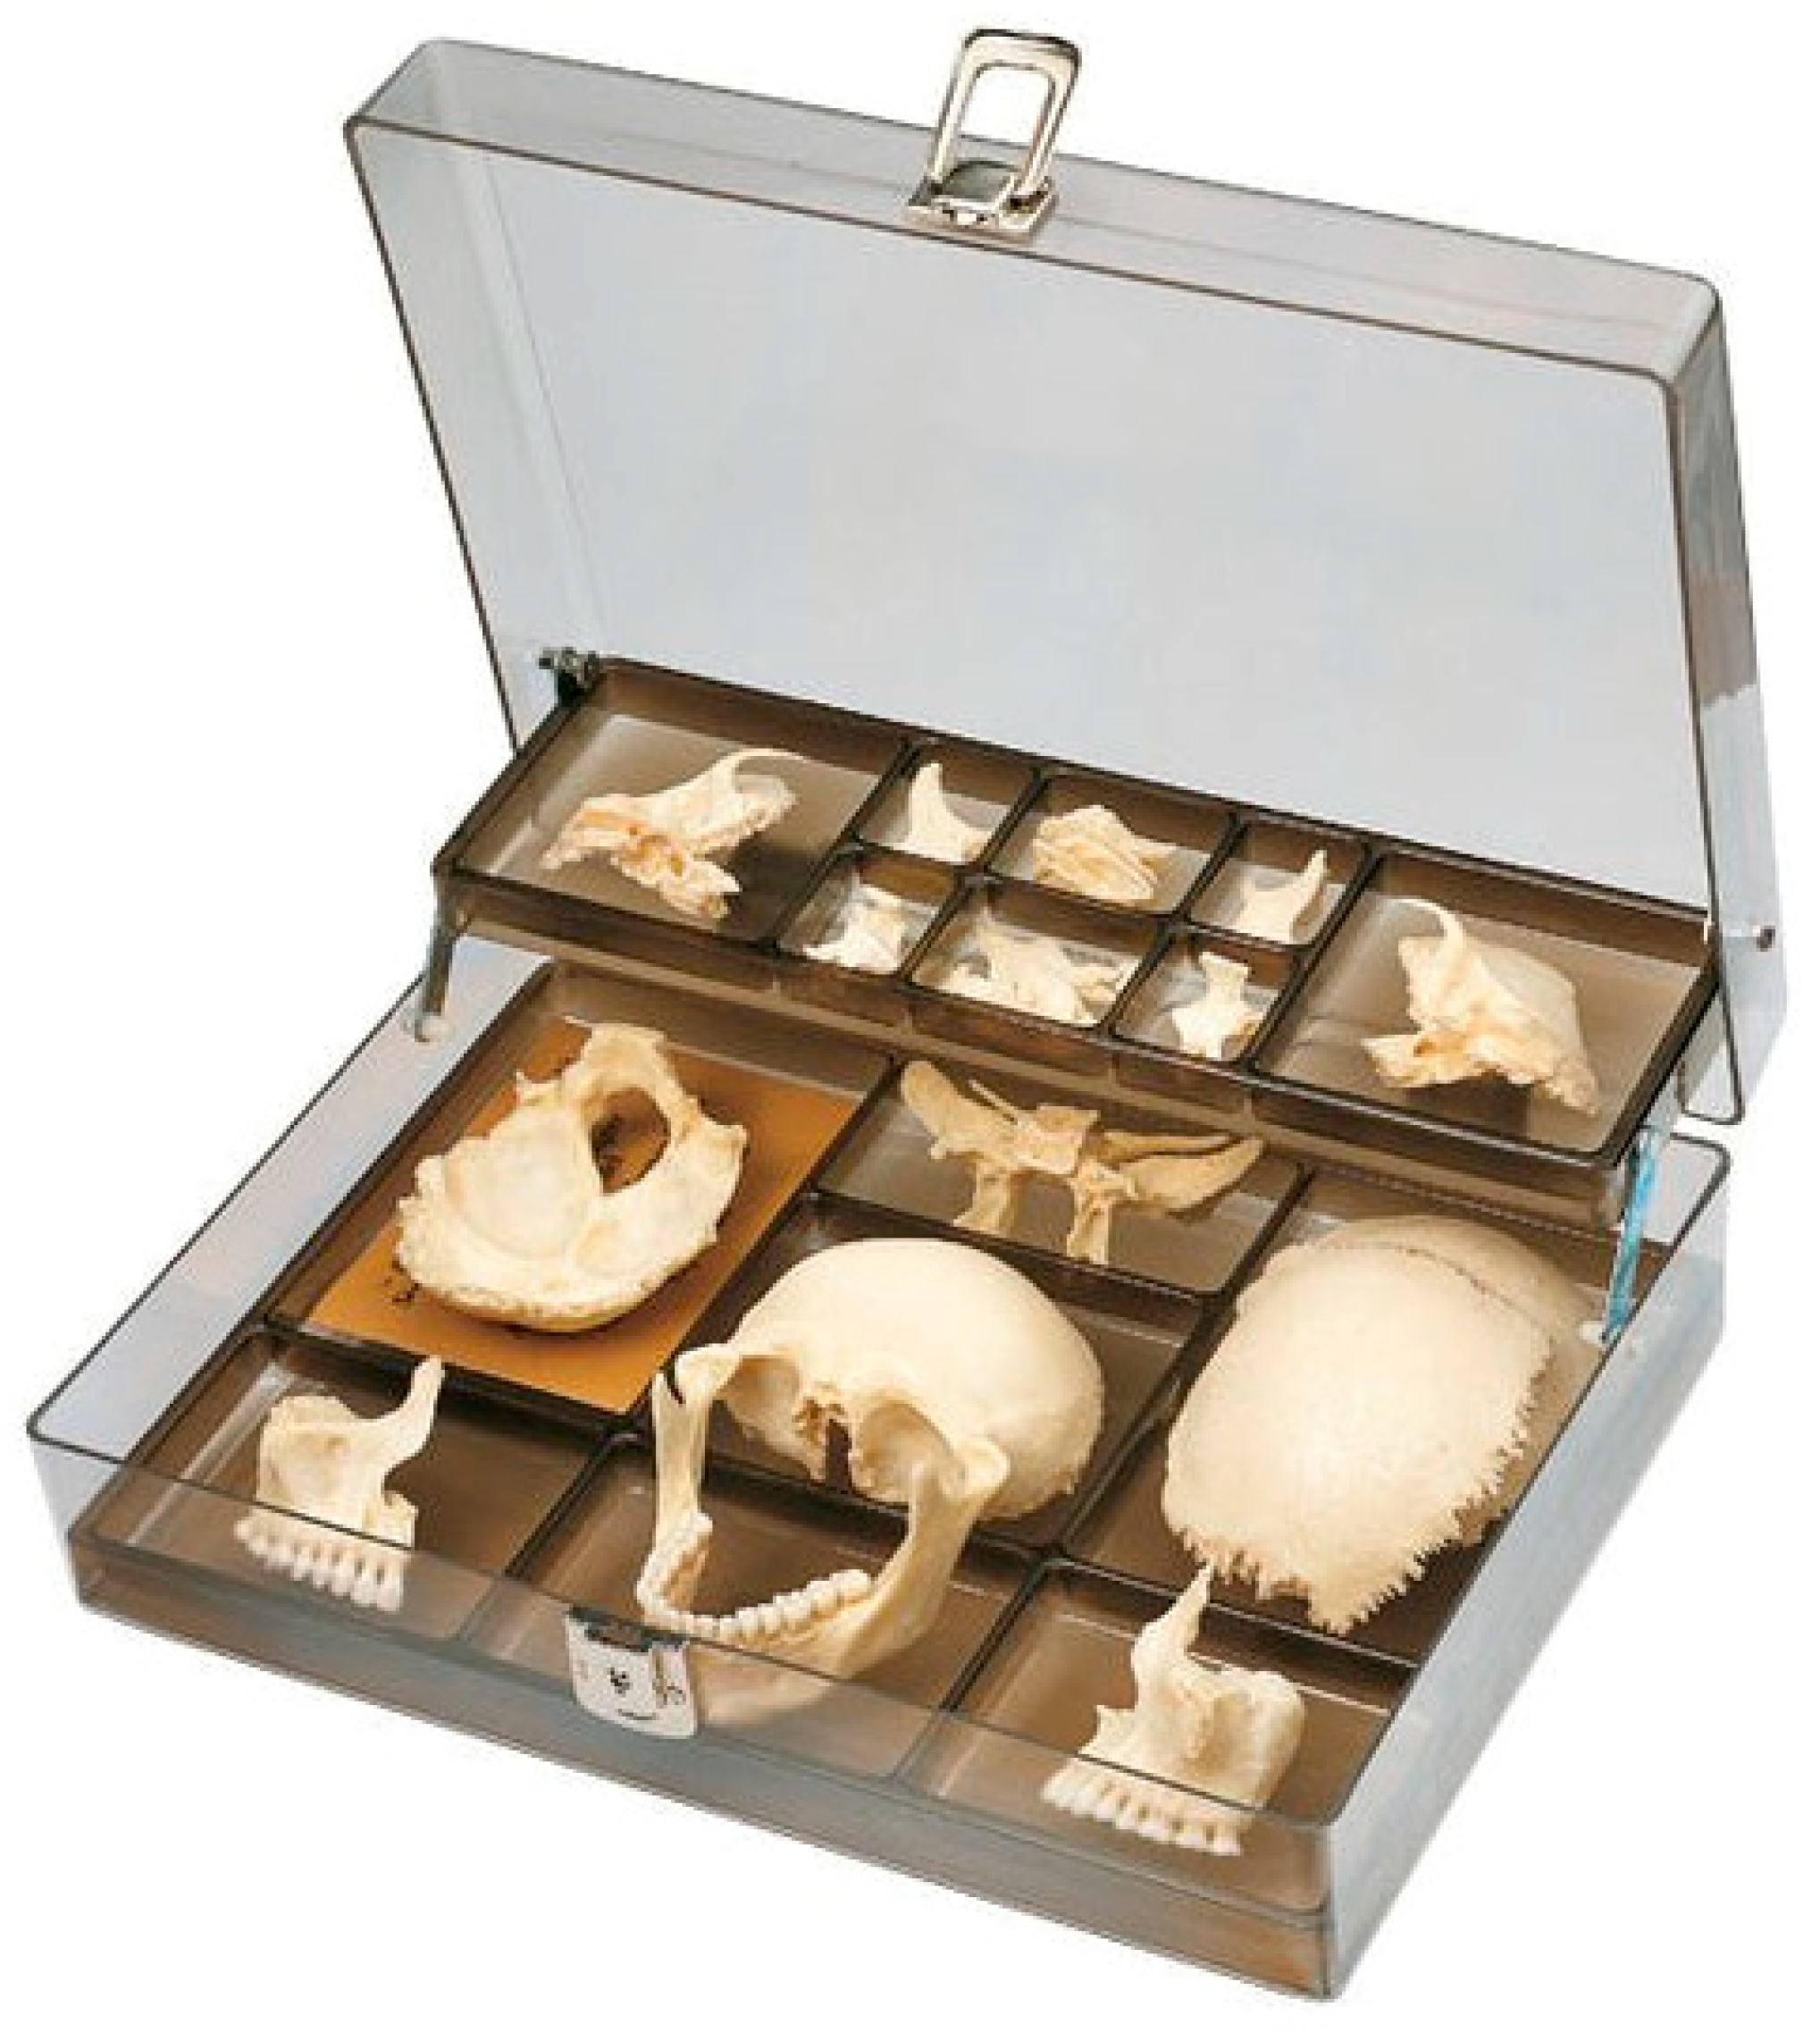
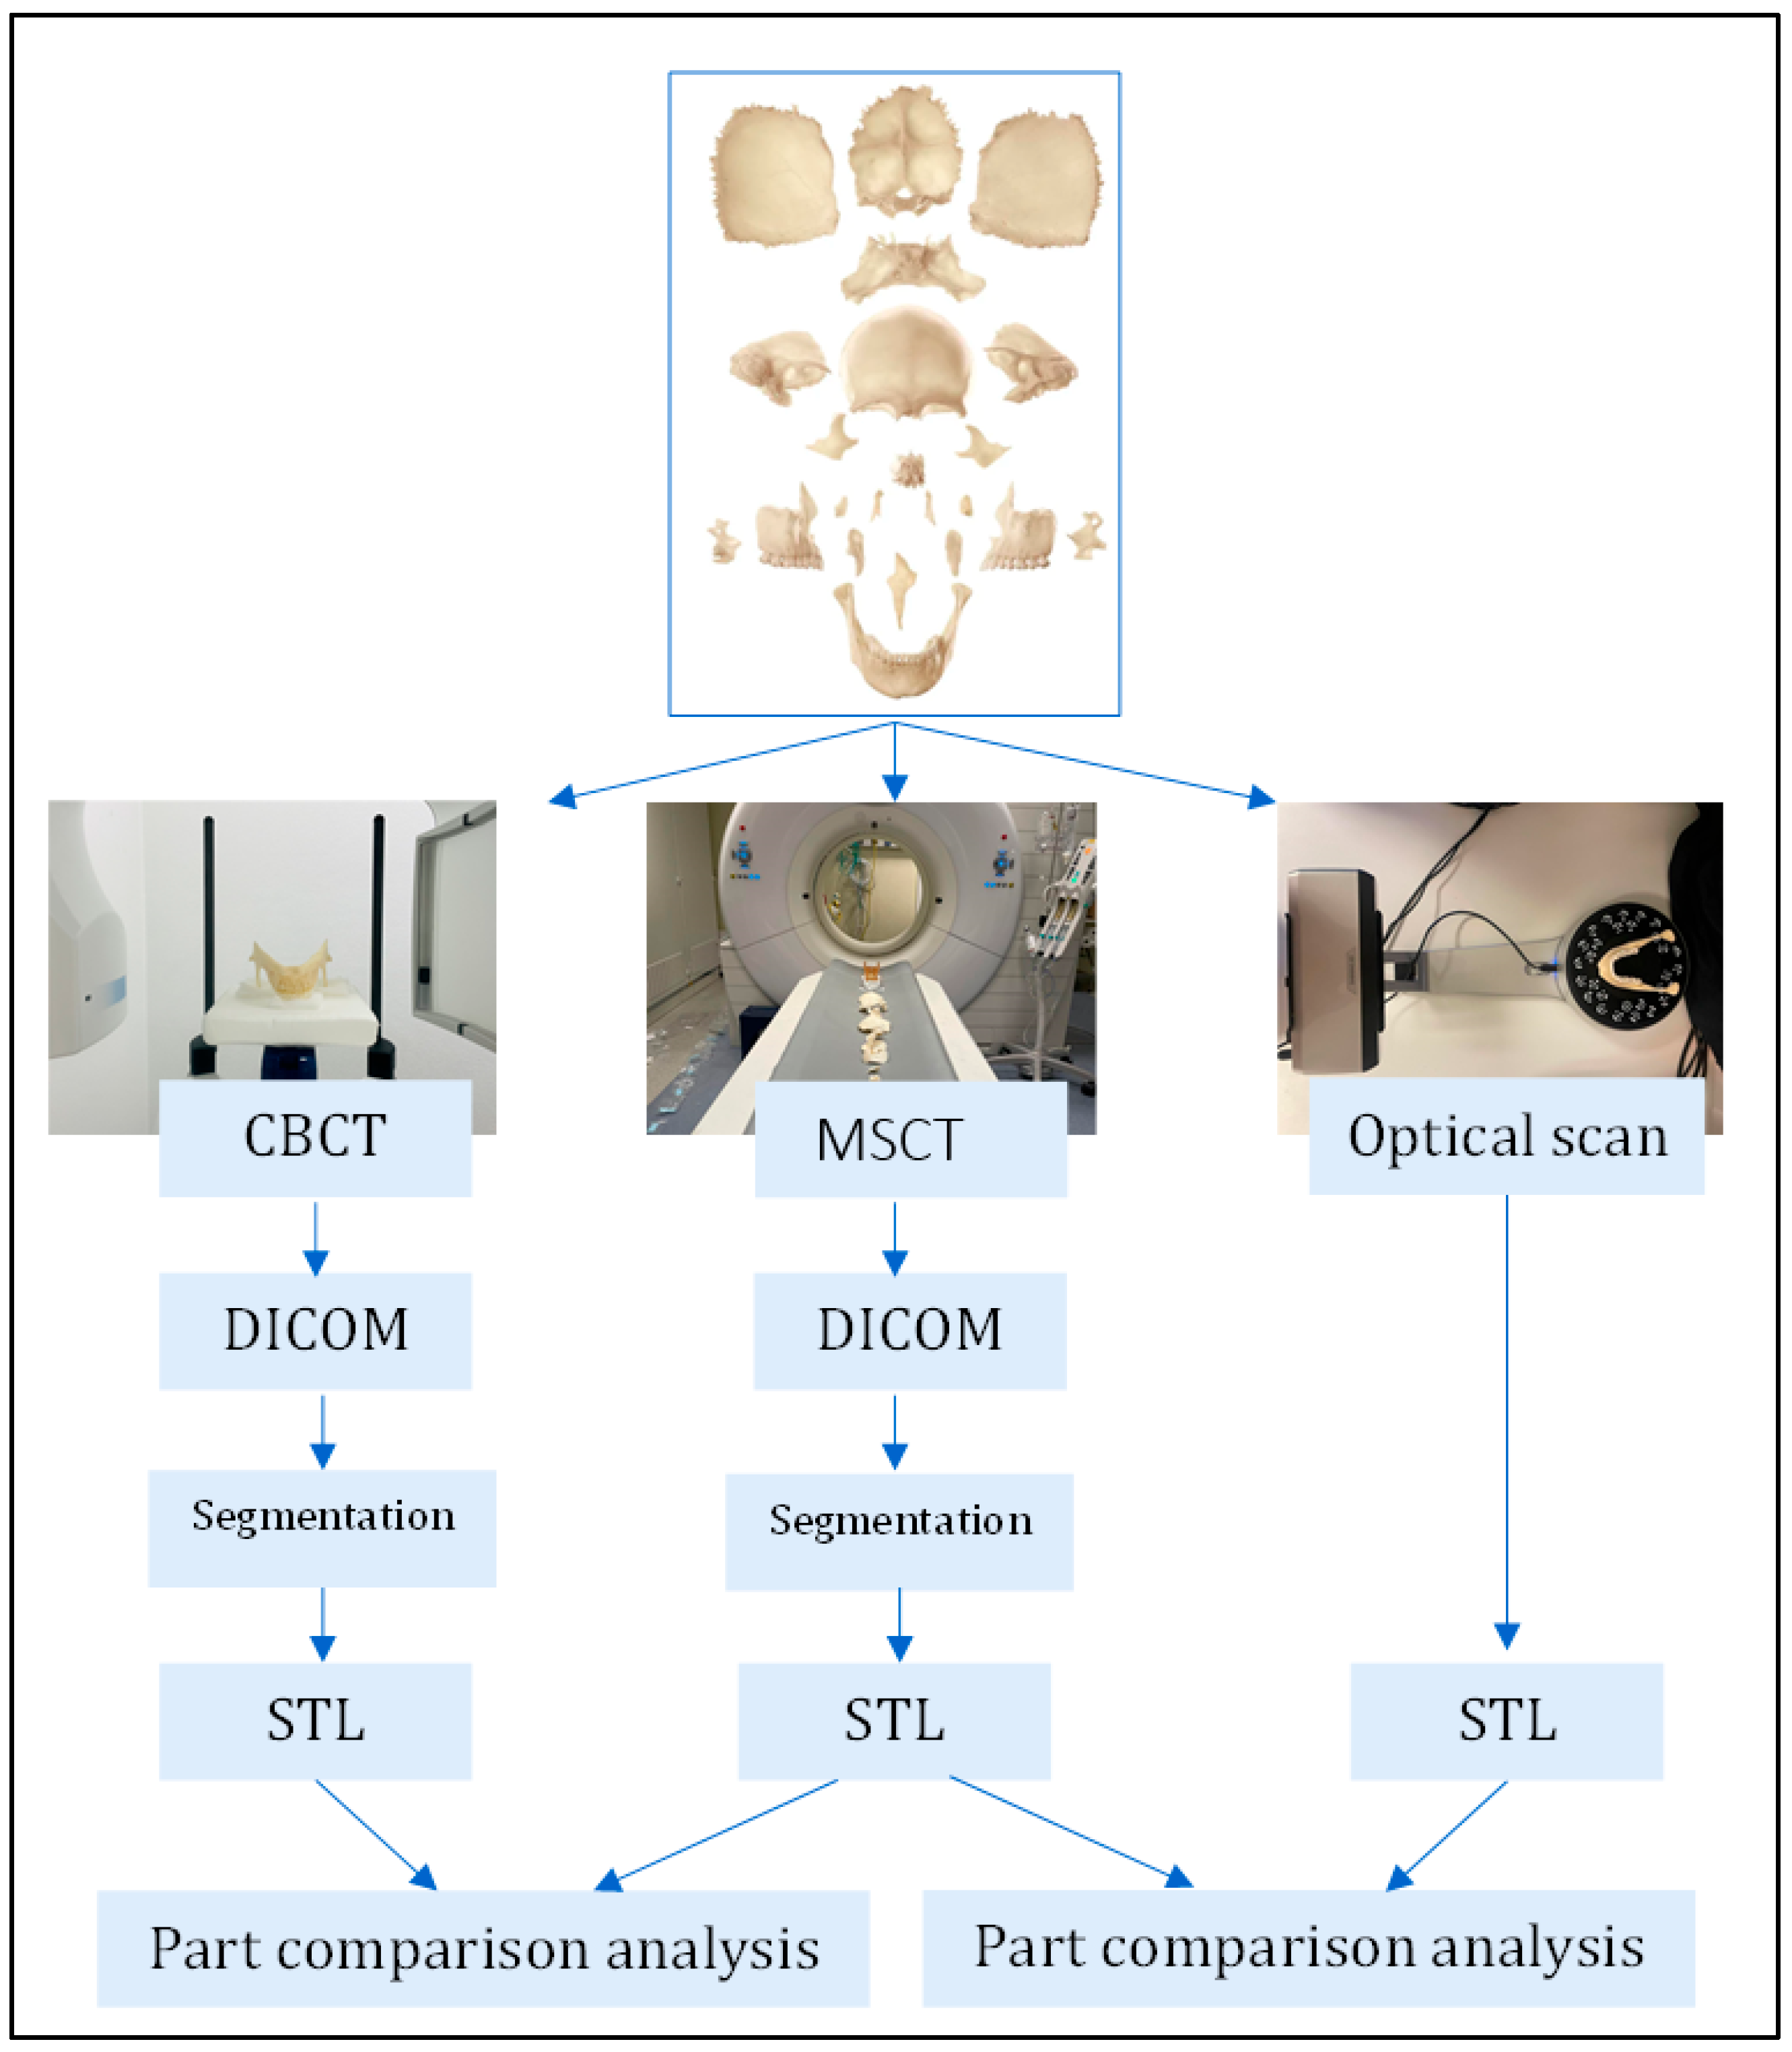
2.1. Digitization of 3D Models
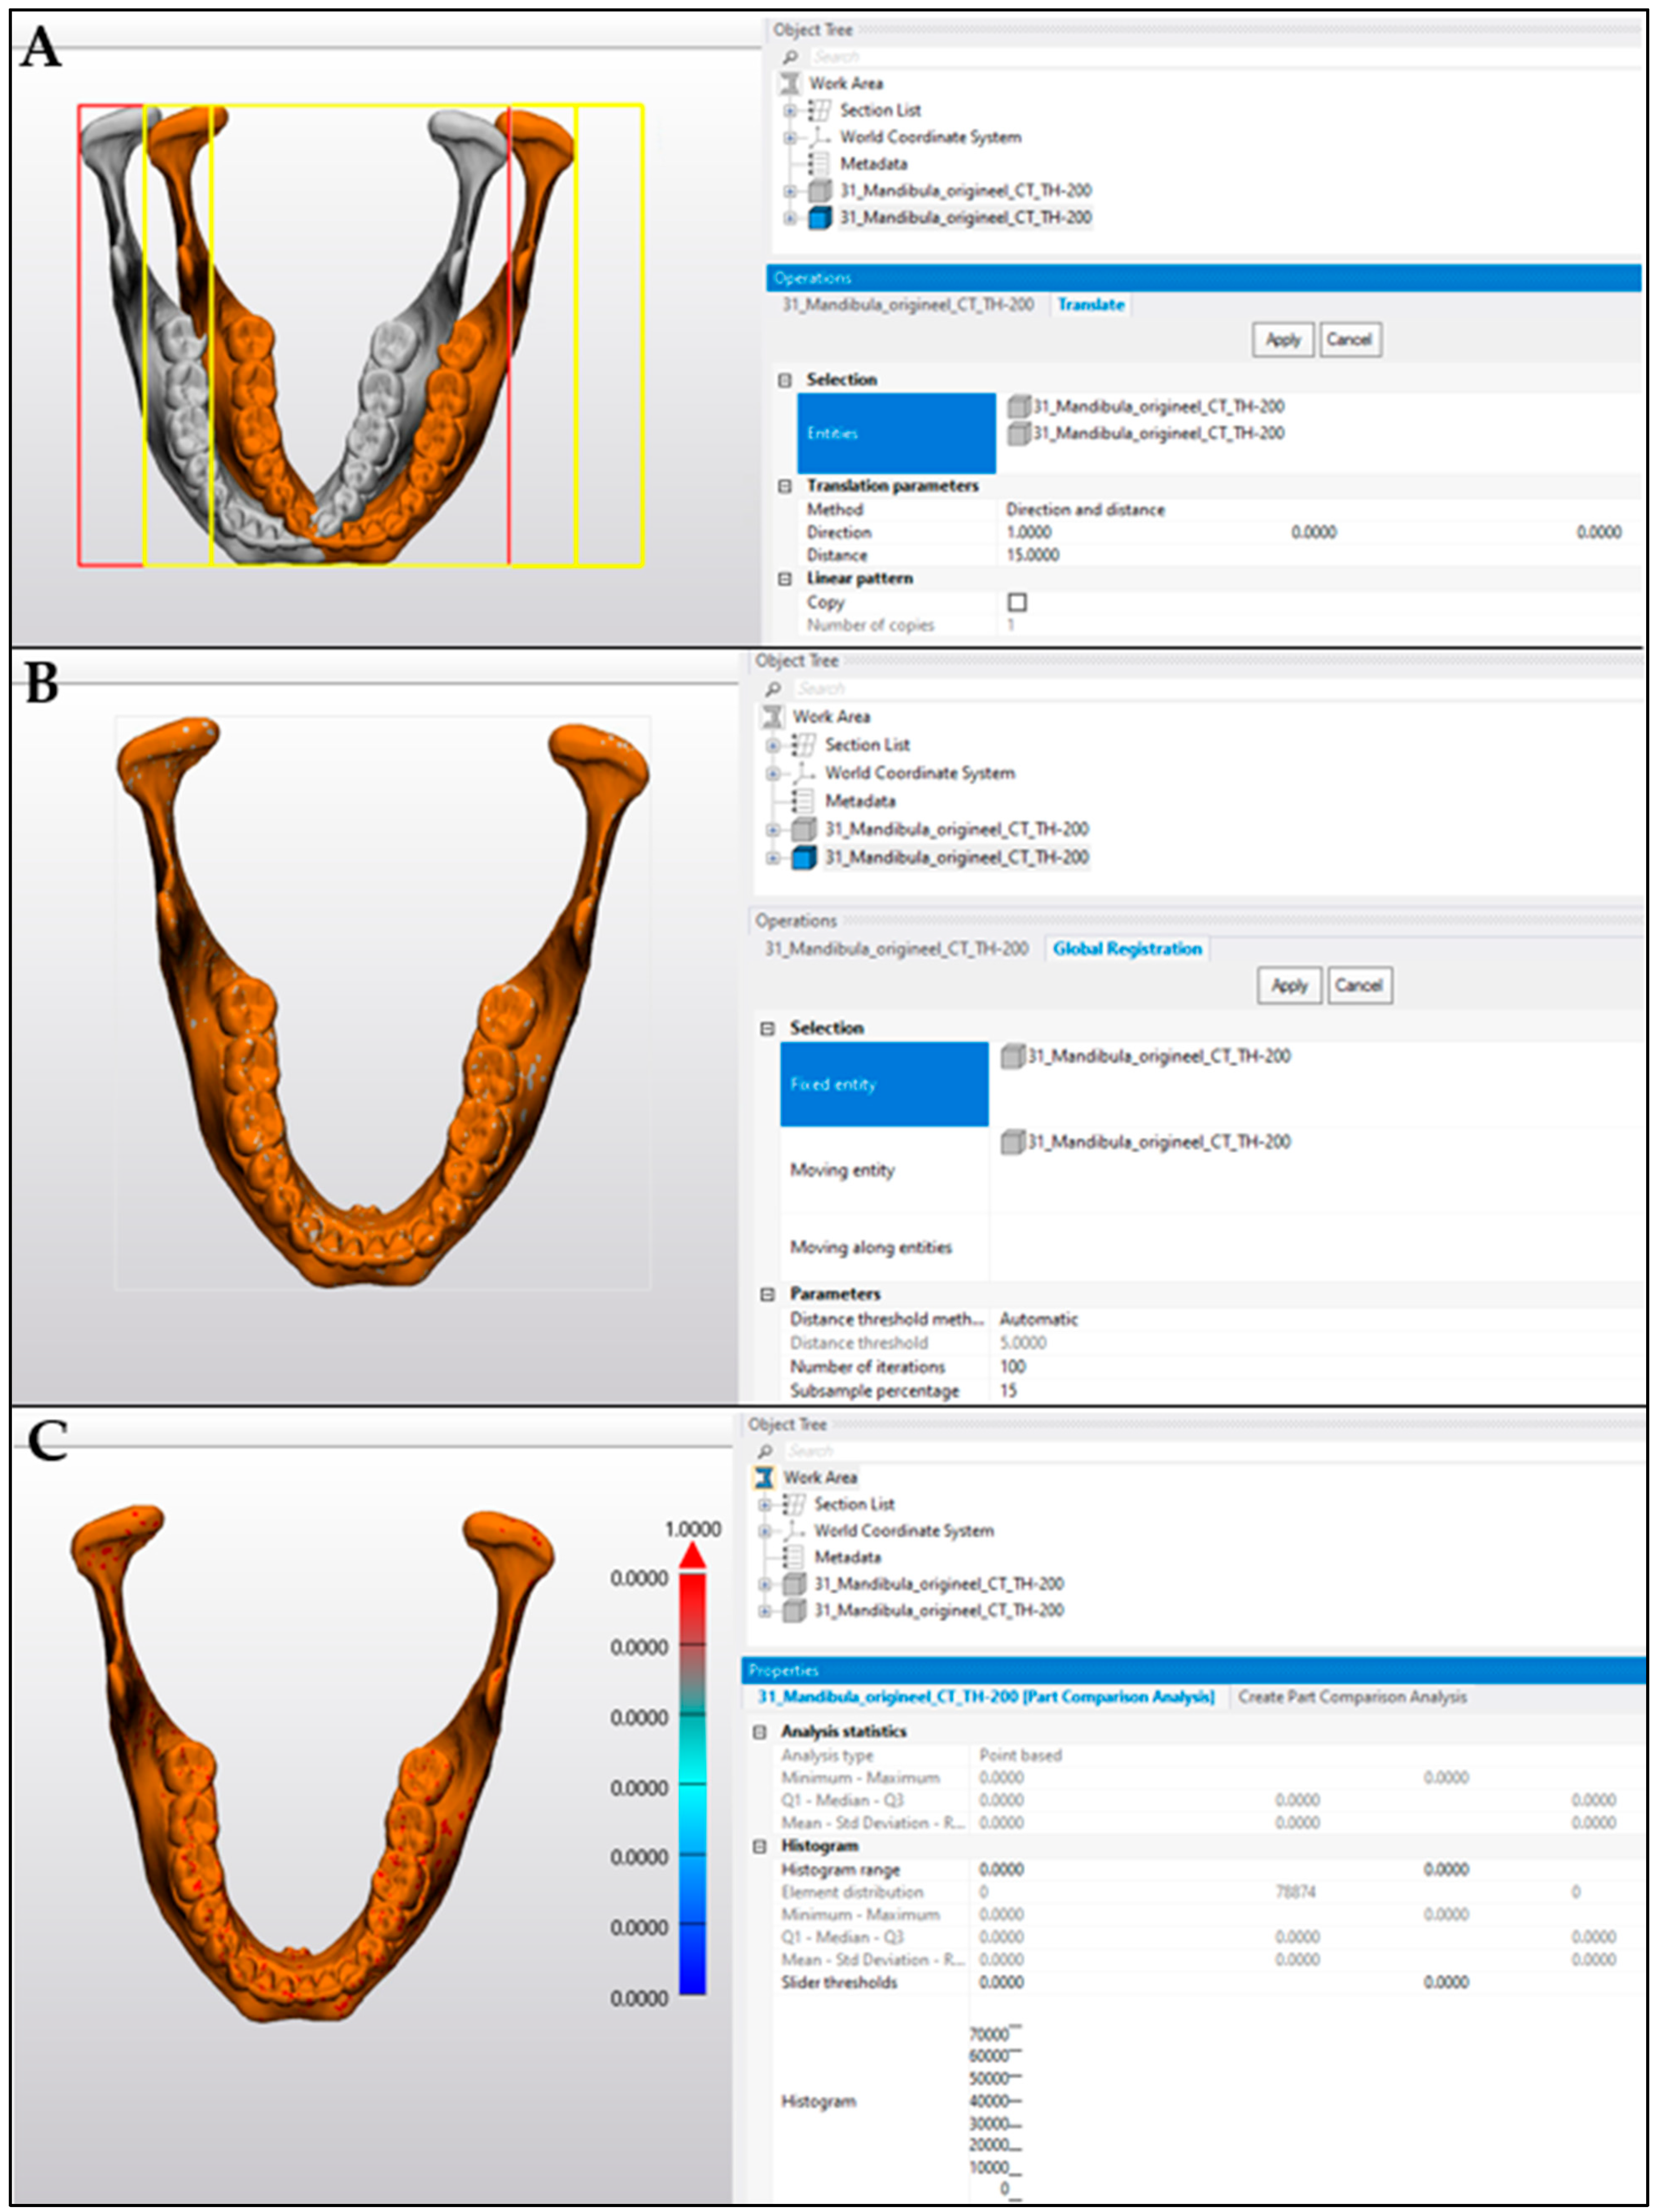
2.2. Comparison Analysis
2.3. Statistics
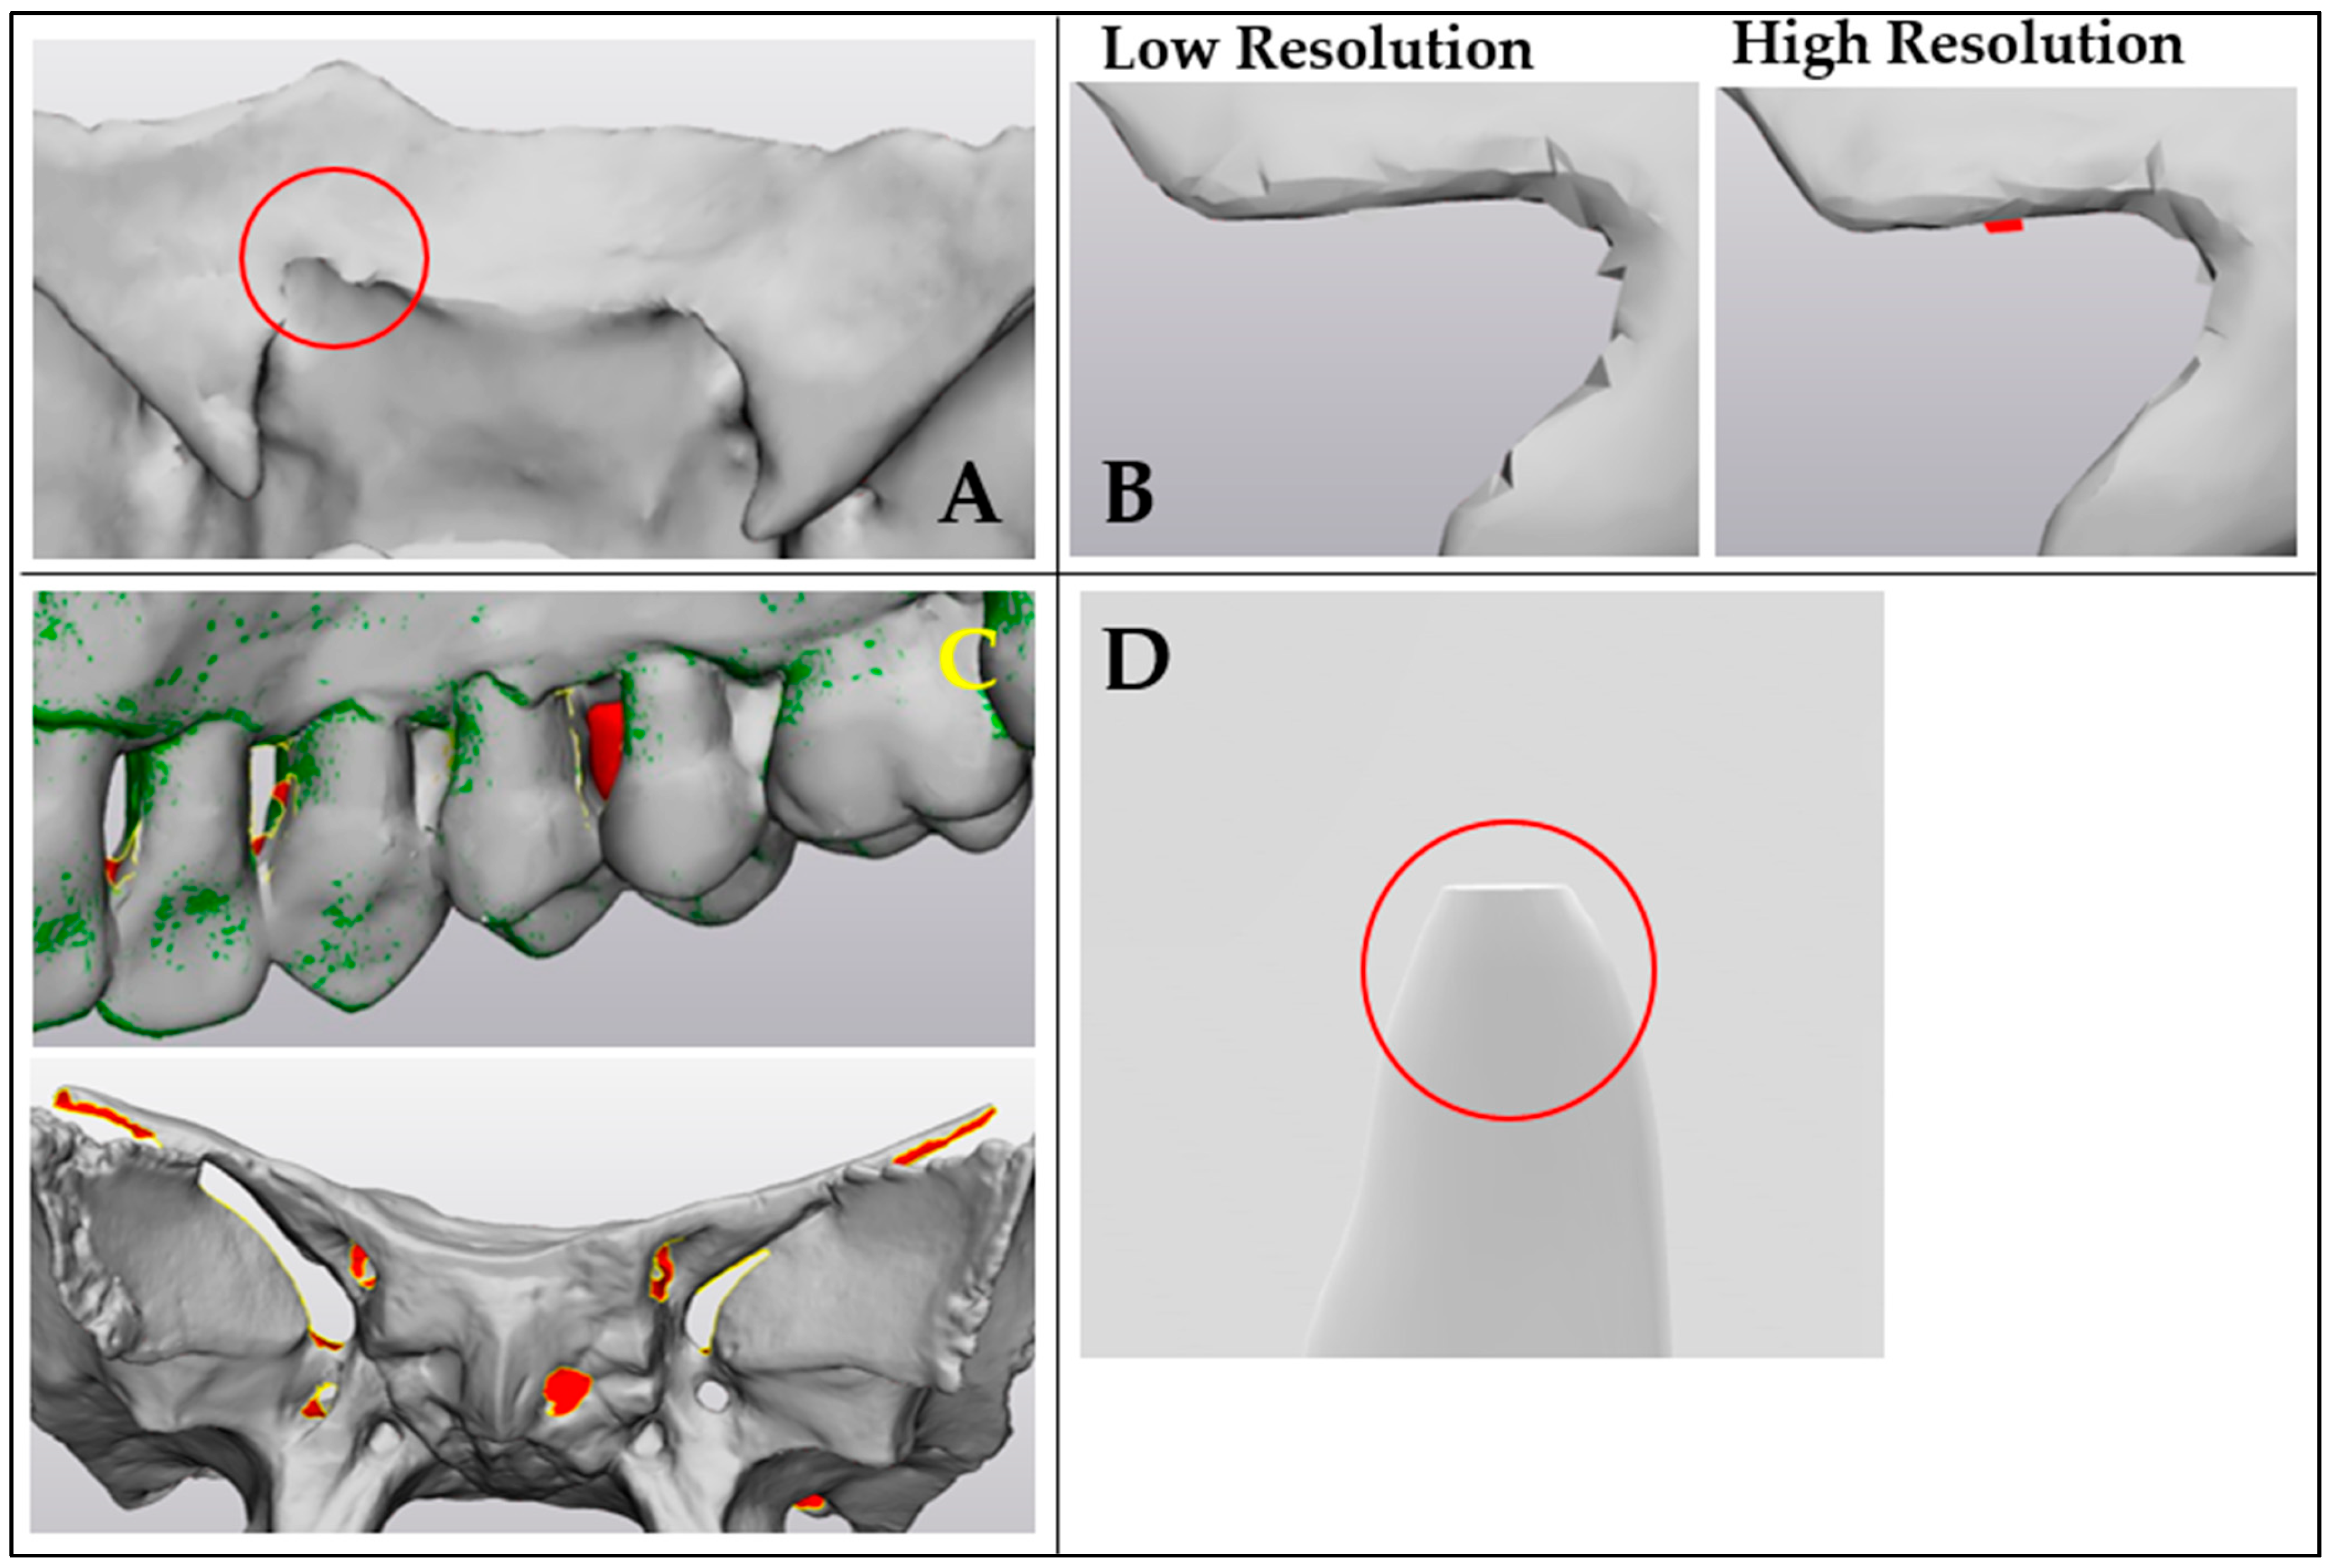
3. Results
4. Discussion
5. Conclusions
Author Contributions
Funding
Institutional Review Board Statement
Informed Consent Statement
Data Availability Statement
Acknowledgments
Conflicts of Interest
Abbreviations
| 3D | three-dimensional |
| AM | Additive Manufacturing |
| CAD | computer-aided design |
| CAM | computer-aided manufacturing |
| CBCT | cone beam CT |
| CMF | craniomaxillofacial |
| DICOM | Digital Imaging and Communications in Medicine |
| HDR | high dynamic range |
| HROS | High resolution optical scan |
| HU | Hounsfield unit |
| L | left |
| LROS | low-resolution optical scan |
| MD | mean difference |
| MDR | Medical Device Regulation |
| MIS | Mimics Innovation Suite |
| mA | milliampere |
| mm | millimeter |
| mV | millivolt |
| MSCT | multi-slice CT scanner |
| OWLDS | optical white-light desktop scanner |
| Poi | points |
| QMS | Quality Management System |
| R | right |
| RMS | root mean square |
| SD | standard deviation |
| STL | stereolithography or Standard Tessellation Language |
| Su | surface |
| TriA | triangles |
| qGV | quantitative Gray Values |
| Vo | volume |
| VSP | virtual surgical planning |
References
- Louvrier, A.; Marty, P.; Barrabé, A.; Euvrard, E.; Chatelain, B.; Weber, E.; Meyer, C. How Useful Is 3D Printing in Maxillofacial Surgery? J. Stomatol. Oral Maxillofac. Surg. 2017, 118, 206–212. [Google Scholar] [CrossRef] [PubMed]
- King, B.J.; Park, E.P.; Christensen, B.J.; Danrad, R. On-Site 3-Dimensional Printing and Preoperative Adaptation Decrease Operative Time for Mandibular Fracture Repair. J. Oral Maxillofac. Surg. 2018, 76, 1950.e1–1950.e8. [Google Scholar] [CrossRef] [PubMed]
- Khalil, W.; EzEldeen, M.; Van De Casteele, E.; Shaheen, E.; Sun, Y.; Shahbazian, M.; Olszewski, R.; Politis, C.; Jacobs, R. Validation of Cone Beam Computed Tomography–Based Tooth Printing Using Different Three-Dimensional Printing Technologies. Oral Surg. Oral Med. Oral Pathol. Oral Radiol. 2016, 121, 307–315. [Google Scholar] [CrossRef] [PubMed]
- Weijs, W.L.J.; Coppen, C.; Schreurs, R.; Vreeken, R.D.; Verhulst, A.C.; Merkx, M.A.W.; Bergé, S.J.; Maal, T.J.J. Accuracy of Virtually 3D Planned Resection Templates in Mandibular Reconstruction. J. Cranio-Maxillofac. Surg. 2016, 44, 1828–1832. [Google Scholar] [CrossRef]
- Etemad-Shahidi, Y.; Qallandar, O.B.; Evenden, J.; Alifui-Segbaya, F.; Ahmed, K.E. Accuracy of 3-Dimensionally Printed Full-Arch Dental Models: A Systematic Review. J. Clin. Med. 2020, 9, 3357. [Google Scholar] [CrossRef]
- George, E.; Liacouras, P.; Rybicki, F.J.; Mitsouras, D. Measuring and Establishing the Accuracy and Reproducibility of 3D Printed Medical Models. RadioGraphics 2017, 37, 1424–1450. [Google Scholar] [CrossRef]
- Msallem, B.; Sharma, N.; Cao, S.; Halbeisen, F.S.; Zeilhofer, H.-F.; Thieringer, F.M. Evaluation of the Dimensional Accuracy of 3D-Printed Anatomical Mandibular Models Using FFF, SLA, SLS, MJ, and BJ Printing Technology. J. Clin. Med. 2020, 9, 817. [Google Scholar] [CrossRef]
- Salmi, M.; Paloheimo, K.-S.; Tuomi, J.; Wolff, J.; Mäkitie, A. Accuracy of Medical Models Made by Additive Manufacturing (Rapid Manufacturing). J. Cranio-Maxillofac. Surg. 2013, 41, 603–609. [Google Scholar] [CrossRef]
- Efanov, J.I.; Roy, A.-A.; Huang, K.N.; Borsuk, D.E. Virtual Surgical Planning: The Pearls and Pitfalls. Plast. Reconstr. Surg. Glob. Open 2018, 6, e1443. [Google Scholar] [CrossRef]
- Kamio, T.; Onda, T. Fused Deposition Modeling 3D Printing in Oral and Maxillofacial Surgery: Problems and Solutions. Cureus 2022, 14, e28906. [Google Scholar] [CrossRef]
- Singh, G.D.; Singh, M. Virtual Surgical Planning: Modeling from the Present to the Future. J. Clin. Med. 2021, 10, 5655. [Google Scholar] [CrossRef] [PubMed]
- Shqaidef, A.; Ayoub, A.F.; Khambay, B.S. How Accurate Are Rapid Prototyped (RP) Final Orthognathic Surgical Wafers? A Pilot Study. Br. J. Oral Maxillofac. Surg. 2014, 52, 609–614. [Google Scholar] [CrossRef] [PubMed]
- Dorweiler, B.; Baqué, P.E.; Chaban, R.; Ghazy, A.; Salem, O. Quality Control in 3D Printing: Accuracy Analysis of 3D-Printed Models of Patient-Specific Anatomy. Materials 2021, 14, 1021. [Google Scholar] [CrossRef]
- Kulczyk, T.; Rychlik, M.; Lorkiewicz-Muszyńska, D.; Abreu-Głowacka, M.; Czajka-Jakubowska, A.; Przystańska, A. Computed Tomography versus Optical Scanning: A Comparison of Different Methods of 3D Data Acquisition for Tooth Replication. BioMed Res. Int. 2019, 2019, 4985121. [Google Scholar] [CrossRef]
- Ugidos Lozano, M.T.; Blaya Haro, F.; Ruggiero, A.; Manzoor, S.; Nuere Menendez-Pidal, S.; Juanes Méndez, J.A. Different Digitalization Techniques for 3D Printing of Anatomical Pieces. J. Med. Syst. 2018, 42, 46. [Google Scholar] [CrossRef]
- Reddy, M.V.; Eachempati, K.; Gurava Reddy, A.V.; Mugalur, A. Error Analysis: How Precise Is Fused Deposition Modeling in Fabrication of Bone Models in Comparison to the Parent Bones? Indian J. Orthop. 2018, 52, 196–201. [Google Scholar] [CrossRef]
- Bücking, T.M.; Hill, E.R.; Robertson, J.L.; Maneas, E.; Plumb, A.A.; Nikitichev, D.I. From Medical Imaging Data to 3D Printed Anatomical Models. PLoS ONE 2017, 12, e0178540. [Google Scholar] [CrossRef]
- Gaur, A.; Dhillon, M.; Puri, N.; Sethi Ahuja, U.; Rathore, A. Questionable Accuracy of CBCT in Determining Bone Density: A Comparative CBCT–CT in Vitro Study. Dent. Med. Probl. 2022, 59, 413–419. [Google Scholar] [CrossRef]
- Venkatesh, E.; Venkatesh Elluru, S. Cone beam computed tomography: Basics and applications in dentistry. J. Istanb. Univ. Fac. Dent. 2017, 51, 102–121. [Google Scholar] [CrossRef]
- Razi, T.; Niknami, M.; Alavi Ghazani, F. Relationship between Hounsfield Unit in CT Scan and Gray Scale in CBCT. J. Dent. Res. Dent. Clin. Dent. Prospect. 2014, 8, 107–110. [Google Scholar] [CrossRef]
- Douglass, M.J.J. Can Optical Scanning Technologies Replace CT for 3D Printed Medical Devices in Radiation Oncology? J. Med. Radiat. Sci. 2022, 69, 139–142. [Google Scholar] [CrossRef] [PubMed]
- Huotilainen, E.; Jaanimets, R.; Valášek, J.; Marcián, P.; Salmi, M.; Tuomi, J.; Mäkitie, A.; Wolff, J. Inaccuracies in Additive Manufactured Medical Skull Models Caused by the DICOM to STL Conversion Process. J. Cranio-Maxillofac. Surg. 2014, 42, e259–e265. [Google Scholar] [CrossRef] [PubMed]
- Katsumata, A.; Hirukawa, A.; Okumura, S.; Naitoh, M.; Fujishita, M.; Ariji, E.; Langlais, R.P. Relationship between Density Variability and Imaging Volume Size in Cone-Beam Computerized Tomographic Scanning of the Maxillofacial Region: An in Vitro Study. Oral Surg. Oral Med. Oral Pathol. Oral Radiol. Endodontol. 2009, 107, 420–425. [Google Scholar] [CrossRef]
- Liang, X.; Jacobs, R.; Hassan, B.; Li, L.; Pauwels, R.; Corpas, L.; Souza, P.C.; Martens, W.; Shahbazian, M.; Alonso, A.; et al. A Comparative Evaluation of Cone Beam Computed Tomography (CBCT) and Multi-Slice CT (MSCT). Eur. J. Radiol. 2010, 75, 265–269. [Google Scholar] [CrossRef]
- Liang, X.; Lambrichts, I.; Sun, Y.; Denis, K.; Hassan, B.; Li, L.; Pauwels, R.; Jacobs, R. A Comparative Evaluation of Cone Beam Computed Tomography (CBCT) and Multi-Slice CT (MSCT). Part II: On 3D Model Accuracy. Eur. J. Radiol. 2010, 75, 270–274. [Google Scholar] [CrossRef]
- Pauwels, R.; Jacobs, R.; Singer, S.R.; Mupparapu, M. CBCT-Based Bone Quality Assessment: Are Hounsfield Units Applicable? Dentomaxillofac. Radiol. 2015, 44, 20140238. [Google Scholar] [CrossRef]
- Verykokou, S.; Ioannidis, C. An Overview on Image-Based and Scanner-Based 3D Modeling Technologies. Sensors 2023, 23, 596. [Google Scholar] [CrossRef]
- Mendricky, R.; Sobotka, J. Accuracy Comparison of the Optical 3D Scanner and CT Scanner. Manuf. Technol. 2020, 20, 791–801. [Google Scholar] [CrossRef]
- Cunha, H.S.; da Costa Moraes, C.A.; de Faria Valle Dornelles, R.; da Rosa, E.L.S. Accuracy of Three-Dimensional Virtual Simulation of the Soft Tissues of the Face in OrtogOnBlender for Correction of Class II Dentofacial Deformities: An Uncontrolled Experimental Case-Series Study. Oral Maxillofac. Surg. 2021, 25, 319–335. [Google Scholar] [CrossRef]
- Liu, F.; Liang, J.; Shen, L.; Yang, M.; Zhang, D.; Lai, Z. Case Study of 3D Fingerprints Applications. PLoS ONE 2017, 12, e0175261. [Google Scholar] [CrossRef]
- Oth, O.; Dauchot, C.; Orellana, M.; Glineur, R. How to Sterilize 3D Printed Objects for Surgical Use? An Evaluation of the Volumetric Deformation of 3D-Printed Genioplasty Guide in PLA and PETG after Sterilization by Low-Temperature Hydrogen Peroxide Gas Plasma. Open Dent. J. 2019, 13, 410–417. [Google Scholar] [CrossRef]
- Sharma, A.; Sasaki, D.; Rickey, D.W.; Leylek, A.; Harris, C.; Johnson, K.; Alpuche Aviles, J.E.; McCurdy, B.; Egtberts, A.; Koul, R.; et al. Low-Cost Optical Scanner and 3-Dimensional Printing Technology to Create Lead Shielding for Radiation Therapy of Facial Skin Cancer: First Clinical Case Series. Adv. Radiat. Oncol. 2018, 3, 288–296. [Google Scholar] [CrossRef] [PubMed]
- Shaheen, E.; Alhelwani, A.; Van De Casteele, E.; Politis, C.; Jacobs, R. Evaluation of Dimensional Changes of 3D Printed Models After Sterilization: A Pilot Study. Open Dent. J. 2018, 12, 72–79. [Google Scholar] [CrossRef] [PubMed]
- Crowe, S.; Luscombe, J.; Maxwell, S.; Simpson-Page, E.; Poroa, T.; Wilks, R.; Li, W.; Cleland, S.; Chan, P.; Lin, C.; et al. Evaluation of Optical 3D Scanning System for Radiotherapy Use. J. Med. Radiat. Sci. 2022, 69, 218–226. [Google Scholar] [CrossRef]


| Facial Bone | MSCT (Gold Standard) | CBCT (Planmeca) | OWLDS (Low Resolution) | |||||||||
|---|---|---|---|---|---|---|---|---|---|---|---|---|
| Part Size (cm3) | Vo | Su | TriA | Poi | Vo | Su | TriA | Poi | Vo | Su | TriA | Poi |
| <1000 | ||||||||||||
| Nasal (R) | 315 | 421 | 8894 | 4449 | 348 | 464 | 6314 | 3159 | 322 | 461 | 8864 | 4434 |
| Nasal (L) | 287 | 406 | 8724 | 4364 | 249 | 419 | 5210 | 2607 | 321 | 476 | 8770 | 4385 |
| Lacrimal (R) | 314 | 340 | 7484 | 3744 | 327 | 367 | 4420 | 2212 | 353 | 391 | 7502 | 3753 |
| Lacrimal (L) | 302 | 366 | 7544 | 3774 | 319 | 400 | 4550 | 2277 | 383 | 437 | 7408 | 3706 |
| 1000–10,000 | ||||||||||||
| Vomer | 1233 | 1563 | 25,748 | 12,876 | 1269 | 1662 | 14,080 | 7042 | 1266 | 1687 | 26,186 | 13,095 |
| Concha (R) | 1409 | 1284 | 24,080 | 12,042 | 1436 | 1346 | 14,462 | 7233 | 1405 | 1364 | 24,328 | 12,166 |
| Concha (L) | 1461 | 1300 | 23,874 | 11,939 | 1477 | 1362 | 14,656 | 7330 | 1414 | 1373 | 23,718 | 11,861 |
| Palatine (R) | 1976 | 2031 | 38,194 | 19,097 | 2062 | 2172 | 29,738 | 14,865 | 2045 | 2114 | 38,484 | 19,244 |
| Palatine (L) | 1963 | 1936 | 38,724 | 19,360 | 2031 | 2055 | 28,030 | 14,013 | 1994 | 2022 | 38,346 | 19,175 |
| Zygomatic (R) | 2834 | 2479 | 30,550 | 15,275 | 2905 | 2459 | 27,964 | 13,984 | 2838 | 2483 | 30,832 | 15,418 |
| Zygomatic (L) | 2804 | 2320 | 30,768 | 15,386 | 3885 | 2302 | 26,392 | 13,198 | 2832 | 2324 | 30,638 | 15,321 |
| 10,000–50,000 | ||||||||||||
| Ethmoid | 12,082 | 7361 | 180,164 | 90,070 | 11,962 | 8364 | 115,156 | 57,564 | 12,664 | 5277 | 180,516 | 90,952 |
| Maxilla (R) | 20,230 | 14,316 | 125,912 | 62,954 | 20,749 | 13,931 | 133,140 | 66,580 | 29,296 * | 105,72 | 128,057 | 64,378 |
| Maxilla (L) | 19,551 | 12,951 | 125,802 | 62,905 | 20,057 | 12,712 | 129,976 | 64,988 | 23,751 * | 10,264 | 125,341 | 63,284 |
| Sphenoid | 24,161 | 18,861 | 168,822 | 84,363 | 28,346 | 19,334 | 167,758 | 83,845 | 32,820 * | 16,945 | 166,433 | 83,747 |
| Temporal (R) | 23,861 | 13,337 | 129,098 | 64,549 | 24,471 | 13,138 | 126,772 | 63,384 | 24,799 | 12,835 | 129,304 | 65,005 |
| Temporal (L) | 24,703 | 12,679 | 128,776 | 64,388 | 25,116 | 12,493 | 143,880 | 71,940 | 23,962 | 12,200 | 128,650 | 64,720 |
| Occipital | 48,940 | 27,104 | 138,542 | 69,267 | 49,742 | 26,945 | 140,198 | 70,089 | 49,586 | 27,154 | 138,736 | 69,472 |
| Parietal (R) | 44,409 | 29,688 | 120,642 | 60,323 | 39,041 | 27,656 | 121,888 | 60,932 | 44,948 | 29,854 | 119,228 | 59,664 |
| Parietal (L) | 47,063 | 29,643 | 120,914 | 60,457 | 47,207 | 28,581 | 123,574 | 61,789 | 47,445 | 29,744 | 113,789 | 56,920 |
| Mandible | 47,173 | 20,205 | 157,732 | 78,874 | 47,757 | 19,751 | 178,322 | 89,179 | 47,928 | 18,770 | 155,921 | 78,574 |
| >50,000 | ||||||||||||
| Frontal | 71,402 | 38,629 | 209,160 | 104,580 | 74,601 | 38,502 | 92,228 | 46,112 | 72,171 | 38,218 | 218,712 | 109,645 |
| Low-Resolution Optical Scan (LROS) | High-Resolution Optical Scan (HROS) | |||||||
|---|---|---|---|---|---|---|---|---|
| Part Size (cm3) | Vo | Su | TriA | Poi | Vo | Su | TriA | Poi |
| <1000 | ||||||||
| Nasal (R) | 322 | 461 | 8864 | 4434 | 322 | 460 | 24,580 * | 12,292 |
| Nasal (L) | 321 | 476 | 8770 | 4385 | 322 | 476 | 25,042 * | 12,521 |
| Lacrimal (R) | 353 | 391 | 7502 | 3753 | 353 | 390 | 20,336 * | 10,170 |
| Lacrimal (L) | 383 | 437 | 7408 | 3706 | 383 | 437 | 23,930 * | 11,967 |
| 1000–10,000 | ||||||||
| Vomer | 1266 | 1687 | 26,186 | 13,095 | 1269 | 1687 | 96,958 * | 48,481 |
| Concha (R) | 1405 | 1364 | 24,328 | 12,166 | 1405 | 1364 | 71,594 * | 35,799 |
| Concha (L) | 1414 | 1373 | 23,718 | 11,861 | 1404 | 1371 | 65,926 * | 32,965 |
| Palatum (R) | 2045 | 2114 | 38,484 | 19,244 | 2046 | 2114 | 109,918 * | 54,961 |
| Palatum (L) | 1994 | 2022 | 38,346 | 19,175 | 1991 | 2022 | 106,576 * | 53,288 |
| Zygomatic (R) | 2838 | 2483 | 30,832 | 15,418 | 2839 | 2482 | 128,496 * | 64,250 |
| Zygomatic (L) | 2832 | 2324 | 30,638 | 15,321 | 2843 | 2327 | 119,188 * | 59,596 |
| 10,000–50,000 | ||||||||
| Ethmoid | 12,664 | 5277 | 180,516 | 90,952 | 12,663 | 5276 | 278,509 * | 139,948 |
| Maxilla (R) | 29,296 | 10,572 | 128,057 | 64,378 | 29,298 | 10,570 | 584,510 * | 292,633 |
| Maxilla (L) | 23,751 | 10,264 | 125,341 | 63,284 | 23,758 | 10,263 | 549,072 * | 275,181 |
| Sphenoid | 32,820 | 16,945 | 166,433 | 83,747 | 32,830 | 16,935 | 929,369 * | 465,259 |
| Temporal (R) | 24,799 | 12,835 | 129,304 | 65,005 | 24,801 | 12,831 | 721,532 * | 361,144 |
| Temporal (L) | 23,962 | 12,200 | 128,650 | 64,720 | 23,973 | 12,196 | 680,356 * | 340,627 |
| Occipital | 49,586 | 27,154 | 138,736 | 69,472 | 49,672 | 27,147 | 1,543,906 * | 772,037 |
| Parietal (R) | 44,948 | 29,854 | 119,228 | 59,664 | 44,943 | 29,846 | 1,704,564 * | 852,377 |
| Parietal (L) | 47,445 | 29,744 | 113,789 | 56,920 | 47,514 | 29,742 | 1,626,060 * | 813,102 |
| Mandible | 47,928 | 18,770 | 155,921 | 78,574 | 47,932 | 18,766 | 1,046,310 * | 523,850 |
| >50,000 | ||||||||
| Frontal | 72,171 | 38,218 | 218,712 | 109,645 | 72,168 | 38,209 | 2,192,823 * | 1,096,742 |
| PART COMPARISON | CBCT vs. MSCT | LROS vs. MSCT | HROS vs. MSCT | |||||||
|---|---|---|---|---|---|---|---|---|---|---|
| Part Size (cm3) | Model | MD | SD | RMS | MD | SD | RMS | MD | SD | RMS |
| <1000 | Nasal (R) | 0.12 | 0.131 | 0.176 | 0.08 | 0.160 | 0.178 | 0.03 | 0.145 | 0.148 |
| Nasal (L) | 0.03 | 0.164 | 0.167 | 0.18 | 0.247 | 0.304 | 0.10 | 0.180 | 0.206 | |
| Lacrimal (R) | 0.09 | 0.133 | 0.159 | 0.17 | 0.180 | 0.247 | 0.12 | 0.142 | 0.185 | |
| Lacrimal (L) | 0.09 | 0.139 | 0.167 | 0.29 | 0.253 | 0.383 | 0.22 | 0.170 | 0.278 | |
| Average | 0.08 | 0.14 | 0.17 | 0.18 | 0.21 | 0.28 | 0.12 | 0.16 | 0.20 | |
| 1000–10,000 | Vomer | 0.09 | 0.163 | 0.185 | 0.08 | 0.178 | 0.196 | 0.03 | 0.136 | 0.140 |
| Concha (R) | 0.06 | 0.144 | 0.155 | 0.02 | 0.154 | 0.156 | 0.00 | 0.130 | 0.130 | |
| Concha (L) | 0.04 | 0.111 | 0.118 | 0.01 | 0.133 | 0.134 | 0.04 | 0.115 | 0.120 | |
| Palatum (R) | 0.07 | 0.144 | 0.159 | 0.05 | 0.142 | 0.149 | 0.02 | 0.117 | 0.120 | |
| Palatum (L) | 0.06 | 0.135 | 0.146 | 0.04 | 0.132 | 0.138 | 0.01 | 0.112 | 0.113 | |
| Zygomatic (R) | 0.03 | 0.053 | 0.059 | 0.01 | 0.062 | 0.062 | 0.00 | 0.049 | 0.050 | |
| Zygomatic (L) | 0.03 | 0.055 | 0.065 | 0.01 | 0.142 | 0.143 | 0.02 | 0.051 | 0.055 | |
| Average | 0.05 | 0.11 | 0.13 | 0.03 | 0.13 | 0.14 | 0.02 | 0.10 | 0.10 | |
| 10,000–50,000 | Ethmoid | 0.11 | 0.384 | 0.399 | 0.02 | 0.157 | 0.158 | 0.02 | 0.139 | 0.140 |
| Maxilla (R) | 0.04 | 0.072 | 0.082 | 0.02 | 0.068 | 0.070 | 0.02 | 0.052 | 0.054 | |
| Maxilla (L) | 0.04 | 0.073 | 0.084 | 0.01 | 0.070 | 0.070 | 0.01 | 0.059 | 0.060 | |
| Sphenoid | 0.23 | 0.180 | 0.290 | 0.19 | 0.223 | 0.295 | 0.19 | 0.215 | 0.285 | |
| Temporal (R) | 0.03 | 0.076 | 0.084 | 0.01 | 0.121 | 0.121 | 0.01 | 0.111 | 0.112 | |
| Temporal (L) | 0.03 | 0.063 | 0.069 | 0.00 | 0.085 | 0.085 | 0.00 | 0.071 | 0.071 | |
| Occipital | 0.02 | 0.169 | 0.171 | 0.01 | 0.117 | 0.118 | 0.01 | 0.117 | 0.117 | |
| Parietal (R) | 0.17 | 0.455 | 0.487 | 0.03 | 0.120 | 0.123 | 0.02 | 0.104 | 0.106 | |
| Parietal (L) | 0.02 | 0.250 | 0.251 | 0.00 | 0.410 | 0.410 | 0.01 | 0.193 | 0.193 | |
| Mandible | 0.04 | 0.095 | 0.102 | 0.05 | 0.258 | 0.263 | 0.00 | 0.242 | 0.242 | |
| Average | 0.07 | 0.18 | 0.20 | 0.03 | 0.16 | 0.17 | 0.03 | 0.13 | 0.14 | |
| >50,000 | Frontal | 0.10 | 0.226 | 0.246 | 0.01 | 0.103 | 0.104 | 0.01 | 0.092 | 0.093 |
| Overall average | 0.07 | 0.16 | 0.17 | 0.06 | 0.16 | 0.18 | 0.04 * | 0.12 | 0.14 | |
Disclaimer/Publisher’s Note: The statements, opinions and data contained in all publications are solely those of the individual author(s) and contributor(s) and not of MDPI and/or the editor(s). MDPI and/or the editor(s) disclaim responsibility for any injury to people or property resulting from any ideas, methods, instructions or products referred to in the content. |
© 2025 by the authors. Published by MDPI on behalf of the AO Foundation. Licensee MDPI, Basel, Switzerland. This article is an open access article distributed under the terms and conditions of the Creative Commons Attribution (CC BY) license (https://creativecommons.org/licenses/by/4.0/).
Share and Cite
Lievens, M.; De Kock, L.; Ureel, M.; Villeirs, G.; Van Paepegem, W.; Coopman, R. The Accuracy of an Optical White Light Desktop 3D Scanner and Cone Beam CT Scanner Compared to a Multi-Slice CT Scanner to Digitize Anatomical 3D Models: A Pilot Study. Craniomaxillofac. Trauma Reconstr. 2025, 18, 27. https://doi.org/10.3390/cmtr18020027
Lievens M, De Kock L, Ureel M, Villeirs G, Van Paepegem W, Coopman R. The Accuracy of an Optical White Light Desktop 3D Scanner and Cone Beam CT Scanner Compared to a Multi-Slice CT Scanner to Digitize Anatomical 3D Models: A Pilot Study. Craniomaxillofacial Trauma & Reconstruction. 2025; 18(2):27. https://doi.org/10.3390/cmtr18020027
Chicago/Turabian StyleLievens, Mauranne, Lisa De Kock, Matthias Ureel, Geert Villeirs, Wim Van Paepegem, and Renaat Coopman. 2025. "The Accuracy of an Optical White Light Desktop 3D Scanner and Cone Beam CT Scanner Compared to a Multi-Slice CT Scanner to Digitize Anatomical 3D Models: A Pilot Study" Craniomaxillofacial Trauma & Reconstruction 18, no. 2: 27. https://doi.org/10.3390/cmtr18020027
APA StyleLievens, M., De Kock, L., Ureel, M., Villeirs, G., Van Paepegem, W., & Coopman, R. (2025). The Accuracy of an Optical White Light Desktop 3D Scanner and Cone Beam CT Scanner Compared to a Multi-Slice CT Scanner to Digitize Anatomical 3D Models: A Pilot Study. Craniomaxillofacial Trauma & Reconstruction, 18(2), 27. https://doi.org/10.3390/cmtr18020027