Article

A Fractal Approach to Nonlinear Topographical Features of Healthy and Keratoconus Corneas Pre- and Post-Operation of Intracorneal Implants

by
Shima Bahramizadeh-Sajadi
1,
Hamid Reza Katoozian
1,*,
Mahtab Mehrabbeik
1,
Alireza Baradaran-Rafii
2,3,
Khosrow Jadidi
4 and
Sajad Jafari
1,5
1
Department of Biomedical Engineering, Amirkabir University of Technology (Tehran Polytechnic), Tehran 159163-4311, Iran
2
Ophthalmic Research Center, Research Institute for Ophthalmology and Vision Science, Shahid Beheshti University of Medical Sciences, Tehran 19839-63113, Iran
3
Department of Ophthalmology, Morsani College of Medicine, University of South Florida, Tampa, FL 33612, USA
4
Vision Health Research Center, Semnan University of Medical Sciences, Semnan 35147-99442, Iran
5
Health Technology Research Institute, Amirkabir University of Technology (Tehran Polytechnic), Tehran 159163-4311, Iran
*
Author to whom correspondence should be addressed.
Fractal Fract. 2022, 6(11), 688; https://doi.org/10.3390/fractalfract6110688
Submission received: 27 October 2022 / Revised: 13 November 2022 / Accepted: 16 November 2022 / Published: 20 November 2022
(This article belongs to the Section Life Science, Biophysics)

Abstract

:
Fractal dimension (FD) together with advances in imaging technologies has provided an increasing application of digital images to interpret biological phenomena. In ophthalmology, topography-based images are increasingly used in common practices of clinical settings. They provide detailed information about corneal surfaces. Few-micron alterations of the corneal geometry to the elevation and curvature cause a highly multifocal surface, change the corneal optical power up to several diopters, and therefore adversely affect the individual’s vision. Keratoconus (KCN) is a corneal disease characterized by a local alteration of the corneal anatomical and mechanical features. The formation of cone-shaped regions accompanied by thinning and weakening of the cornea are the major manifestations of KCN. The implantation of tiny arc-like polymeric sections, known as intracorneal implants, is considered to be effective in restoring the corneal curvature. This study investigated the FD nature of healthy corneas (n = 7) and compared it to the corresponding values before and after intracorneal implant surgery in KCN patients (n = 7). The generalized Hurst exponent, Higuchi, and Katz FDs were computed for topography-based parameters of corneal surfaces: front elevation (ELE-front), back elevation (ELE-back), and corneal curvature (CURV). The Katz FD showed better discriminating ability for the diseased group. It could reveal a significant difference between the healthy corneas and both pre- and post-implantation topographies (p < 0.001). Moreover, the Katz dimension varied between the topographic features of KCN patients before and after the treatment (p < 0.036). We propose to describe the curvature feature of corneal topography as a “strange attractor” with a self-similar (i.e., fractal) structure according to the Katz algorithm.

1. Introduction

Fractal dimension (FD) is an integer or non-integer index [1] capable of describing nonlinear geometrical characteristics of complex phenomena [2,3], with a wide application to demonstrate differences between diseased versus healthy states [4,5,6,7,8]. While advances in imaging technologies have led to highly increasing applications of digital images to interpret objects and systems, determining the FD of digital images has expanded in interest in recent years [9]. In ophthalmology, topography-based images are increasingly used in clinical setting applications. They provide detailed information about corneal surfaces and their related diseases [10,11].
The cornea is responsible for two-thirds of the optical power of the human eye. Few-micron alterations of the corneal geometry, in terms of elevation and in curvature, cause a highly multifocal surface, change the corneal optical power up to several diopters, and affect lifestyle, which in most cases requires ophthalmic surgery plans. Such conditions could be detected through topography-based data of the cornea in keratoconus patients. Keratoconus (KCN) is a progressive corneal disease characterized by the thinning, weakening, and steepening of the cornea [12]. KCN onset typically occurs in ages of ten to forty years [13]. KCN cannot be corrected with eyeglasses or typical contact lenses. Such conditions have been demonstrated to disturb the rest of the patient’s life [13,14]. The etiology of KCN is not well understood, and there is still no cure available [12,15]. Thus, it has recently attracted some major attention regarding interventions [12]. Although there is a high prevalence in the Middle East and Asia (from 0.76% to 3.30% [16]) compared to a lower incidence in Western countries (0.05% [17]), recent studies have indicated that KCN is considered a pandemic and not a rare disease [18]. The annual prevalence of KCN in some western countries is five- to ten-fold higher than previously estimated, which might be due to more access to medical healthcare equipped with modern diagnostic devices [13].
Controversies exist over the efficacy and predictability of different modalities of KCN treatment. The insertion of tiny arc-like polymeric segments, known as intracorneal implants, deep into the corneal stroma has proved to be a clinically effective approach in flattening the KCN corneal curvature in more advanced stages of the disease [19,20]. Knowing the fact that corneal biomechanics have been implicated in the underlying mechanism of KCN, intracorneal implants did not strengthen the KCN cornea [21], but they were proved to flatten the cornea and restore its shape [22]. Therefore, implantation is usually used as an adjunct treatment for corneal collagen cross-linking, which is a photochemical procedure that regionally strengthens the cornea by applying ultraviolet (UVA) and riboflavin to the diseased cornea [23]. However, the fact that intracorneal implants could regularize KCN-related geometrical irregularities of the cornea is still an open question [22,24].
Corneal surfaces have a complex nature. KCN corneas are known for highly irregular topographical features, which add to this complexity [25]. Since FD is a powerful novel feature to compute the complexity of nonlinear features, it has been widely applied to understanding biological and engineering systems and signals [26]. However, only a few studies have considered the application thereof to in vivo geometry-based images of corneal surfaces. Ţălu et al. confirmed the fractal nature of Bowman’s membrane of the human cornea and its relation to statistical surface parameters. They acquired 3D images of the height and deflection of the membrane ex vivo. Then, using atomic force microscopy (AFM) 3D images, they revealed nanometer-scale properties of the Bowman’s membrane structure that could not be detected with classical methods [27]. FD analyses have also been used to quantitatively characterize microstructural features of various contact lenses and the potential platform it could provide to understand the tribological effects of the lens surfaces in contact with the ocular surface and the eyelid [28,29].
FD characteristics of surfaces could be useful in ophthalmology to quantify corneal architectural changes associated with different diseased states to broaden the geometrical understanding of disease evolution [27]. Thus, based on the consideration of the needs of the ophthalmology research community regarding understanding the complexity of this problem and to gain more insight to the problem, the powerful FD technics were used in this investigation. This study aimed to further explore the ultrastructural details of corneal surfaces through FD for healthy and keratoconus corneas as biologically complex spatial domains. The FD values accounted for self-similarity content, complexity, and chaotic resemblance of spatial domains. To calculate the FD, several algorithms have been proposed [26,30,31,32]. To the best of our knowledge, no study has been reported regarding the FD characteristics of corneal surfaces for healthy and keratoconus patients. In this study, the FD was used to investigate and compare healthy corneas and KCN patients before and after the implantation. The generalized Hurst exponent, Higuchi FD, and Katz FD were computed for topography-based parameters of corneal surfaces: front elevation, back elevation, and corneal curvature.

2. Materials and Methods

The protocols handled in the present study adhered to the tenets of the Declaration of Helsinki and were approved by the Ophthalmic Research Center of Shahid Beheshti University of Medical Sciences, Tehran, Iran (Approval ID: IR.SBMU.ORC.REC.1400.001, Approval Date: 14 March 2021). All subjects (n = 14) were adults (34.5 ± 7.4, mean ± sd years) provided written informed consent.

2.1. Inclusion/Exclusion Criteria

All subjects underwent an ophthalmic examination by experienced specialists of the anterior segment of the eye. Their corneas were imaged using a corneal topographer, OCULUS Pentacam® HR (Oculus GmbH, Wetzlar, Germany). Further inclusion/exclusion criteria were followed only if the quality of Pentacam images were acceptable (“QS = OK” was read). Those who had corneal perforation, suffered from dry eye(s), intrinsic eye diseases, ocular trauma, any types of intrusive ocular intervention or refractive surgeries, corneal anomalies, history of any deviation or strabismus, or glaucoma were not included in the analysis. Other contraindications to recruiting the patients were established as follows: pregnancy during the experiments, retarded individuals and those with mental or psychological history, diabetes, allergy, systematic disorders, immunodeficiency diseases, and connective tissue diseases. Patients with major central corneal opacity, hydrops, corneal dystrophies, recurrent corneal erosion, general infections or viral diseases were also excluded.
KCN patients were selected among those suffering from moderate to advanced stages of KCN, without any significant scar that could prevent from topography imaging. KCN patients who underwent the following surgical procedure were considered: To restore corneal curvature in KCN subjects, a single-segment KERARING (Mediphacos Inc., Belo Horizonte, Brazil), with an optical zone of 6 mm (SI-6), thickness (base width) of 200 μm to 300 μm based on the severity of the disease, and arc length of 325 degrees was used. The KERARING segment was implanted in a femtosecond-created tunnel of width 1 mm at about 65% of the corneal thickness from the anterior corneal surface. The follow-up check-up was performed within 4–5 months post-operatively. Patients who suffered from any complications during the surgery or required revision surgeries within the follow-up period were excluded from the study. Those with concerns in terms of visual complaints were not recruited. Among the 98 patients who were prescribed the intracorneal implant surgery, only a few met the criteria, and they were referred within the expected follow-up period. Finally, KCN patients (n = 7) and healthy controls (n = 7) were recruited. General demographic data are shown in Table 1.

2.2. Pentacam-Derived Topometric Data

The Pentacam topographical data were used in this study to assess certain indicative keratometric parameters. The Pentacam measures geometrical height, known as elevation values, which are likewise converted into values of axial (sagittal) curvature. These geometrical values of the radius of curvature are accordingly converted into refractive power values, which are given in diopters (D) [33]. Elevation maps of anterior (ELE-front) and posterior (ELE-back) surfaces, as well as corneal curvature (CURV) are among the common topography-based parameters that could be associated with ectatic diseases such as KCN [34]. The measured values are shown in color-coded contour maps. The representative colors on the maps range from warm colors (red, orange, yellow) to neutrals (green) to cool colors (blue, purple), representing the pathologic zone and/or corneal abnormalities. In this study, we also used Kmax-front (in diopters) which is a commonly used Pentacam-derived topometric index in ophthalmology. Kmax is the maximum anterior sagittal curvature and is of clinical importance in detecting KCN or in describing KCN progression [35].

2.3. Fractal Dimension Analysis

In this study, we examined the fractionality of extracted features from the Pentacam data, including the elevation of the anterior surface (ELE-front), the elevation of the posterior surface (ELE-back), and the curvature (CURV). More specifically, we questioned whether the fractionality of the aforementioned data significantly qualitatively altered between pre-op and post-op corneas compared to healthy patients. To this aim, three powerful algorithms for calculating the FD, namely, the Higuchi FD, Katz FD, and generalized Hurst exponent algorithms were taken into consideration. These algorithms are mathematically described in the following subsections. It is worth mentioning that we used MATLAB software Release 2020b to implement the FD algorithms and extract the FD values of the ELE-front, ELE-back, and CURV measures.

2.3.1. Higuchi Fractal Dimension

Higuchi FD is an accurate technique for calculating the FD of a given stationary or non-stationary time series [26]. Considering U : { U ( 1 ) , U ( 2 ) , , U ( N t ) } , where N t is the total number of samples, as a given time series, U t i T , which is T subsets (curve) of the time series, can be constructed as follows
U m k : { U ( t i ) , U ( t i + T ) , , U ( t i + n T ) } ,   ( t i = 1 , , T )
where n = [ N t t i T ] indicates Gauss’ notation. Moreover, t i and T are two integers, respectively, denoting the initial and interval times. Additionally, the length of the curve U t i T follows the relation below
m T = N t 1 n T 2 ( j = 1 n | U ( t i + j T ) U ( t i + ( j 1 ) T ) | )
where m T is the curve length and N t 1 n T 2 represents the normalization term. Assuming as the averaged m T over T sets, the FD can be defined as follows:
T D  
where D is the FD obtained by the Higuchi algorithm.

2.3.2. Katz Fractal Dimension

A simple and fast method of obtaining the FD of an example time series is known as the Katz FD. According to the Katz algorithm [30], the FD of any graph or time series can be calculated based on the average distance of successive points, the length, and the diameter of the given graph Equation (4).
D = log ( N t ) log ( N t ) + log ( d i L )
Here, D denotes the FD of the time series, d i = max ( d i s t ( 1 , f ) ) is the diameter of the time series (the distance between the initial sample 1 and the farthest sample f ), L = s u m ( d i s t ( k , k + 1 ) ) is the length of the time series (the sum of distances between any two successive points), and N t = L / m is the total sample of the time series (where m = m e a n ( d i s t ( k , k + 1 ) ) is the average distance of successive points).

2.3.3. Generalized Hurst Exponent

To gain access to the scaling properties of a given time series, the generalized Hurst exponent has been proposed considering the α th-order moment of the time series [31]. Assuming U ( t ) : { U ( n ) , U ( 2 n ) , , U ( T t ) } as the given time series, with time-step n and duration T t , the α th-order moment of U ( t ) can be defined as
K α τ = | U ( t ) U ( t τ ) | α | U ( t ) | α
where τ [ n , τ m ] is the time interval and indicates averaging over time. The generalized Hurst exponent can be obtained through
K α τ ~ ( τ n ) E α
Here, E states the generalized Hurst exponent value.

3. Results

The main aim of this study was to compare the nonlinear morphological features of healthy and keratoconus cornea, pre- and post-operation of intracorneal implantation. In this regard, in this section, first the Pentacam-derived topometric data (i.e., ELE-front, ELE-back and CURV measures) are described in detail. Next, the addressed data were used as the input of the FD algorithms (see Section 2.3). As a result, the Higuchi FD, Katz FD, and generalized Hurst exponent were obtained. To examine the hypothesis of whether the fractionality of ELE-front, ELE-back and CURV measures is different in healthy, pre-, and post-op individuals, we used the U Mann–Whitney test (to compare healthy and keratoconus corneas) and Wilcoxon Signed Rank test (to compare pre- and post-operation keratoconus corneas). The statistical analysis was performed using BM SPSS Statistics for Windows, Version 26.0.

3.1. Pentacam-Derived Topometric Data

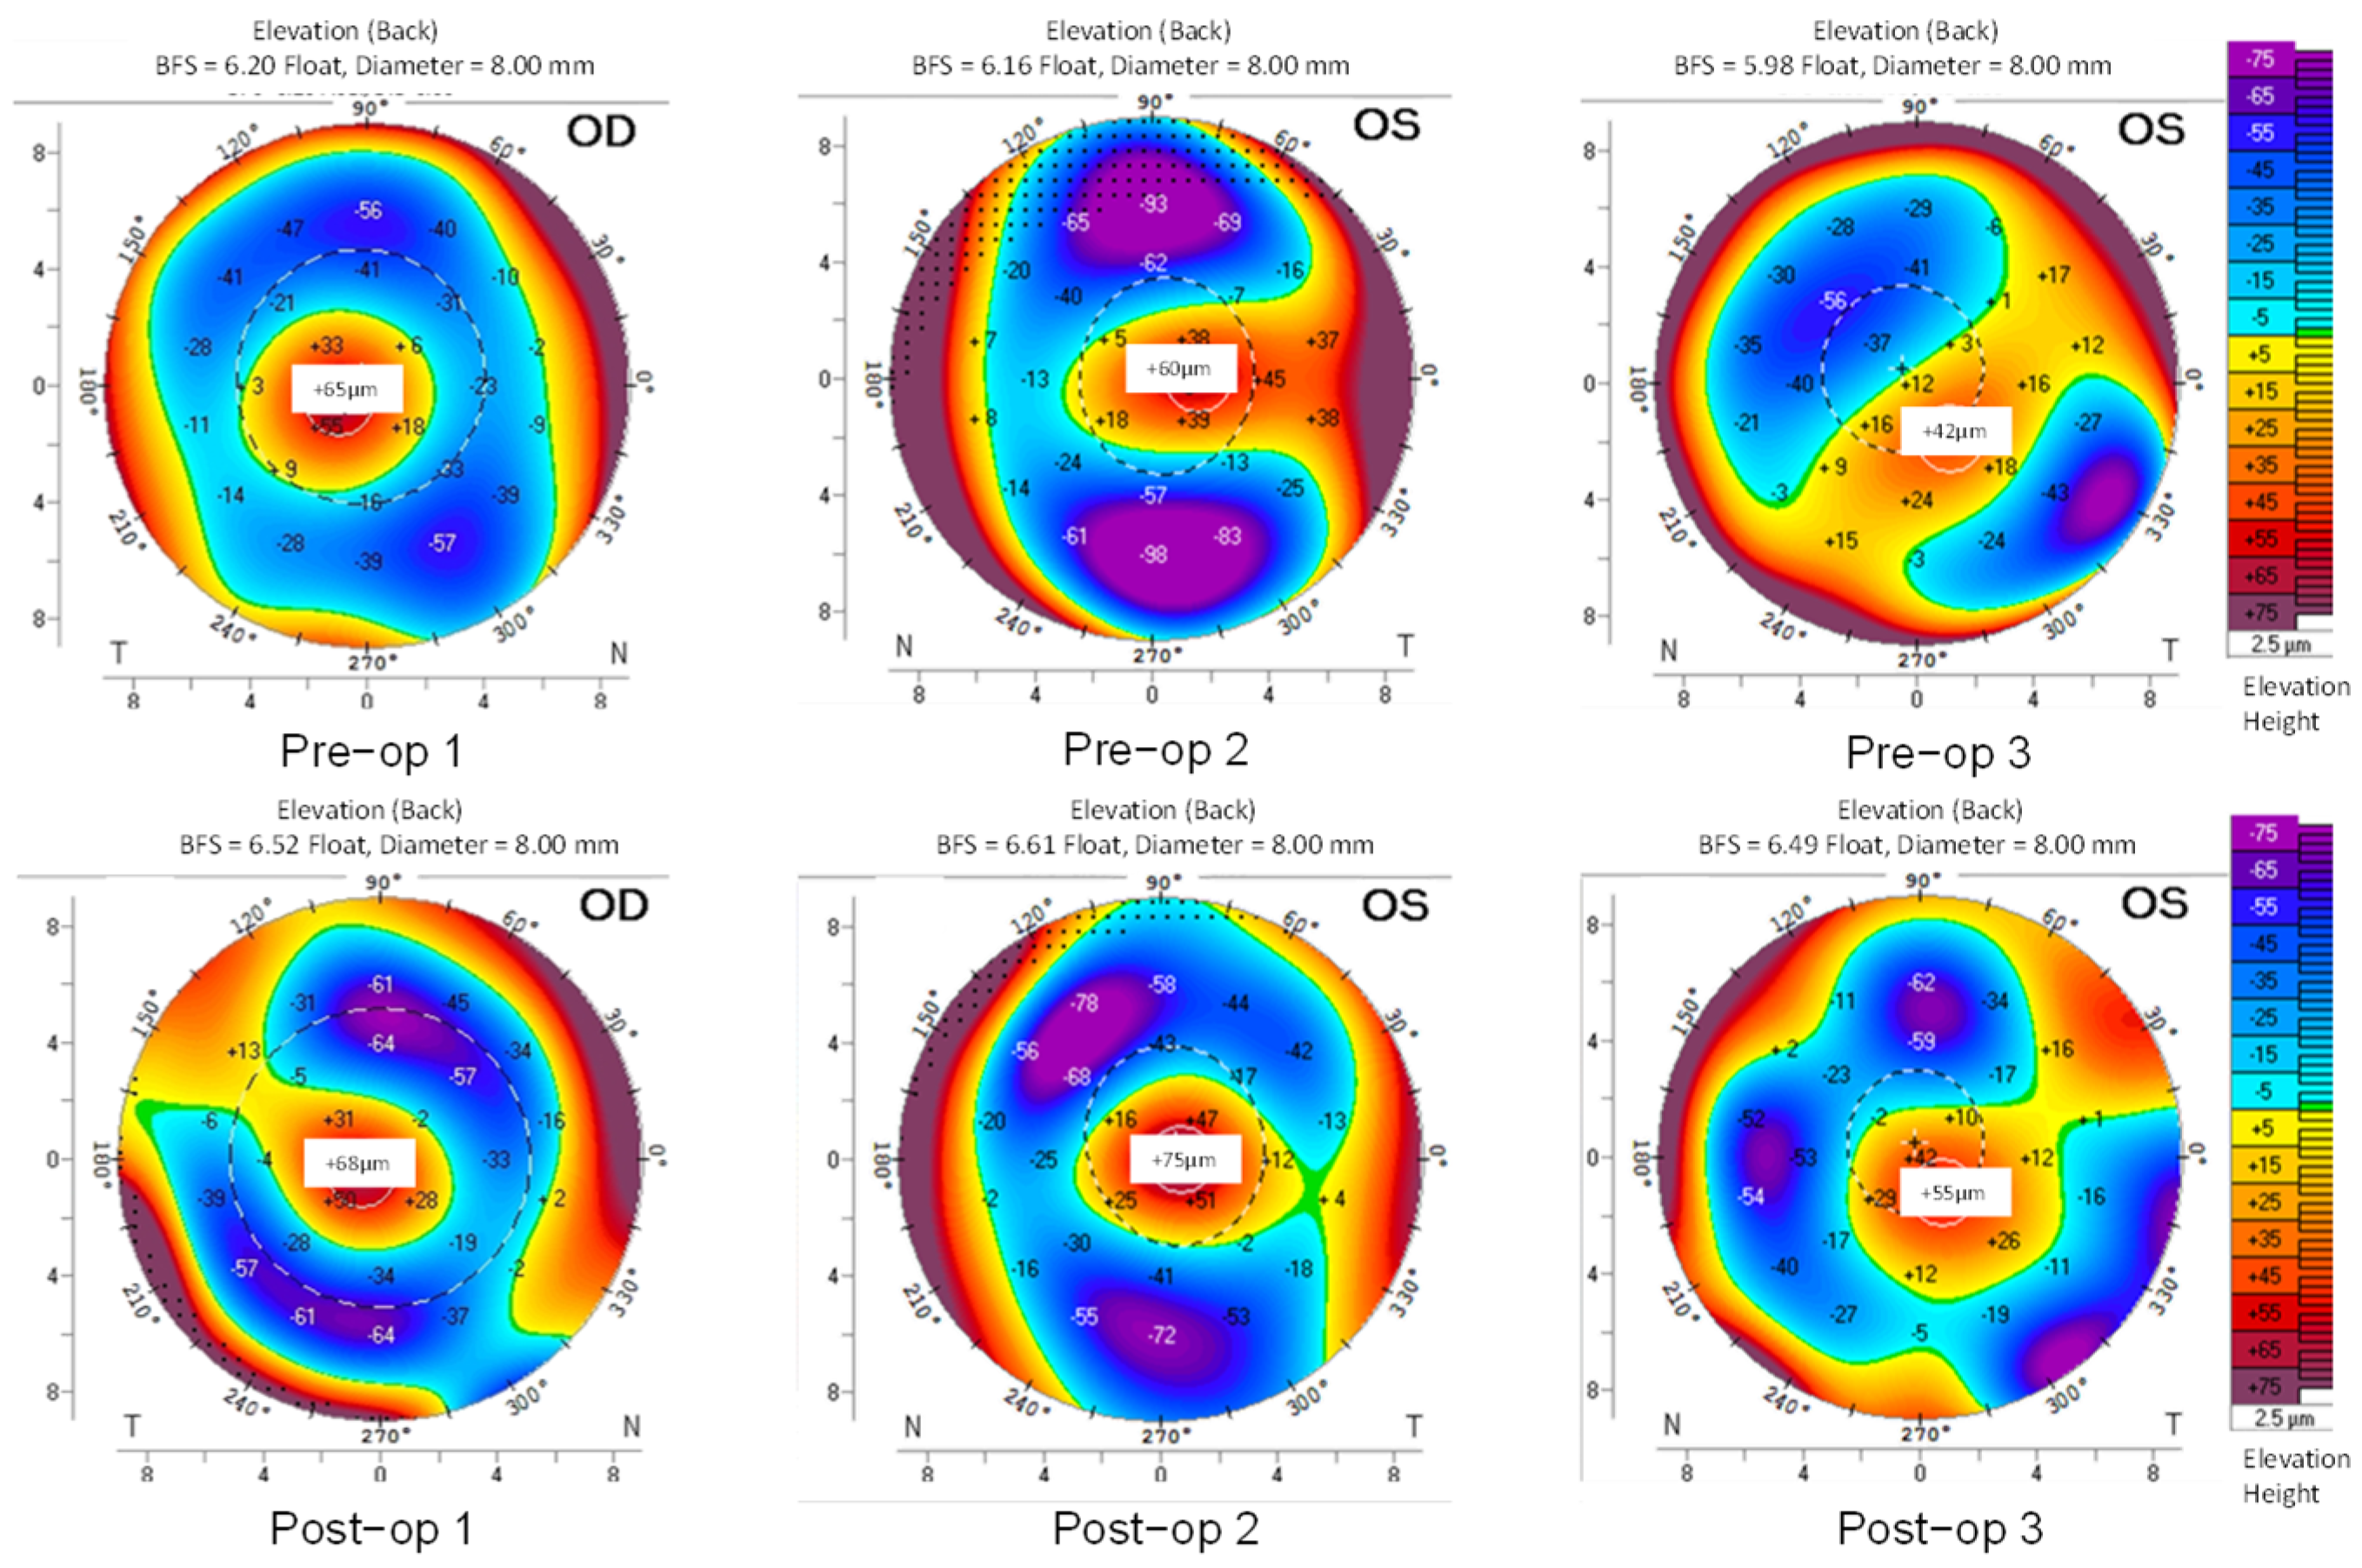
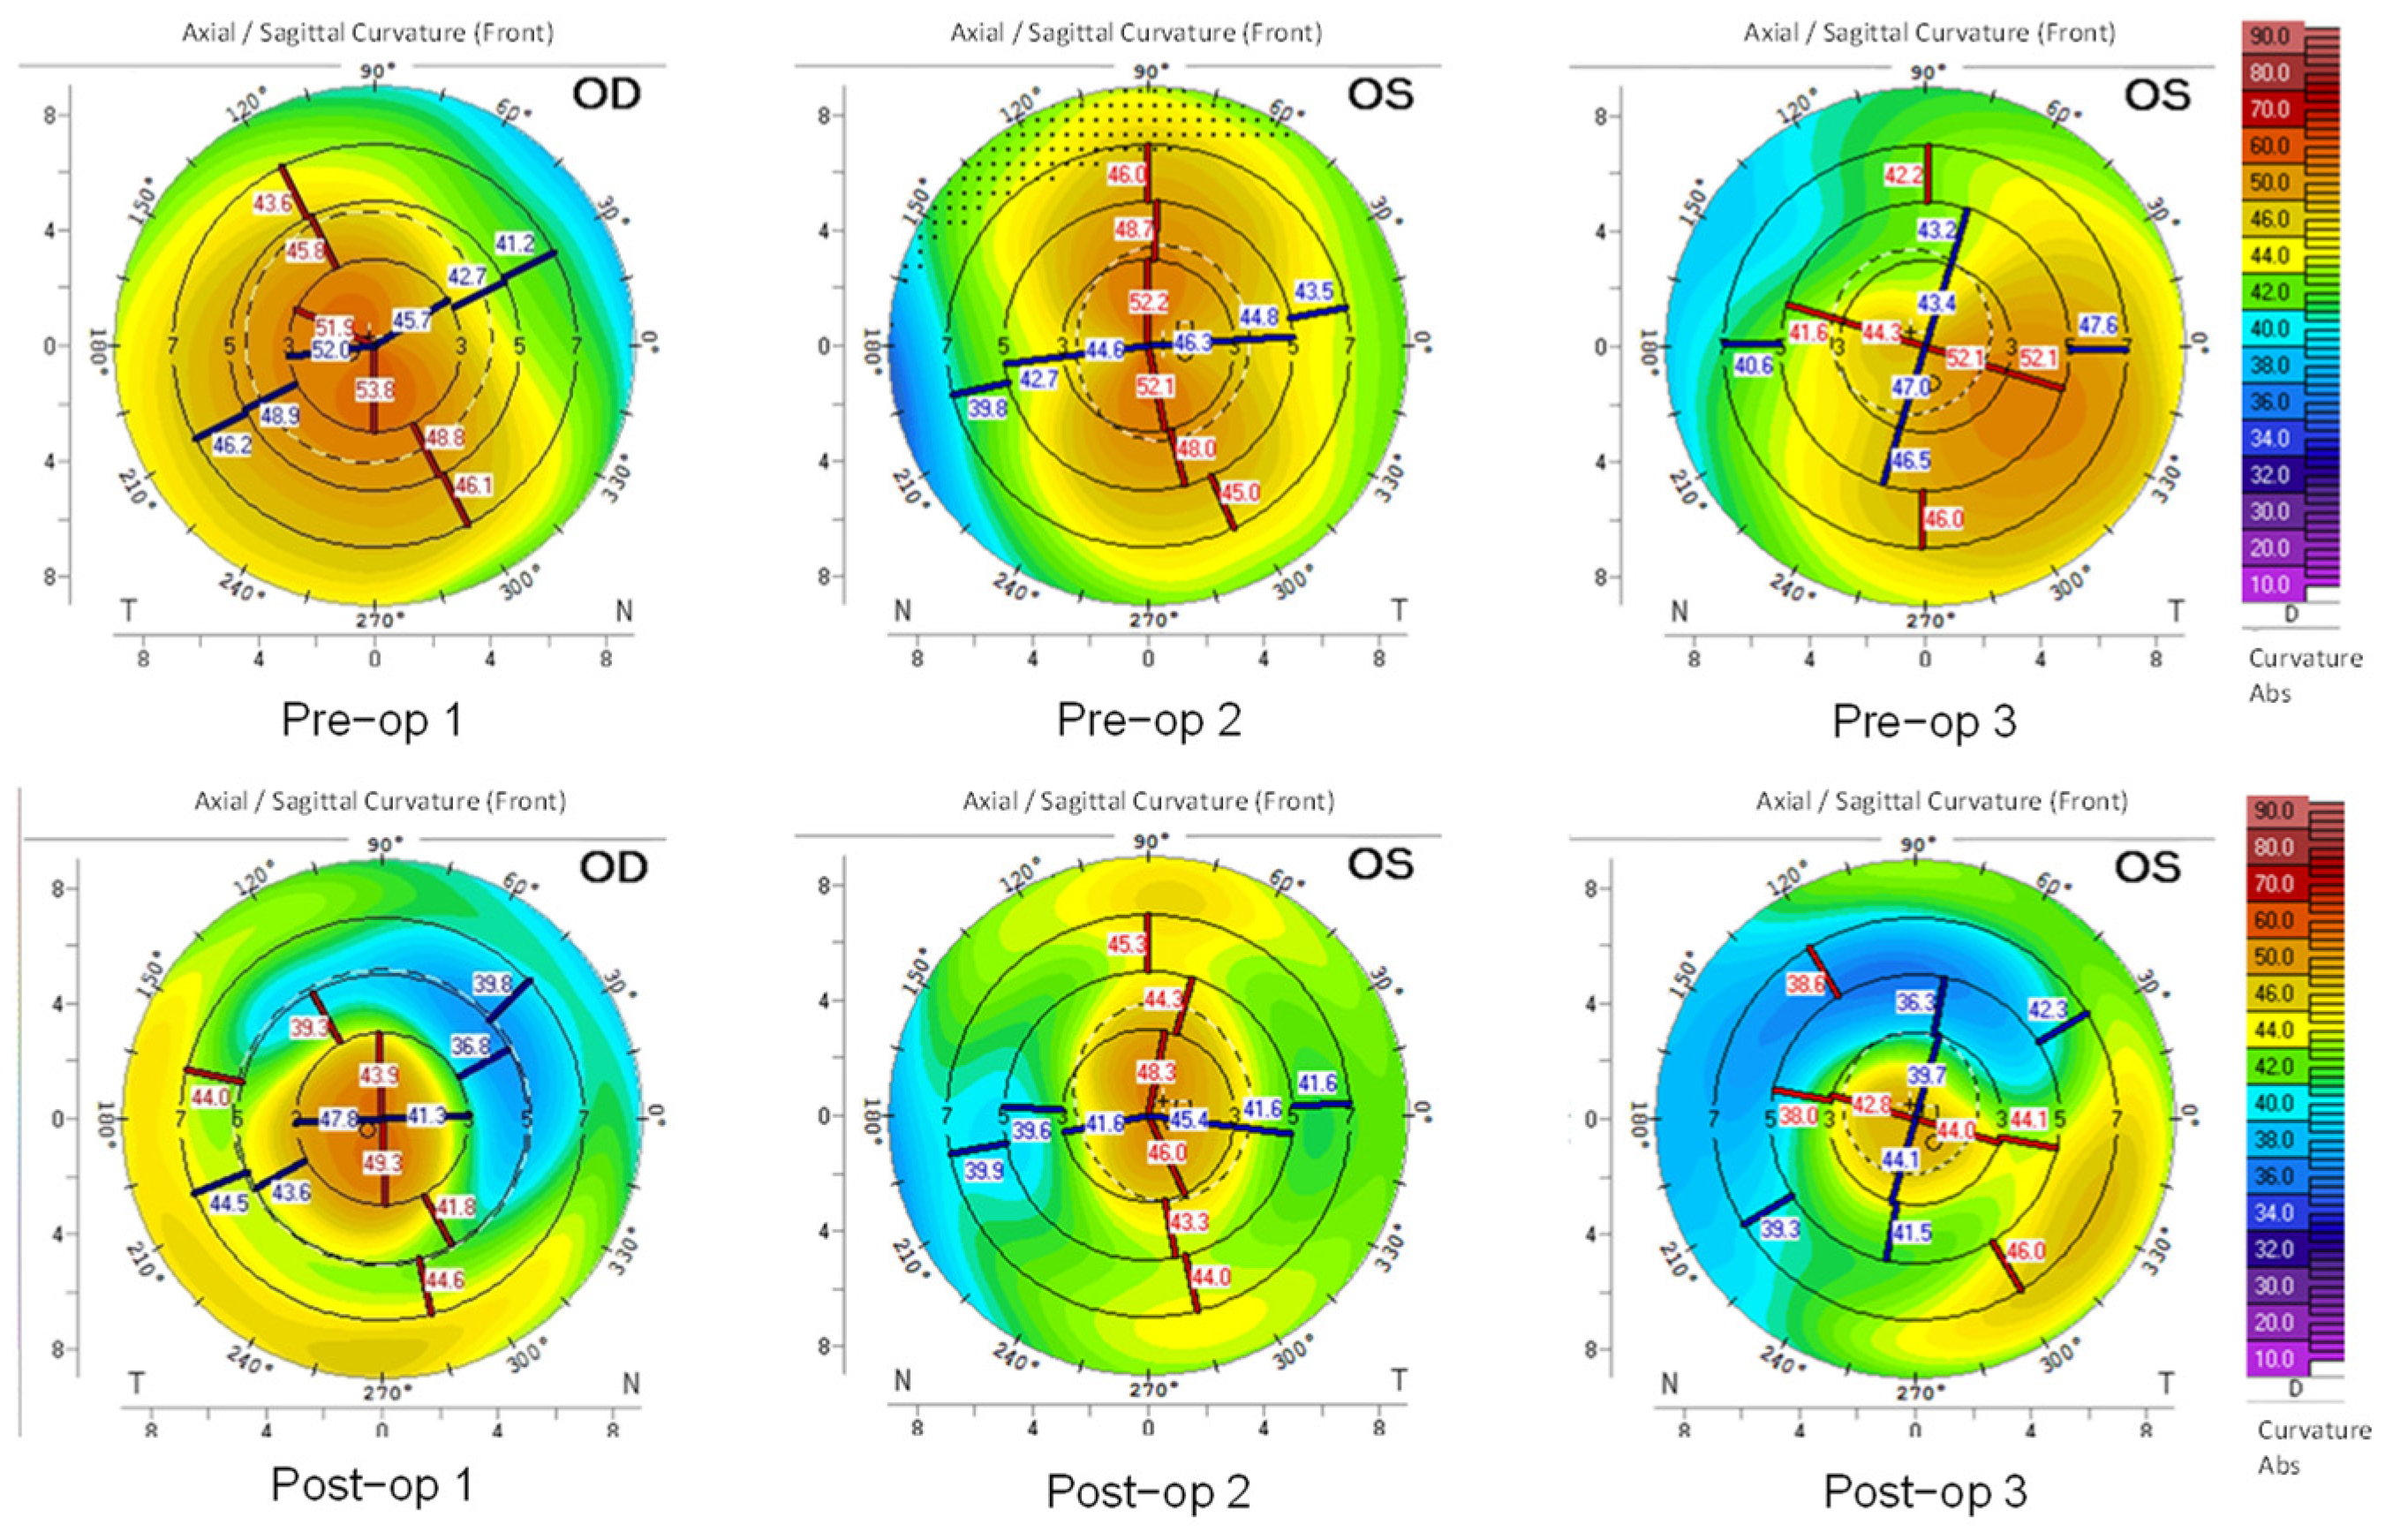
Elevation maps of the anterior (ELE-front) and posterior (ELE-back) surfaces, and the corneal curvature map (CURV) were extracted from Pentacam topographical images. The relevant maps of three representative patients were selected from the “4 maps refractive” report of the Pentacam topographical images and are shown below. The corresponding elevation maps of all subjects are plotted with an identical color-coded scale. The curvature maps are all identical in terms of the color-coded scale, as well. Figure 1 shows the color-coded maps of ELE-front of KCN corneas before and after the surgical operation.
Figure 2 shows the color-coded maps of ELE-back of healthy and KCN subjects, respectively.
With the identical color-coded regions of the maps, the changes in the distribution of positive islands of elevations in both anterior and posterior corneal surfaces (ELE-front and ELE-back, respectively), appear more complex and colorful in KCN patients (Figure 1 and Figure 2) rather than what is typically seen in the healthy groups. Figure 3 shows the color-coded maps of CURV of KCN subjects.
The maps of ELE-front (Figure 1), ELE-back (Figure 2), and CURV data (Figure 3) show prominent changes post-operatively. In the KCN group, the posterior elevation (Figure 2) and anterior curvature (Figure 3) showed prominent ectatic regions in pre- and post-operation corneas. Moreover, the pre-operative KCN corneas revealed prominent abnormalities (distributed in warm colors that show corneal steepening) mainly at the periphery of the captured corneal region.
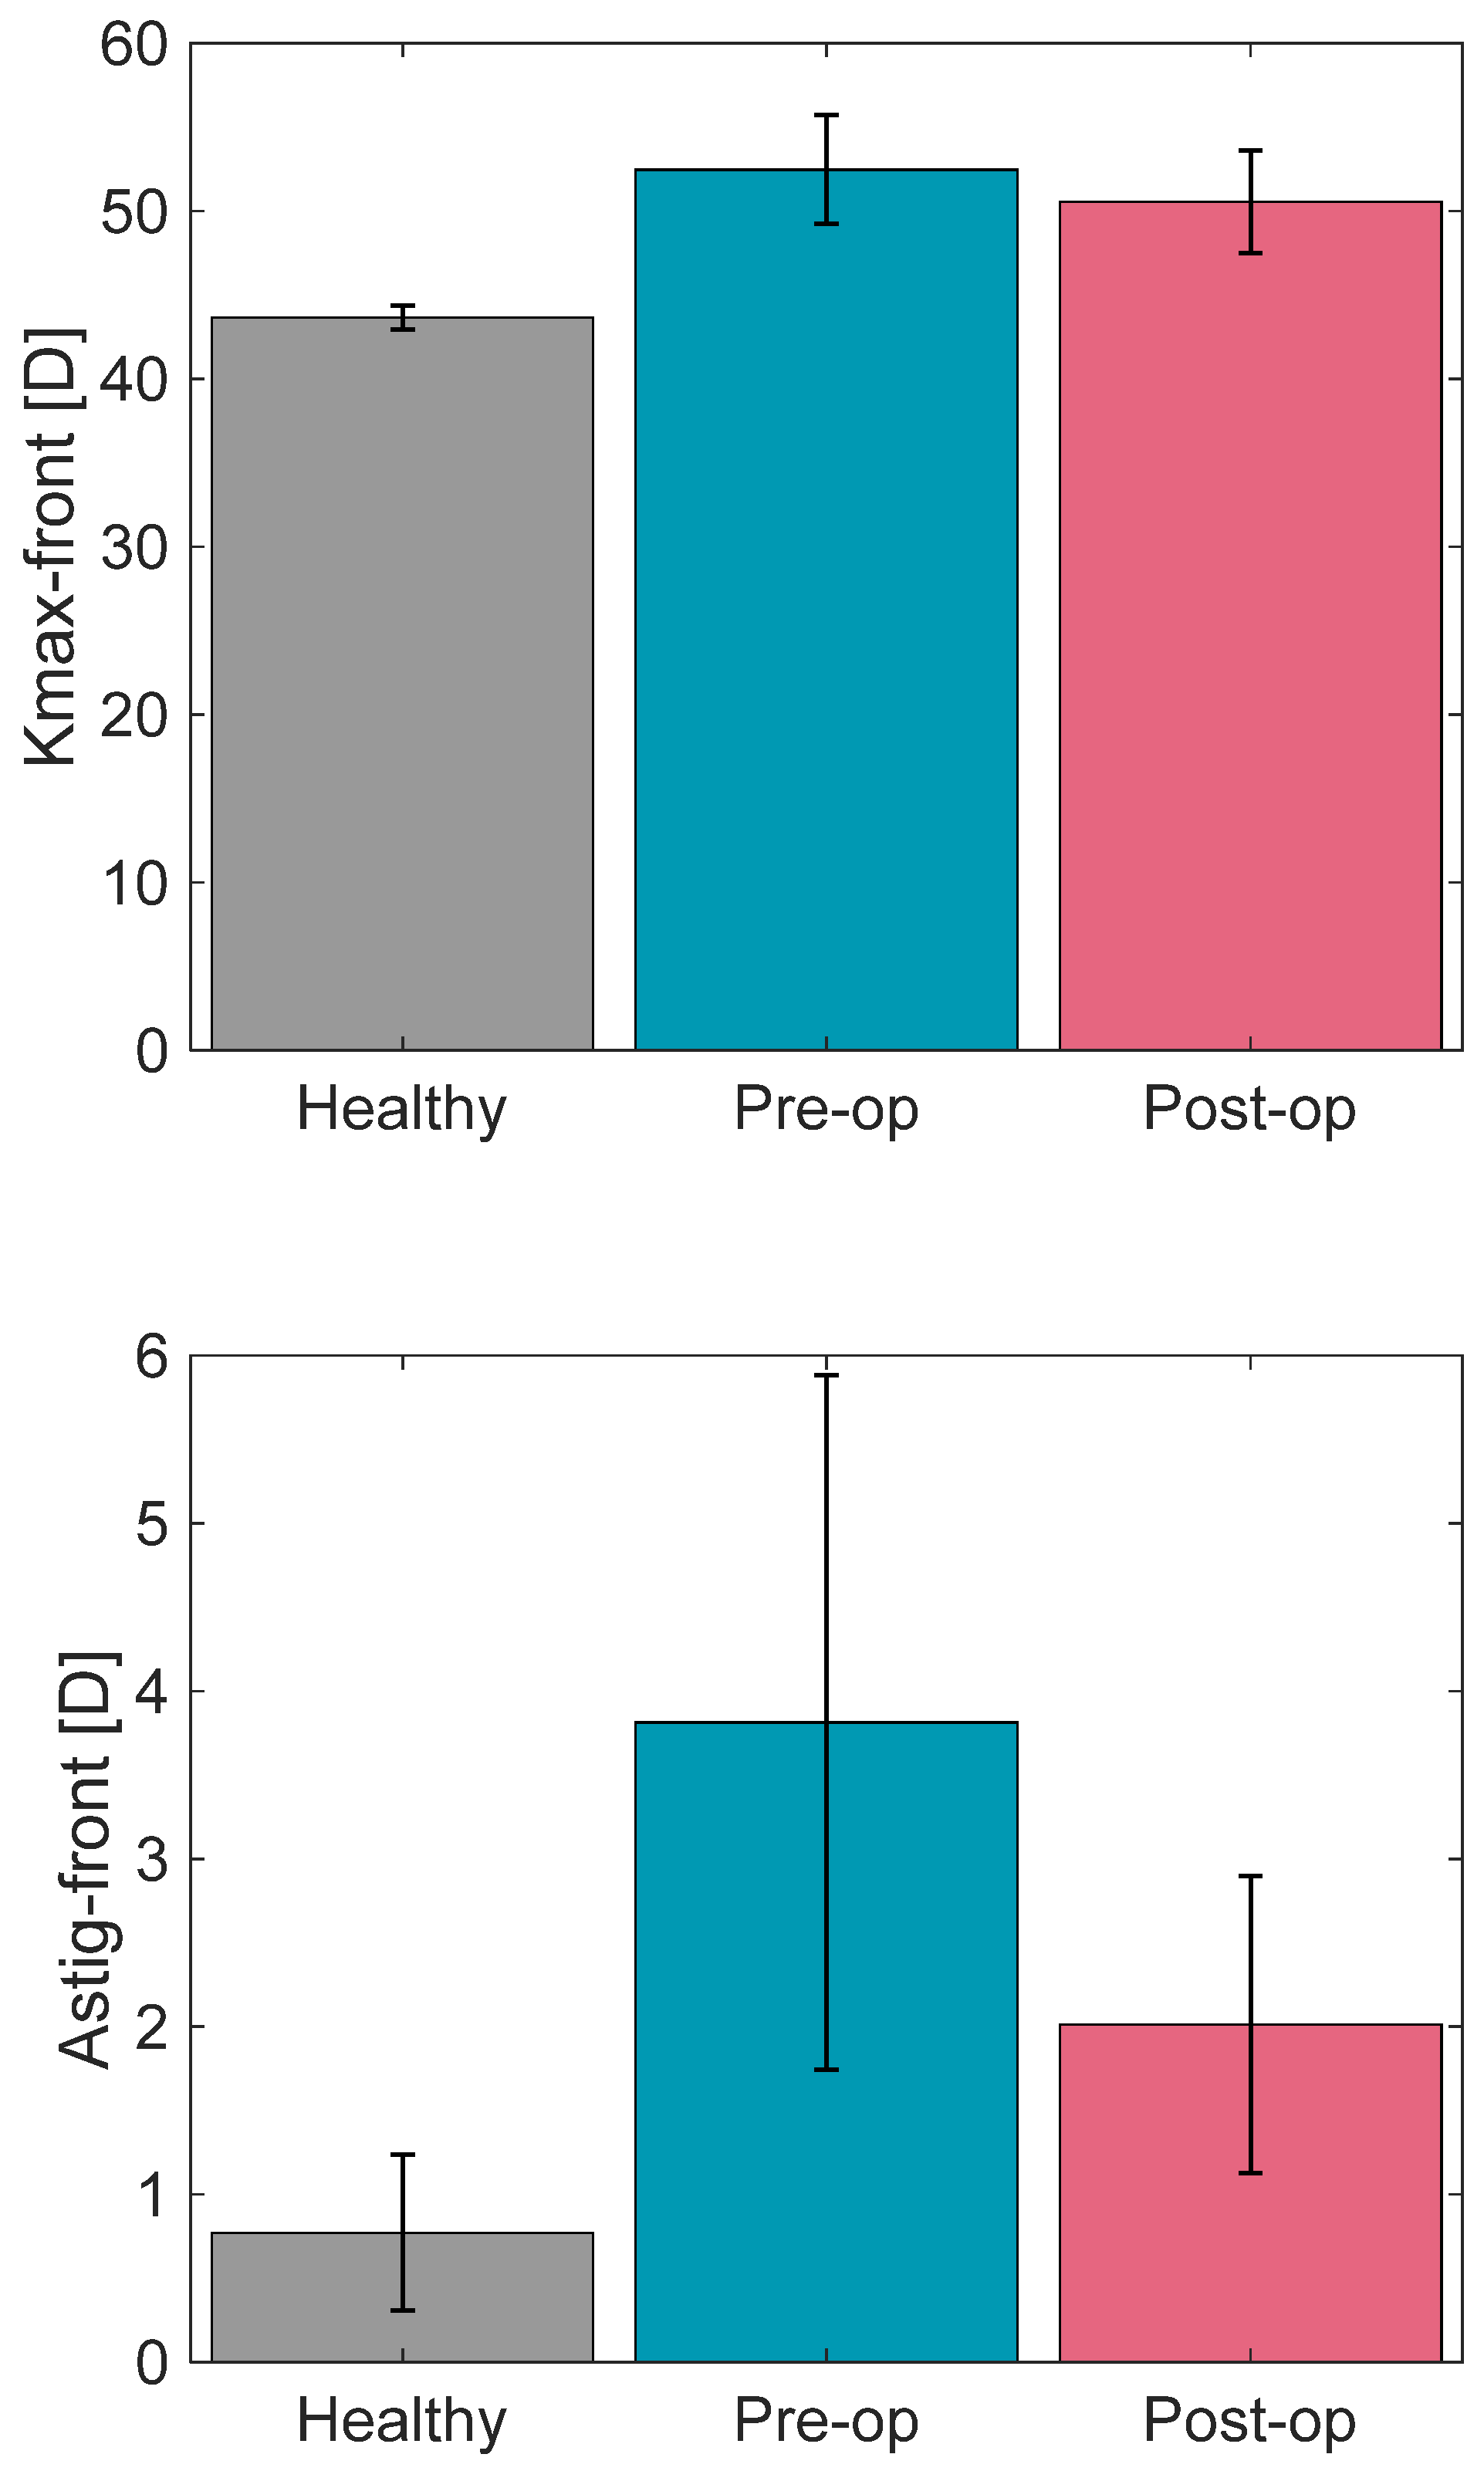
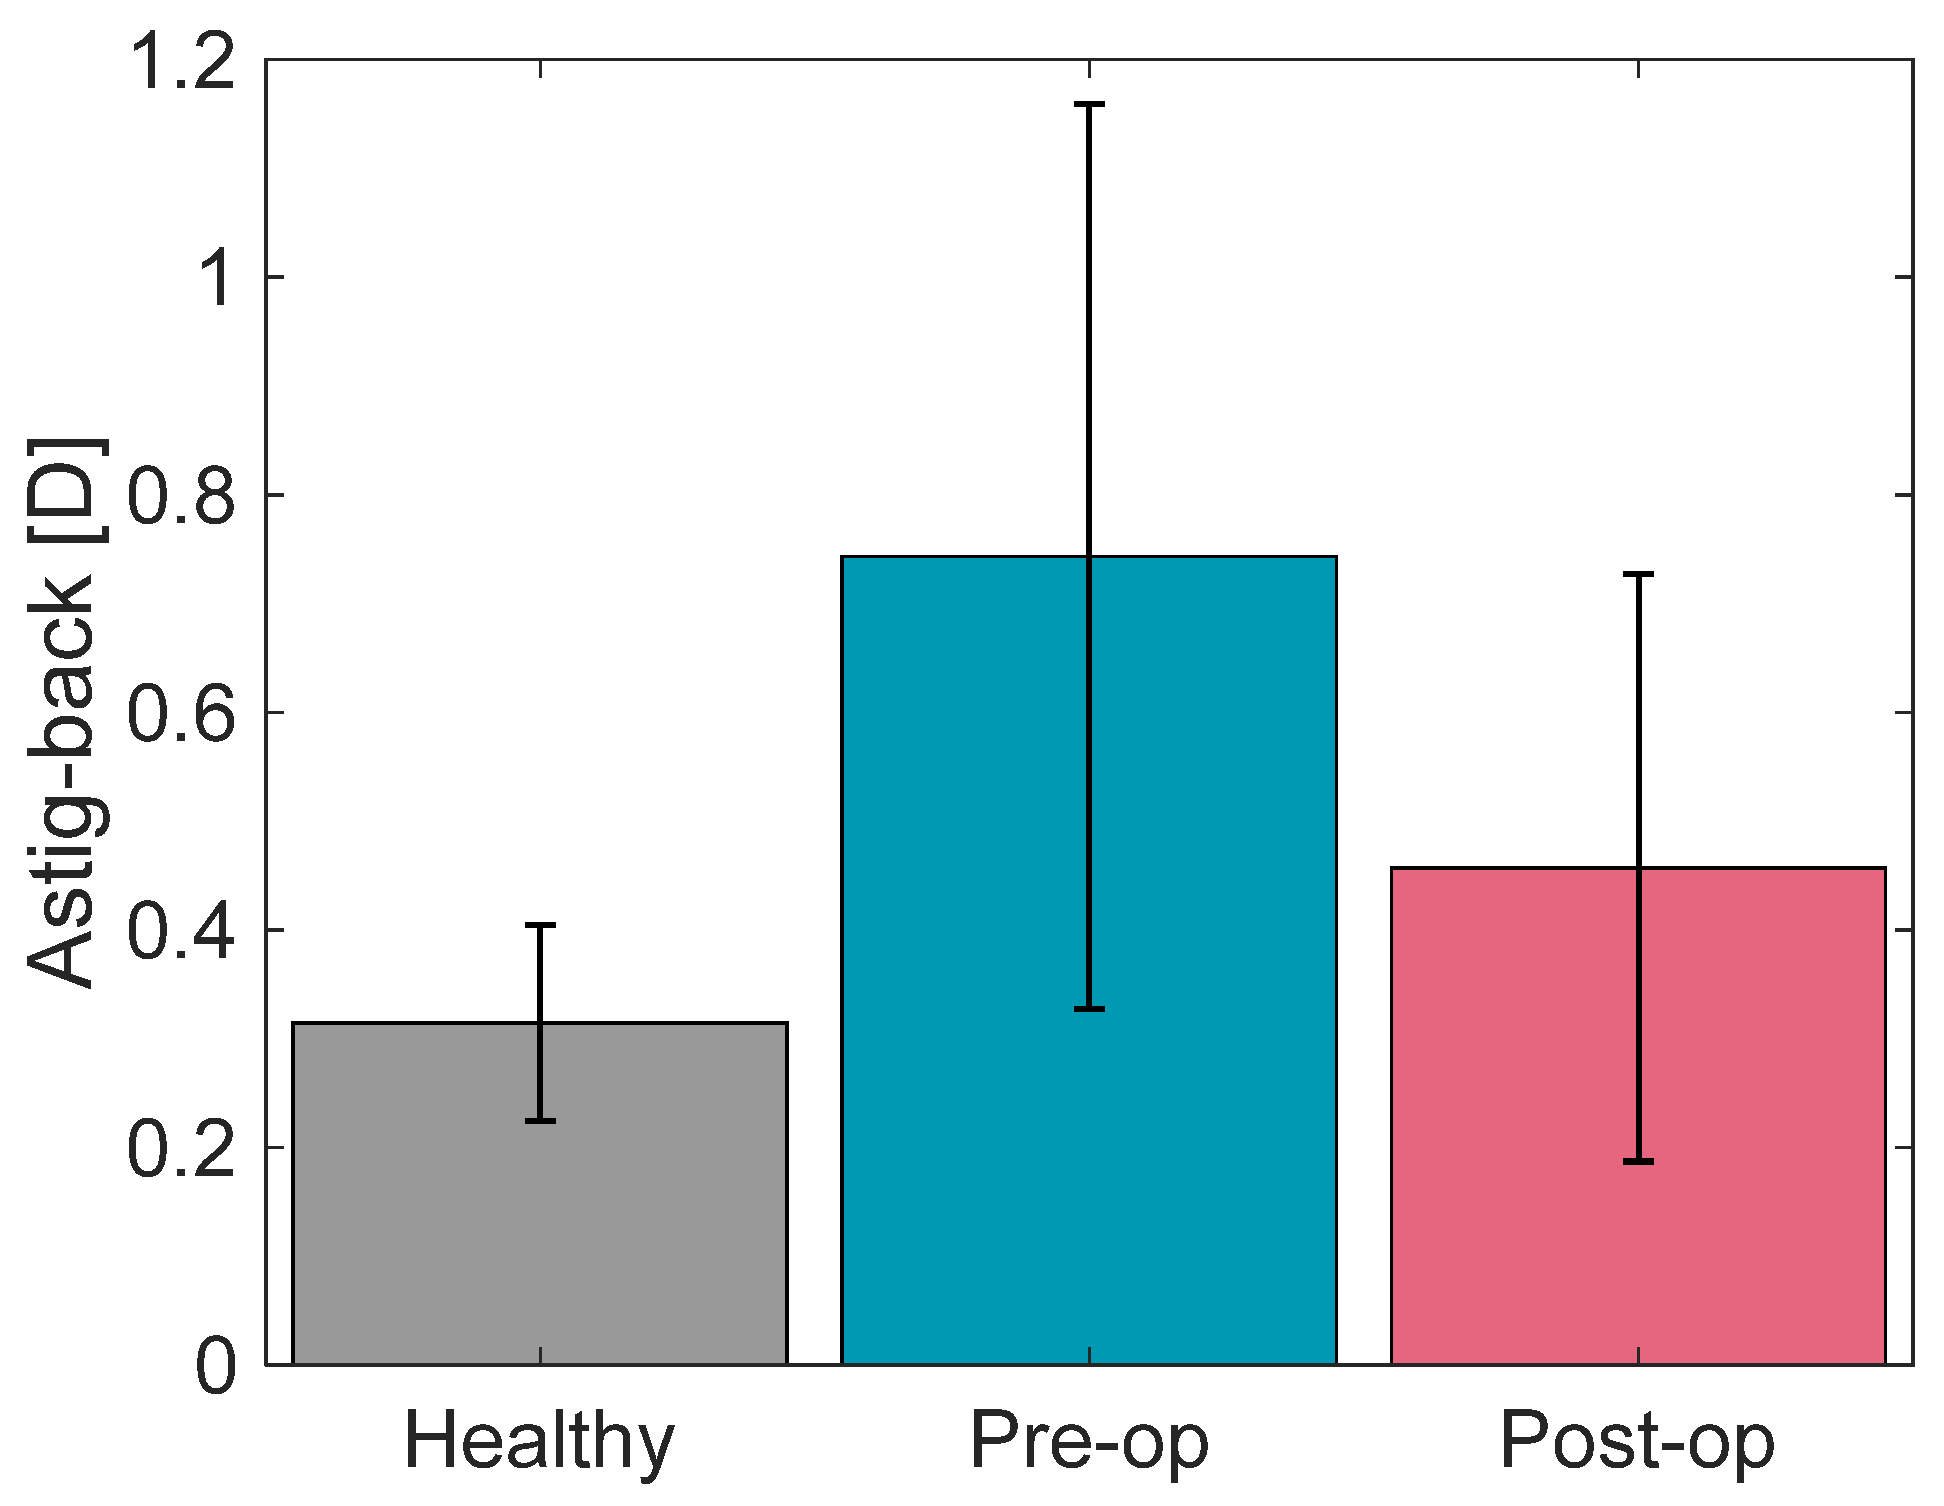
Table 2 shows the general corneal surface topography-based data of the healthy controls and the KCN patients: maximum keratometry of the anterior surface (Kmax-front), and the astigmatism of the anterior (Astig-front) and the posterior (Astig-back).
Table 3 indicates the p-values regarding the comparative analysis of these three topography-based parameters. As expected, Kmax-front was significantly lower in the healthy group than the pre-operative (p-value < 0.002; 43.66 ± 0.7 D vs. 52.47 ± 3.24 D, respectively). Kmax-front adopted the highest values in the pre-op subjects (Figure 4). Astig-front was almost one-third of the untreated KCN patients (p-value < 0.003) and half of the treated ones (p-value < 0.021). Astig-back adopted a similar behavior between the healthy and the KCN groups.

3.2. Fractal Dimensions

As stated in Section 2, the three methods of calculating the FD are proposed for one-dimensional data (time series). To generalize these methods for two-dimensional data, according to [36], the FD of each column and row in the data matrix was calculated. Then the average of the FDs was reported as the FD of the two-dimensional data. In other words, a single FD value was reported for each of the corneal surfaces. Note that the considered parameters for calculating the Higuchi FD and the generalized Hurst exponent are T = 30 and α = 1 , respectively.
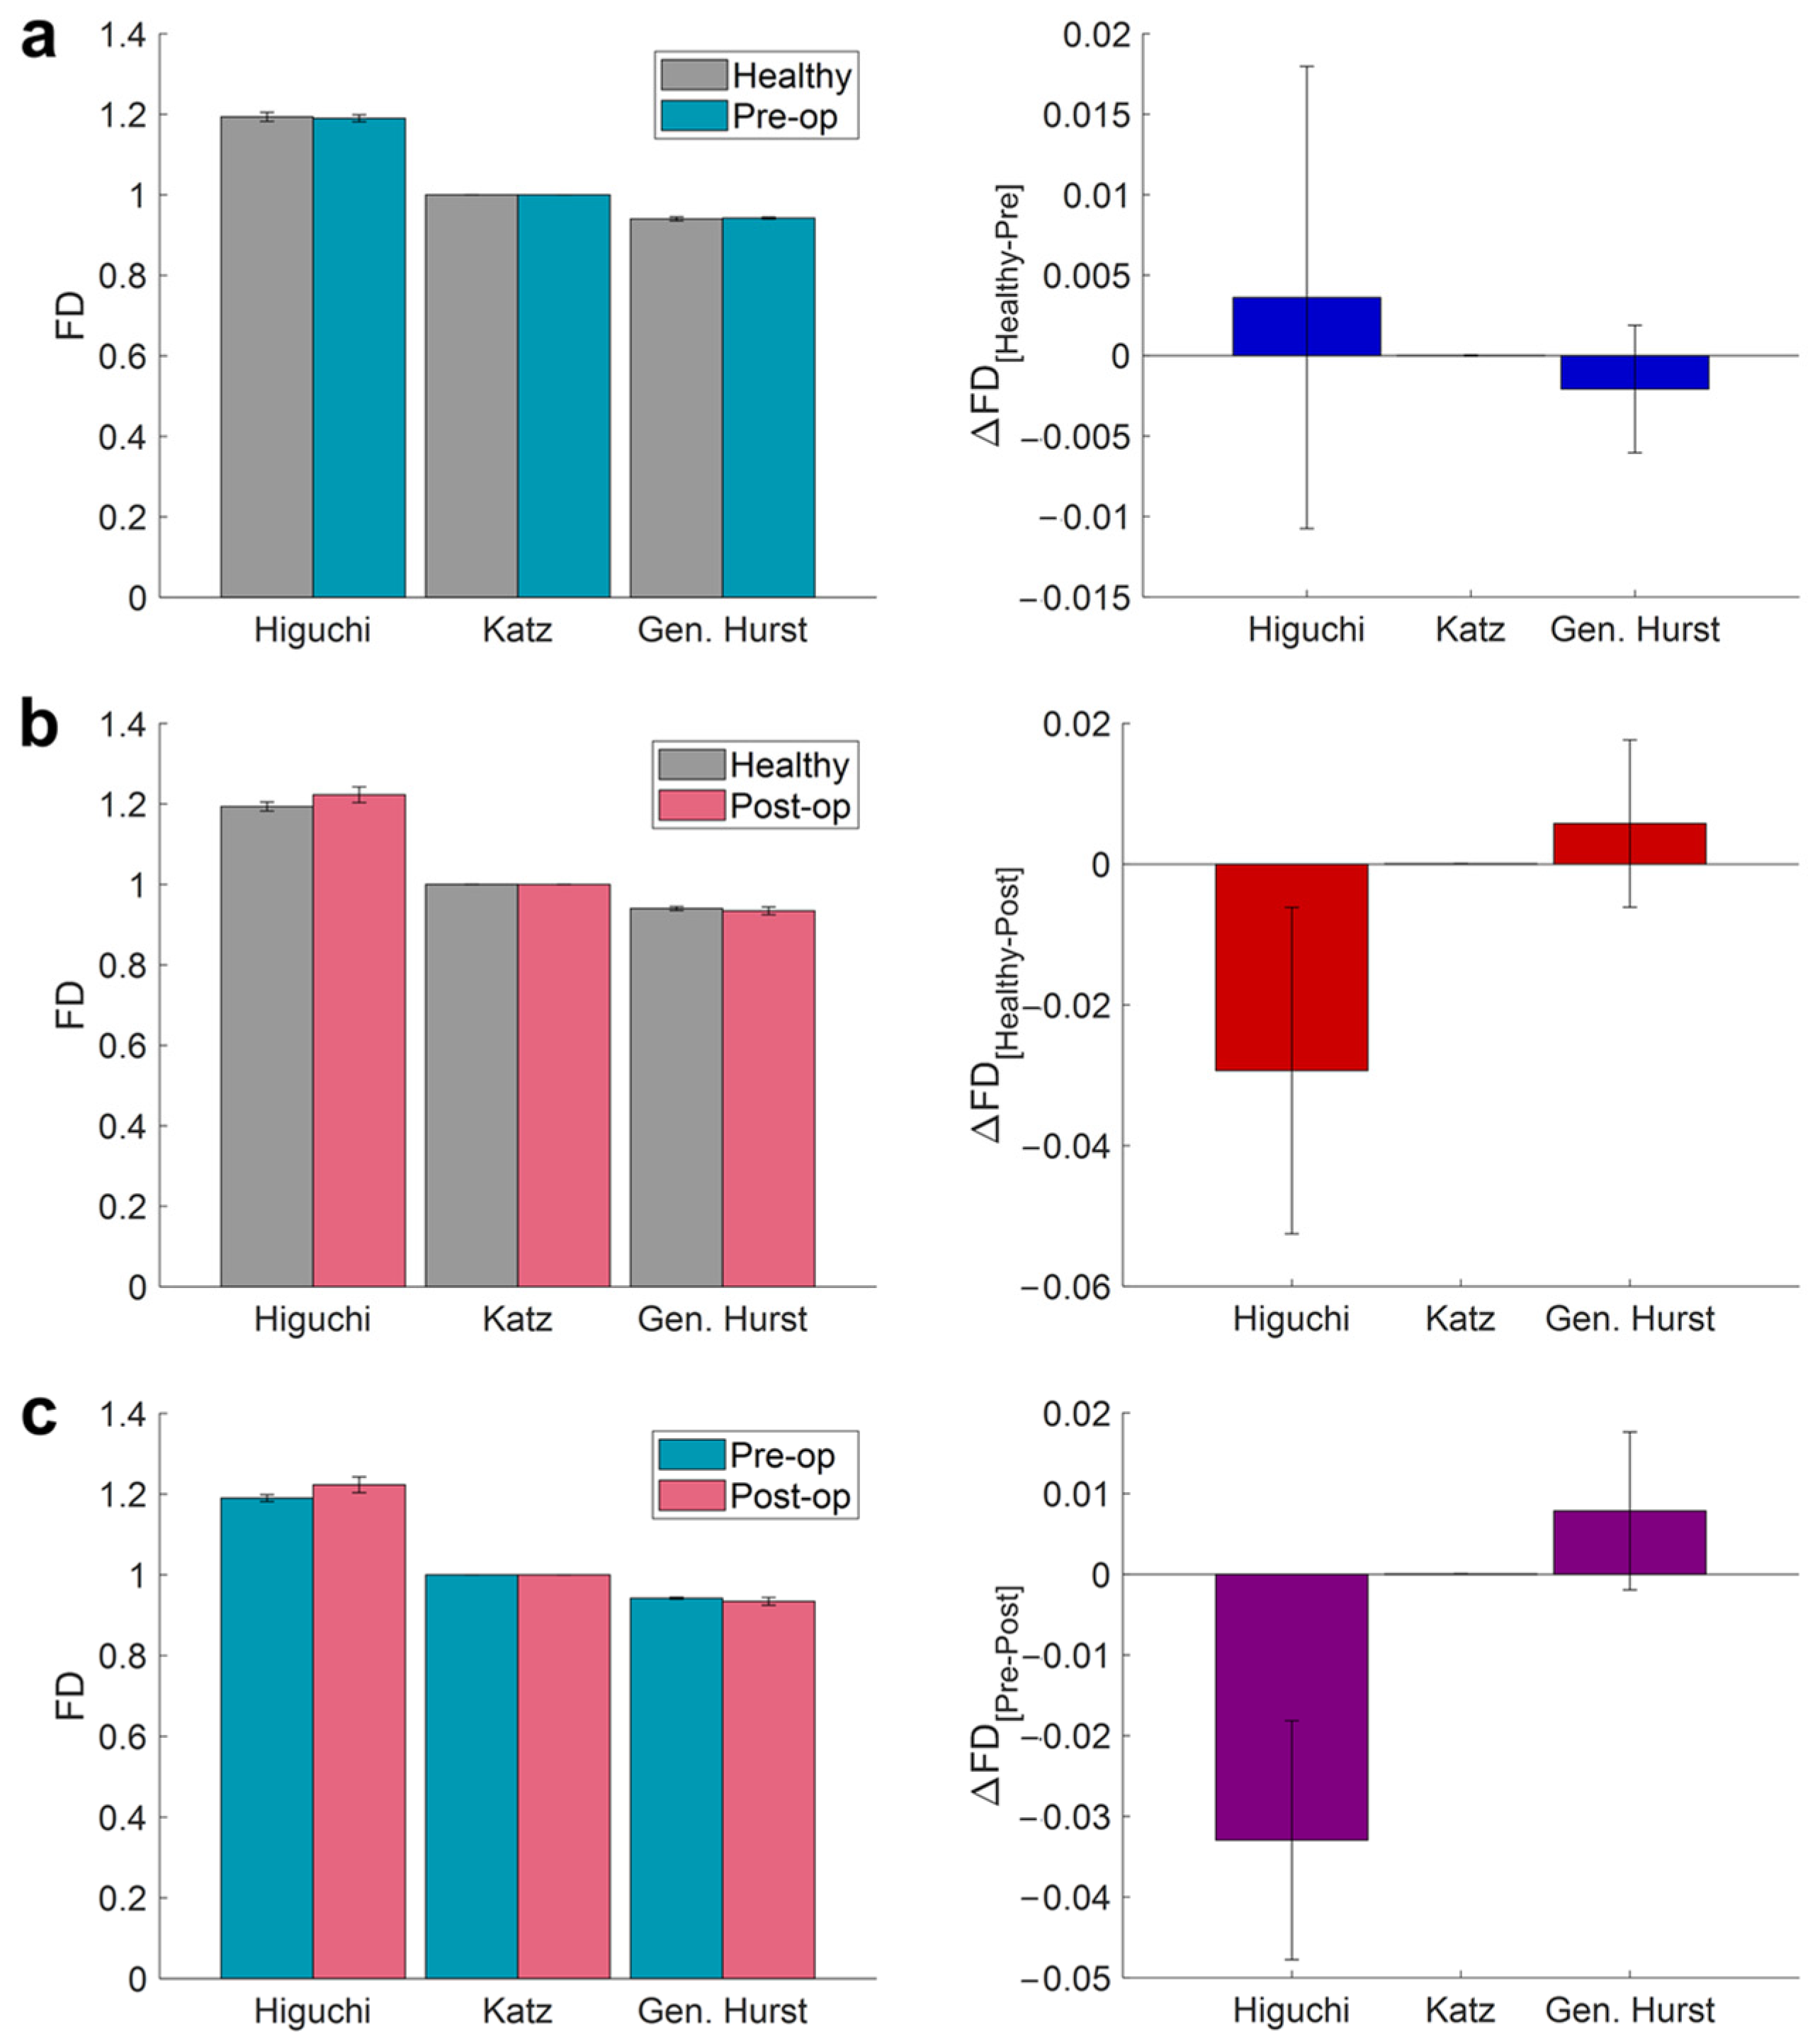
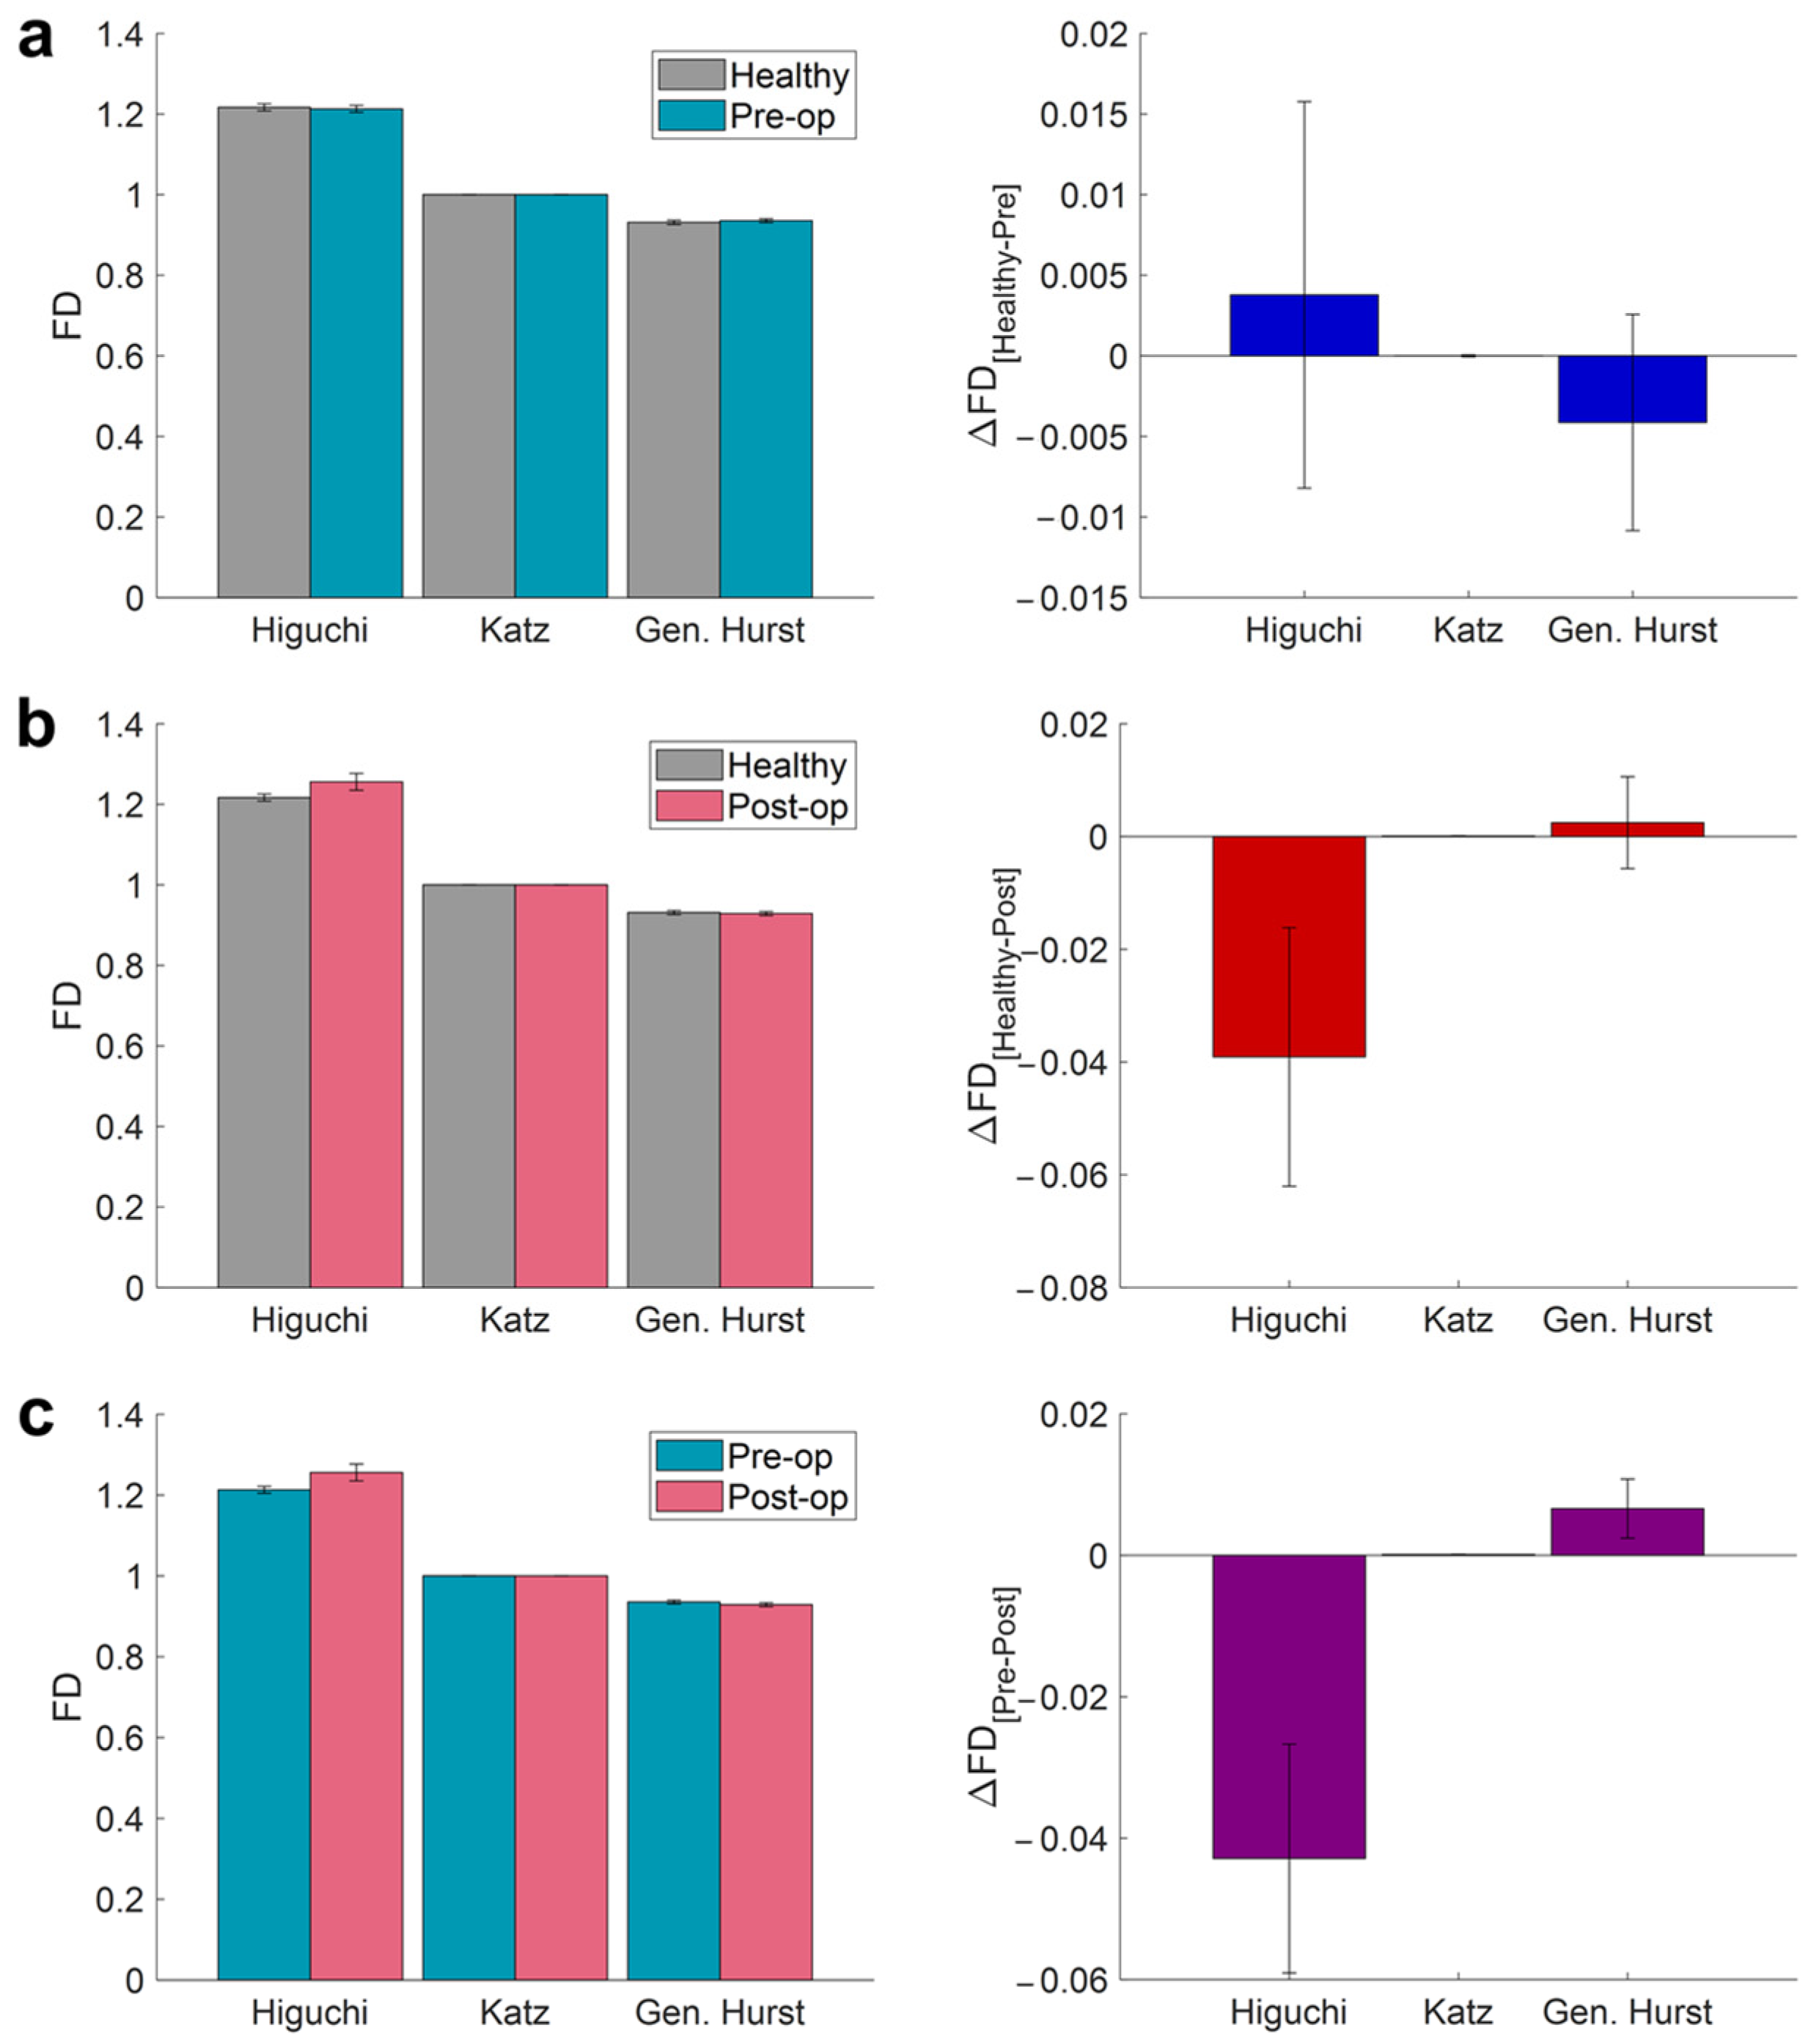
Using these three algorithms, the FDs of ELE-back, ELE-front, and corneal curvature data were calculated, and the average FD measures were obtained for each class of data. The results show that none of the three FD algorithms led to a significant difference between the FD values of healthy and pre-op patients for either the anterior elevation (p-valueHiguchi = 0.710, p-valueKatz = 0.620, and p-valueHurst = 0.535; Table 4 and Figure 5) or posterior elevation (p-valueHiguchi = 0.535, p-valueKatz = 0.535, and p-valueHurst = 0.318; Table 5 and Figure 6) surfaces. Table 4 and Table 5 also reveal that the Higuchi FD showed a difference between the healthy and post-op subjects for both the anterior (p-valueHiguchi = 0.007) and posterior (p-valueHiguchi = 0.001) surfaces. Similarly, a significant difference (between the healthy and post-op data) was also discovered by the Katz FD for both the anterior (p-valueKatz = 0.017) and posterior (p-valueKatz = 0.002). Furthermore, the generalized Hurst exponent failed to make a difference between the healthy controls and post-op KCN patients for both the anterior (p-valueHurst = 0.383) and posterior (p-valueHurst = 0.620) surfaces. The analysis of the posterior surface showed that all the FD features led to a significant difference between pre- and post-op patients (p-valueHiguchi = 0.018, p-valueKatz = 0.018, and p-valueHurst = 0.028). On the other hand, except for the generalized Hurst exponent (p-valueHurst = 0.091), a difference was found between the Higuchi (p-valueHiguchi = 0.018) and Katz (p-valueKatz = 0.028) FDs of the pre- and post-op KCN patients.
Figure 5 shows that the Higuchi FDs of the post-op patients were higher than the healthy (∆Higuchihealthy-post = −0.029; p-valueHiguchi = 0.007) and pre-op patients (∆Higuchipre-post = −0.033; p-valueHiguchi=0.018). On the other hand, the Katz FD of the post-op KCN patients was lower than the healthy patients (∆Katzhealthy-post = 0.0005; p-valueHiguchi = 0.017) as well as the pre-op ones (∆Katzpre-post=0.0004; p-valueHiguchi = 0.028). Based on Figure 6, the same scenario can be observed for the Higuchi FD between the post-op patients and both healthy controls (∆Higuchihealthy-post = −0.039; p-valueHiguchi = 0.001) and pre-op data (∆Higuchipre-post = −0.043; p-valueHiguchi = 0.018). Moreover, the Katz FD of the post-op subjects was lower than the healthy (∆Katzhealthy-post = 0.0001; p-valueKatz = 0.002) and pre-op ones (∆Katzpre-post = 0.0001; p-valueKatz = 0.018) as well. Additionally, unlike the Higuchi FD and similar to the Katz FD, the generalized Hurst exponent of the post-op patients was lower than the pre-op KCN subjects (∆Hurstpre-post = 0.007; p-valueHurst = 0.028).
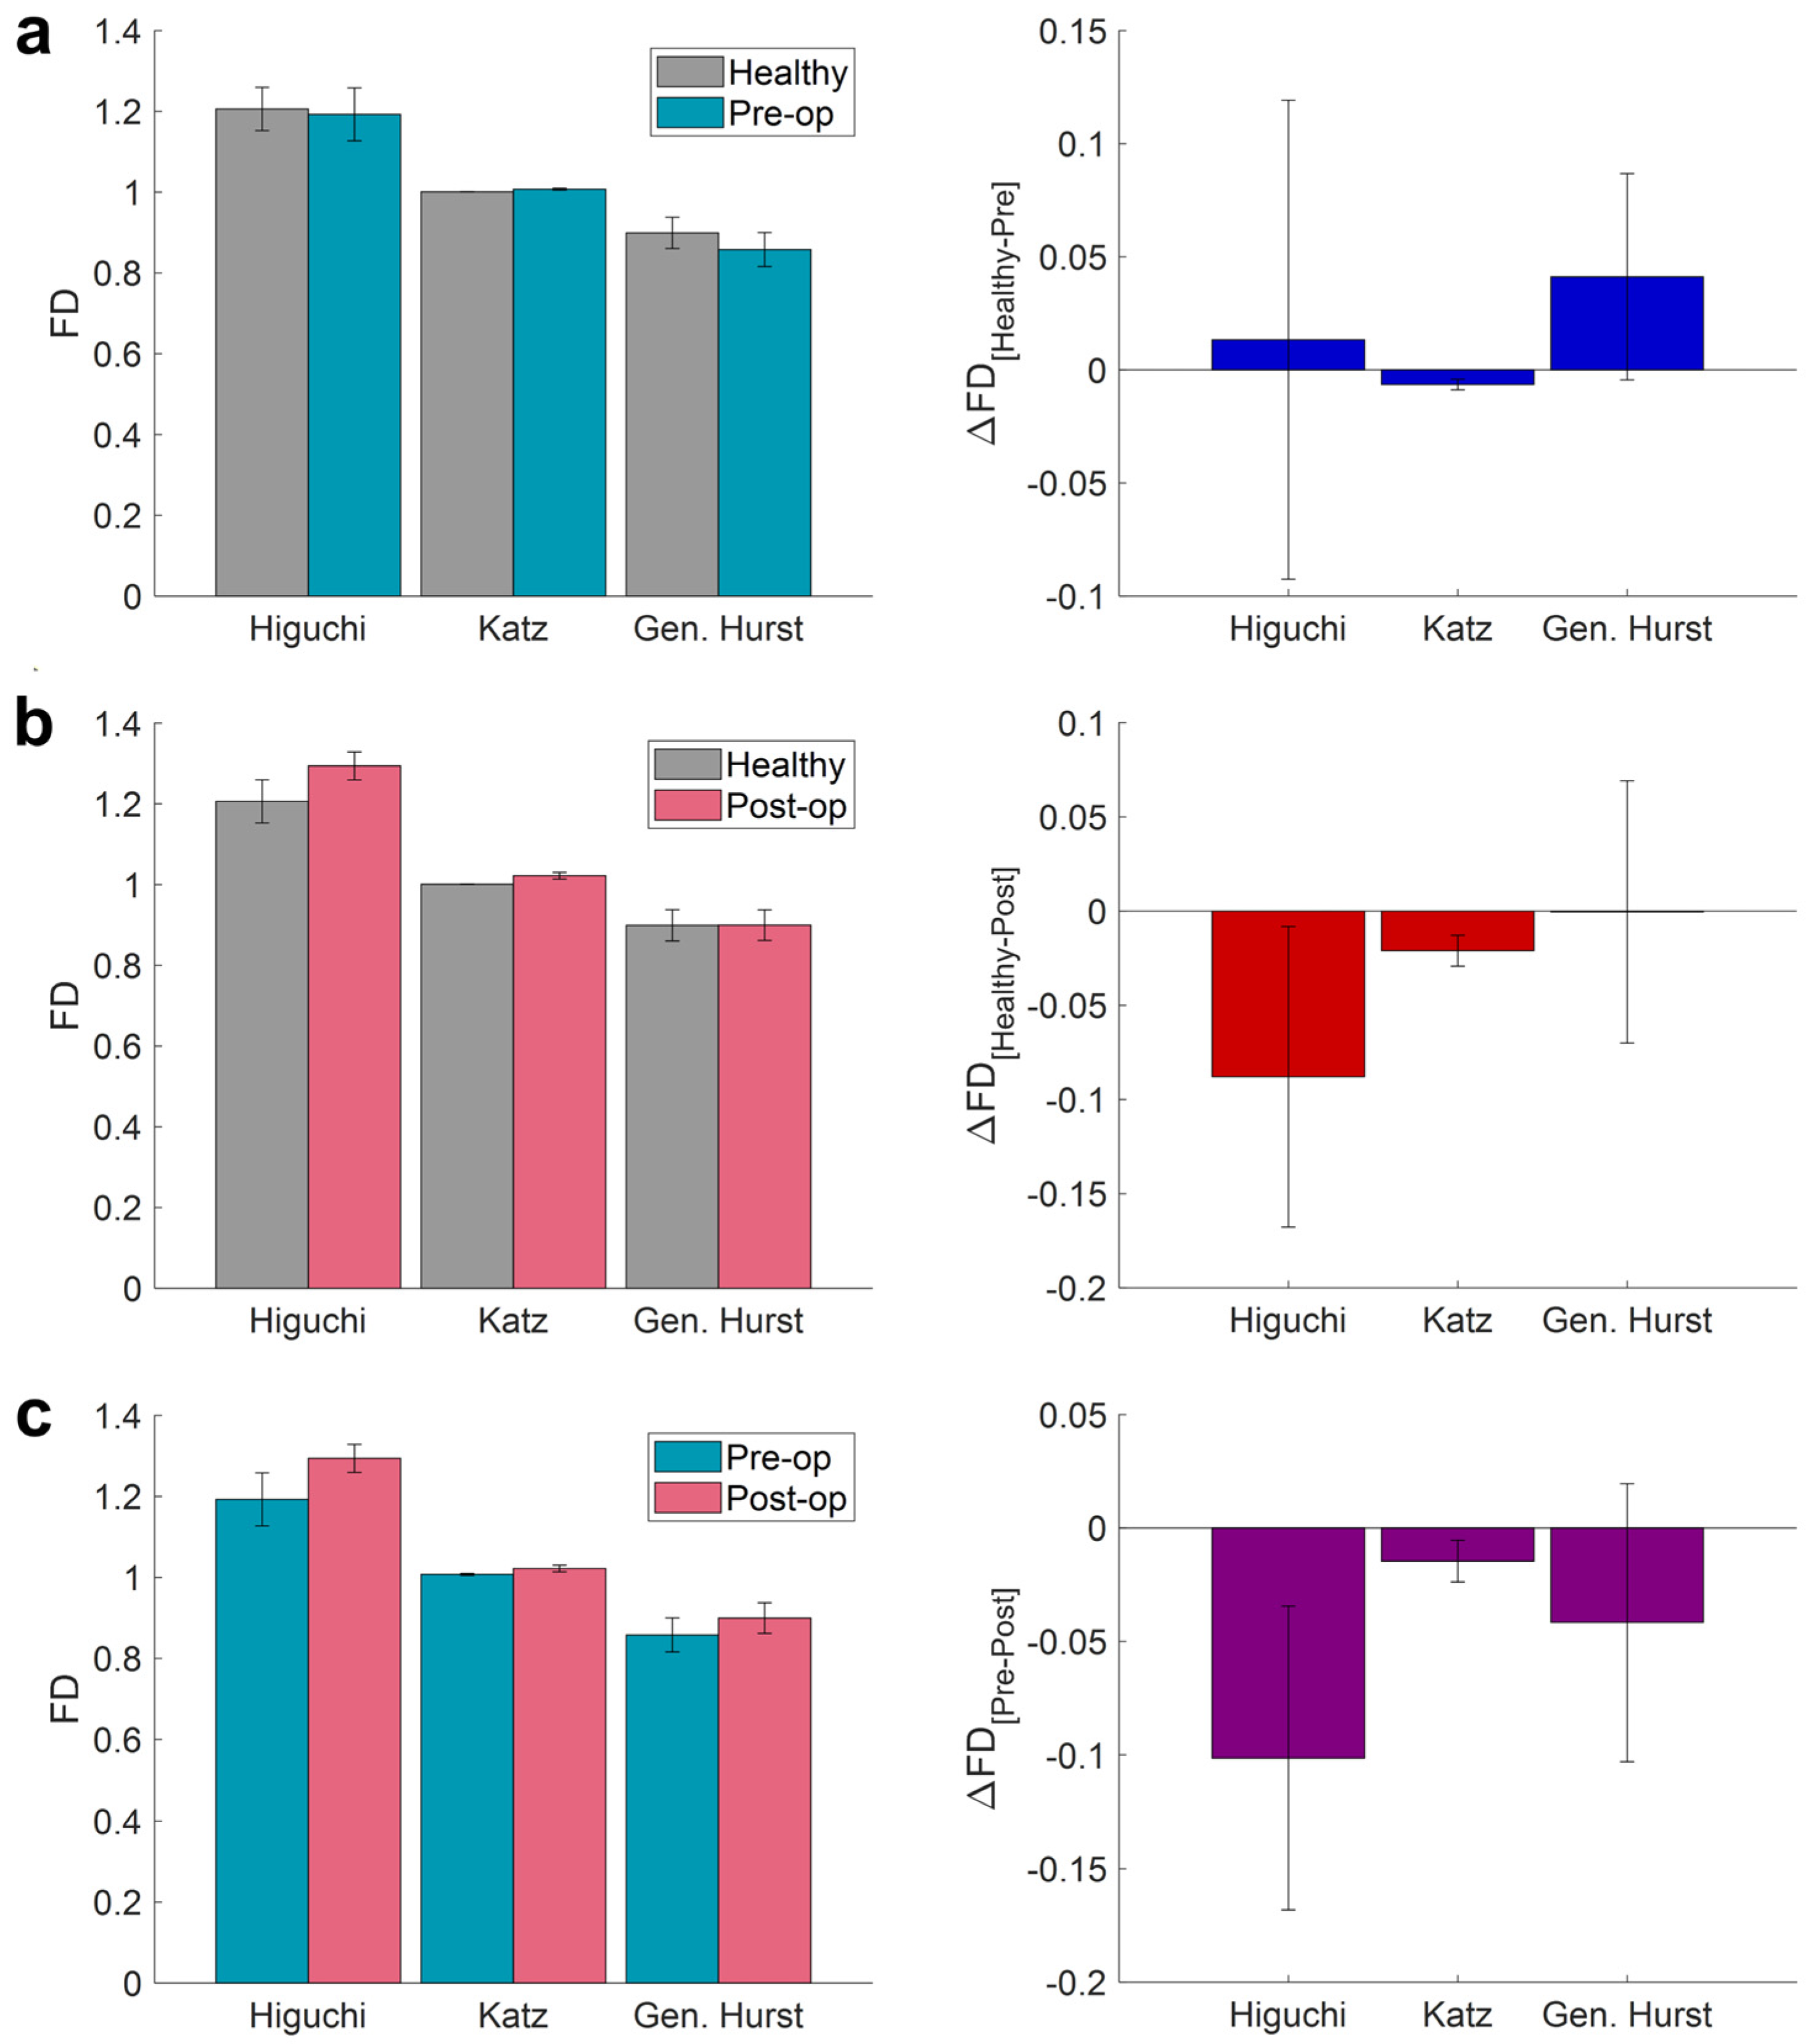
The results of the analysis of the curvature data are demonstrated in Table 6 and Figure 7. In this case, the Katz FD led to a significant difference between the healthy controls and pre-op KCN patients, with higher FD values for pre-op KCN patients (p-valueKatz = 0.001; ∆Katzhealthy-pre = −0.006). In addition, the Katz FD could differ between healthy controls and post-op KCN patients with higher FD values for post-op KCN patients (p-valueKatz = 0.001; ∆Katzhealthy-post = −0.021), as well as between pre-op KCN patients and post-op KCN patients with higher FD values of post-op KCN patients (p-valueKatz = 0.028; ∆Katzpre-post = −0.015). In contrast, the generalized Hurst exponent had no difference in any of the above conditions (p-valueHurst = 0.456; p-valueHurst = 0.805; p-valueHurst = 0.128). On the other hand, except for the healthy controls and pre-op KCN patients (p-valueHiguchi = 0.805), the Higuchi FD provided a difference between healthy controls and post-op KCN patients (p-valueHiguchi = 0.002) and between the pre- and post-op KCN patients (p-valueHiguchi = 0.028) with higher FD values of the post-op KCN patient data (∆Higuchihealthy-post = −0.088; ∆Higuchipre-post = −0.101).

4. Discussion

KCN-associated anatomical deviations strongly influence the patient’s vision and their quality of life. Few-micron alterations of the corneal geometry in terms of elevation and curvature change the corneal optical power up to several diopters and cause a highly multifocal surface, affecting ophthalmic surgical plans [25,37,38].
In the course of KCN, the locally decreased corneal stiffness causes the cornea to bulge under the intraocular pressure, resulting in catastrophic deterioration of the patient’s visual acuity. The current intracorneal ring segments implanted into the cornea to control the progression of the disease have a significant impact on the stress and strain distribution within the cornea. For instance, J.L. Alio et al. showed that intracorneal implants improved visual acuity and aberrations in a long-term follow-up of KCN patients with a stable course of keratoconus. However, those suffering from progressive KCN experienced clinically relevant regression of three diopters and higher [39].
The cornea surface has a complex structure in terms of topology and surface. Therefore, we used Pentacam topographical images, i.e., ELE-front, ELE-back, and CURV measures were extracted for further analysis. This complexity can be captured and revealed by nonlinear features customized for two-dimensional data. The FD is known as an index of complexity. Due to this fact, we used three famous algorithms to obtain the FD values of ELE-front, ELE-back, and CURV data. The aim of this study was to investigate the nonlinear FDs of healthy corneas and a pre-/post-op corneal condition of a group of keratoconus patients who were undergoing the implantation.
Considering the elevation topographies, none of the FD measures (Higuchi, Katz, gen. Hurst) could discriminate such a difference between either the anterior (Table 4: p-values > 0.535) or the posterior surfaces (Table 5: p-values > 0.318) between healthy and pre-op groups. In addition, generalized Hurst methods could not reveal any difference between the pre- and post-op of anterior elevation conditions (Table 4: p-value > 0.091). Although, all the FD indexes could discriminate differences between the posterior elevations of untreated and treated groups (Table 5: p-value < 0.028). In spite of the fact that the optical contribution of the corneal posterior surface was previously underestimated, it plays an important role in KCN patients [40]. Therefore, identifying the alterations and corrections of the posterior surface could have high relevance in clinical settings.
Higuchi and Katz were sensitive to the difference in posterior curvature before and after the surgery (Table 5, p-value < 0.018). Moreover, the Katz FD could perfectly detect the difference in the curvature data (p-valueKatz < 0.001). In addition, the Katz FD could also reveal the difference between the untreated and treated corneal surface of the KCN patients (p-valueKatz < 0.028). Hence, the Katz FD may capture the topological or geometrical changes by measuring the complexity of the curvature data.
Ocular symptoms and signs of KCN widely vary depending on the disease progression and severity [35]. Previous studies have also shown that the elevation of the anterior surface might not suffice to determine KCN-related abnormalities in the cornea as a whole. Since there are reported cases of prominent posterior and decentered ectasia, the corneal condition could not be interpreted using a single index, but rather using a hybrid method [35].
The posterior corneal elevation was revealed to effectively discriminate KCN from normal corneas [11], and the KCN-related alteration may develop independently in the posterior and anterior surfaces of the cornea [41]. This might explain the fact that Astig-front differed slightly before and after the operation (p-value ≈ 0.05) while Astig-back had the same values (p-value > 0.55). Kmax-front of the healthy controls were lower than that of pre-op KCN patients (p < 0.002), while it was similar between the treated KCN and the other two groups (p-value > 0.078). The inability of Kmax-front as a corneal index to reveal the progression of ectatic regions on corneal bulk has been reported previously [33,35,42,43].
The other reason that could prevent the fractal analysis from revealing the difference between the healthy and untreated corneas could be related to the pattern of elevation distribution on corneal surfaces. Khachikian et al. addressed that the assessment of the ectatic cornea in KCN might not be solely made using the elevation data, but in combination with the topographic pattern [44]. The same interpretation could be made for the KCN subjects based on the occurrence of the majority of the cone-shaped areas in the peripheral cornea (decentered cones) rather than apical manifestation.
In conclusion, proposing a practical and easily available index could open a new window to modify available interventions or to explore the efficacy of new treatments. The results of this study revealed that intracorneal implantation could provoke alterations in post-op topographic features, which do not follow the fractal dimensions of healthy corneas. Hence, we propose to describe the curvature feature of corneal topography as a “strange attractor” with a self-similar (i.e., fractal) structure according to the Katz fractal theorem. This feature could degrade with the progression of KCN and evolve shortly after intracorneal implantation in human corneas.

Author Contributions

Conceptualization, S.B.-S. and H.R.K.; methodology, All authors; software, S.B.-S. and M.M.; formal analysis, S.B.-S. and M.M.; investigation, S.B.-S. and M.M.; resources, K.J.; data curation, S.B.-S.; writing—original draft preparation, S.B.-S., H.R.K. and M.M.; writing—review and editing, H.R.K., A.B.-R. and S.J.; visualization, S.B.-S. and M.M.; supervision, H.R.K.; project administration, A.B.-R. and K.J. All authors have read and agreed to the published version of the manuscript.

Funding

This research received no external funding.

Institutional Review Board Statement

The protocols handled in the present study adhered to the tenets of the Declaration of Helsinki and were approved by the Ophthalmic Research Center of Shahid Beheshti University of Medical Sciences (Approval ID: IR.SBMU.ORC.REC.1400.001, Approval Date: 14 March 2021).

Informed Consent Statement

Written informed consent has been obtained from the patients to publish this paper.

Data Availability Statement

The data presented in this study are available on request from the corresponding author.

Conflicts of Interest

The authors declare no conflict of interests.

References

  1. Namazi, H.; Jafari, S. Decoding of wrist movements direction by fractal analysis of Magnetoen-cephalography (MEG) signal. Fractals 2019, 27, 1950001. [Google Scholar] [CrossRef]
  2. Namazi, H.; Akhavan Farid, A.; Seng, C.T. Complexity-based analysis of of the influence of tool geometry on cutting forces in rough end milling. Fractals 2018, 26, 1850078. [Google Scholar] [CrossRef]
  3. Namazi, H.; Kiminezhadmalaie, M. Diagnosis of lung cancer by fractal analysis of damaged DNA. Comput. Math. Methods Med. 2015, 2015, 242695. [Google Scholar] [CrossRef] [PubMed] [Green Version]
  4. Meyer, M.; Stiedl, O. Self-affine fractal variability of human heartbeat interval dynamics in health and disease. Eur. J. Appl. Physiol. 2003, 90, 305–316. [Google Scholar] [CrossRef]
  5. Smits, F.M.; Porcaro, C.; Cottone, C.; Cancelli, A. Electroencephalographic Fractal Dimension in Healthy Ageing and Alzheimer’s Disease. PLoS ONE 2016, 11, e0149587. [Google Scholar] [CrossRef]
  6. Peng, C.; Havlin, S.; Hausdorff, J.-J.M.; Mietus, J.E.; Stanley, H.E.; Goldberger, A.L. Fractal Mechanisms and Heart Rate Dynamics Long-range Correlations and Their Breakdown With Disease. J. Electrocardiol. 1995, 28, 59–65. [Google Scholar] [CrossRef]
  7. Goldberger, A.L.; Amaral, L.A.N.; Hausdorff, J.M.; Ivanov, P.C.; Peng, C.; Stanley, H.E. Fractal dynamics in physiology: Alterations with disease and aging. Proc. Natl. Acad. Sci. USA 2002, 99, 2466–2472. [Google Scholar] [CrossRef] [Green Version]
  8. Firtion, E.; Peng, C.K.; Hausdorff, J.M.; Mitchell, S.L.; Cudkowicz, M.E.; Wei, J.Y.; Goldberger, A.R.Y.L.; Jeffrey, M.; Mitchell, S.L. Altered fractal dynamics of gait: Reduced stride-interval correlations with aging and Huntington’s disease. J. Appl. Physiol. 1997, 82, 262–269. [Google Scholar] [CrossRef]
  9. Nayak, S.R.; Mishra, J.; Khandual, A.; Palai, G. Fractal dimension of RGB color images. Opt. Int. J. Light Electron. Opt. 2018, 162, 196–205. [Google Scholar] [CrossRef]
  10. Swartz, T.; Marten, L.; Wang, M. Measuring the cornea: The latest developments in corneal topography. Curr. Opin. Ophthalmol. 2007, 18, 325–333. [Google Scholar] [CrossRef]
  11. de Sanctis, U.; Loiacono, C.; Richiardi, L.; Turco, D.; Mutani, B.; Grignolo, F.M. Sensitivity and Specificity of Posterior Corneal Elevation Measured by Pentacam in Discriminating Keratoconus/Subclinical Keratoconus. Ophthalmology 2008, 115, 1534–1539. [Google Scholar] [CrossRef] [PubMed]
  12. Flecha-Lescún, J.; Calvo, B.; Zurita, J.; Ariza-Gracia, M.Á. Template-based methodology for the simulation of intracorneal segment ring implantation in human corneas. Biomech. Model. Mechanobiol. 2018, 17, 923–938. [Google Scholar] [CrossRef] [PubMed]
  13. Godefrooij, D.A.; de Wit, G.A.; Uiterwaal, C.S.; Imhof, S.M.; Wisse, R.P.L. Age-specific Incidence and Prevalence of Keratoconus: A Nationwide Registration Study. Am. J. Ophthalmol. 2017, 175, 169–172. [Google Scholar] [CrossRef] [PubMed]
  14. Rabinowitz, Y.S. Keratoconus. Surv. Ophthalmol. 1998, 42, 297–319. [Google Scholar] [CrossRef]
  15. Andreassen, T.T.; Simonsen, A.H.; Oxlund, H. Biomechanical Properties of Keratoconus and Normal Corneas. Exp. Eye Res. 1980, 31, 435–441. [Google Scholar] [CrossRef]
  16. Torres Netto, E.A.; Al-Otaibi, W.M.; Hafezi, N.L.; Kling, S.; Al-Farhan, H.M.; Randleman, J.B.; Hafezi, F. Prevalence of keratoconus in paediatric patients in Riyadh, Saudi Arabia. Br. J. Ophthalmol. 2018, 102, 1436–1441. [Google Scholar] [CrossRef]
  17. Kennedy, R.H.; Bourne, W.M.; Dyer, J.A. A 48-year clinical and epidemiologic study of keratoconus. Am. J. Ophthalmol. 1986, 101, 267–273. [Google Scholar] [CrossRef]
  18. Alió, J.L. What Is Keratoconus? A New Approach to a Not So Rare Disease. In Keratoconus; Springer: Cham, Switzerland, 2017; pp. 3–5. [Google Scholar]
  19. Khan, S.N.; Shiakolas, P.S. To study the effects of intrastromal corneal ring geometry and surgical conditions on the postsurgical outcomes through finite element analysis. J. Mech. Med. Biol. 2016, 16, 1650101. [Google Scholar] [CrossRef]
  20. Piñero, D.P.; Alio, J.L.; Teus, M.A.; Barraquer, R.I.; Uceda-Montañés, A. Modeling the intracorneal ring segment effect in keratoconus using refractive, Keratometric, and corneal aberrometric data. Investig. Ophthalmol. Vis. Sci. 2010, 51, 5583–5591. [Google Scholar] [CrossRef] [Green Version]
  21. Vinciguerra, R.; Fernández-Vega-Cueto, L.; Poo-Lopez, A.; Eliasy, A.; Merayo-Lloves, J.; Elsheikh, A.; Madrid-Costa, D.; Lisa, C.; Alfonso, J.F. The Effect of Intracorneal Ring Segments Implantation for Keratoconus on In Vivo Corneal Biomechanics Assessed With the Corvis ST. J. Refract. Surg. 2022, 38, 264–269. [Google Scholar] [CrossRef]
  22. Ariza-Gracia, M.Á.; Flecha-Lescún, J.; Büchler, P.; Calvo, B. Corneal biomechanics after intrastromal ring surgery: Optomechanical in silico assessment. Transl. Vis. Sci. Technol. 2020, 9, 26. [Google Scholar] [CrossRef] [PubMed]
  23. Nicula, C.; Pop, R.N.; Nicula, D.V. Comparative Results in a Combined Procedure of Intrastromal Corneal Rings Implantation and Cross-linking in Patients with Keratoconus: A Retrospective Study. Ophthalmol. Ther. 2017, 6, 313–321. [Google Scholar] [CrossRef] [PubMed] [Green Version]
  24. Piñero, D.P.; Alio, J.L. Intracorneal ring segments in ectatic corneal disease—A review. Clin. Exp. Ophthalmol. 2010, 38, 154–167. [Google Scholar] [CrossRef] [PubMed]
  25. Piñero, D.P.; Nieto, J.C.; Lopez-Miguel, A. Characterization of corneal structure in keratoconus. J. Cataract. Refract. Surg. 2012, 38, 2167–2183. [Google Scholar] [CrossRef] [Green Version]
  26. Higuchi, T. Approach to an irregular time series on the basis of the Fractal Theory. Phys. D Nonlinear Phenom. 1988, 31, 277–283. [Google Scholar] [CrossRef]
  27. Ţălu, Ş.; Stach, S.; Sueiras, V.; Ziebarth, N.M. Fractal Analysis of AFM Images of the Surface of Bowman’s Membrane of the Human Cornea. Ann. Biomed. Eng. 2015, 43, 906–916. [Google Scholar] [CrossRef]
  28. Stach, S.; Ţălu, Ş.; Trabattoni, S.; Tavazzi, S.; Głuchaczka, A.; Siek, P.; Zając, J.; Giovanzana, S. Morphological Properties of Siloxane-Hydrogel Contact Lens Surfaces. Curr. Eye Res. 2017, 42, 498–505. [Google Scholar] [CrossRef]
  29. Ţălu, Ş.; Bramowicz, M.; Kulesza, S.; Fiorillo, I. Fractal Features and Surface Micromorphology of Unworn Surfaces of Rigid Gas Permeable Contact Lenses Fractal Features and Surface Micromorphology of Unworn Surfaces of Rigid Gas. Curr. Eye Res. 2017, 42, 1118–1123. [Google Scholar] [CrossRef]
  30. Katz, M.J. Fractals and the analysis of waveforms. Comput. Biol. Med. 1988, 18, 145–156. [Google Scholar] [CrossRef]
  31. Matteo, T.D.I. Multi-scaling in finance. Quant. Financ. 2007, 7, 21–36. [Google Scholar] [CrossRef]
  32. Kisan, S.; Mishra, S.; Rout, S.B. Fractal dimension in medical imaging: A review. Int. Res. J. Eng. Technol. 2017, 4, 1102–1106. [Google Scholar]
  33. Ambrósio, R.; Belin, M.; Conrad-Hengerer, C.; Dhubhghaill, S.; Gilg, A.-N.; Grewal, D.; Gulani, A.; Holladay, J.; Iwanczuk, J.; Kohnen, T.; et al. Interpretation Guide: Pentacam (2016; p. 216). Available online: https://www.pentacam.com/fileadmin/user_upload/pentacam.de/downloads/interpretations-leitfaden/Pentacam_Guideline_3rd_0218_k.pdf (accessed on 26 May 2022).
  34. Kim, J.T.; Zloty, P. Simplified Nomenclature for describing Keratoconus. Int. J. Keratoconus Ectatic Corneal Dis. 2012, 1, 31–35. [Google Scholar] [CrossRef]
  35. Duncan, J.K.; Belin, M.W.; Borgstrom, M. Assessing progression of keratoconus: Novel tomographic determinants. Eye Vis. 2016, 3, 6. [Google Scholar] [CrossRef] [PubMed] [Green Version]
  36. Ahammer, H. Higuchi Dimension of Digital Images. PLoS ONE 2011, 6, e24796. [Google Scholar] [CrossRef] [PubMed]
  37. Alessio, G.; Boscia, F.; La Tegola, M.G.; Sborgia, C. Topography-driven excimer laser for the retreatment of decentralized myopic photorefractive keratectomy. Ophthalmology 2001, 108, 1695–1703. [Google Scholar] [CrossRef]
  38. Shabayek, M.H.; Alió, J.L. Intrastromal Corneal Ring Segment Implantation by Femtosecond Laser for Keratoconus Correction. Ophthalmology 2007, 114, 1643–1652. [Google Scholar] [CrossRef]
  39. Alio, J.L.; Vega-Estrada, A.; Esperanza, S.; Barraquer, R.; Teus, M.; Murta, J. Intrastromal corneal ring segments: How successful is the surgical treatment of keratoconus? Middle East Afr. J. Ophthalmol. 2014, 21, 3–9. [Google Scholar] [CrossRef] [Green Version]
  40. Sögütlü, E.; Piñero, D.P.; Kubaloglu, A.; Alio, J.L.; Cinar, Y. Elevation changes of central posterior corneal surface after intracorneal ring segment implantation in keratoconus. Cornea 2012, 31, 387–395. [Google Scholar] [CrossRef] [Green Version]
  41. Piñero, D.P.; Alió, J.L.; Alesón, A.; Vergara, M.E.; Miranda, M. Corneal volume, pachymetry, and correlation of anterior and posterior corneal shape in subclinical and different stages of clinical keratoconus. J. Cataract Refract. Surg. 2010, 36, 814–825. [Google Scholar] [CrossRef]
  42. Tomidokoro, A.; Oshika, T.; Amano, S.; Higaki, S.; Maeda, N.; Miyata, K. Changes in anterior and posterior corneal curvatures in keratoconus. Ophthalmology 2000, 107, 1328–1332. [Google Scholar] [CrossRef]
  43. Mahmoud, A.M.; Nuñez, M.X.; Blanco, C.; Koch, D.D.; Wang, L.; Weikert, M.P.; Frueh, B.E.; Tappeiner, C.; Twa, M.D.; Roberts, C.J. Expanding the cone location and magnitude index to include corneal thickness and posterior surface information for the detection of keratoconus. Am. J. Ophthalmol. 2013, 156, 1102–1111. [Google Scholar] [CrossRef] [PubMed]
  44. Khachikian, S.S.; Belin, M.W. Posterior Elevation in Keratoconus. Ophthalmology 2009, 116, 816–816.e1. [Google Scholar] [CrossRef] [PubMed]
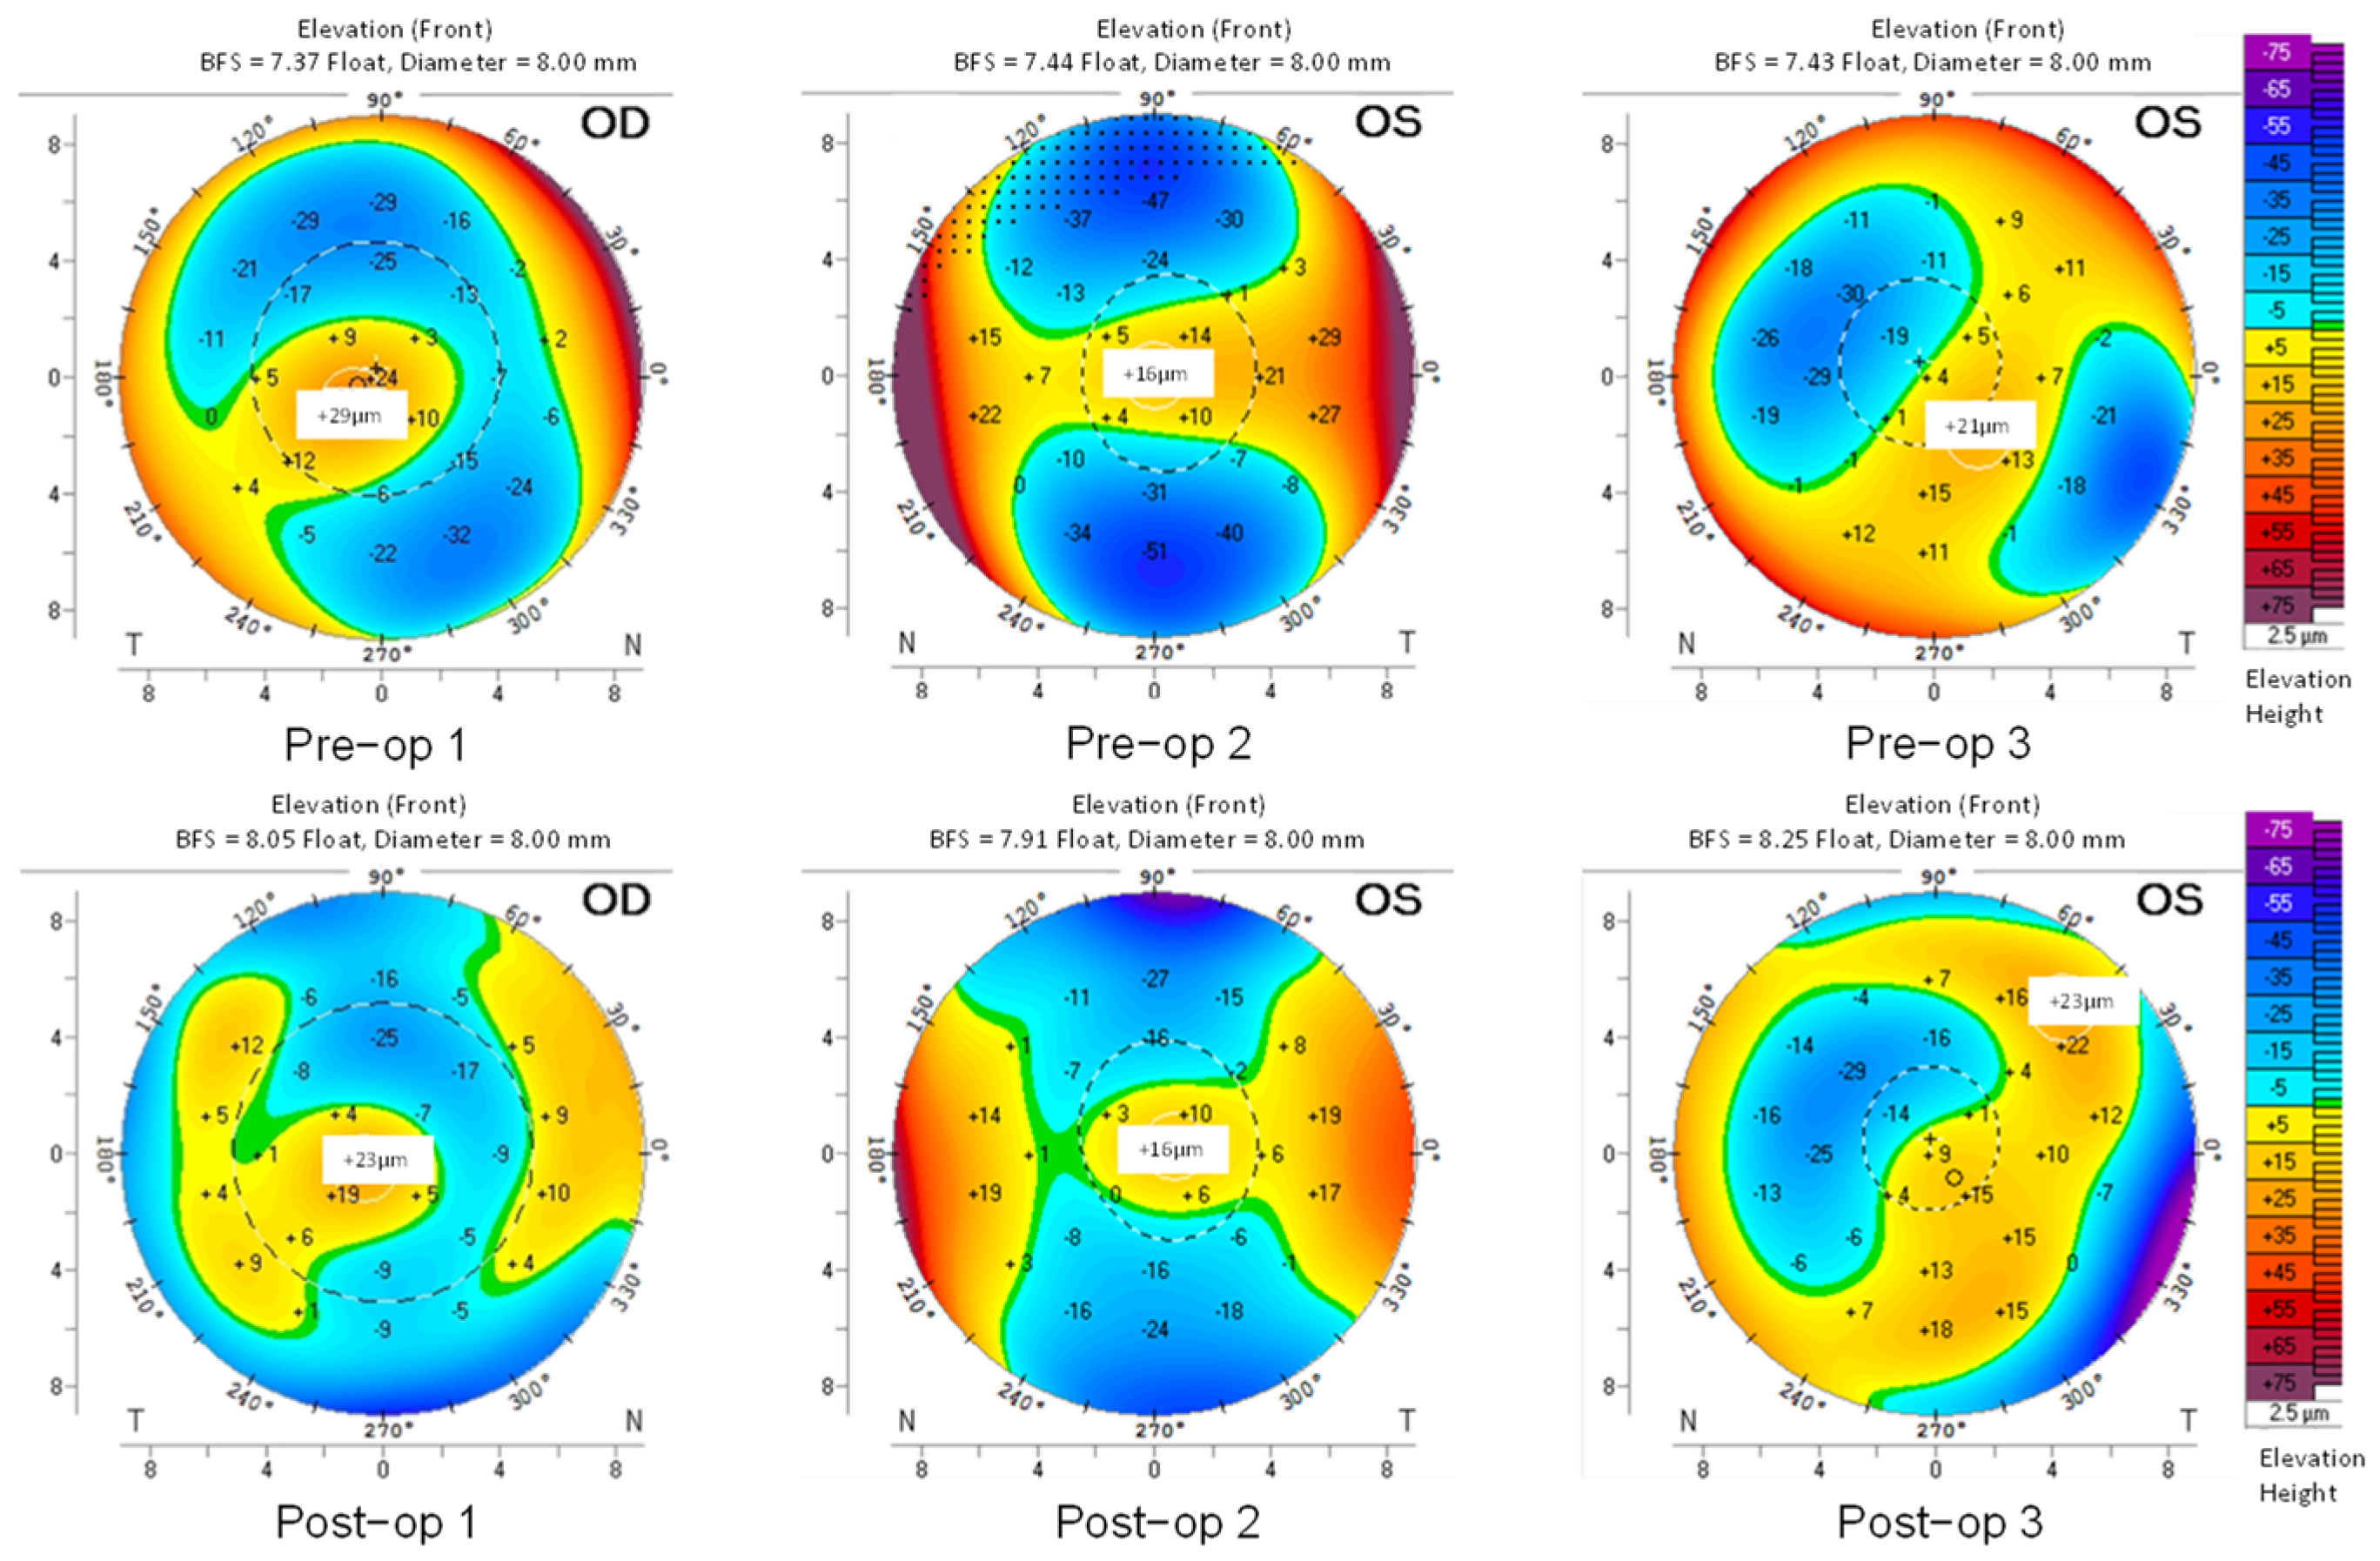
Figure 1. ELE-front maps based on Pentacam-derived topometric data for the three representatives of the KCN group before (pre-op) and after (post-op) the intracorneal implantation within 8 mm diameter of the cornea (the horizontal and the vertical axis). The color-coded scale is identical in all images.
Fractalfract 06 00688 g001
Figure 2. ELE-back maps based on Pentacam-derived topometric data for three representatives of the KCN group before (pre-op) and after (post-op) the intracorneal implantation within 8 mm diameter of the corneas (the horizontal and the vertical axis). The color-coded scale is identical in all images.
Fractalfract 06 00688 g002
Figure 3. The curvature (CURV) maps based on Pentacam-derived topometric data for three representatives of the KCN group within 8 mm diameter of the corneas (the horizontal and the vertical axis). The color-coded scale is identical in all images.
Fractalfract 06 00688 g003
Figure 4. Kmax-front, Astig-front and Astig-back based on Pentacam-derived topometric data for the healthy group, and the pre- and post-operation state of the KCN patients.
Fractalfract 06 00688 g004aFractalfract 06 00688 g004b
Figure 5. Average values of Higuchi FD, Katz FD, and generalized Hurst exponent (left panel) along with the difference in FD values (right panel) obtained from ELE-front measures for (a) healthy and pre-op (p-valueHiguchi = 0.710; p-valueKatz = 0.620; p-valueHurst = 0.535), (b) healthy and post-op (p-valueHiguchi = 0.007; p-valueKatz = 0.017; p-valueHurst = 0.383), and (c) pre-op and post-op (p-valueHiguchi = 0.018; p-valueKatz = 0.028; p-valueHurst = 0.091) conditions.
Fractalfract 06 00688 g005
Figure 6. Average values of Higuchi FD, Katz FD, and generalized Hurst exponent (left panel) along with the difference in FD values (right panel) obtained from ELEback measures for (a) healthy and preop (p-valueHiguchi = 0.535; p-valueKatz = 0.535; p-valueHurst = 0.318), (b) healthy and postop (p-valueHiguchi = 0.001; p-valueKatz = 0.002; p-valueHurst = 0.620), and (c) preop and postop (p-valueHiguchi = 0.018; p-valueKatz = 0.018; p-valueHurst = 0.028) conditions.
Fractalfract 06 00688 g006
Figure 7. Average values of Higuchi FD, Katz FD, and generalized Hurst exponent (left panel) along with the difference in FD values (right panel) obtained from CURV measures for (a) healthy and pre-op (p-valueHiguchi = 0.805; p-valueKatz = 0.001; p-valueHurst = 0.456), (b) healthy and post-op (p-valueHiguchi = 0.002; p-valueKatz = 0.002; p-valueHurst = 0.805), and (c) pre-op and post-op (p-valueHiguchi = 0.028; p-valueKatz = 0.028; p-valueHurst = 0.128) conditions.
Fractalfract 06 00688 g007
Table 1. General demographic data of the healthy controls and the KCN patients.
Subjects Sex (m/f) Age (Yr, Mean ± Std)OS/OD Eye *
Healthy4/329.5 ± 3.53 OS/4 OD
KCN4/339.25 ± 7.15 OS/2 OD
* OS: Oculus Sinister (left eye); OD: Oculus Dexter (right eye).
Table 2. Kmax-front, and the astigmatism of the anterior (Astig-front) and the posterior (Astig-back) corneal surfaces of the healthy controls and the patients (mean ± sd) obtained from Pentacam.
SubjectsOptical Outcome Kmax-Front (D)Astig-Front (D)Astig-Back (D)
HealthyStatus 43.66 ± 0.70.77 ± 0.460.31 ± 0.09
KCNPre-op *52.47 ± 3.243.81 ± 2.070.74 ± 0.42
Post-op **50.56 ± 3.042.01± 0.890.46 ± 0.27
* Pre-op: pre-operation; ** Post-op: post-operation.
Table 3. p-values for the comparison of Kmax-front, and the astigmatism of the anterior (Astig-front) and the posterior (Astig-back) corneal surfaces of the healthy controls and the patients (mean ± sd) obtained from Pentacam.
SubjectsKmax-Front (D)Astig-Front (D)Astig-Back (D)
Pre-op *Post-op **Pre-opPost-opPre-opPost-op
Healthy0.0020.2680.0030.0210.0160.002
Pre-opN/A0.078N/A0.059N/A0.55
* Pre-op: pre-operation; ** Post-op: post-operation.
Table 4. p-values for the comparison of corneal elevation-derived FDs of the anterior surface (ELE-front) obtained from Pentacam.
SubjectsPre-opPost-op
Higuchi fractal dimension
Healthy0.7100.007
Pre-opN/A0.018
Katz fractal dimension
Healthy0.6200.017
Pre-opN/A0.028
Generalized Hurst exponent
Healthy0.5350.383
Pre-opN/A0.091
Table 5. p-values for the comparison of corneal elevation-derived FDs of the posterior surface (ELE-back) obtained from Pentacam.
Subjects Pre-opPost-op
Higuchi fractal dimension
Healthy0.5350.001
Pre-opN/A0.018
Katz fractal dimension
Healthy0.5350.002
Pre-opN/A0.018
Generalized Hurst exponent
Healthy0.3180.620
Pre-opN/A0.028
Table 6. p-values for the comparison of corneal elevation-derived curvature measures obtained from Pentacam.
SubjectsPre-opPost-op
Higuchi fractal dimension
Healthy0.8050.002
Pre-opN/A0.028
Katz fractal dimension
Healthy0.0010.001
Pre-opN/A0.028
Generalized Hurst exponent
Healthy0.4560.805
Pre-opN/A0.128
Publisher’s Note: MDPI stays neutral with regard to jurisdictional claims in published maps and institutional affiliations.