Abstract
The particle size distribution of tailing sand will affect its strength, deformation and mechanical properties, thus affecting the overall safety and stability of the tailing dam. The main purpose of this study is to obtain the gradation of sand samples with the best shear strength and seepage effect by studying the influence of particle size on the mechanical properties of saturated iron tailing sand. The tailings were sampled from Yangjiawan tailing reservoir of Chengchao Iron Mine, and the moisture content test, particle size distribution analysis and scanning electron microscope test (SEM) were carried out on the samples. It is measured that the average moisture content of the tailings is 12%, and the gradation is generally poor. SEM was used to observe the microstructure of the three kinds of particles, and it was found that these structures were more likely to be damaged under load, which was not conducive to the improvement of the strength of tailings. Through the consolidation undrained test of five particle size groups, it is concluded that the larger the particle size is, the greater the shear strength will be. The Cu indicates the width of the distribution range of the grading curve, the Cc indicates the distribution pattern of the grading curve, and they are both used to indicate the particle grading of sand. Then, by changing the sample gradation, the coefficient of uniformity (Cu) and the coefficient of curvature (Cc) of the gradation parameters are controlled to remain unchanged, respectively. By changing another parameter, it is found that there is a close relationship between the coefficient of uniformity and the coefficient of curvature and the shear strength through the triaxial shear action, three kinds of tailing sand gradation with better strengths are obtained. Based on the study of strength characteristics, the permeability coefficients of three kinds of tailing sands are calculated by using the seepage failure test. The test results show that when the coefficient of uniformity is 5.5 and the coefficient of curvature is 1, the permeability coefficient is 1.699 × 10⁻³ cm/s, and the shear strength and permeability of the sample are the best.
1. Introduction
Tailing pond is a dangerous source of man-made debris flow with high potential energy. In the long time of several decades, various natural and human adverse factors will directly threaten its safety. It has been shown time and again that a tailing pond failure will certainly cause serious damage to the lives and properties of people downstream. From the perspective of an engineering application, with the continuous development of fine-grain mineral processing technology, the particle size of tailings discharged by the concentrator is getting thinner and thinner. The number of fine-grain tailing ponds will inevitably increase in the future, and the safety problem of fine-grain tailing dam building will also become increasingly prominent. Before studying the stability of the tailing dam, it is particularly important to study the basic mechanical properties of tailing sand.
For the physical and mechanical properties of tailing sand, Zhao [1] and Wang [2] studied the tailings from the perspective of their stockpile characteristics and found that increasing the relative density of tailing sand or decreasing its pore ratio would improve the shear strength of the dam body. Yang [3] and Xin [4] found that the higher the fine tailing content the stronger the cohesion and the smaller the internal friction angle and permeability through indoor geotechnical tests and laser particle size analysis, and established an intuitive tailing dam model with the help of Slide software to further confirm the importance of fines content on the stability of tailing ponds. Li [5] took the tailings of a copper mine in Yunnan province. On the basis of analyzing the basic physical characteristics, the influence of water content on the shear strength characteristics of the tailings was studied through a direct shear test. The results show that the tailings’ shear strength and the initial moisture content are correlated, and the fitting formula varies with the moisture content by regression analysis. Zhu [6] believes that the tailing sand in a saturated state, with the increase in fine content, the stress–strain curve under the same confining pressure shows three states strain-hardening type, strain-steady state type, and strain-softening type. The deposition and consolidation of tailings is an important basis for the formation of strength [7,8,9]; in addition, the peak partial stress of fine-grained sand is larger than that of coarse-grained sand at the same dry density and the same confining pressure, and the compressibility of the specimen increases with the increase in the viscous grain content when the viscous grain content is less than 10% [10,11]. Wang [12] and Ren [13] concluded from the strength test that with the increase in the dry density, when the sample breaks down, the external force needs to overcome the friction force will increase, making the cohesion force and the internal friction angle increase. D. Chakraborty and D. Choudhury [14] performed a dynamic and static analysis of a tailing pond section using Flac3D software, and the results showed that the deformation of the dam will be greatly affected under seismic action, and the acceleration at the bottom of the dam will increase as the height of the dam increases. Wang [15] adopts the three-axis test of consolidation and non-drainage. By preparing multiple groups of the same tailing samples and conducting them under four groups of peripheral pressure after saturation, it is concluded that the particle crushing degree of high-stress saturated tailings increases with the increase in stress and decreases with the increase in fine particles.
From a summary of the above literature, the research on the mechanical properties of tailing sand has been carried out in-depth, but there are still many urgent questions about the relationship between particle size and strength, the influence law and internal mechanism of the change of the tailings granularity on engineering performance is still poorly studied, which cannot provide theoretical guidance for the dam building technology of all kinds of fine-grain tailings. In view of the shortcomings of this problem, studying the influence of particle size on the mechanical properties of tailing sand can provide some theoretical support for the safety and stability evaluation of tailing dams and prevent the occurrence of tailing dam break accidents.
2. Test Materials and Physical Properties
2.1. Test Materials
The tailing sands studied in this paper were selected from the Chengchao iron ore mine in Ezhou, Hubei province. The tailing pond was originally designed with a final accumulation elevation of 85 m and a total capacity of 9,640,000 m3. In 2006, it was designed with a heightened and expanded capacity, with a final accumulation elevation of 95 m, a total dam height of 62.4 m, and a total capacity of 13,750,000 m3. It is a third-class pond. Since this tailing pond is a relatively rare large tailing pond that uses a new pond to cover the old one when the old pond discharges flood water, it will scour the slope of the initial dam or the stacking dam, and may also scour the sediment beach of the new tailing pond, causing the sediment beach to fail to rise steadily; when the new pond discharges ore, the slurry may scour the slope of the stacking dam of the old pond, thus causing instability.
The ore drawing openings I and II are selected from the accumulated dam body, and the sampling points are determined at different distances along the straight line to the reservoir. Along the ore drawing direction of different ore drawing openings, the sampling depth is about 40 cm and the samples are sampled every 10 to 20 m without interference. Field sampling is shown in Figure 1, 0, 20, 40, 60 m from the release mouth 1, recorded as I1, I2, I3, I4; 20, 40, 60, 70, 80 m from the release mouth 2, recorded as II1, II2, II3, II4, II5.
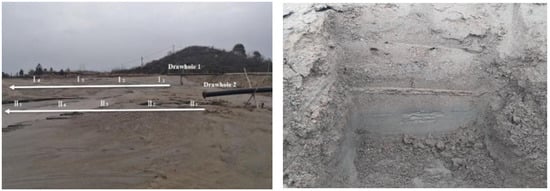
Figure 1.
Field sampling.
2.2. Moisture Content Testing
The drying method was used to determine the moisture content of the material, representative specimens were taken from the sampling bag, and three groups of specimens were taken from each sampling point for measurement. The calculation formula for the water content is as follows:
In the formula, represents the water content; m0 represents the natural wet soil mass; md represents the dry soil mass. The test results are shown in Table 1.

Table 1.
Moisture content record table.
With the deposition time and seepage effect, the water content of the tailing sand increased further away from the release port. At II3, due to the depression of the terrain here, a large amount of water could not be circulated, so the measured water content was 25.6%, which showed a significant difference, and the average water content of the tailings taken was measured to be 12%.
2.3. Particle Gradation Analysis
Referring to the Geotechnical Test Method Standard (GB/T 50123-2019) [16], particle analysis tests were conducted on the tailing sand, as shown in Figure 2 and Figure 3 for the original particle gradation curves of different sampling points.
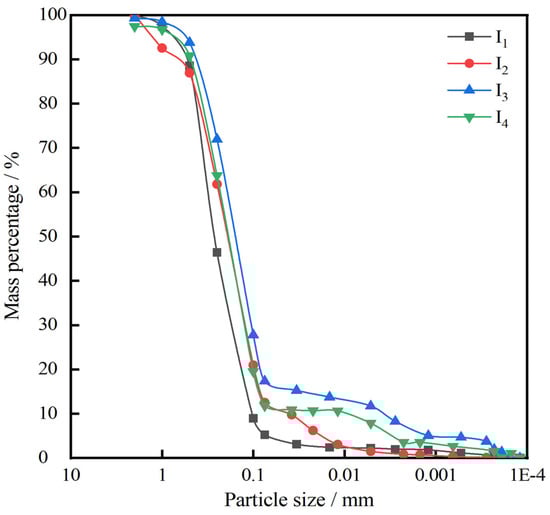
Figure 2.
Ore drawing mouth 1.
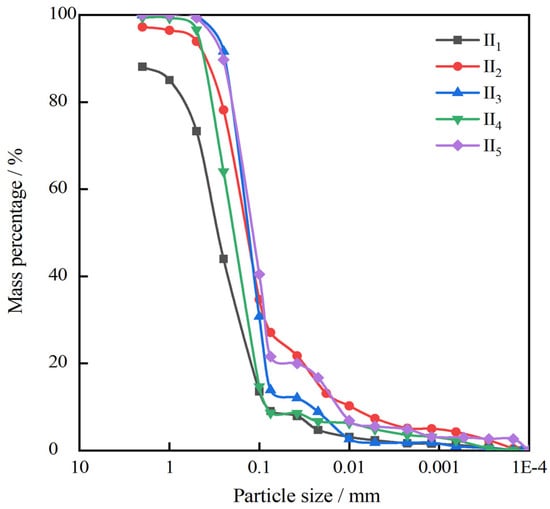
Figure 3.
Ore drawing mouth 2.
From the sieving results, it is concluded that the mass of particles with a particle size greater than 0.074 mm in the whole tailings exceeds 50% of the total mass, which belongs to the tailing chalk sand. From Figure 2 and Figure 3, it can be obtained that the average particle size of tailings gradually decreases and the percentage of powder particle content increases from the tailing pond release position to the downstream position. The original average moisture content of the experimentally measured specimen is 12%, due to the limitation of the sampling depth, the measured moisture content is small compared with the actual value, so this paper selects the effect of particle size on tailing strength under the condition of 15% moisture content.
According to Table 2, with the increase in the distance from the discharge port, the effective particle size d10, the average particle size d50 and the restricted particle size d60 all show a decreasing trend, indicating that the further away from the discharge port the smaller the particle size is; the upper particle size of measurement line 2 is generally larger than the lower particle size, and the discharged tailings are continuously deposited with the growth of time, and the fine particles continuously penetrate the lower layer, explaining the reason for the stratification phenomenon; Cu and Cc are quantitative indexes used to describe particle gradation, which represent the coefficient of uniformity and the coefficient of curvature, respectively. The results of particle analysis at different sampling points show that the Cu is about 3.765 and Cc is about 0.932. When Cu ≥ 5, 1 ≤ Cc ≤ 3 is satisfied at the same time, the tailing grading is good. As can be seen from the table, the grading is generally poor.
Table 2.
Classification parameters of tailings.
2.4. SEM Scanning
According to the particle size, sand grains are classified as: coarse sand grains (0.5~2 mm), medium sand grains (0.25~0.5 mm), fine sand grains (0.075~0.25 mm) and powder sand grains (0.0625~0.0039 mm) [17]. To investigate the fine-view characteristics of the tailing sand material, dry sand grains in different grain size states were glued on insulated double-sided tape for SEM analysis, and Figure 4 shows the SEM samples.
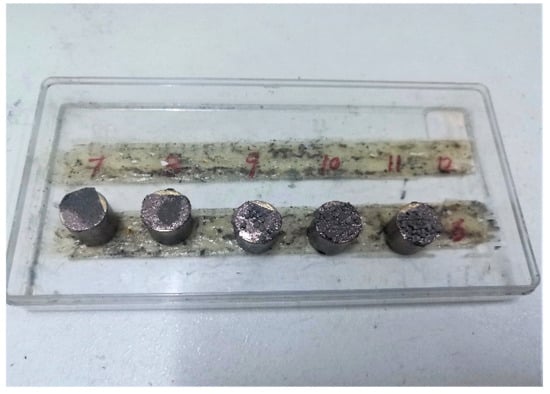
Figure 4.
SEM scan samples.
Figure 5, Figure 6 and Figure 7 show the SEM results of different particle size ranges, from the figure shows that the surface of powder particles presents a large number of crumbly and plate-like structures, the particles are closely spaced and do not show obvious pores; the plate structure on the surface of fine particles is obviously reduced, the sense of granularity is obvious, under the condition of magnification 2000 times, the particle nodules and a small number of pores can be clearly observed; coarse particles mainly consist of granular structures, the distribution is more uniform, with few adhesion phenomena and more pores on the particle surface. According to the difference in discharge effect, there is a large amount of quartz component in the powder particles, while the iron content is more in the fine and coarse particles. In the particle scan results of tailings sand, there are few sticky particles, while with the decrease in particle size, the platelet and flake structures on the surface of the particles increase, and these structures are more likely to be damaged under load, which is also not conducive to the improvement of the tailing strength.
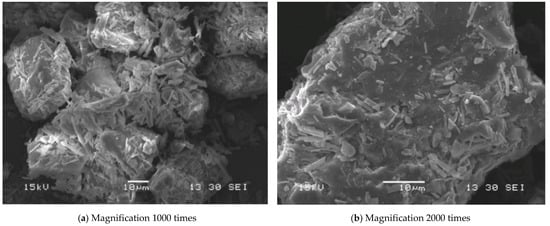
Figure 5.
Powder particle scan results.
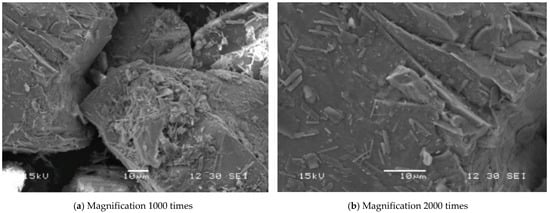
Figure 6.
Fine particle scan results.
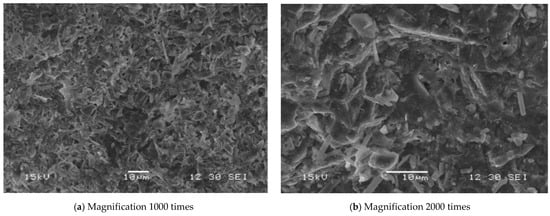
Figure 7.
Coarse particle scan results.
3. Mechanical Characterization of Tailing Sand
3.1. Test Instrument and Scheme
3.1.1. Test Instrument
This test adopts the Geosmartlab automatic triaxial instrument for consolidation non-drainage test and penetration test. The triaxial instrument mainly includes: pressure chamber, back pressure volume controller, surrounding pressure volume controller, load frame, pore water pressure measurement system, eight-channel data acquisition instrument and sample-making tools, etc. The physical diagram of the automatic triaxial is shown in Figure 8:
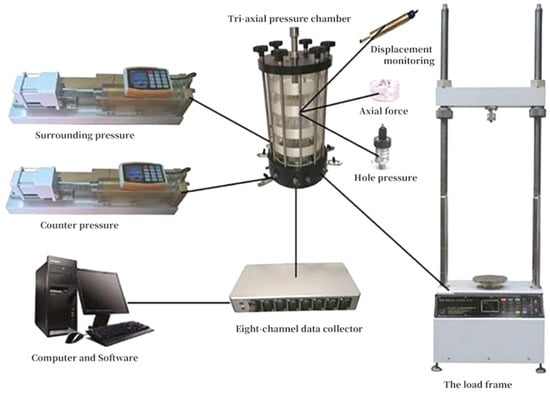
Figure 8.
Physical picture of a fully automatic triaxial instrument.
3.1.2. Experimental Scheme
In order to consider the influence of particle size on the shear strength, firstly, the sample is divided into the tailings sand in the range of less than 0.075 mm, 0.075~0.1 mm, 0.1~0.25 mm, 0.25~0.5 mm and 0.5~1 mm by the dry sieving method, and calculate the wet density of sand using the method of dividing the wet soil mass by the ring knife volume, and then the formula is used:
where is the dry density, is the wet density and w is the water content. The dry density of the sample was calculated. In the moisture content test the moisture content is w = 15%, in order to reach the dry density = 1.68 g/cm3; using Formula (2), the wet density of the specimen can be calculated = 1.932 g/cm3, and the wet density is calculated using the method of dividing the wet soil mass m by the ring knife volume v; where the ring knife volume v = 200 cm3 used in the triaxial test, it can be derived that the wet soil mass m = 386.4 g, so only the mass of wet soil needs to be controlled to reach the dry density. The physical parameters of the specimens before the saturation test are shown in Table 3. The sample saturation of the triaxial test is firstly saturated with CO2 gas, then saturated with water head and finally, saturated with back pressure. The three methods are combined to achieve the saturation of the sample. After saturation, the B-value is tested to ensure that the B-value is greater than 0.95.
Table 3.
Parameters before a single particle size saturation test.
Secondly, the mechanical properties of tailings are largely influenced by the particles, and the relationship between shear strength and grading parameters was studied by adjusting the mass percentages of different grain size groups to formulate different gradations. The good or bad grain gradation was judged by two parameters, the coefficient of unevenness and the coefficient of curvature. When considering the effect of grade variation, there are two cases: keeping the coefficient of curvature constant and changing the uniformity coefficient; keeping the uniformity coefficient constant and changing the coefficient of curvature. The main material parameters are shown in Table 4.
Table 4.
Parameters before the grading test.
3.2. Theoretical Basis of Sand Shear Strength
Shear strength, also known as shear strength, refers to the ultimate strength of materials in the process of shearing. It can reflect the ability of materials to resist shear sliding. The shear strength of sandy soils can be divided into two parts: one is the friction due to the normal stress between particles, and the other is the cohesion, which is independent of the normal stress. When the shear force under the action of external force exceeds the shear strength of sand, it will cause damage to the structure, and even cause serious collapse. The shear strength can be calculated from the cohesion C and the internal friction angle of the material according to the Mohr–Coulomb theory as follows:
τ f = c + σ tan ϕ
The main factors affecting the shear strength are the mineral composition of sand soil, particle shape and grading, density, moisture content and the stress state, and its damage is summarized as the following five destruction types (shown in Figure 9): strong hardening type and weak hardening type, strong softening type and weak softening type and ideal plasticity model [18,19]. The abscissa represents strain, and the ordinate indicates stress.
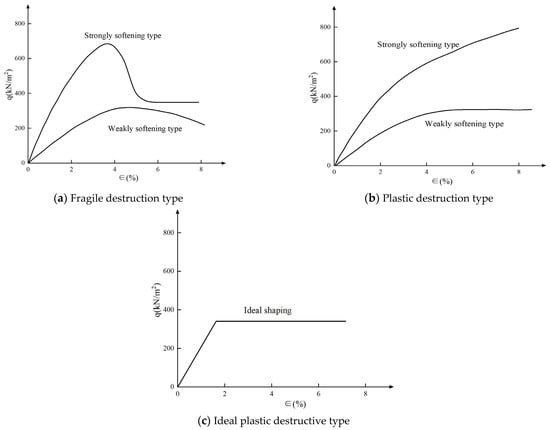
Figure 9.
Schematic diagram of the stress and strain curve type.
3.3. Effect of Particle Size on Consolidation Undrained Shear Test
The different sizes of the grain groups can make a big difference to the strength of the soil. In this section of the test, specimens under the same conditions are made at least five different grain groups (<0.075 mm, 0.075~0.1 mm, 0.1~0.25 mm, 0.25~0.5 mm, 0.5~1 mm) for triaxial shear tests. The extracted tailing sand was dried and sieved to prepare triaxial specimens, which were pumped and saturated for consolidation undrained triaxial tests, and the test data and results were compiled and analyzed to derive the stress–strain relationship curves under different grain groups. The specific results are shown in Figure 10.
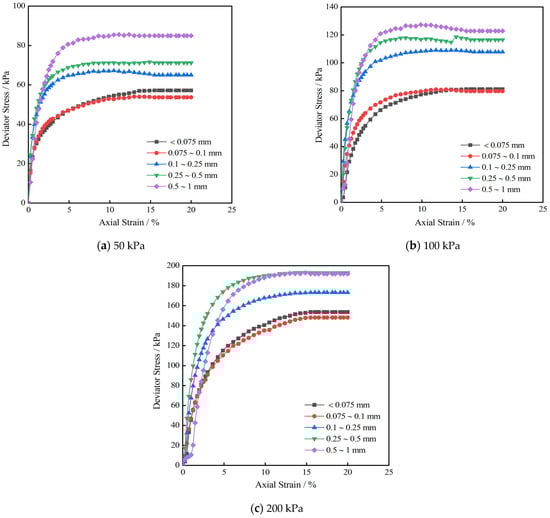
Figure 10.
Stress–strain curve.(under different grain groups).
From the experimental results, it is concluded that:
(1) The peak partial stress of the sample increased with the particle size at 50 kPa and 100 kPa circumference pressures. Coarse-grained specimens have a greater internal occlusion so that the overall strength is high for large-grained samples and a significant increase in strain occurs at the initial stage of the test.
(2) Under the same grain group condition, the stress–strain showed a monotonic increasing trend in the initial stage of the test, and the stress appeared to be the maximum value when the strain increased to a certain value. As the test proceeds, the strain continues to increase. At this stage, the partial stress remains constant or gradually decreases to a certain value and then remains constant, so most of the specimens are weakly hardened or weakly softened.
(3) The stress–strain curves of the specimens of each grain group differed greatly when the Confining pressure was low (50 kPa, 100 kPa). That is, when the enclosing pressure is the same and the strain is the same, the difference in the shear-generated partial stresses of specimens from different grain groups is larger, and the difference is more obvious at 50 kPa than at 100 kPa. The difference in the values of the deflective stresses of the specimens from different grain groups was smaller at higher envelope pressures (200 kPa) and the same strains. This is because the pore volume inside the specimen is squeezed at high envelope pressure, so the difference between them is not significant, although the partial stress of the specimen increases with increasing grain size.
With the axial stress σ as the horizontal coordinate and the shear stress τ as the vertical coordinate, the total stress circle of damage is drawn in the horizontal coordinate with (σ1 + σ3)/2 as the center and (σ1 − σ3)/2 as the radius, and the tangent line of the stress circle. The stress Mohr circle strength envelope is made. The inclination angle of this envelope is the internal friction angle φ, and the intercept with the vertical coordinate is the cohesive force c, as Figure 11.
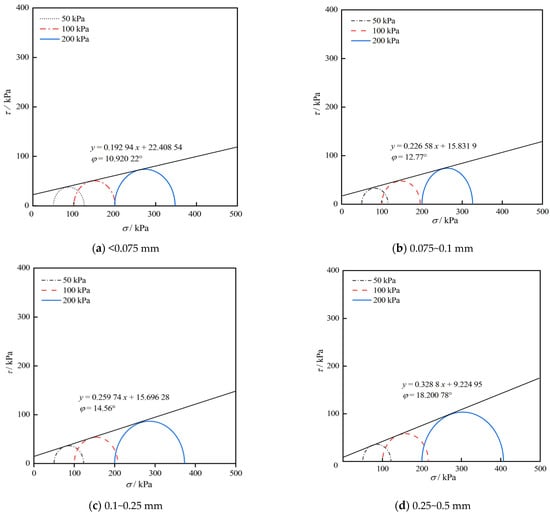
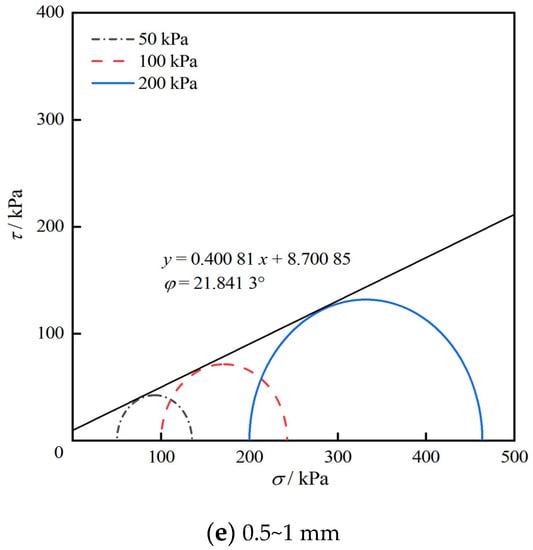
Figure 11.
Stressed Mohr circle.
Based on the inclination and slope of each intensity envelope, the intensity parameter values for the above five different particle sizes are obtained, as shown in Figure 12. The left axis represents the cohesion, the right axis represents the internal friction Angle, and the horizontal axis represents the particle size range.
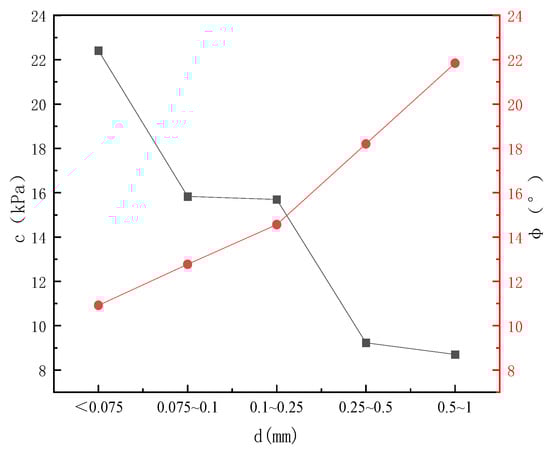
Figure 12.
Plot of cohesion and internal friction angle and particle size.
What can be obtained from the test results is: In the triaxial test, the cohesive force c tends to decrease as the particle size increases, while the internal friction angle φ tends to increase, indicating that the strength of the specimen increases as the particle size increases.
3.4. Effect of Cc on Consolidation Undrained Test
Figure 13 shows the stress–strain relationship graphs for different gradations of the consolidation undrainage test. The control Cu is 5.5, and the Cc increases from 1 to 3 step by step. From the figure, it can be seen that:
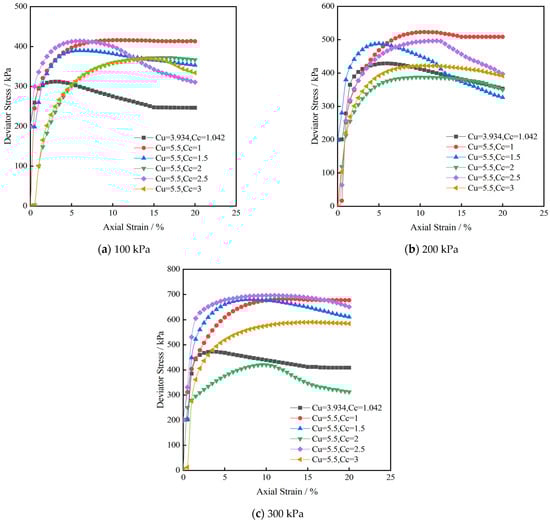
Figure 13.
Stress–strain curves of tailings sand corresponding to different Cc.
The originally graded tailings show weakly softening type damage under different circumferential pressures. After ratio calculation and test analysis, when Cu = 5.5, Cc = 1, the specimens can withstand the shear strength under 100 kPa~200 kPa circumferential pressure to the maximum extent, and the maximum partial stresses that can be achieved are 416.183 kPa and 523.035 kPa, respectively. When the confining pressure increases to 300 kPa, the specimens with grading parameters Cu = 5.5 and Cc = 2.5 present better shear strength. The maximum partial stress reached is 695.912 kPa. With the change in the coefficient of curvature, the deflective stress changes abruptly at the coefficient of curvature of 2.5. When the confining pressure is at 100 kPa, 200 kPa and 300 kPa, the peak deflective stresses are 413.917 kPa, 496.728 kPa and 695.912 kPa, respectively. the residual strengths at the end of the shear are 310.548 kPa, 397.247 kPa and 651.116 kPa, respectively.
When the confining pressure is 100 kPa, the original graded sand sample is weakly softening type damage; when Cc = 1 and Cc = 2, the sand sample is weakly hardening type damage; when Cc = 1.5 and Cc = 3, the sand sample is weakly softening type damage; when Cc = 2.5, the sand sample is strongly softening type damage. When the confining pressure is 200 kPa, the original graded sand sample has weakly softening-type damage; when Cc = 1, the sand sample has weakly hardening-type damage; when Cc = 2 and Cc = 3, the sand sample has weakly softening-type damage; when Cc = 1.5 and Cc = 2.5, the sand sample has strongly softening-type damage. When the confining pressure is 200 kPa, the original graded sand sample has weakly softening-type damage; when Cc = 1, Cc = 2.5 and Cc = 3, the sand sample has weakly hardening-type damage; when Cc = 1.5, the sand sample has weakly softening-type damage; when Cc = 2, the sand sample has strongly softening-type damage.
The above results reveal the stress–strain relationship of tailing sand under the confining pressures of 100 kPa, 200 kPa and 300 kPa, respectively when the inhomogeneity coefficient is 5.5 and the curvature coefficient is 1–3. It is found that when the confining pressure is 100 kpa, the maximum deviatoric stress that the sand sample can bear decreases when Cc increases from 1 to 2. When Cc is from 2 to 2.5, the maximum deviatoric stress it can bear increases, and the maximum deviatoric stress it can bear decreases as Cc continues to increase. When Cc = 2.5, the maximum deviatoric stress that can be borne is the largest, which is higher than that of the original graded sand sample. Confining pressure 200 kPa shear, and 100 kPa when the trend is basically the same; when Cc = 1, the maximum deviatoric stress can be borne is the largest, which is higher than that of the original graded sand sample. When the confining pressure is 300 kPa, the shear strength is good when Cc = 2.5, and the maximum deviatoric stress it can withstand is significantly higher than that of the original graded sand sample except for the Cc value between 1.5 and 2.5. Previous tests have shown that with the increase in curvature coefficient, the gradation of tailing sand becomes better [20], and no matter whether Cc is too large or too small, it indicates that there is a lack of intermediate particles in the soil [21], which is not conducive to the improvement of shear strength. Therefore, changing the curvature coefficient has a certain effect on the improvement of shear strength.
3.5. Effect of Cu on Consolidation Undrained Test
Figure 14 shows the stress–strain relationship graphs for different gradations of the consolidation undrainage test. The control Cc is 2, and the Cu increases from 5 to 7 step by step. From the figure, it can be seen that:
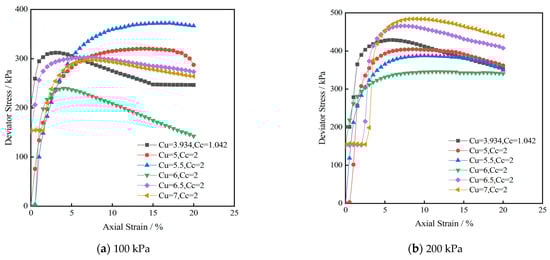
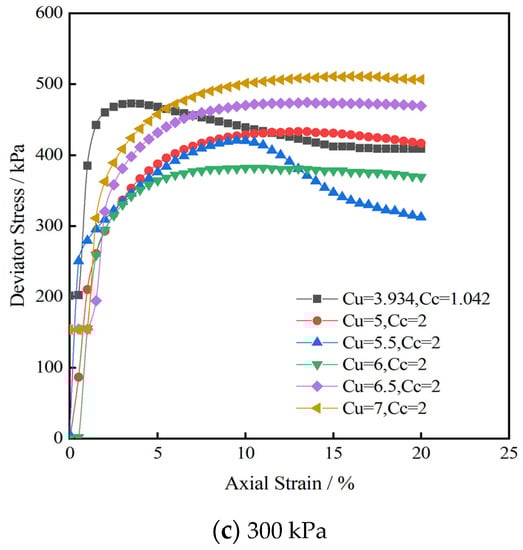
Figure 14.
Stress–strain curves of tailings sand corresponding to different Cu.
After the test analysis, when Cu = 5.5 and Cc = 2, the specimen can withstand the shear strength under 100 kPa circumferential pressure to the maximum extent. The maximum partial stress that can be achieved is 366.801 kPa. When the confining pressure increases to 200–300 kPa, the specimens with grading parameters Cu = 7, and Cc = 2 present better shear strength. The maximum partial stresses are 484.154 kPa and 510.817 kPa.
When the confining pressure is 100 kPa, the original graded sand sample has weakly softening-type damage. When Cu = 5 and Cu = 5.5, the sand sample has weakly hardening-type damage. When Cu = 6, Cu = 6.5 and Cu = 7, the sand sample has weakly softening-type damage. When the confining pressure is 200 kPa, the original graded sand sample showed weak softening-type damage. When Cu = 6, the sand sample showed weak hardening-type damage. When Cu = 5, Cu = 5.5, Cu = 6.5 and Cu = 7, the sand sample showed weak softening-type damage. When the confining pressure is 300 kPa, the original graded sand sample showed weak softening-type damage. When Cu = 5, Cu = 6, Cu = 6.5, and Cu = 7, the sand sample is weakly hardened. When Cu = 5.5, the sand sample is strongly softened.
The results show that when the confining pressure is 100 kPa and the Cu increases from 5 to 5.5, the maximum deviatoric stress that the sand sample can withstand increases obviously. A sudden change occurs when Cu = 6, and the maximum deviatoric stress can be sustained by the sand gradually decreases with the increase in Cu value. When Cu = 5.5, the maximum deviatoric stress of the sand sample is higher than that of the original graded sand sample. When the confining pressure is 200 kPa, when the Cu increases from 5 to 6, the maximum deviatoric stress that the sand sample can bear decreases obviously. When Cu = 6.5, the maximum deviatoric stress that sand samples can bear is higher than that of the original graded sand samples, and the shear strength is better when Cu = 7. Previous experimental results show that the larger the non-uniformity coefficient is, the wider the distribution range of particle size and the more non-uniformity of soil particles [21], which further indicates that under high confining pressure, the greater the non-uniformity coefficient of tailing sand is within a certain range, and it has better shear strength.
3.6. Comparison of Shear Strength of Tailing Sand with Different Gradations
Stress σ is taken as the horizontal coordinate, shear stress τ is taken as the ordinate, on the horizontal coordinate (σ1 + σ3)/2 as the center of the circle, (σ1 − σ3)/2 as the radius to draw the stress Mohr circle, and make the common tangent line of each stress circle, namely the strength envelope of the stress circle. The dip Angle of the envelope is the internal friction Angle φ, and the intercept between the envelope and the ordinate is the cohesion c, as shown in the figure below:
Figure 15 shows the stress Mohr circle and strength envelope for Cu = 5.5, and Cc = 1.5 conditions. This yields a cohesive force of 51.78 kPa and an internal friction angle of 36.4° for the sheared specimen at this grade. The other grades were plotted in the same way, and the strength envelopes of the different grades are shown in Figure 16.
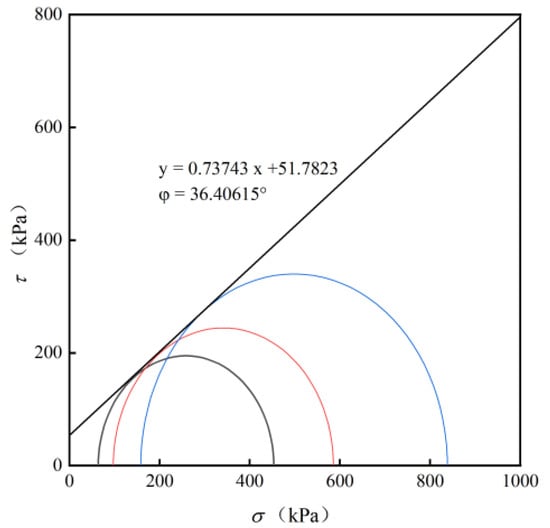
Figure 15.
Stress Mohr circle and intensity envelope at Cu = 5.5 and Cc = 1.5.
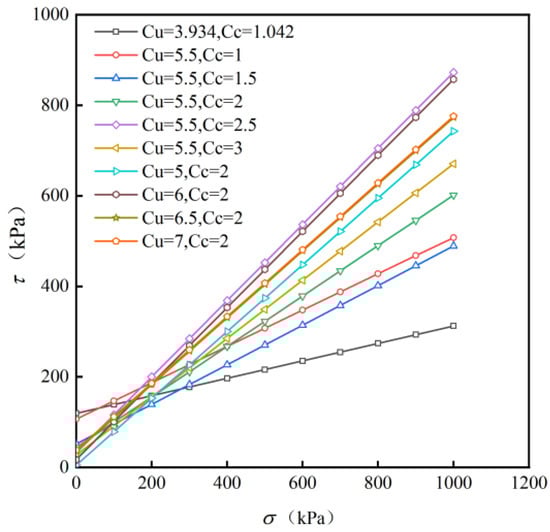
Figure 16.
Strength envelopes of different gradations.
According to the shear strength calculation formula, we can get:
- (1)
- The shear strength of the sand sample with original gradation and Cu = 5.5, Cc = 1 is the highest when the effective confining pressure is from 0 to 100 kPa. The sand sample with Cu = 5 and Cc = 2 has the lowest shear strength.
- (2)
- The shear strength of the sand sample with Cu = 5.5, and Cc = 1 is the highest when the effective confining pressure is from 100 to 200 kPa. The sand sample with Cu = 5 and Cc = 2 has the lowest shear strength.
- (3)
- The shear strength of the sand sample with Cu = 5.5 and Cc = 2.5 is the highest when the effective confining pressure is from 100 to 200 kPa. The sand sample with Cu = 5.5 and Cc = 1.5 has the lowest shear strength.
- (4)
- The shear strength of the sand sample with Cu = 5.5 and Cc = 2.5 is the highest when the effective confining pressure is from 100 to 200 kPa. The sand sample with original gradation has the lowest shear strength.
3.7. Effect of Confining Pressure on Consolidation Undrained Test
The consolidation undrained tests were carried out on different graded specimens at 100 kPa, 200 kPa and 300 kPa confining pressure, respectively. The stress–strain relationships were obtained as follows.
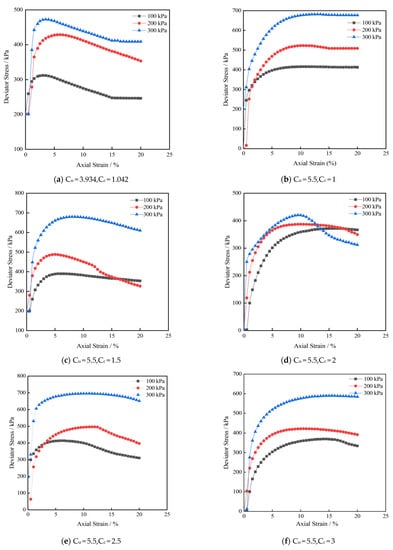
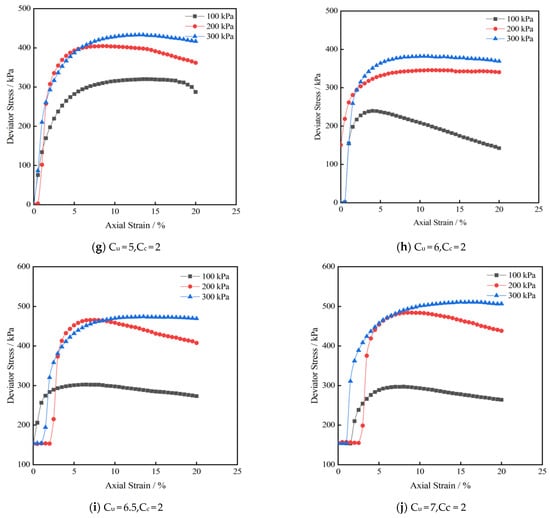
Figure 17.
Stress–strain curve.
Table 5.
Strength record table under different test conditions.
- (1)
- Under the action of circumferential pressure, the stress tends to increase with strain at the beginning of the specimen, and the initial growth rate is rapid.
- (2)
- When the deviator stress reaches its peak, it will no longer change or gradually decrease and remain constant with the continuous increase in strain.
- (3)
- Under the same density and gradation conditions, when the confining pressure increases, the deviatoric stress also increases. This is since the pore volume compression is not significant under low confining pressure and the microstructure changes are not significant, which has less effect on the compactness of the sand grains. However, under high-enclosure-pressure conditions, the compression of the pore volume is significant, resulting in large changes in the microstructure of the sand grains, which are more compactly arranged and have a more solid skeleton, and the tensile capacity and shear strength against external deformation is greatly enhanced.
- (4)
- By comparison, it was found that the greater the applied confining pressure, the greater the residual strength of the specimens. When Cu = 5.5, Cc = 1.5 and the confining pressure is 100 kPa and 200 kPa, the residual strength of the specimen is 353.173 kPa and 326.664 kPa. At this time, the sand sample is weakly hardened under 100 kPa confining pressure and weakly softened under 200 kPa confining pressure. When Cu = 5.5, Cc = 2 and the confining pressure is 100 kPa, 200 kPa, 300 kPa, the residual strength of the specimen is 366.801 kPa, 349.838 kPa, 312.384 kPa. At this time, the sand sample is a strongly softening type.
3.8. Results of Tailings Sand Penetration Test
Combined with the mechanical properties of tailings under different particle size and gradation conditions, the samples with particle gradation parameters Cu = 3.934, Cc = 1.042, Cu = 5.5, Cc = 1 and Cu = 5.5, Cc = 2.5 were selected as the penetration test research object. Using a triaxial system and an osmotic pressure chamber, the constant head module was used to conduct permeability tests on the samples with the above three gradations, and their permeability coefficients were calculated. The phenomenon and law of seepage failure of the sample were analyzed during the seepage process.
3.8.1. Gradation of Tailings Sand
According to the above study, three grades with higher shear strength were selected as the sample preparation requirements for the percolation specimens. The gradation curves of this tailing sand are shown in Figure 18.
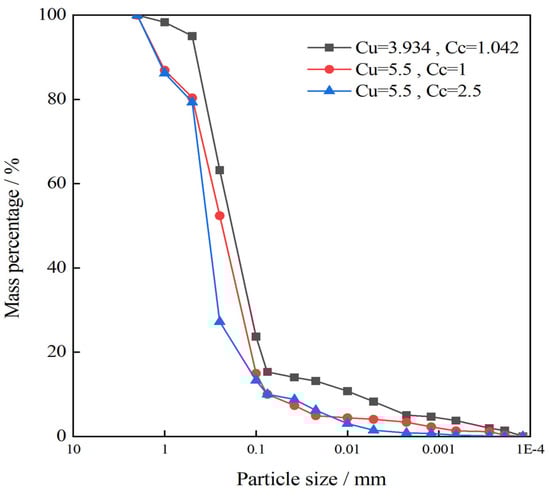
Figure 18.
Grading curves of tailing sand.
3.8.2. Test Method
According to the geotechnical test specifications, the ring knife sample with dry density ρ = 1.68 g/cm3 was prepared and put into the three-axis osmometer after saturation, testing the seepage through linear saturation, B-value detection, consolidation and normal head infiltration in the Geosmart infiltration module.
- (1)
- Linear saturation and B-value detection module
By setting effective axial pressure and back pressure, the ring cutter sample was saturated step by step. This test adopted seven stages of saturation. The loading scheme is shown in the table. After the saturation is completed, the B-value test is carried out, which is used to test whether the saturation is complete. When the B-value reaches 0.95 or above, the sample is considered to be completely saturated, and the next test can be carried out. Otherwise, continue to apply effective axial pressure and back pressure to further saturate the sample.
- (2)
- Consolidation module
The effective consolidation stress was achieved by applying effective axial pressure while the back pressure remained unchanged. In this test, 100 kPa effective consolidation stress was applied to observe the end of consolidation when the axial displacement did not change.
- (3)
- Seepage module
The method of constant head seepage was adopted, and the osmotic pressure was set at 30 kPa. The change in the law of back pressure volume and bottom pressure volume was observed, and the flow rate Q was calculated.
3.8.3. Analysis of Results
Permeate specimens of the three graded tailing grains of sand were prepared according to the specification and placed in the triaxial permeation test system. The pressurization and percolation operations were carried out. Figure 19 shows the triaxial permeation loading frame and permeation pressure chamber. Figure 20 shows the morphology of each specimen after the end of the permeation test.
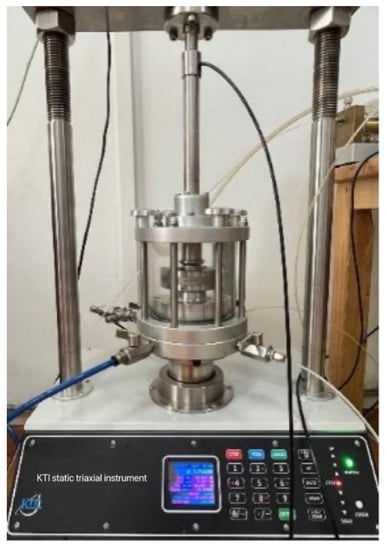
Figure 19.
Triaxial Penetration System.
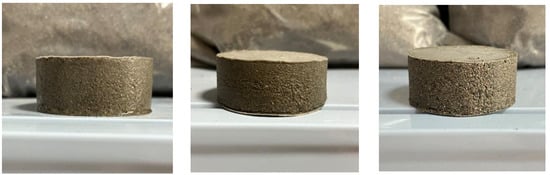
Figure 20.
Morphology of the specimen after damage.
The specimens of different grades showed different morphology: Cu = 3.934, Cc = 1.042, no obvious damage and defect occurred on the surface of the specimen; Cu = 5.5, Cc = 1, observed from the bottom of the sample, it was found that the bottom was damaged; Cu = 5.5, Cc = 2.5, it was found that damage marks appeared in the middle and bottom of the sample.
To quantify the influence law of permeability coefficients for different grade pairs, Figure 21 shows the curves of seepage volume versus time for specimens under the conditions of 100 kPa consolidation of effective axial pressure and 30 kPa permeability pressure.
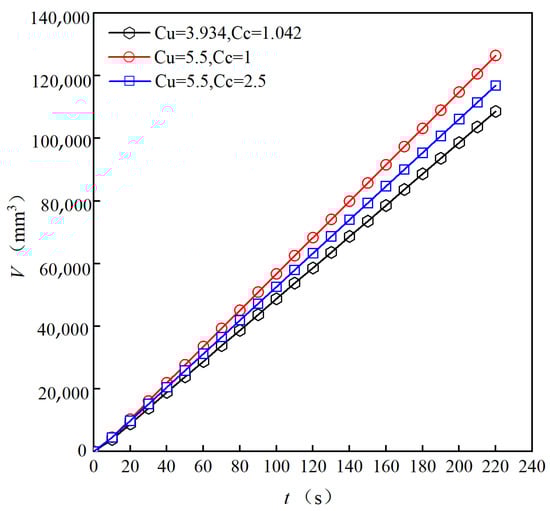
Figure 21.
Seepage characteristics curves of tailing sand.
In Darcy’s seepage theory, the amount of seepage per unit of time through the area is proportional to the difference in head upstream and downstream, and inversely proportional to the length of the seepage sample. The calculation equation is as follows.
In the formula: Q—Seepage flow/(mm3/s)
A—Fracture area of the specimen/cm2
K—Hydraulic conductivity/(cm/s)
Δh—Delivery head/cm
L—The distance of penetration/cm
i—Hydraulic gradient
This can be seen in Figure 21 and Table 6, it can be found that the percolation volume of tailing sand shows a good linear relationship with time. Its percolation law is consistent with Darcy’s law. Under the action of permeation pressure of 30 kPa, the flow rate of the bottom pressure and back pressure is very consistent. Because of the good mechanical properties of the three gradations, the fine particles fill the pores between the coarse particles obviously, so the numerical difference is not obvious. The permeability coefficient of the specimen was further calculated by the flow rate of the bottom pressure. When Cu is 5.5 and Cc is 1, the permeability coefficient is 1.699 × 10⁻³ cm/s, and the tailing sand has good permeability.
Table 6.
Flow records of specimens with different gradations under the action of seepage.
4. Conclusions
Through the single particle size and different graded shear tests of tailings from 0.075~2 mm, the influence law of particle size and the tailing’s shear strength is obtained. In the state of Daxi seepage, the permeability coefficient of saturated tailings is finally obtained by changing the permeability coefficient of different graded test samples. The specific conclusions are as follows:
- (1)
- The moisture content of the taken test materials was tested, and the average moisture content of the taken tailings was 12%. The gradation analysis of the samples shows that the samples belong to tailings silt, and the gradation is poor. Through SEM scanning, it is found that there are some coarse grains in the samples, and the shear strength of the sand samples is different. With the decrease in particle size, the plate-like and flaky structures on the surface of particles increase, which are more likely to be damaged under load and are not conducive to the improvement of the shear strength of tailings.
- (2)
- Considering the influence of particle size on tailings shear strength, for five different particle groups (<0.075 mm, 0.075~0.1 mm, 0.1~0.25 mm, 0.25~0.5 mm, 0.5~1 mm) under the same conditions, the stress Moore circle strength envelope drawn by the triaxial test found that with the increase in particle size, the internal friction Angle φ was increasing, indicating that the sample strength was increasing with the increase in particle size.
- (3)
- By using the method of variable uniqueness, the gradation parameters Cu and Cc are controlled to be unchanged, respectively, and the other parameter is changed. When Cu = 5.5, the maximum deviator stress of the sample shows a decreasing trend with the increase in Cc, and when Cc = 2.5, the maximum deviator stress of the sample shows a sudden increase trend, and then gradually decreases. When Cc = 2, the maximum deviatoric stress of the specimen decreases with the increase in Cu, when Cu = 6.5, the deviatoric stress changes obviously and when Cu > 6.5, the deviator stress increases gradually.
- (4)
- By drawing the stress Mohr circle and the strength envelope, the shear strength, cohesion and internal friction angle of each gradation are obtained. When the confining pressure is less than 100 kPa, the shear strength of the original gradation sample is the best. When the confining pressure is between 100 kPa and 200 kPa, the sample with grading parameters Cu = 5.5 and Cc = 1 has the best shear strength. When the confining pressure is between 200 kPa and 300 kPa, the shear strength of the sample with grading parameters Cu = 5.5 and Cc = 2.5 is the best.
- (5)
- Through the seepage test, whether the above samples with better strength have better permeability is calculated, and the calculation results show that when Cu is 5.5 and Cc is 1, the permeability coefficient is 1.699 × 10⁻³ cm/s, and the shear strength and permeability of the sample are the best, which has reference significance for practical engineering.
Author Contributions
Data curation, J.L.; Formal analysis, Y.S.; Methodology, Y.S.; Resources, X.C.; Visualization, Y.X.; Writing—original draft, Y.S.; Writing—review and editing, H.L. All authors have read and agreed to the published version of the manuscript.
Funding
The authors of this study are grateful for the funding support from the Special Fund Project for Production Safety of Hubei Province, China (SJZX20211004 and (2020) No. 12).
Institutional Review Board Statement
Not applicable.
Informed Consent Statement
Not applicable.
Data Availability Statement
The data used to support the findings of this study are available from the corresponding author upon request.
Conflicts of Interest
The authors declare no conflict of interest.
References
- Zhao, H.; Wang, G.; Xu, Z.; Tang, Y. Experimental study on the sedimentation characteristics of tailings pond dams under the influence of multiple factors. China Sci. Technol. Saf. Prod. 2018, 14, 95–101. [Google Scholar]
- Wang, F.; Zhang, Z. Stockpile characteristics of tailings sand and its shear strength characteristics. Geotech. Eng. Technol. 2003, 4, 209–212. [Google Scholar]
- Yang, Y.; Xu, J.; Yang, Y. Study on the effect of particle size on the shear strength of unsaturated tailings. J. Undergr. Space Eng. 2013, 9, 861–864. [Google Scholar]
- Xin, B.; Wan, L.; Zhao, H.; Tan, Q. Physical and mechanical properties testing of tailings sand and stability analysis of dam body. China Test. 2019, 45, 35–41. [Google Scholar]
- Li, X.; Chen, Y.; Yuan, L.; Peng, X. Experimental study on the influence of moisture content on tailings shear strength. Gold 2016, 37, 70–73. [Google Scholar]
- Zhu, R. Experimental Study on the Properties and Steady-State of Saturated Tungsten-Molybdenum Tailing Sand. Master’s Thesis, Jiangxi University of Technology, Ganzhou, China, 2018. [Google Scholar]
- Guo, X.; Chen, Z.; Shao, L.; Tian, X. Experimental study on the depositional characteristics and basic physical and mechanical properties of fine-grained iron tailings. J. Geotech. Eng. 2020, 42, 1220–1227. [Google Scholar]
- Li, Z.; Zhen, Z.; Zhan, M.; Wang, K.; Sheng, J.; Luo, Y.; He, S. Effect of tailings sediment consolidation on tailings slurry movement characteristics after dam break. Non-Ferr. Met. (Mine Part) 2020, 72, 111–118. [Google Scholar]
- Pu, X. Analysis of Tailings Sediment Characteristics on the Stability of Dam Body. Master’s Thesis, Kunming University of Science and Technology, Kunming, China, 2016. [Google Scholar]
- Zhang, C.; Ma, C.; Yang, C.; Chen, Q.; Pan, Z. Effect of grain size on shear strength of tailings and stability of dams. J. Geotech. Eng. 2019, 41 (Suppl. S1), 145–148. [Google Scholar]
- Hu, Z.; Guo, J.; Liang, Z.; Wang, K.; Feng, Z.; Chen, Z. Effect of viscous particle content on physical and mechanical properties of fine-grained tailings. J. Geotech. Eng. 2020, 42 (Suppl. S1), 16–21. [Google Scholar]
- Wang, L.; Bai, X.; Feng, J. Exploration of factors influencing the shear strength index of compacted loess-like fill. J. Geotech. Eng. 2010, 32 (Suppl. S2), 132–135. [Google Scholar]
- Ren, K.; Zheng, W.; Liu, P. Effect of viscous particle content on shear strength of silt soils. Sci. Technol. Eng. 2021, 21, 7286–7292. [Google Scholar]
- Chakraborty, D.; Choudhury, D. Investigation of the behavior of tailings earthen dam under seismic conditions. Am. J. Eng. Appl. Sci. 2009, 2, 559–564. [Google Scholar] [CrossRef]
- Wang, Y. Study on the Shear Strength Characteristics of High Stress-Saturated Tailings. Master’s Thesis, Jiangxi University of Science and Technology, Ganzhou, China, 2015. [Google Scholar]
- GB/T50123-2019Standard for Geotechnical Test Methods; Ministry of Water Resources of the People’s Republic of China: Beijing, China, 2019; pp. 122–123.
- Yang, Z.H. Research on the Shear Strength of Sandy Soils Based on Fractal Theory. Master’s Thesis, Northeast Forestry University, Harbin, China, 2020. [Google Scholar]
- YS/T5225-2016Geotechnical Test Procedures; Ministry of Industry and Information Technology: Beijing, China, 2016.
- Liu, G. Study on the Shear Failure Process Based on Full Surface Measurement. Ph.D. Thesis, Dalian University of Technology, Dalian, China, 2017. [Google Scholar]
- Li, Y. Study on the Mechanical Properties and Microstructure Test of Microbial Cured Calcium Sand Based on Particle Grading. Master’s Degree, Guangzhou University, Guangzhou, China, 2022. [Google Scholar]
- Yang, X.; Li, J.; Yang, Y.; Qi, J.; Li, K. Study on the grading characteristics and compaction characteristics of typical engineering dam building sand and gravel. Geotech. Mech. 2022, 43, 1607–1616. [Google Scholar]


Publisher’s Note: MDPI stays neutral with regard to jurisdictional claims in published maps and institutional affiliations. |
© 2022 by the authors. Licensee MDPI, Basel, Switzerland. This article is an open access article distributed under the terms and conditions of the Creative Commons Attribution (CC BY) license (https://creativecommons.org/licenses/by/4.0/).