3. Materials and Methods
3.1. Study Location
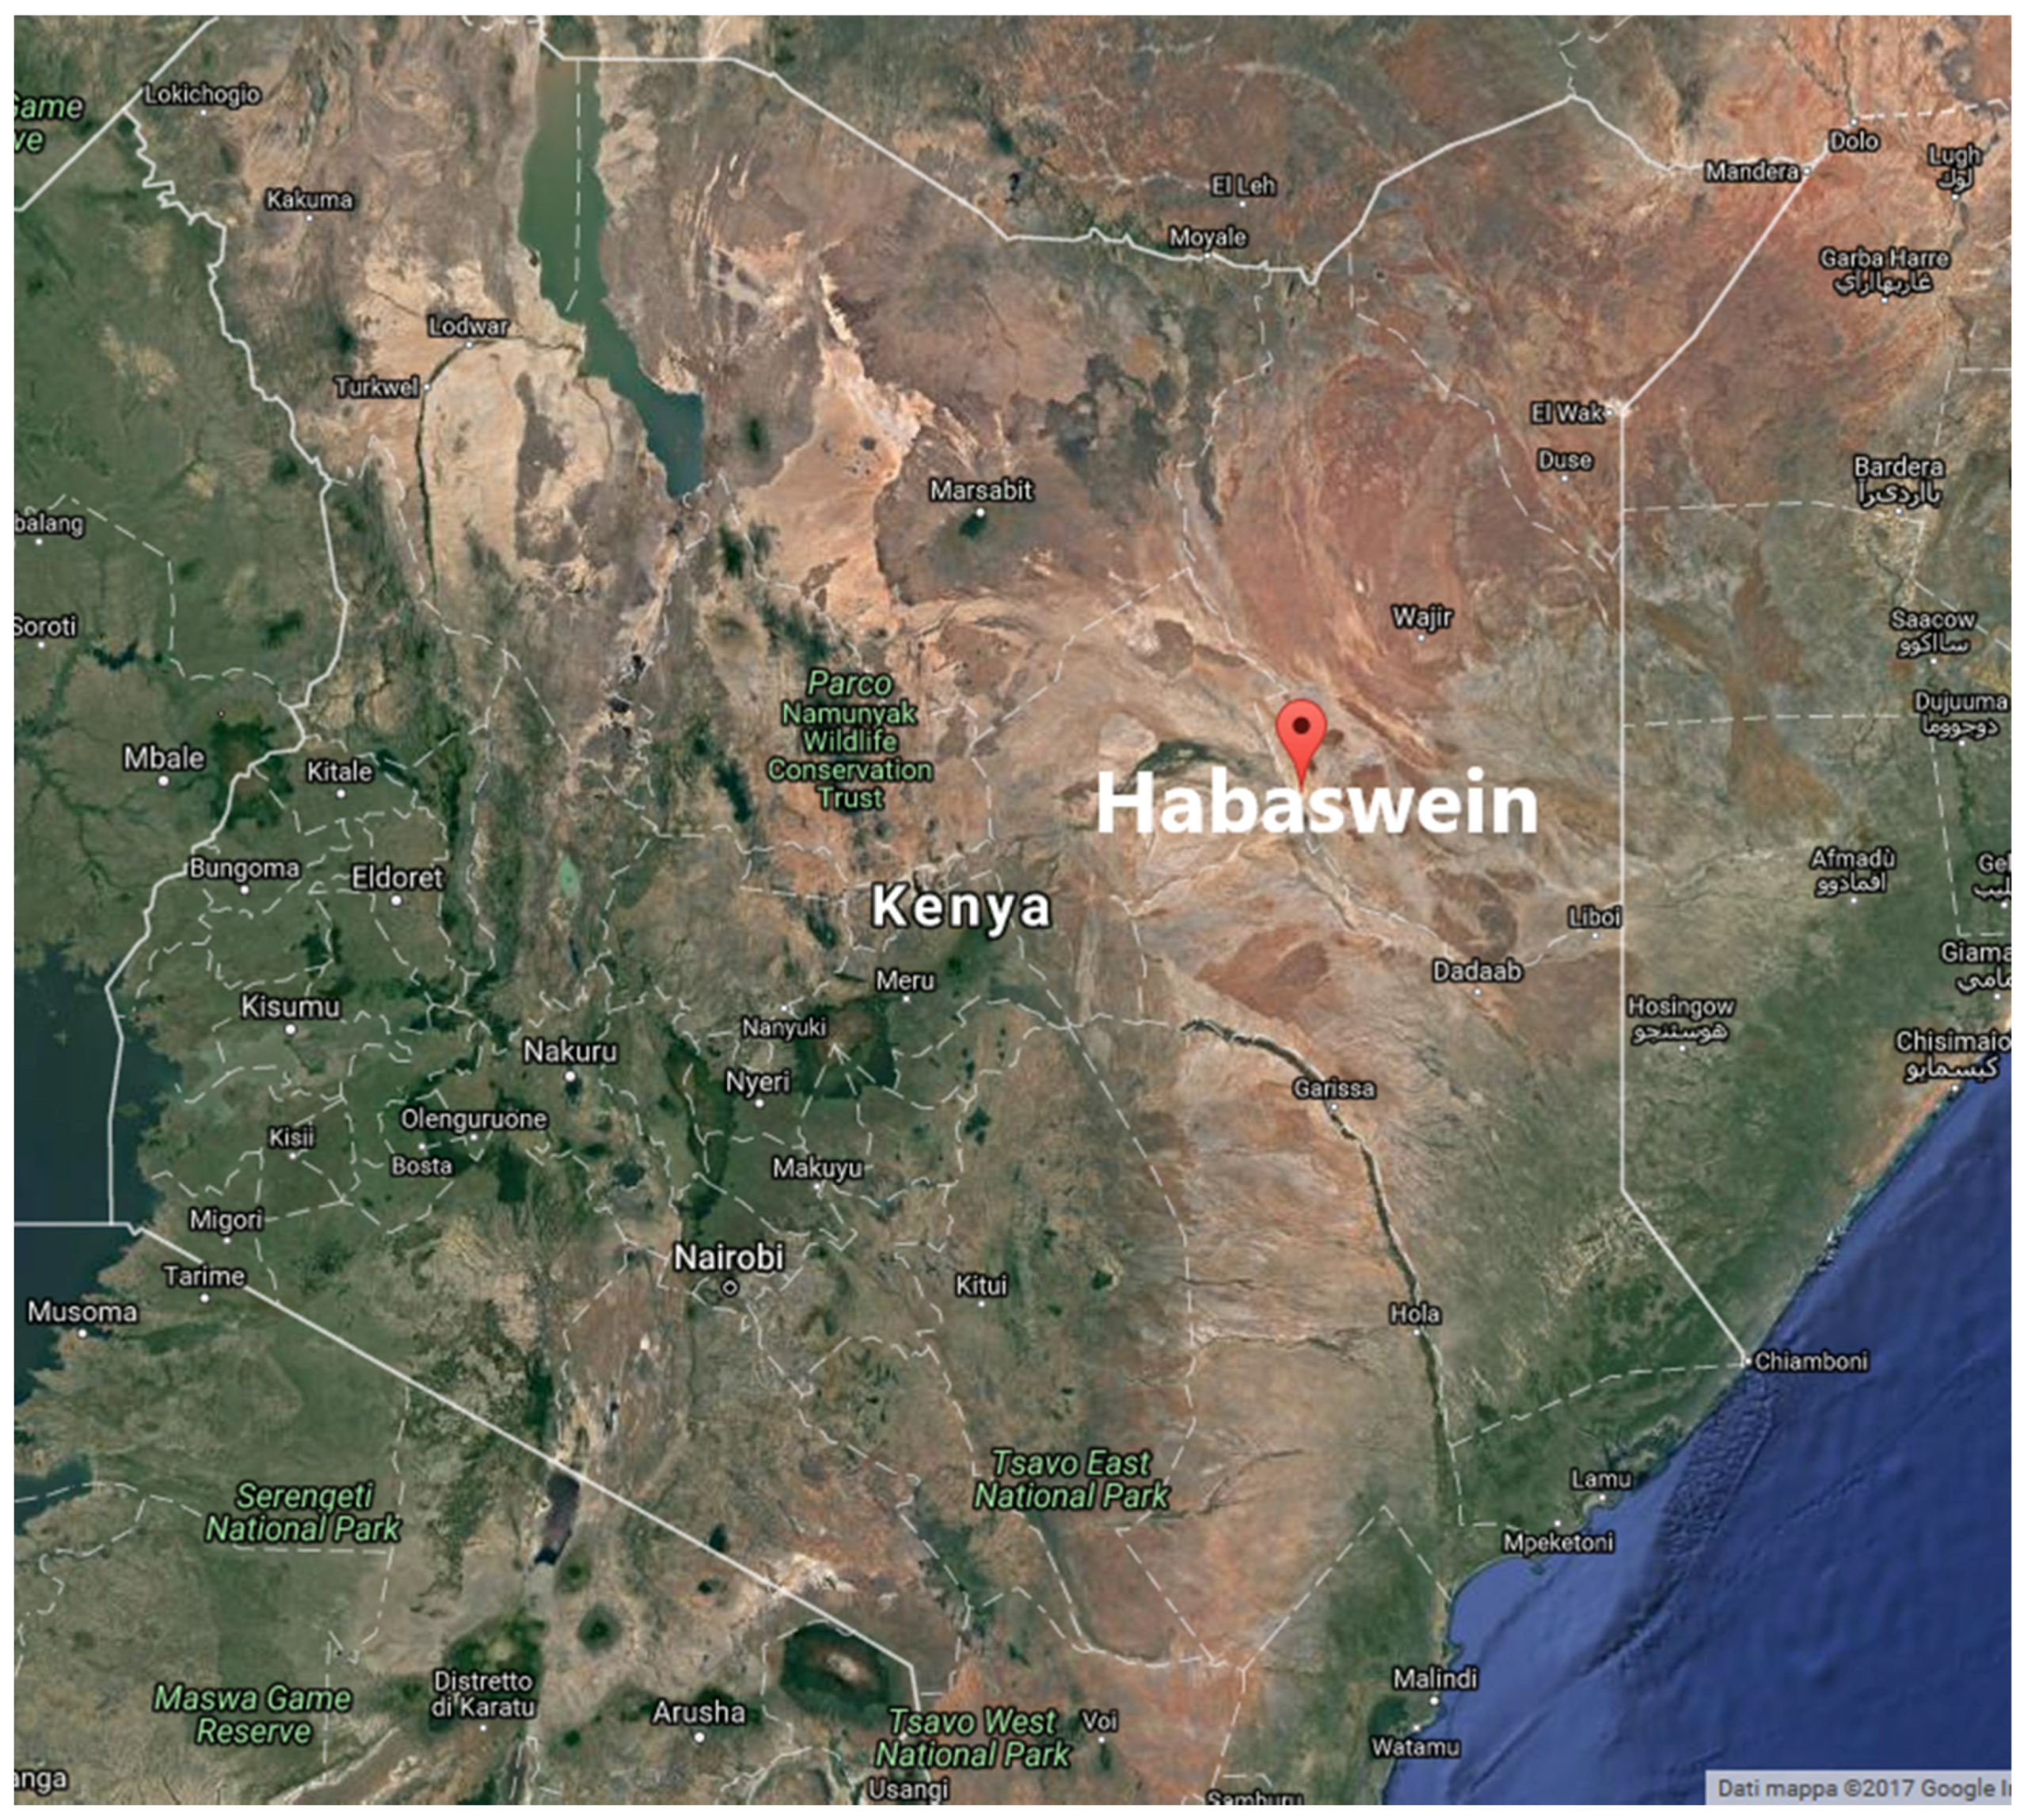
The study has been undertaken at Habaswein hybrid off grid power station situated in Kenya, its geographical coordinates are 1°0′33″ North, 39°29′17″ East. Habaswein is a settlement in Kenya’s northeastern region (
Figure 1), which is almost exclusively inhabited by ethnic Somalis. The name Habaswein literally means a lot of dust. The town falls under Wajir south constituency in Wajir County whose population was 138,000 in the 2009 census.
3.2. Data Collection
Raw primary data of the hybrid station performance for five years have been obtained from the Kenya Power and Lighting Company (KPLC) in regards to the energy generated by the diesel, wind and solar components, the fuel consumption, and the power loads.
3.3. Mini-Grid Technical Specification
The existing electricity generation is a diesel-based system. The system consists of one diesel generator with total capacity of 410 kW, a 30 kWp photovoltaic plant and a wind farm of three wind turbines of 20 kW each, all synchronized in the same bus bar. The system supplies electricity demand for nearly 365 days a year. A diesel generator was installed in 2010 and, due to serious problems, it was substituted in 2012 by a similar generator with the same power.
3.4. Data Analysis
3.4.1. Market Growth and Energy Production
In five years of operation of the mini-grid, the number of customers has almost tripled; in parallel with the number of customers with a growth from 700 customers to almost 1800.
In parallel there is also a growth of the requested load. The energy production growth rate is less than the customer’s growth probably because the new customers are domestic users, while the first customers were both domestic and productive users.
The increase of energy production is about 50% in four years. It can also be noticed that this production increment was realized exclusively through the diesel generator; Energy production through renewable sources remains marginal.
3.4.2. 2014—Yearly Analysis
The behavior of the Habaswein Hybrid mini-grid is presented in more detail by choosing a reference year (2014), and by carrying out a global annual, monthly and daily analysis. The year 2014 was chosen because there were fewer interruptions of the mini-grid operation.
Energy production has been realized almost entirely using Diesel generators. Only 5% of the electricity generation was produced using renewable energy sources.
Monthly energy production presents a limited variability over the year with an average energy value of 91,417 ± 7671 kWh with a total yearly production of 1,097,413 kWh. Referring to the mean value, the maximum and minimum of the energy production deviates by 10%.
Studying the typical behavior of the energy production during a day, can be noticed two peaks in the production, one towards the middle of the day and one evening.
3.4.3. Operational Costs
In 2014, the total amount of the operational cost was $578,681.82, including diesel supply, ordinary and extraordinary maintenance.
Table 1 shows the monthly operational data of 2014, from this data can be calculated the average energy cost of energy which is 0.46
$/kWh but there is a strong variation during the year with a maximum variation of 0.10
$/kWh, corresponding to 22% of the energy price.
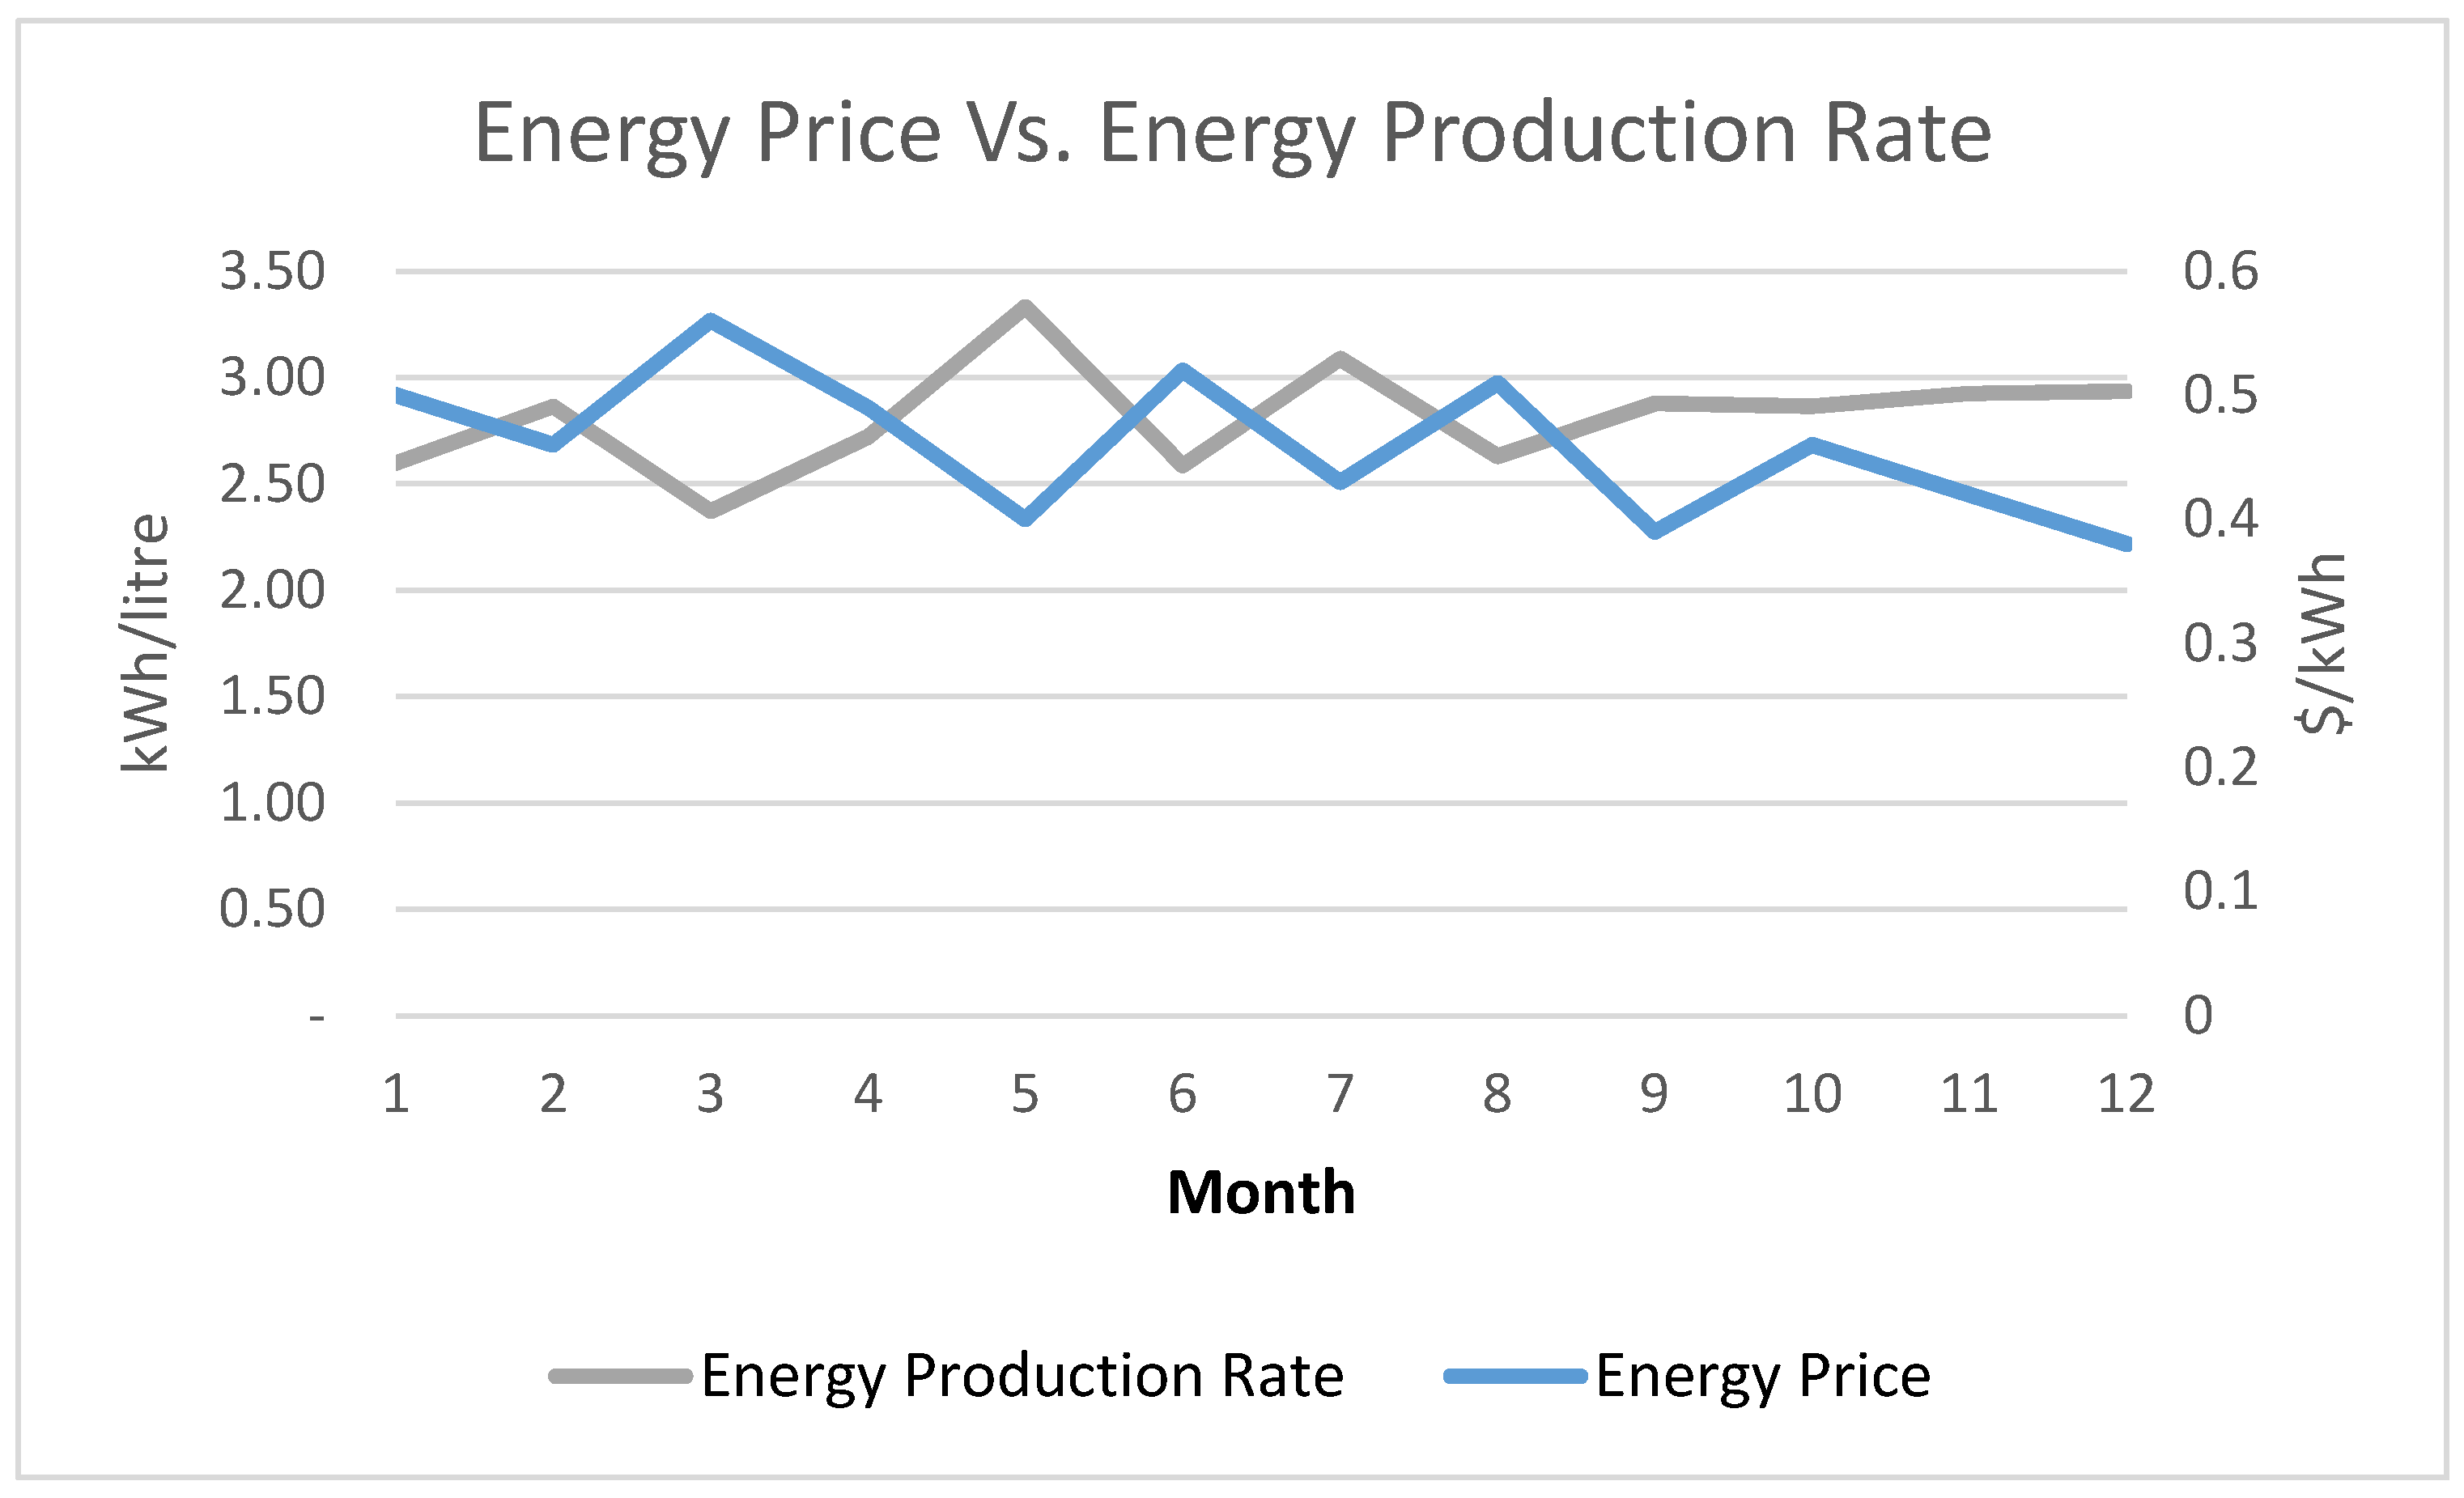
This important variation is due to the diesel price variability and to operation condition of the plant, the
Figure 2 compares the Energy production rate with the diesel generator efficiency, it is evident that the two curves have opposite trend, when the Energy production rate increases the energy cost decreases and vice-versa.
This shows how strong is the influence of the diesel generator on the variation of the operational cost of the mini-grid of Habaswein and how uncertainty there is around the energy cost variation.
3.5. Simulation and Optimization with HOMER PRO
HOMER software will be used to simulate and model different mix scenarios with the aim of establishing the optimal penetration levels of renewable energy. HOMER is a computer model that simplifies the task of evaluating design options for both off-grid and grid-connected power systems for remote, stand-alone and distributed generation applications. It has been developed by United States National Renewable Energy Laboratory since 1993. It is developed specifically to meet the needs of renewable energy industry’s system analysis and optimization. There are three main tasks that can be performed by HOMER: simulation, optimization and sensitivity analysis. In the simulation process, HOMER models a system and determines its technical feasibility and life cycle. In the optimization process, HOMER performs simulation on different system configurations to come out with the optimal selection. In the sensitivity analysis process, HOMER performs multiple optimizations under a range of inputs to account for uncertainty in the model inputs. Detailed description on HOMER software can be found in [
27,
28].
HOMER Pro Microgrid Analysis Tool 3.9.2 [
29] is the simulation tool adopted for the optimization of the plant. This simulation tool assists in the planning and design of renewable energy based micro-grid. The physical behavior of each power plant configuration, their life-cycle (excluding dismantling) cost and the energetic and economic comparison were made using the three main operations of the software: Simulation, Optimization and Sensitivity Analysis.
In the Simulation area, HOMER Pro determines technical behavior, feasibility and life-cycle cost of a system for every hour of the year. The assessment is made not only for the entire system: the operation of each component is simulated to examine how the components works in relationship with the entire system.
In the Optimization section HOMER displays each feasible system and its configuration in a search space sorted by the minimum cost depending on the total net present cost. In this way, we can find the optimal configuration which satisfies the constraints imposed in the model. The description of economic output is set out in the following paragraph.
In the section of Sensitivity Analysis, the user can analyze the effects of parameter variations in time and the behavior of the sensitivity variables. The sensitivity variables are those parameters entered by the user and having different values.
Before the construction of the model, the first step needed is the evaluation of the load, which could be electric, thermal or both, although in this study we focus on the electric load. In the present paper, the yearly electric load profile adopted was the measured load of 2014 with 30-min step.
3.6. The Hybrid Optimization Model and Problem Formulation
The configuration of the system is studied when designing a power system in terms of the components, and size, selecting from numerous technology options and various energy resources.
The HOMER was developed by the U.S. National Renewable Energy Laboratory to simplify the task of designing multisources power systems and evaluating the maximum number of possible system configurations [
28]. The optimal system with the lowest net present cost (NPC) is determined using this micropower optimization model.
The total annualized cost (
Cann_tot) represents the annual cost of the project in (
$/year), which includes the initial costs (
Ccapann), replacement costs (
Crepann), and O & M costs (
CO&Mann), and is expressed mathematically as:
On the other hand, total annualized cost can be defined as the annualized value of the total net present cost, and is expressed mathematically as:
The capital recovery factor (
CRF) converts a net present cost (
CNPC) into a flow of equal annual payments over a specified time, and calculates this value based on the annual interest rate (
i) and number of years (
N), and is expressed mathematically as:
The
CNPC represents all the costs that occur within the project lifecycle, with future cash flows discounted to the present using the discount rate. NPC includes the initial costs (IC), replacement costs, and O & M costs. Besides, salvage value that occurs at the end of the project lifetime that reduces the total NPC. The salvage value (
S) is the value remaining for each component after a project’s lifetime is completed and is computed using:
where
Rcomp is the lifetime of the component (years),
Rrem is the remaining lifetime of the component (years), and
Crep is the replacement cost of the component (
$).
The NPC objective function for system optimization based on Equation (2) is:
which is subject to:
- (i)
The energy output of the PV array (E
PV) must always be positive, as given in Equation (6), and must be at least 10% of the total annual demand (E
annual-demand). The factors influencing the solar energy generation are the peak capacity of the PV array (Y
PV) in kW, the peak solar hour (PSH) in hours, and PV efficiency, which represents the relationship between the target yields (f
PV) and the actual target. The mathematical modeling in HOMER calculates the total annual energy contribution of the solar array [
28] and is expressed as:
- (ii)
To ensure a balance between demand and production power, the energy production of the sources (PV array and battery (EBattery)) should cover the needs of the BS (EBS) plus the losses (ELosses) incurred by a DC-DC regulator, inverter, and active cooling.
The discharging and charging limits of a battery depend on its power rating and vary between the values (P
min, P
max), where P
min is the minimum state of charge and P
max is the maximum state of charge of the battery, which is also the nominal capacity of the battery bank. Moreover, the
DOD, efficiency, days of autonomy (
AB), and lifetime of the battery (
LB) are important, as they significantly affect the system’s total cost. The
DOD refers to the maximum energy delivered from the battery and is defined using equation [
28]:
where
SOCmin is the lower limit provided in the battery datasheet so that the battery does not discharge below the minimum state of charge.
In the case of a PV array malfunction, the battery bank feeds the required energy load. Thus, the battery bank autonomy (B
aut) is a critical factor representing the potential number of days that the battery bank can supply the required energy load without any PV array contribution. This value is expressed as the ratio of the battery bank size to the BS load [
28]:
where
BV is the nominal voltage of a single battery in
V,
Nbat is the number of batteries in the battery bank,
LBS is the average daily
BS load in kWh, and
BQ is the nominal capacity of a single battery in Ah.
Using HOMER, the battery lifecycle is calculated [
28] based on:
where
Rbatt,f is the battery float life in years,
Qthrpt is the annual battery throughput in kWh, and
Qlifetime is the lifetime throughput of a single battery in kWh.
The number of batteries in series is equal to the DC bus-bar voltage (
Vb−b) divided by the voltage rating (
BV) of one of the batteries selected:
The number of parallel paths is obtained by dividing the total number of batteries by the number of batteries connected in series.
Figure 3 summarizes the optimization methodology to identify the optimal solar system with the lowest NPC [
30].
HOMER initiates the hourly simulation of every possible configuration, uses the PV array (PPV) to compute the available power, compares it with the electric load (PLoad) and losses (PLosses), and finally decides how the additional power should be generated during deficits (battery discharging) or how the surplus power should be managed in times of excess (battery charging).
3.7. Renewable Resources Assessment
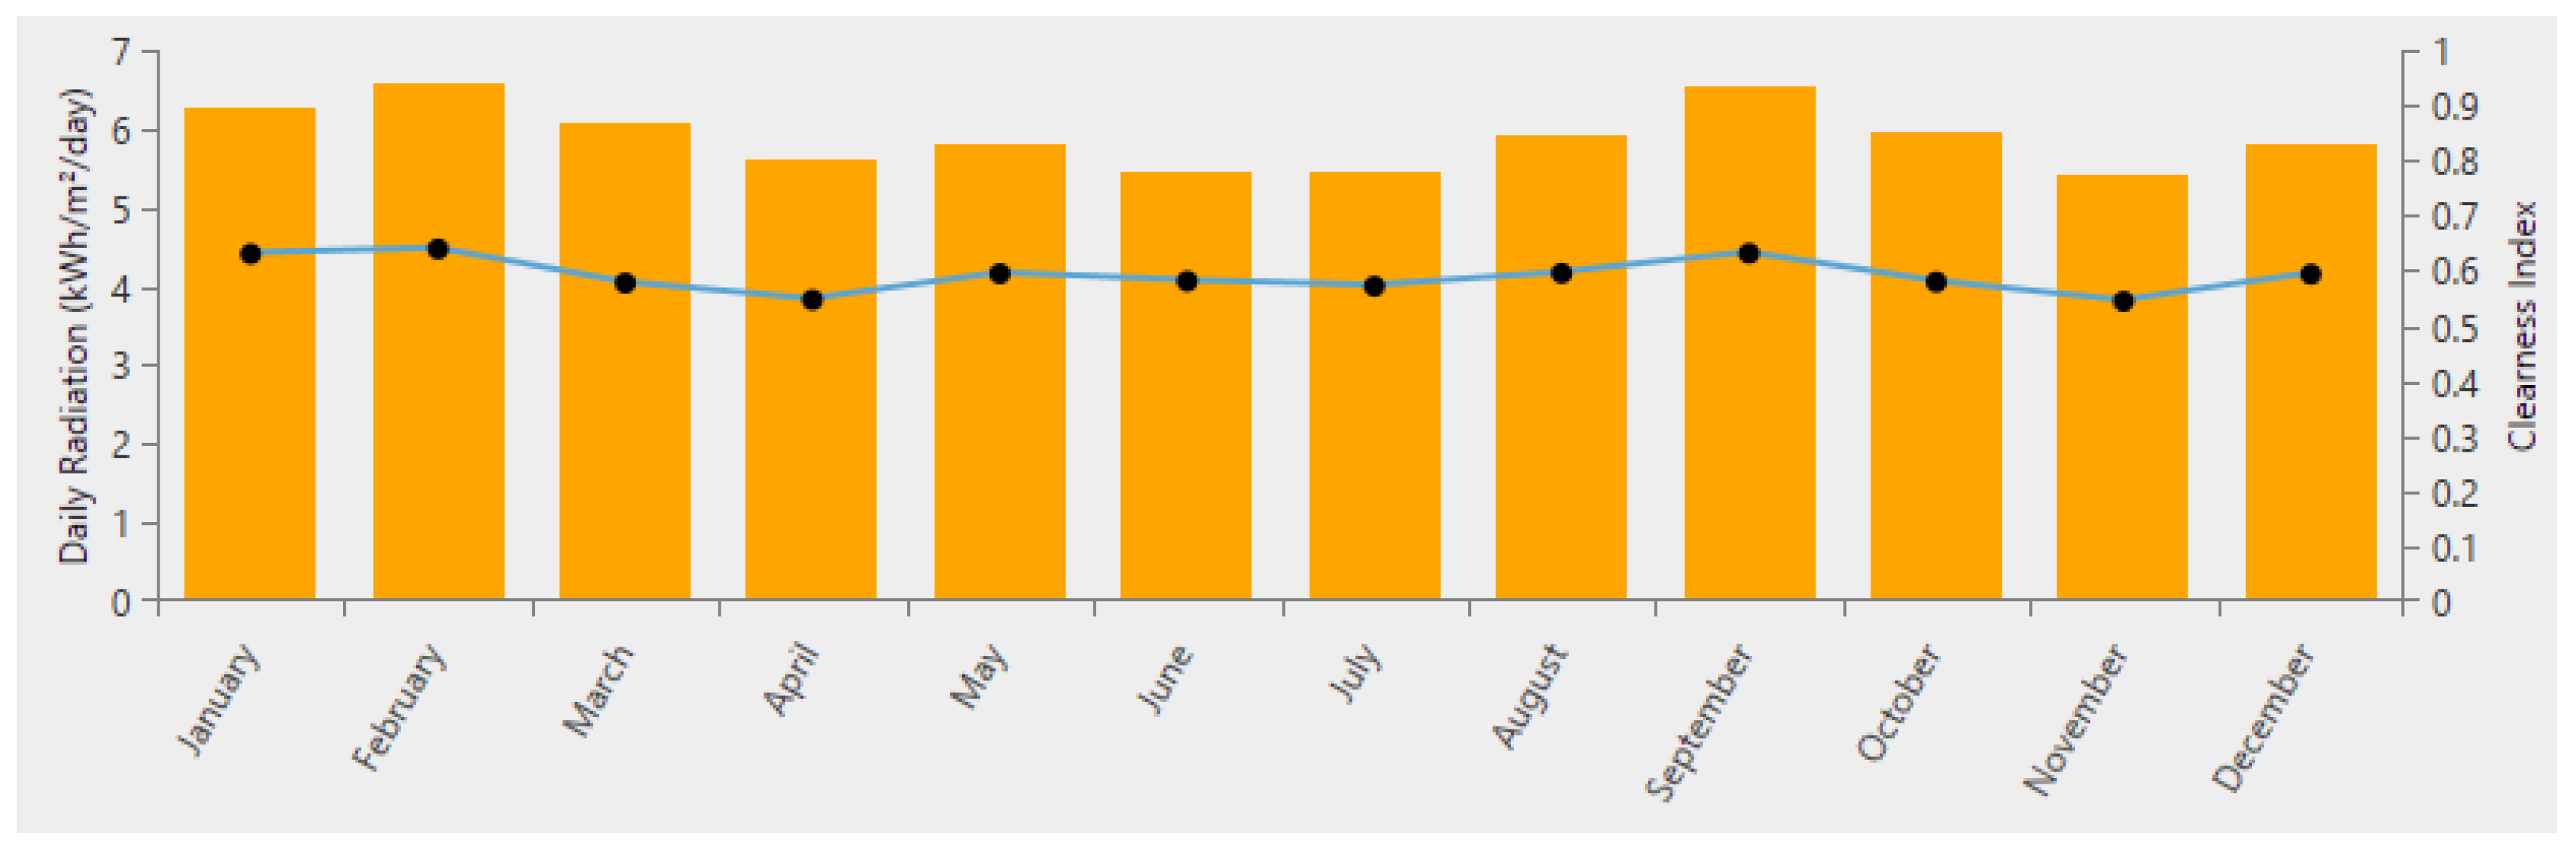
We have considered two possibly available renewable resources, solar irradiation and wind. The solar irradiation and surface annual solar radiation data have been obtained from an average of 20 years of NASA data, which interpolate data of available weather stations to infer specific location (freely available also at [
31]). The scaled average annual of daily solar radiation in this region is 5.90 kWh/m
2. The average clearness index is 0.59. Based on these data, we show the assumed values for the different months in
Figure 4.
Implementation of the wind solution was discarded because the data analysis revealed a low energy production of the existing turbines. Indeed, the NASA wind data and preliminary on-site wind measurement do not justify the measured low energy production; the reason this is not working should be investigated. The biomass option was not considered due to their local scarcity and to the well-known problems related to deforestation, crop energy competition with food production, and relatively high operational costs of such plants.
3.8. Components and Cost
The PV array size is calculated using the Homer Optimizer™ algorithm. The considered PV system and replacement cost is 2200 $/kWp. The O & M cost is set to 10 $/kWp/year. The solar module type is a polycrystalline PV panel with efficiency 15%. The costs include purchase, transportation and installation of modules, all balance of system components like cables and structures (excluding the inverter) and the security system.
The Inverter size is calculated using the Homer Optimizer™ algorithm. The cost is set to be 300 $/kW, and the efficiency of the inverter is assumed to be 95%.
For the battery energy storage systems (BESS) we consider a Li-Ion battery, with round trip losses of 8% [
32], an estimated cost of 600
$/kWh, an O & M cost of 10
$/kWh/year, and a connection on the DC bus. For the limited BESS solution, the size of the BESS is varied from 500 kWh to 1300 kWh with a step of 50 kWh.
The diesel Generator is considered as a back-up component. The present micro-grid has a 410 kW generator but, most of the time, it is oversized compared to the load curve because the maximum requested power is 292 kW and the average requested power is 122 kW.
The minimum load ratio considered suitable for the generator is 25%, i.e., 102.5 kW. With requested load under this limit the generator works at low efficiency. Furthermore, in case of high renewable energy penetration, the generator works as a backup system, this means that it could be used to supply also little amount of power, i.e., when the BESS or the PV need an integration to reach a too high load, in this case the number of starts of the diesel generator is high. Thus, it has been evaluated the opportunity of installing adjunctive little generators to answer the little load requested by the system and to avoid that the 410 kW generator works at low efficiency.
For the 410 kW diesel generator it has not considered a capital cost because it is actually working, the replacement cost is $90,000, the O & M cost is 2 $/h. The 100 kW generator cost and its replacement are set to $40,000 and the O & M cost is 2 $/h. The 50 kW generator cost and its replacement are set to $25,000 and the O & M cost is 1 $/h. The diesel cost is set to 1.28 $/L which is the average cost of the diesel in Habaswein in 2014.
The lifetime of the plant, used in the economic evaluation is 25 years. The main factors to evaluate the economic optimal solution for the optimization of the Habaswein power plant are Net Present Cost (NPC) and the cost of electricity (COE). The assumed lifetimes of the PV panels, inverter and BESS are, respectively: 25 years, 15 years, 10 years, and 15,000 h. The discount rate of this study is set to 10% [
33] and the inflation rate is assumed to be 8% [
34].
4. Results
The study evaluates three possible solutions, with and without BESS, the results of the different solutions are summarized in
Table 2.
The first solution evaluated was a Hybrid system without BESS (
Figure 5), the absence of a BESS implies the excess energy produced by the power plant cannot be stored and be available anytime, so the diesel generators will satisfy the demand when the PV system is not producing enough energy.
In this case, the optimal configuration is formed by a 569 kWp PV generator, with a 193 kW inverter, and two diesel generators of 100 kW and 410 kW.
The PV total energy production would be 868,391 kWh/year and satisfies about 40% of load energy consumption. The excess energy produced by the PV plant is 430,993 kWh, so almost 50% of the energy produced is not consumed.
The installation of an additional 100 kW diesel generator allows covering the base load. In this way, the 410 kW diesel generator would be switched on only in the case of high consumption, thus avoiding conditions of very low loads (<25% of nominal capacity): this solution improves the global efficiency of the power generation with fossil fuels and the diesel generators total production is 637,798 kWh/year with a fuel consumption of 206,748 L/year.
In this optimization scenario, the excess electricity generated by PV is 408,305 kWh/year, corresponding to 27.1% of the total electricity generation ( 1,506,189 kWh/year). This excess cannot be used due to the lack of energy storage.
With a COE of 0.354 $/kWh and a NPC of $7,568,600.45, this optimization scenario, compared to the current situation, reduces: (i) the diesel consumption by 184,537 L/year; (ii) the CO2 emissions by 484,649 kg/year; and (iii) the emissions of other pollutants by 3612 kg/year.
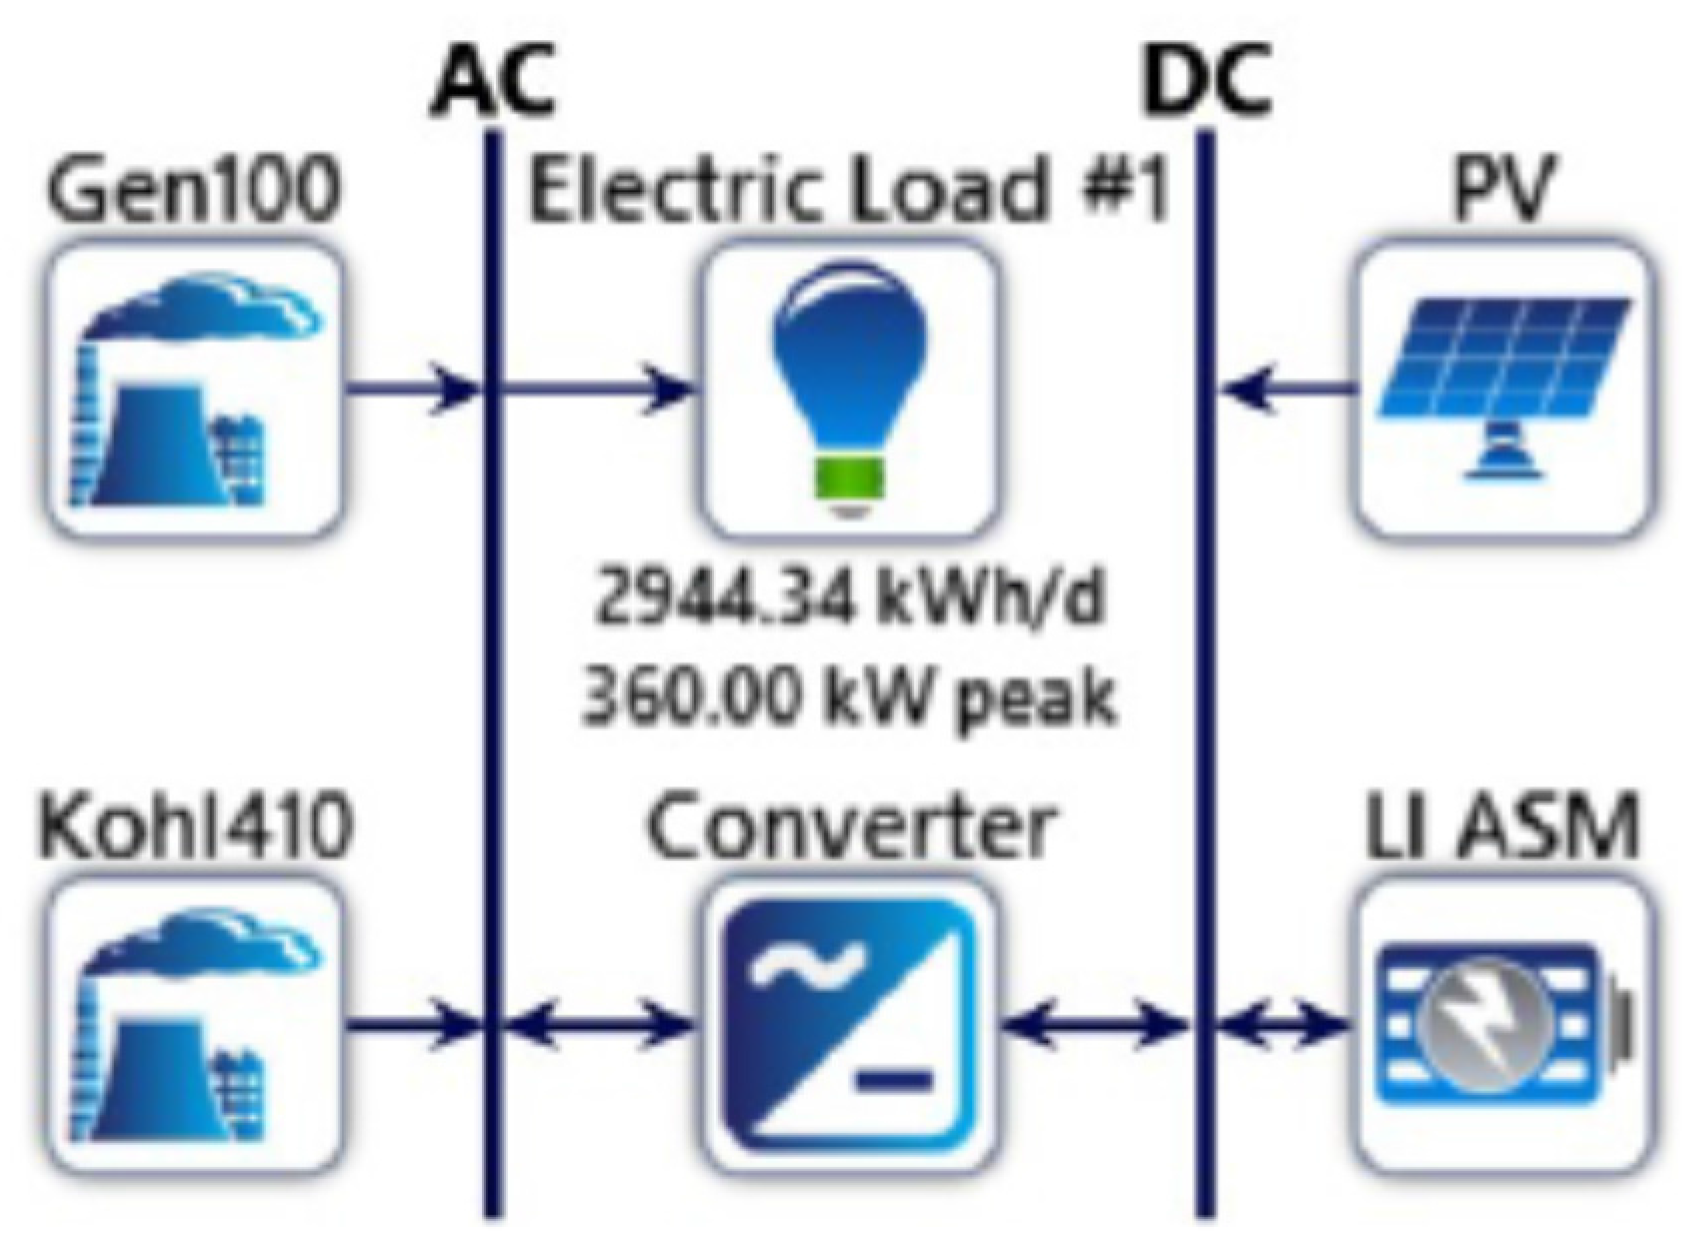
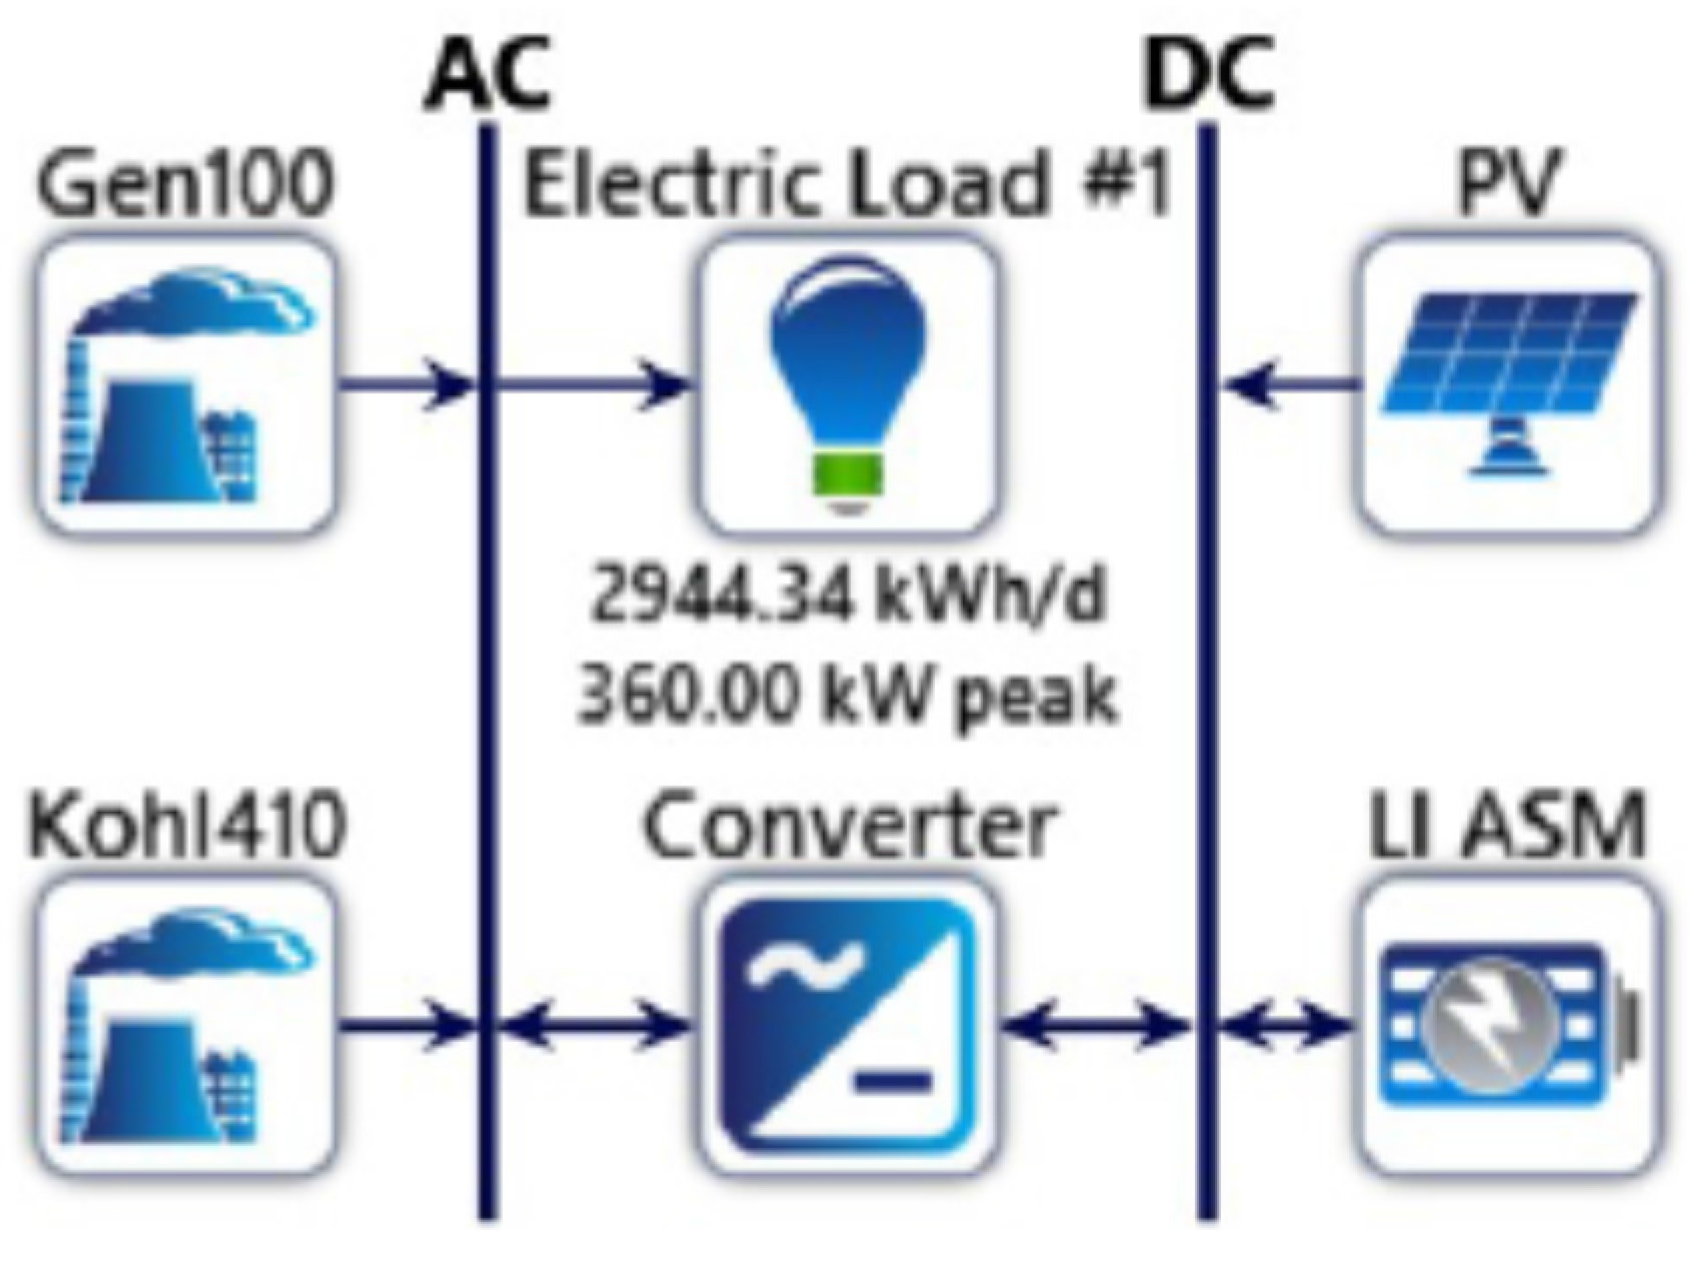
The second solution evaluated was a Hybrid diesel/PV system with limited BESS (
Figure 6).
The BESS allows the possibility to store the excess energy produced by the power plant. In such scenario, the diesel generators will support the system to satisfy the demand when the PV system and the BESS cannot supply enough energy. In this first simulation, we considered a limited BESS capacity to stay within a battery capital cost of $800,000.
The optimal configuration is formed in this case by a 578 kWp PV generator, with a 206 kW inverter, a 1328 kWh BESS capacity, and two diesel generators of 100 kW and 410 kW. The diesel generators total production is 339,665 kWh/year with a fuel consumption of 109,927 L/year.
PV total energy production is 882,471 kWh/year and satisfies 68.4% of the load energy consumption, thanks also to the energy stored in the BESS. There is still an excess of energy produced by the PV plant, corresponding to the cases when BESS are already fully charged and the production exceeds the consumption (usually, during the afternoon). Such excess is 82,071 kWh/year, corresponding to 6.7% of the total electricity generation which is 1,222,136 kWh/year. Compared to the previous BESS-less case, this implies a better exploitation of the solar resource.
With a COE of 0.305 $/kWh and a NPC of $6,507,321.53this optimization scenario, compared to the current situation, reduces: (i) the diesel consumption by 281,358 L/year; (ii) the CO2 emissions by 738,656 kg/year; and (iii) the emissions of other pollutants by 5681 kg/year. Compared to the first case (no BESS), the diesel consumption is reduced by almost a half.
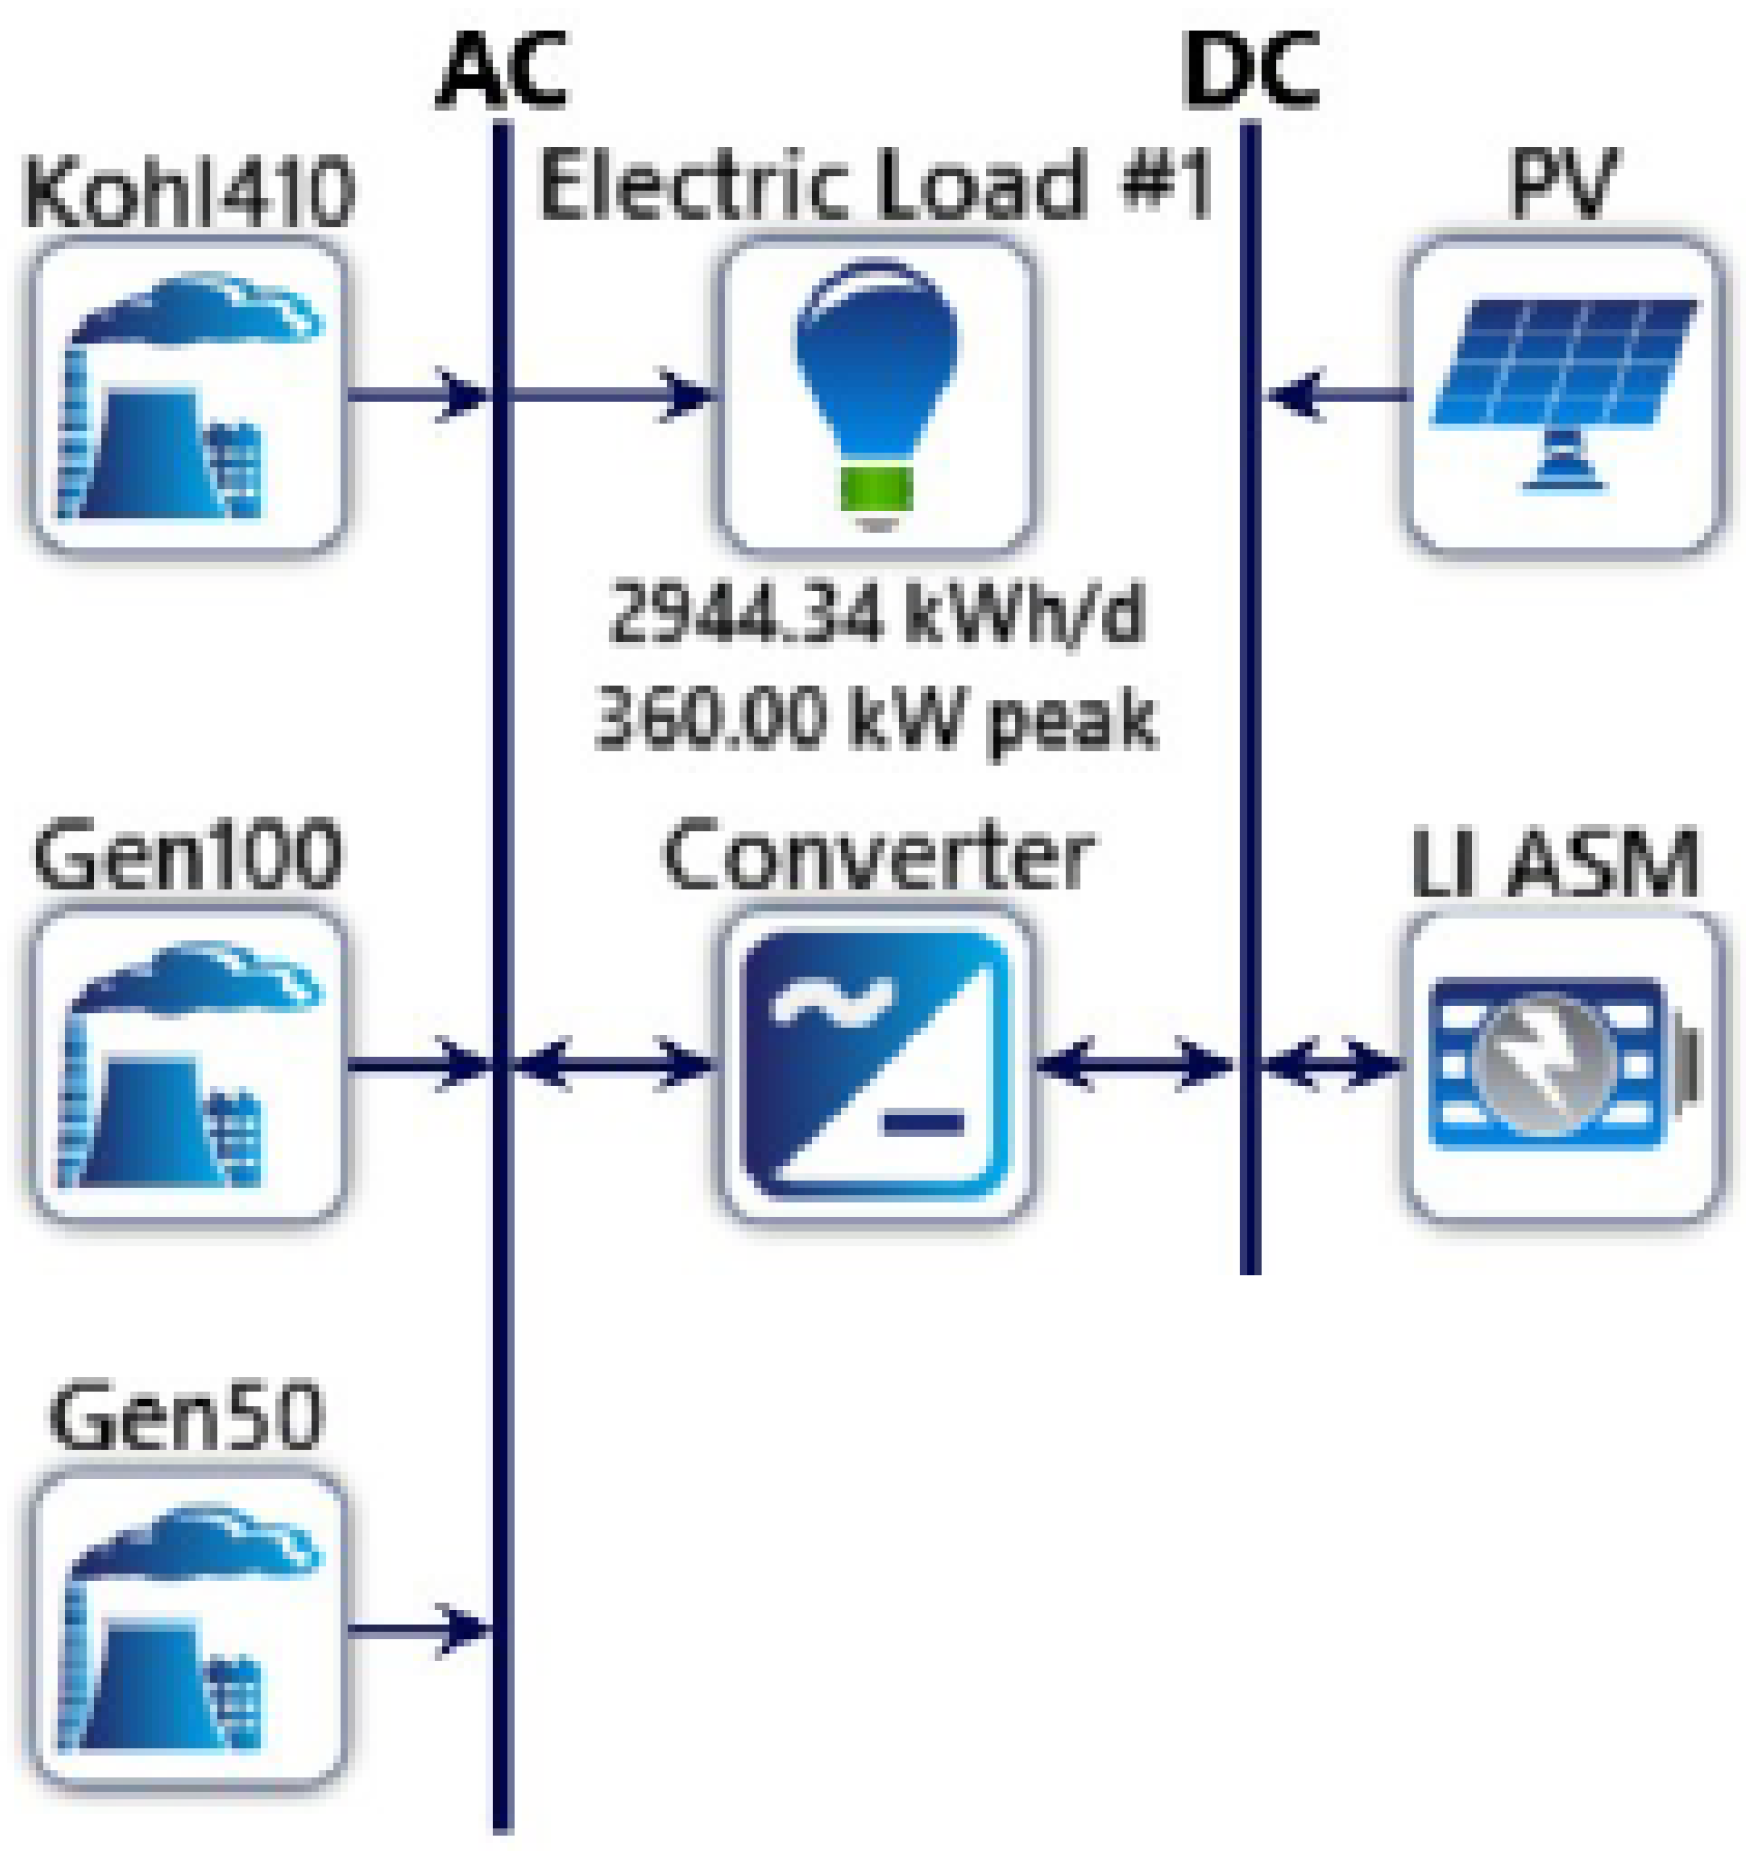
The third solution evaluated was a Hybrid diesel/PV system with optimized BESS (
Figure 7).
We then consider a case with BESS endowed with larger capacity, exploring more expensive configurations. The optimization of the BESS has the aim to reduce the COE and the NPC of the plant to make the solution with the most affordable energy price.
In this case, the optimal configuration is formed by an 808 kWp PV generator, with a 202 kW inverter, a 2598 kWh BESS capacity and three diesel generators of 50 kW, 100 kW and 410 kW. Three diesel generators have been chosen to reduce as much as possible the use of the 410 kW generator, which is installed as backup component. The diesel generators total production is 94,383 kWh/year with a fuel consumption is greatly reduced to only 28,719 L/year.
PV total energy production is 1,233,580 kWh/year and satisfies, thanks to the energy collected in the BESS, 91.2% of load energy consumption. In this optimization scenario, the excess electricity generated by the PV is 156,674 kWh/year, corresponding to 11.8% of the total electricity actually distributed by the PV + BESS + diesel system (1,327,963 kWh/year). This excess is in proportional higher than the limited BESS solution due to the much larger PV nominal power. An exploitation of this excess would imply a larger BESS, which is economically not convenient due to the installation costs.
With a COE of 0.253 $/kWh and a NPC of $6,179,443.19, this optimization scenario, compared to the current situation, reduces: (i) the diesel consumption by 362,566 L/year; (ii) the CO2 emissions by 951,658 kg/year; and (iii) the emissions of other pollutants by 7310 kg/year.
4.1. Environmental Evaluation
For environmental evaluation of all solutions presented above, yearly pollutant and greenhouse gas (GHG) emissions in the operational phase were considered (
Table 3). Given the intrinsic difficulties and lack of data, we do not consider the environmental impact throughout all the life cycle (cradle to grave) of the power plant, thus neglecting GHG emissions related with manufacturing, transportation, construction and dismantling. For similar reasons related to the intrinsic difficulty of a proper evaluation, we do not evaluate the impacts and costs on health and environment caused locally by the local pollutants, even though they should not be underestimated.
With these limitations, we prove the obvious result that, during the operational phase, the hybrid plants present lower emissions because fuel consumption is lower than the present plant, and the installation of a BESS achieve the maximum reduction of pollutants because the battery system can supply energy when the PV plant is not working; indeed, in the configuration without BESS, the diesel generators will work every time the PV plant is not producing enough power. Emissions are evaluated through software emissions factors (emissions per energy produced).
4.2. Economic Evaluation
The summary of the technical optimized solutions and their economic evaluation is shown in
Table 4. The present configuration, as expressed in
Section 3.3, consists of one diesel generator with total capacity of 410 kW, a 30 kWp photovoltaic plant and a wind farm of three wind turbines of 20 kW each, all synchronized in the same bus bar.
NPC of the current configuration is higher than hybrid configurations: costs of fuel, O & M and replacement are larger for generators. In the hybrid configurations, the O & M costs are lower than the current one thanks to a reduction in fuel consumption. This difference influences the COE of the four configurations: COE of hybrid plants is lower than present plant: 0.354 $/kWh, 0.305 $/kWh and 0.253 $kWh versus 0.46 $/kWh.
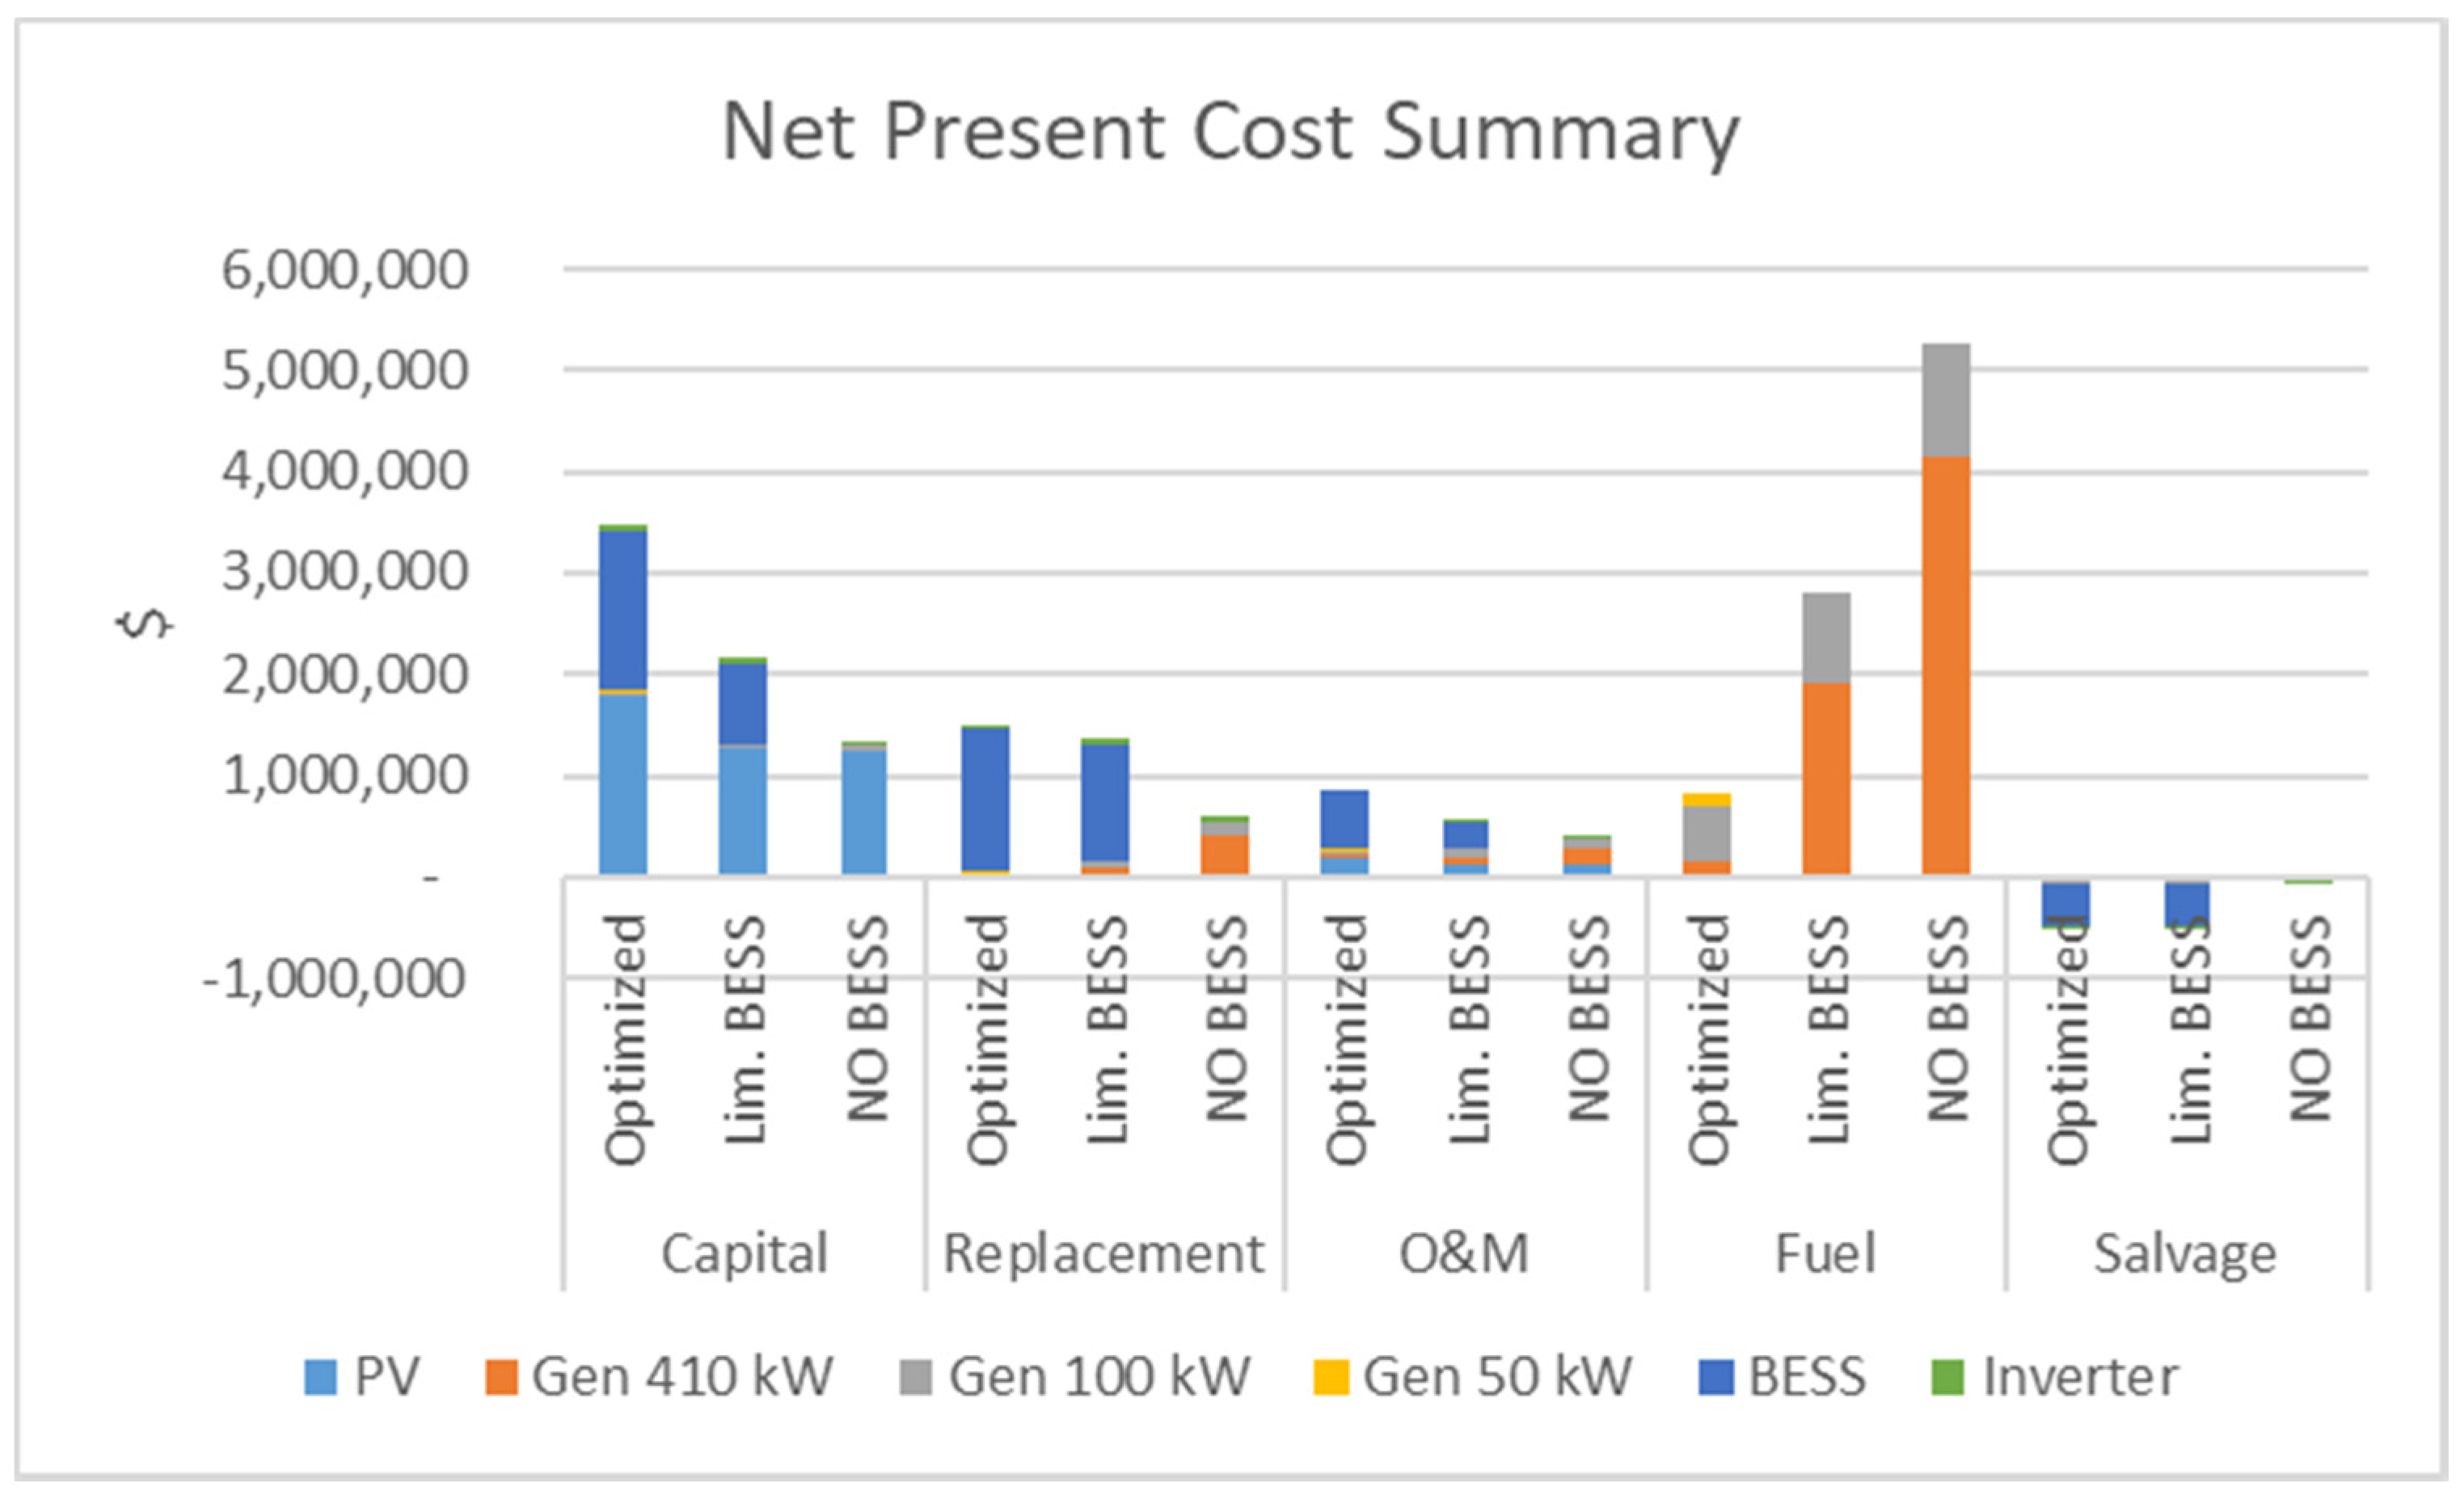
The three proposed solutions can guarantee a relevant cost reduction but there are differences between the solution with and without BESS.
Figure 8 shows the net present costs summary of the three solutions. The solution without BESS has a lower Capex but high fuel costs due to the larger use of the diesel generators, whereas the solutions with BESS have lower fuel costs, which are the most variable, but the O & M costs are higher due to the BESS replacement cost, which grows with the storage capacity.
Without a sufficient initial financial means, the solution without BESS is the best solution, as it reduces the COE but it is still highly dependent of the fuel price variability. The solutions with BESS have a lower dependence of the fuel price, but a higher capital cost.
4.3. Sensitivity Analysis
In this section, various sensitivity analyses have been performed on the hybrid diesel/PV system with optimized BESS. The variated parameters of this study are: cost of diesel prices, load consumption and BESS cost.
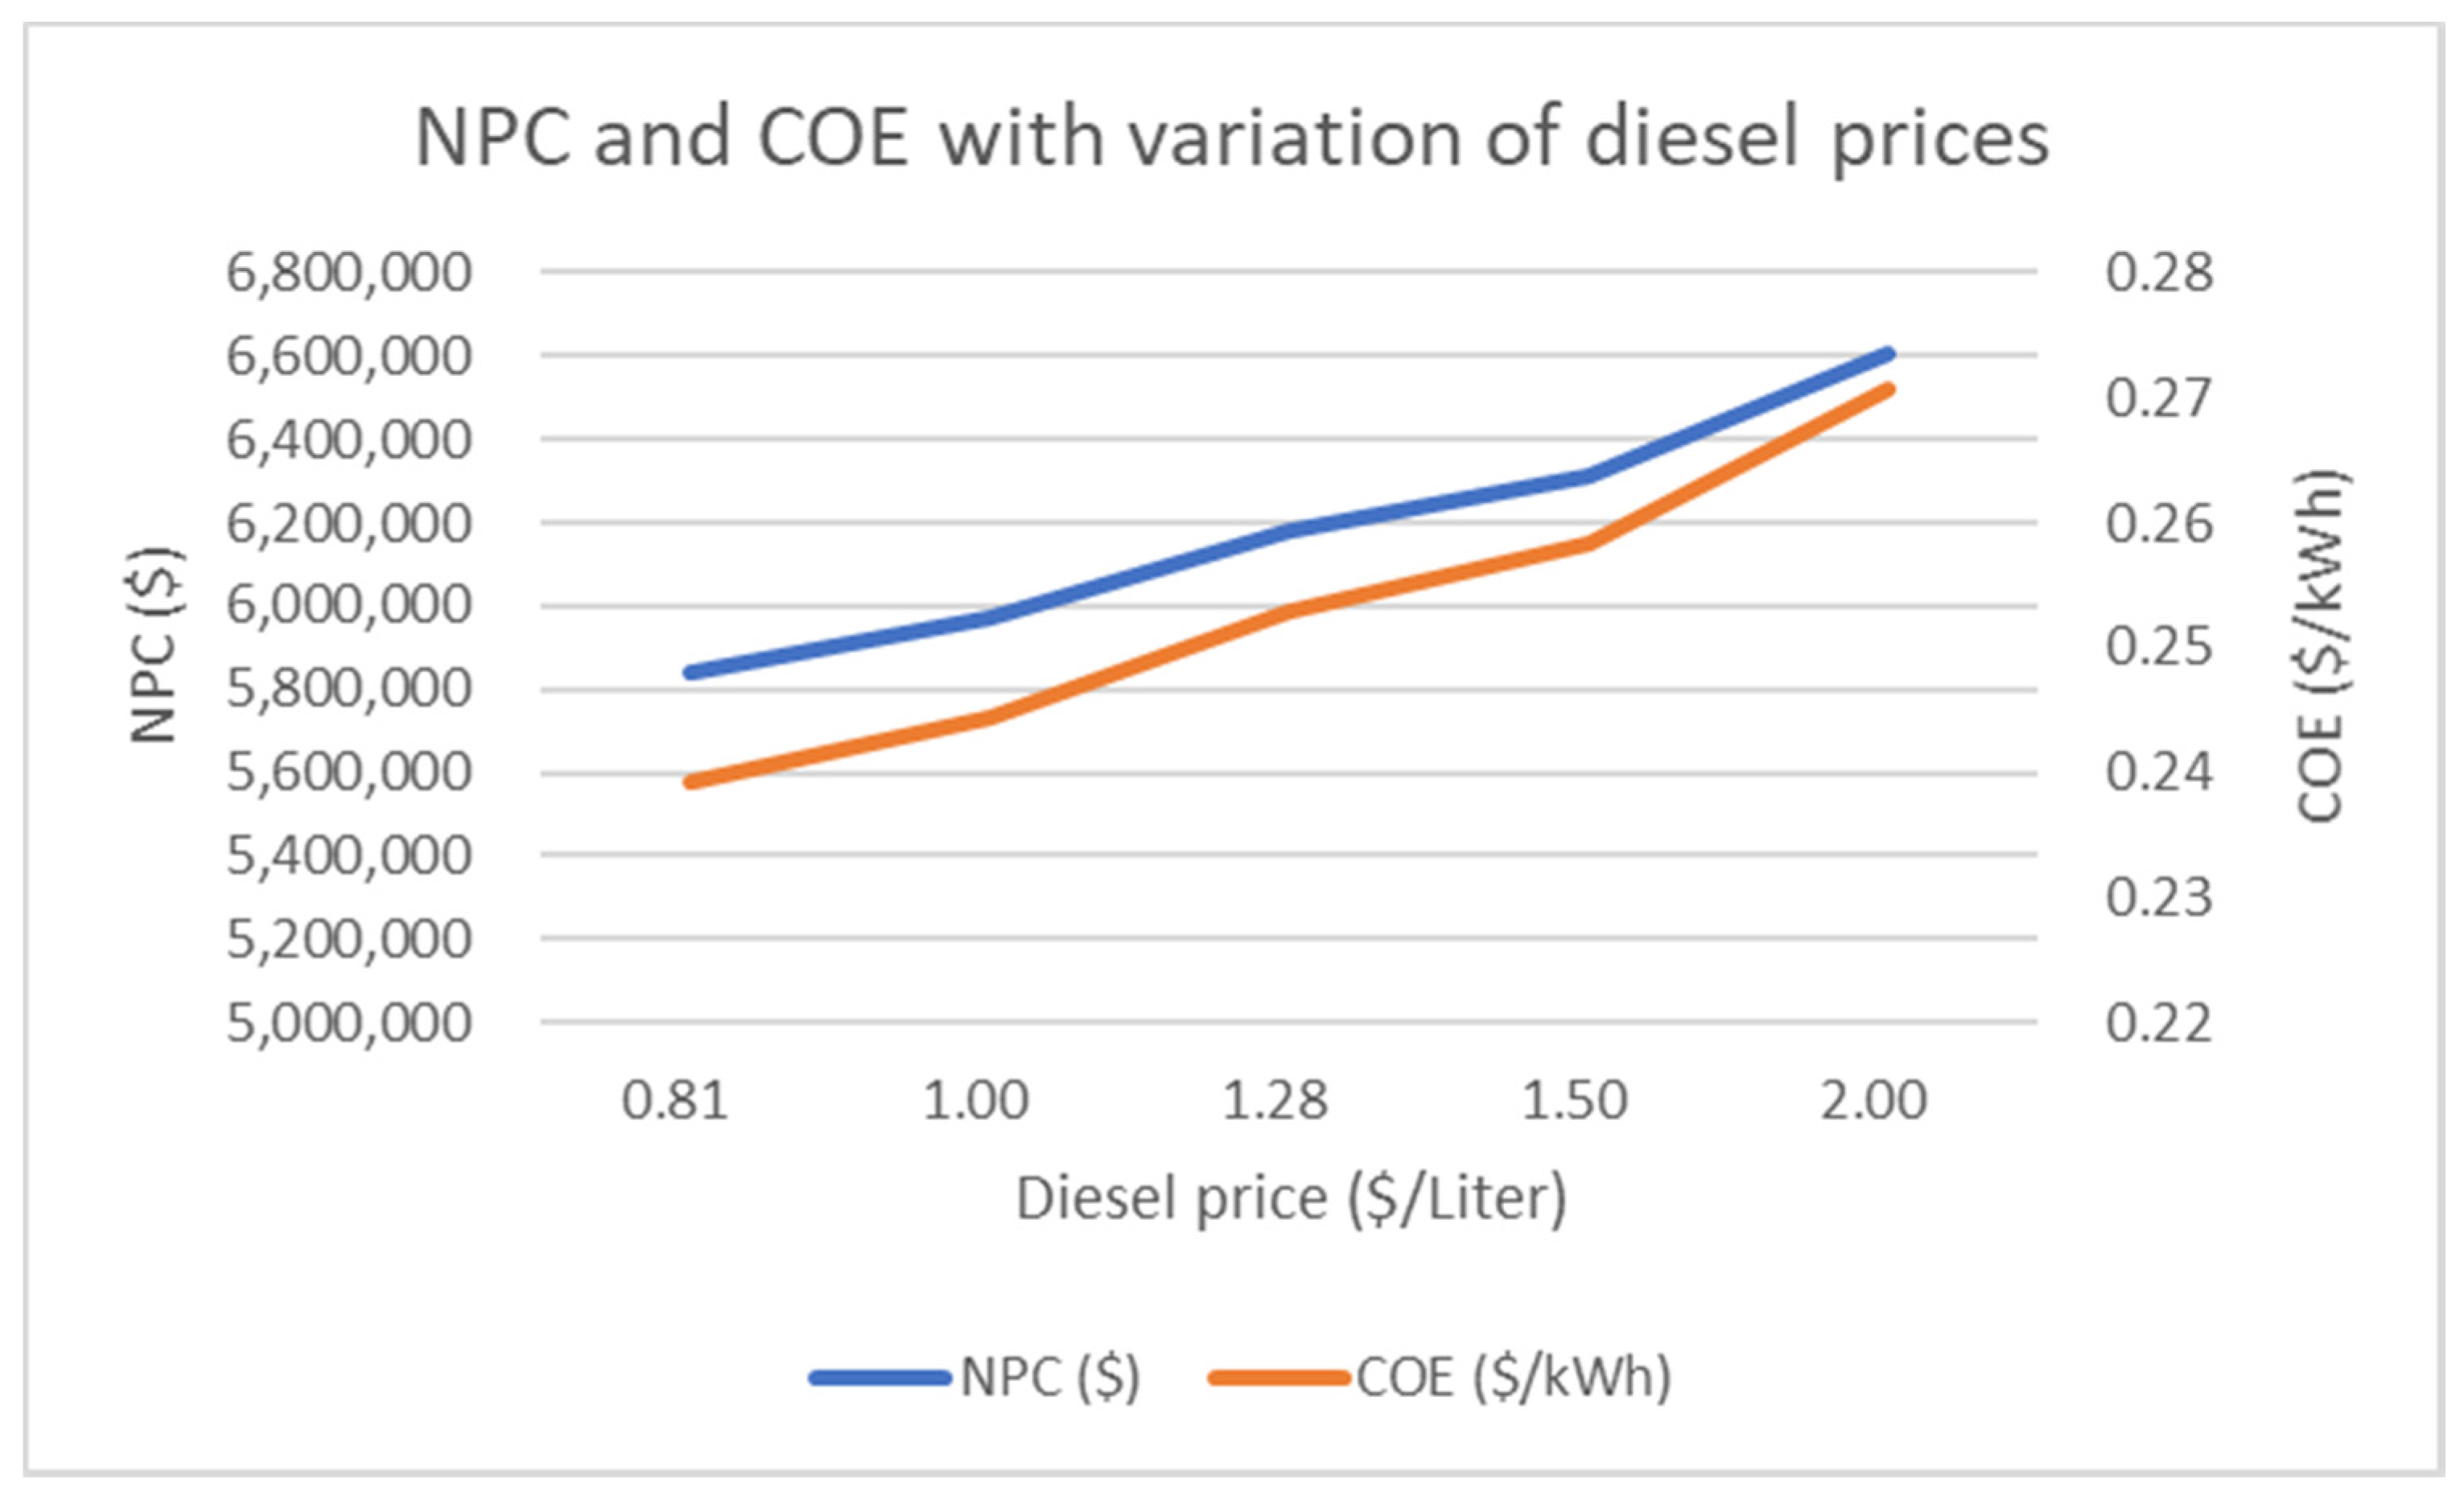
The considered diesel prices are the annual average price of diesel of three most representative years of the first five years of operation of the mini grid, i.e., 1.28 $/L, 0.81 $/L, and 1.00 $/L, and two higher value to analyze two negative situations, i.e., 1.50 $/L and 2.00 $/L.
Since the optimized configuration provide a large use of renewable sources of the optimized configuration (around 91% for the base case), the diesel price variation has a low impact on the NPC, COE and the renewable penetration in the system with maximum variation of 7%, 7% and 3%, respectively (
Figure 9). This confirms that the scenario with a high penetration of renewable energy makes the plant costs quite insensitive on the unpredictable and uncontrollable price variation of fossil fuels. On the other hand, configurations relying mainly on diesel consumption will be more vulnerable to sudden increases in fuel price.
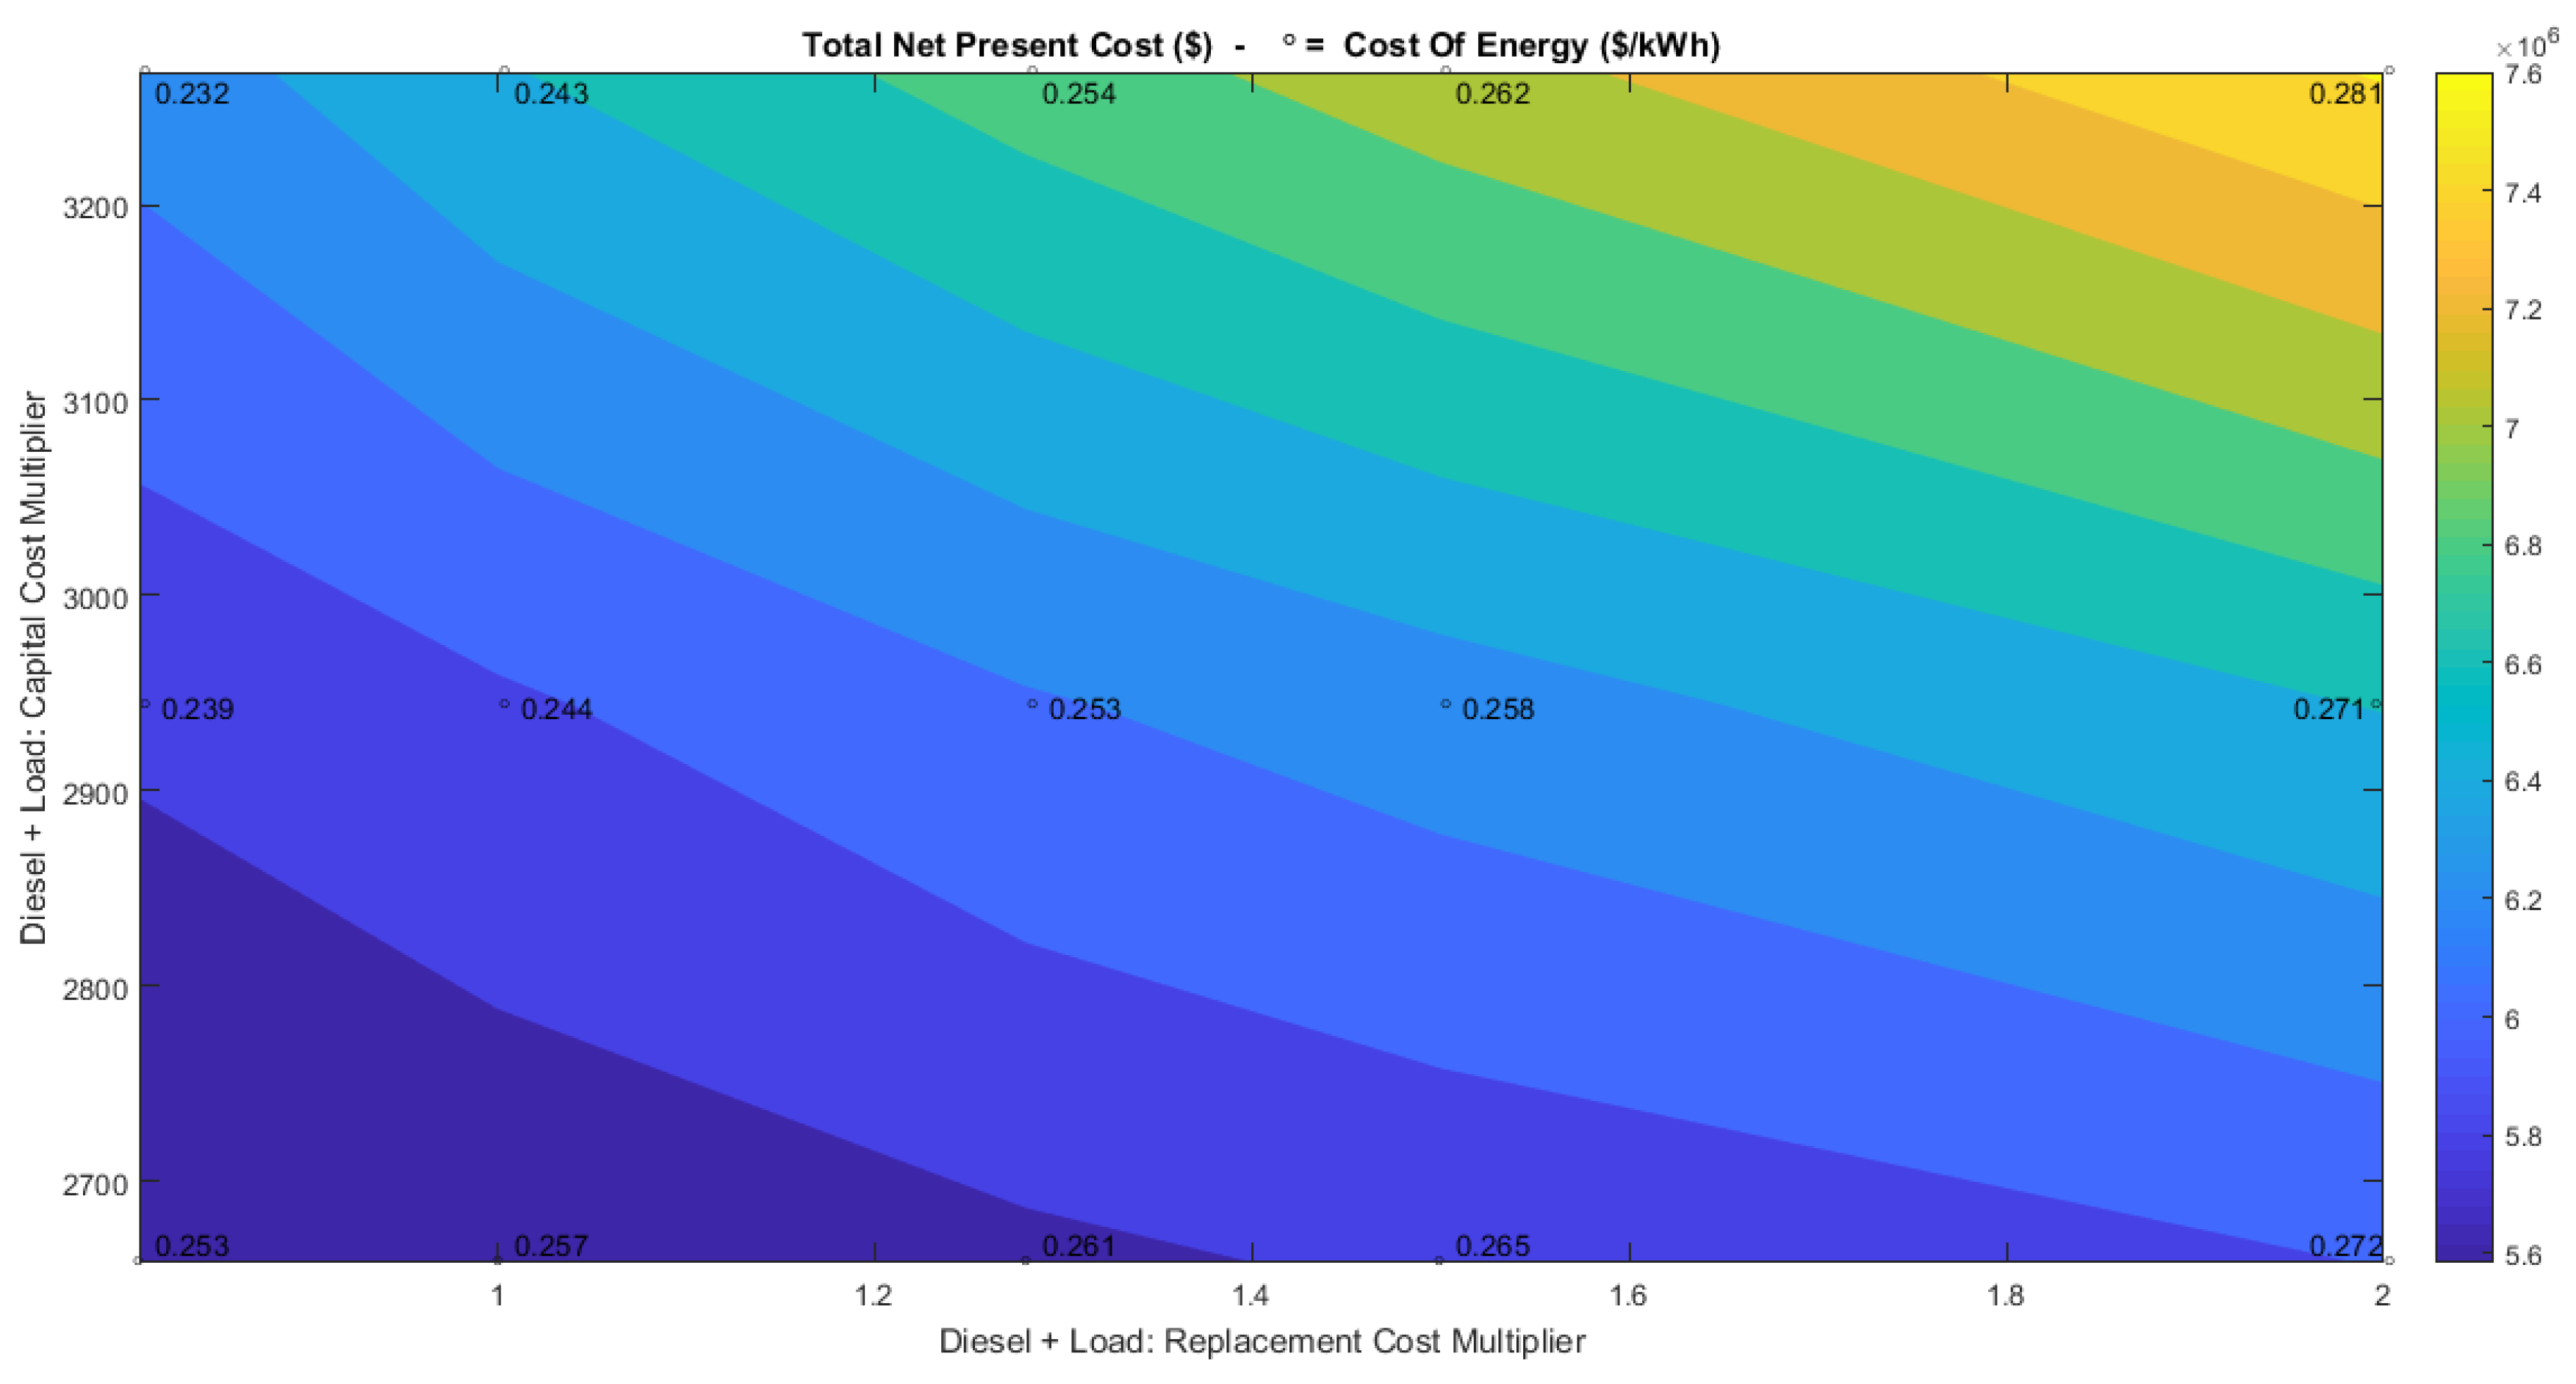
To explore the variation of load, there have been considered three different scenarios based on collected data: 2658, 2944, and 3268 kWh/day, which represent the average daily load consumption of 2013, 2014 and 2015, respectively.
Figure 10 shows the economical parameters variations as a function of the daily load and the fuel price. With the range here considered, the COE (points and superimposed numbers) varies from 0.232 to 0.281
$/kWh. The produced renewable energy fraction varies from 94.4%, when the scaled average load is 2658 kWh, to 86%, when the scaled average load is 3268.22 kWh, which is due to the larger use of diesel when the load consumption increases. COE and NPC (colors) variation depends mainly on the fuel price variation, while the load consumption increasing can cause a maximum variation of 8% of the COE (scenario with diesel fuel price at 0.81
$/L), the diesel price variation can cause a maximum variation of 17% (scenario with scaled average load at 3268.22
$/L).
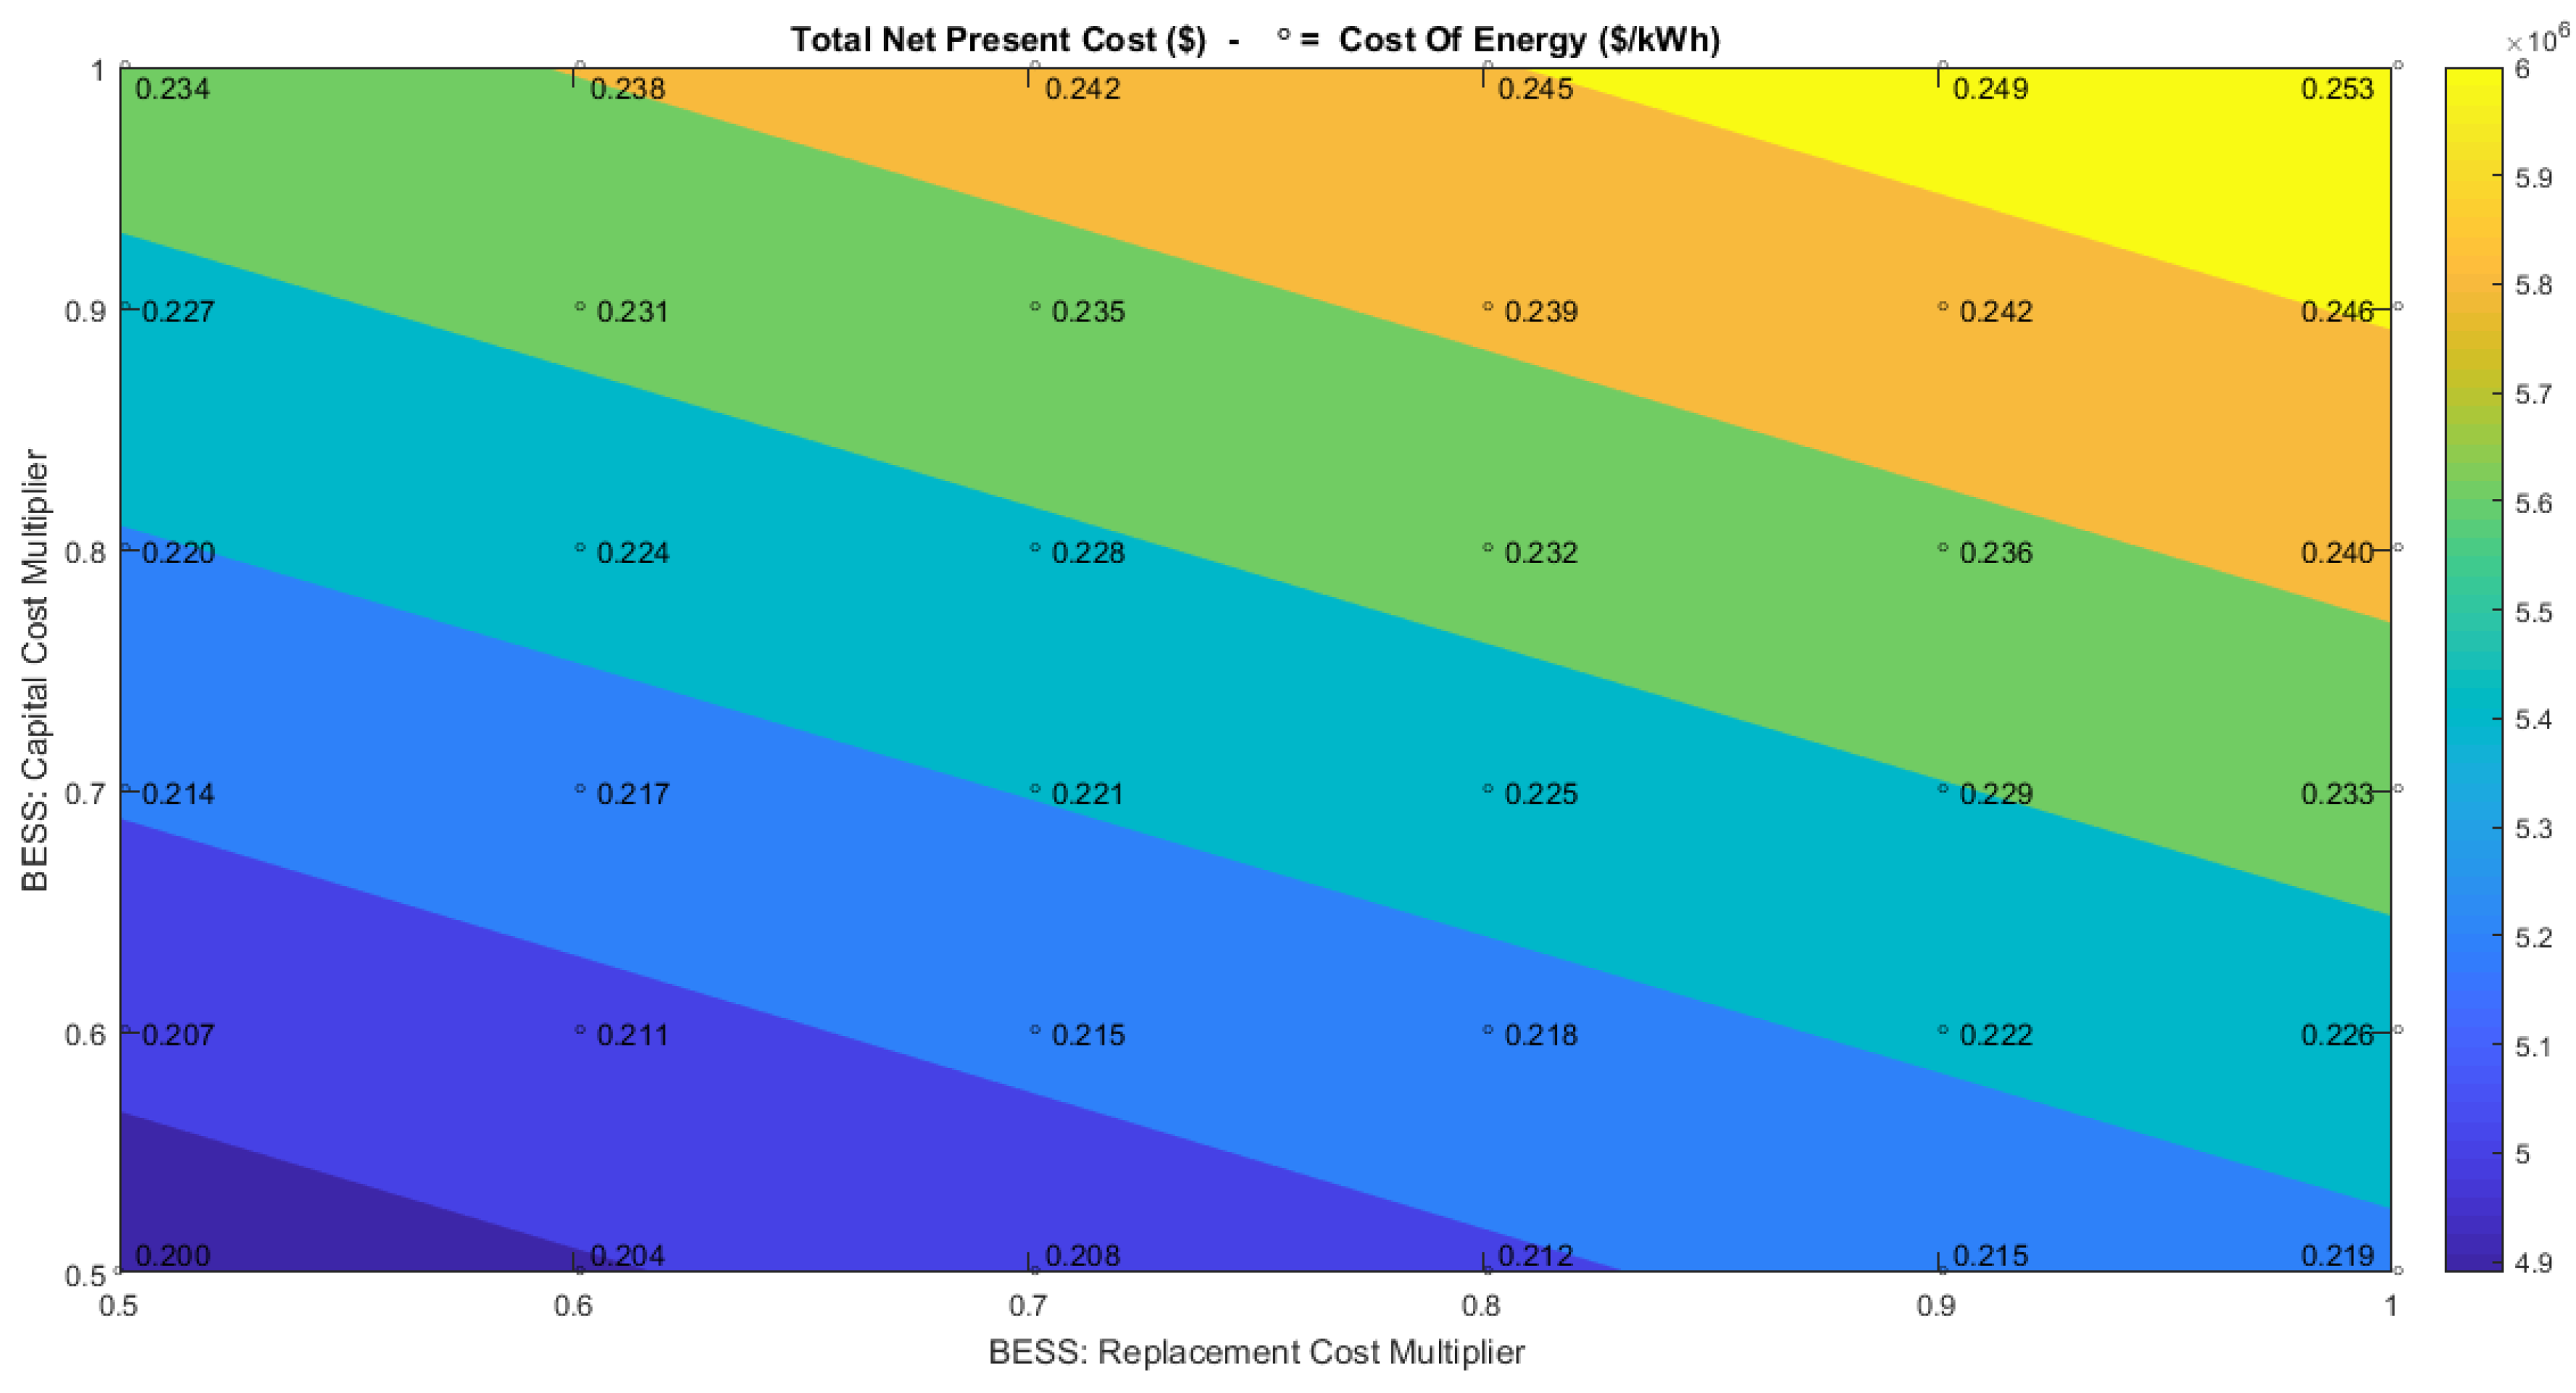
The variation of BESS cost affects the NPC and the COE linearly. Thanks to the development of passenger electric vehicles market, the Li-Ion battery price has decreased strongly during recent years and is expected to decrease more in the next few years [
35]. Thus, there have been explored the effects of capital and replacement costs of batteries reduced up to 50% of the base case cost, which is 600
$/kWh.
Figure 11 shows that the COE (points and superimposed numbers) decreases from a maximum of 0.253
$/kWh to 0.200
$/kWh, for the decrease of capital and replacement costs here considered. A strong reduction can also be noticed for the NPC, which decreases from about
$6.2 million to about
$4.9 million (colors).
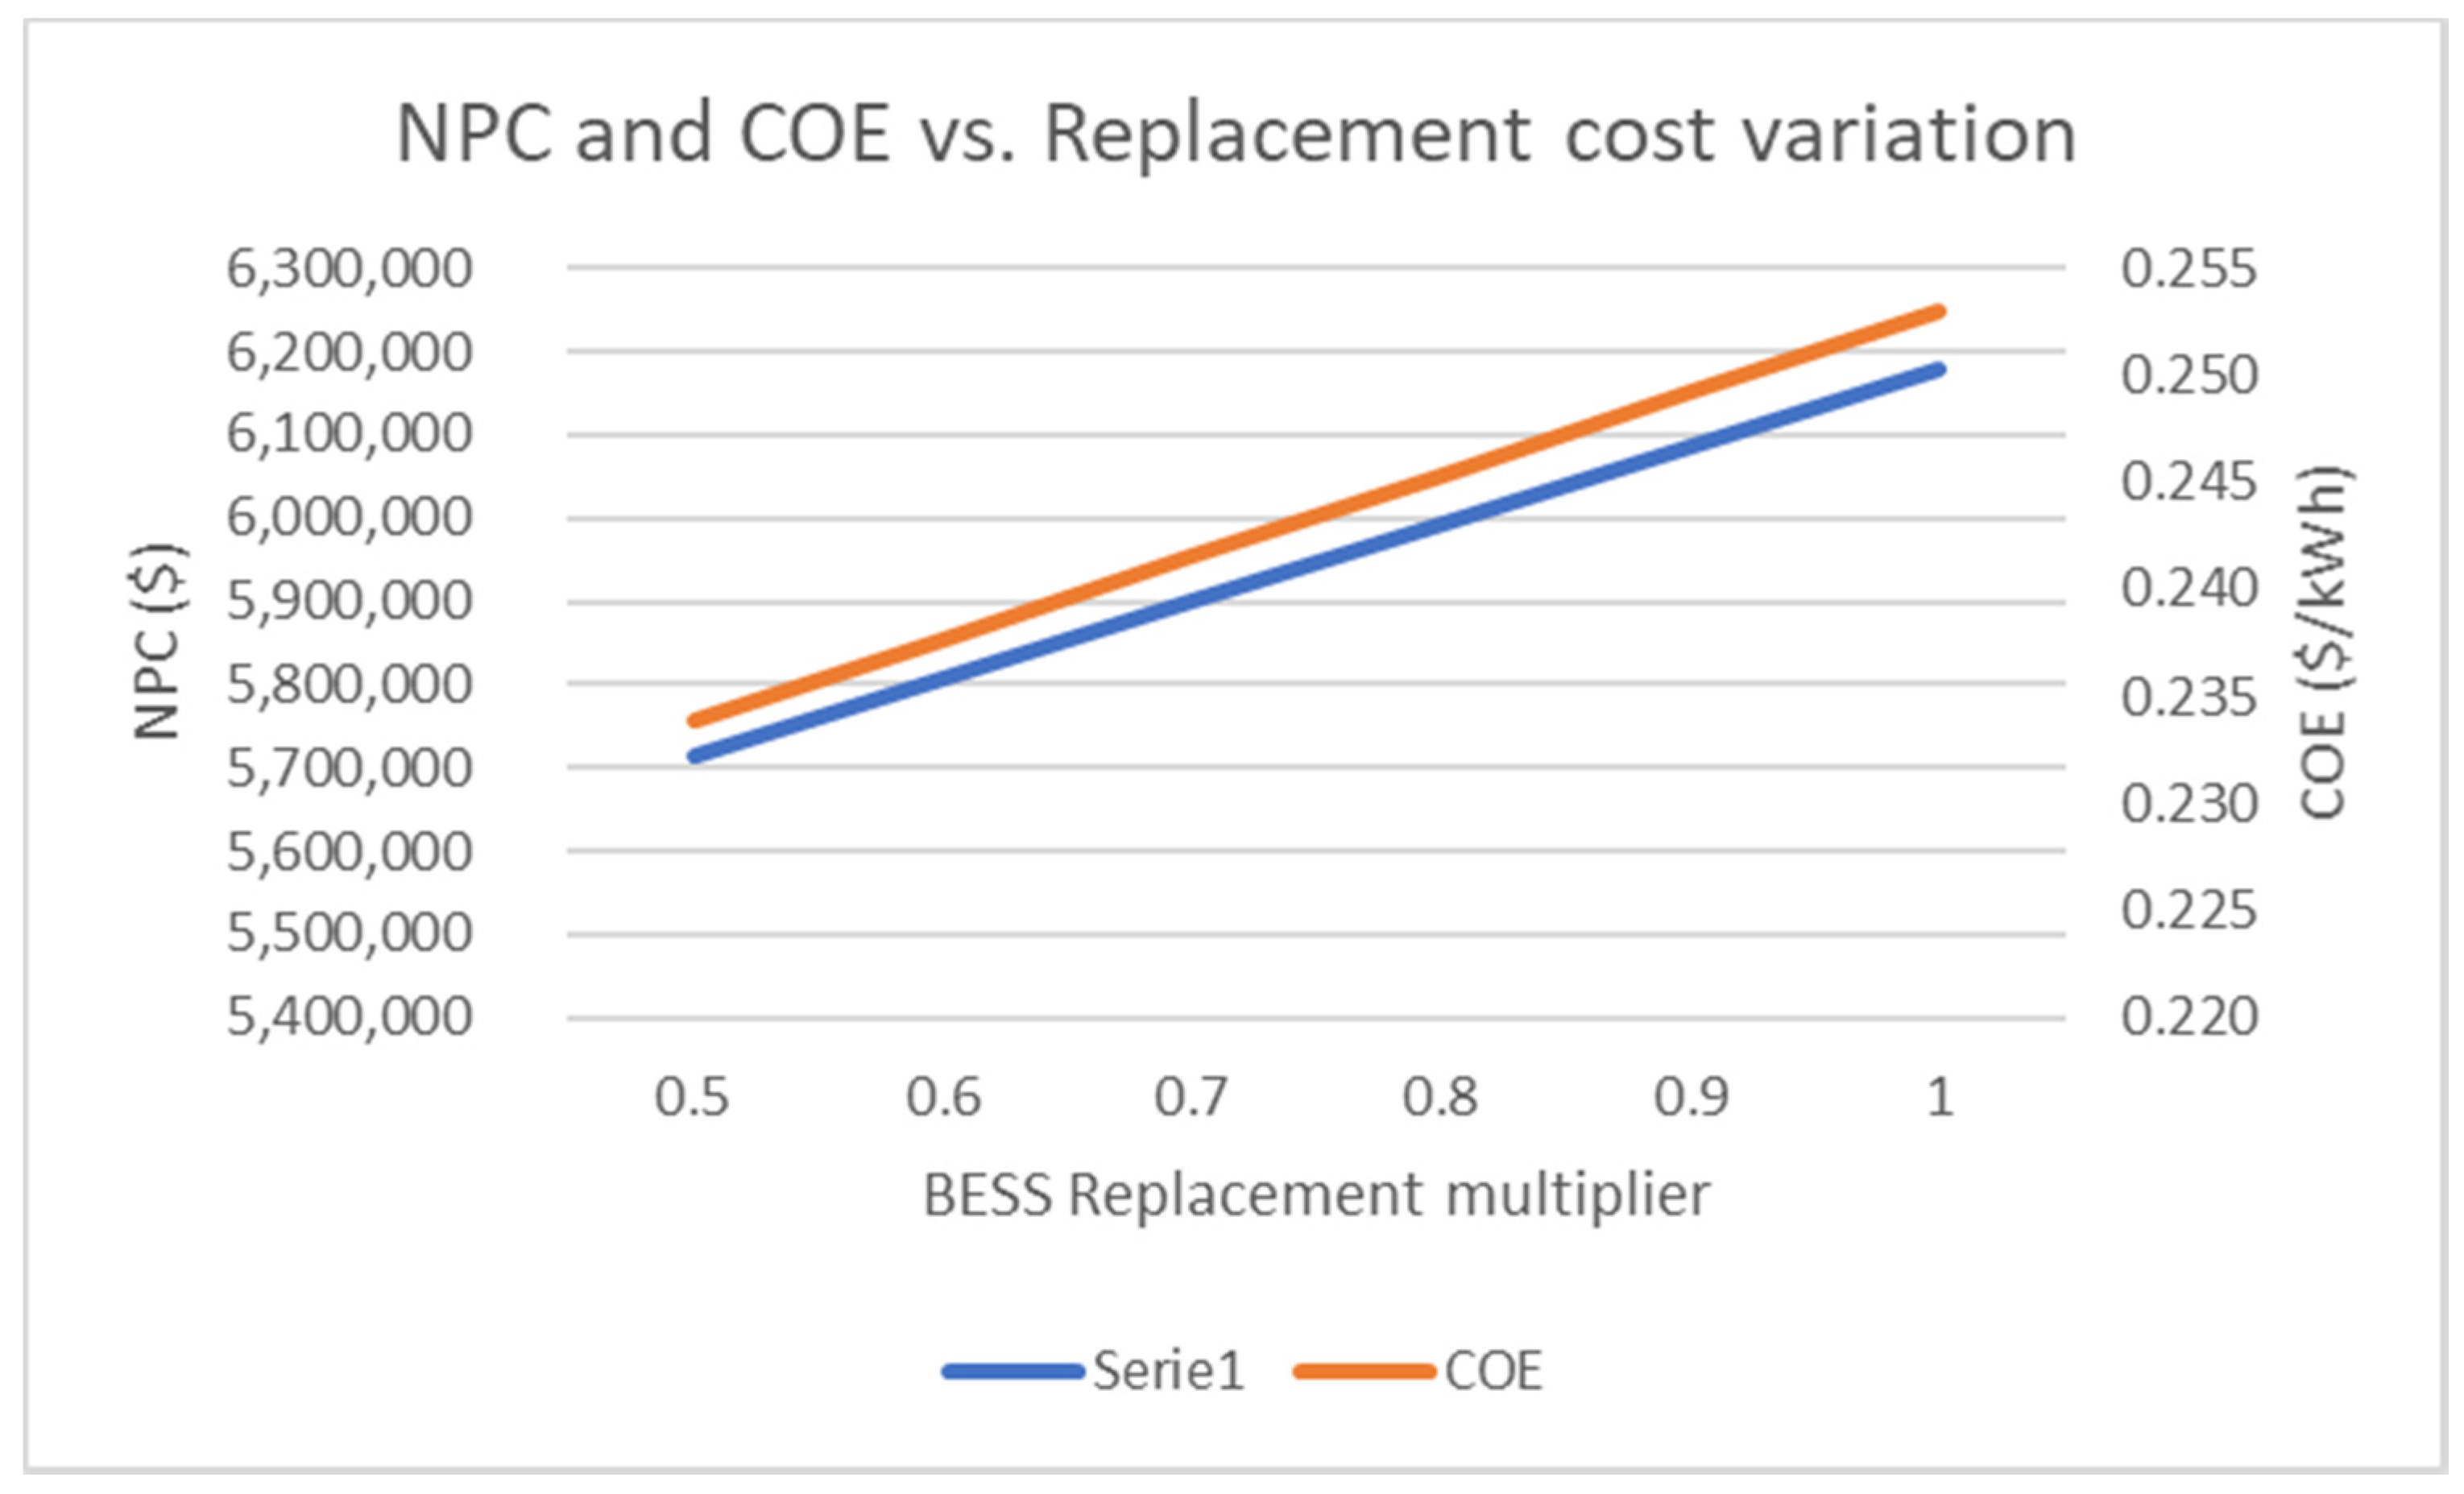
Considering no reduction of the capital cost of BESS and reducing only the replacement costs, the NPC reduces from
$6,179,433.19 to
$5,712,753.71, and the COE reduces from 0.253
$/kWh to 0.234
$/kWh (
Figure 12). This means that, in our base configuration, a reduction of 50% of replacement batteries costs could reduce COE and NPC by 8% approximatively.
4.4. Comparison with a Probabilistic Approach
The mini-grid under investigation was then sized using an optimization tool that performs a probabilistic simulation of the operation of different possible size scenarios [
11,
36]. With this approach, the mini-grid is basically sized by searching the set of components whose yearly operation is expected to be the cheapest one, accounting both for CAPEX and OPEX. Operational costs include fuel charges, maintenance costs and the economic value of load curtailment. More in detail:
An external Particle Swarm Optimization (PSO) procedure properly selects possible size scenarios of different components of the mini-grid.
A year of operation is simulated several times according to a Sequential Monte Carlo procedure.
Simple load following procedures are simulated to be used in real time to balance the system.
The yearly OPEX of the current size scenario are evaluated, as the average operational costs obtained in the different Monte Carlo simulations.
The Net Present Cost (NPC) of the current size scenario is assessed, based on its CAPEX and OPEX.
When the PSO converges, the size scenario with the lowest NPC is chosen as the best design of the mini-grid.
The results shown in
Table 5 confirm the robustness of the sizing proposed in the previous sections, since the outcomes of the two models are very similar. The optimal sizes of the inverter and of the battery, as well as the additional capacity of the diesel generator, are in fact very close to the ones calculated with HOMER. The small deviations relevant to the optimal size of the battery and to the NPC are due to the slight differences existing between the dispatching strategies of the two tools. In fact, HOMER schedules the generators to meet the total demand and ensure an extra operating reserve of 10% of the load, which slightly increases the NPC of the mini-grid; conversely, the sizing strategy described in [
36] is explicitly aimed at minimizing the NPC, which includes the cost of load curtailment. In rural areas of developing countries, the economic value of unserved energy is relatively low (around 1 €/kWh), so, in the case under examination, the best trade-off between CAPEX, OPEX and system reliability turns out to correspond to a small amount of load curtailment (0.4% of the yearly demand). The corresponding NPC, including the cost of unserved energy, is lower than in HOMER, without significantly affecting the continuity of supply.
To evaluate the benefits of using a predictive operational strategy instead of the simple load-following procedures implemented in HOMER and in [
36], the mini-grid described in the last row of
Table 5 was then re-simulated assuming a rolling-horizon infra-daily redispatching strategy of the batteries and of the diesel generator [
11]. With this method, every 6 h, the load and the PV power profiles expected for the following 24 h are used by a MILP procedure that optimizes the use of batteries and of the diesel generator for the hours to come, by minimizing short-term operational costs; the capability constraints of power electronics, battery, diesel generator, renewable sources and fuel tank are duly taken into account. During the simulation of the real time, the Monte Carlo procedure obviously draws possible hourly deviations from expected load/PV patterns and priority rules balance the system. The major outcomes of introducing a predictive dispatching strategy are the notable reduction of load curtailment (about −90%) and the more efficient use of the diesel generator, whose capacity utilization factor increases on average from 65% to 81%; both effects contribute to additionally reduce OPEX by 3% and NPC by 1%.
5. Conclusions
This paper studied some technical, environmental and economic aspects of solutions that can be applied in rural areas without access to electricity in developing countries [
37]. We have considered the case study of the community of Habaswein, Kenya, where an off-grid diesel generator supplies energy with a partial contribution of a PV plant and a wind farm.
The present plant performances were studied and the main characteristics and problems of the plant highlighted:
There is a growing energy demand recorded: The number of connections has almost tripled from the start-up of the mini-grid and there is a constant growth of energy production.
The energy production supplied by the diesel generator is dominant with large emissions of GHG and other pollutants.
The energy production cost is high and is subjected to many variations due to operation condition of the plant.
The HOMER PRO software was used to carry out the study of the optimization of the present plant, through which various adoptable solutions have been studied, by applying fully renewable or hybrid configurations. Technical and operational values have been evaluated for each solution, and, subsequently, the most cost-effective solutions have been chosen and compared with the present plant.
As result of this study, three different solutions to compare were selected: one with limited storage, one with storage optimized by Homer Pro and one without storage.
The optimized solution was validated by a comparison with a stochastic optimization model.
The criteria applied to drive technical solutions were the following:
Capital cost: The solution without storage has a lower initial cost.
Operational cost: The solution with storage needs less fuel so the yearly cost of the plant will be lower and will be less subjected to the fuel price variations.
Dependency on the fuel price: The fuel price is the expense that drives the cost of the plant during his life, it is variable and it is difficult to make prevision on its variation during the years.
Environmental cost: The solution with storage needs less fuel which is the origin of the pollutants and GHG emissions.
Moreover, a sensitivity analysis was carried out to analyze different possible scenarios: variation of cost of diesel prices and of load consumption, reduction of BESS Capital and Replacement costs.
This study’s results show that all the selected optimization solutions can improve the current plant. The main common aspects can be summarized as follows:
- (1)
Considering 25 years plant lifetime, hybrid configurations are more convenient in comparison with non-renewable configurations, such as the base case. In fact, the hybrid solutions have a lower NPC than the base case and that influences the COE of every configuration: the solutions with BESS vary their COE from 0.253 to 0.305 $/kWh, about 43% less than base case COE.
- (2)
Hybrid solutions are more competitive at the economic level, compared to non-renewable solutions, as well as in developing countries, with weak economies and where factors such as inflation and real interest rate are unpredictable. This kind of solutions help to save money, as reported in the economic evaluation, that could be used differently, for instance investments in local enterprises and social goods;
- (3)
Hybrid solutions enable saving fuel and hence reduction of local pollution, responsible for health problems, especially at a domestic level. Greenhouse gas emissions savings of tens to hundreds of tons of CO2 every year, compared with alternative solutions based on fossil fuels, could be achieved. Thus, overall, the use and diffusion of renewable energy in developing countries, instead of traditional energy systems, represents a strong contribution to reach the objectives of greenhouse emission reduction, set by the international community in the COP21 of Paris.
Given the fast decrease in prices of renewable technologies and storage, this study further proves that new off-grid solutions can be conceived from the beginning as relying on renewable energy only. In this case, the possible use of traditional generators would be as a back-up only, in the case of extraordinary maintenance, exceptionally long periods of low irradiation or temporary high demand.

 ,
, 


