Investigation of a Diesel-Engined Vehicle’s Performance and Emissions during the WLTC Driving Cycle—Comparison with the NEDC


Abstract
:1. Introduction
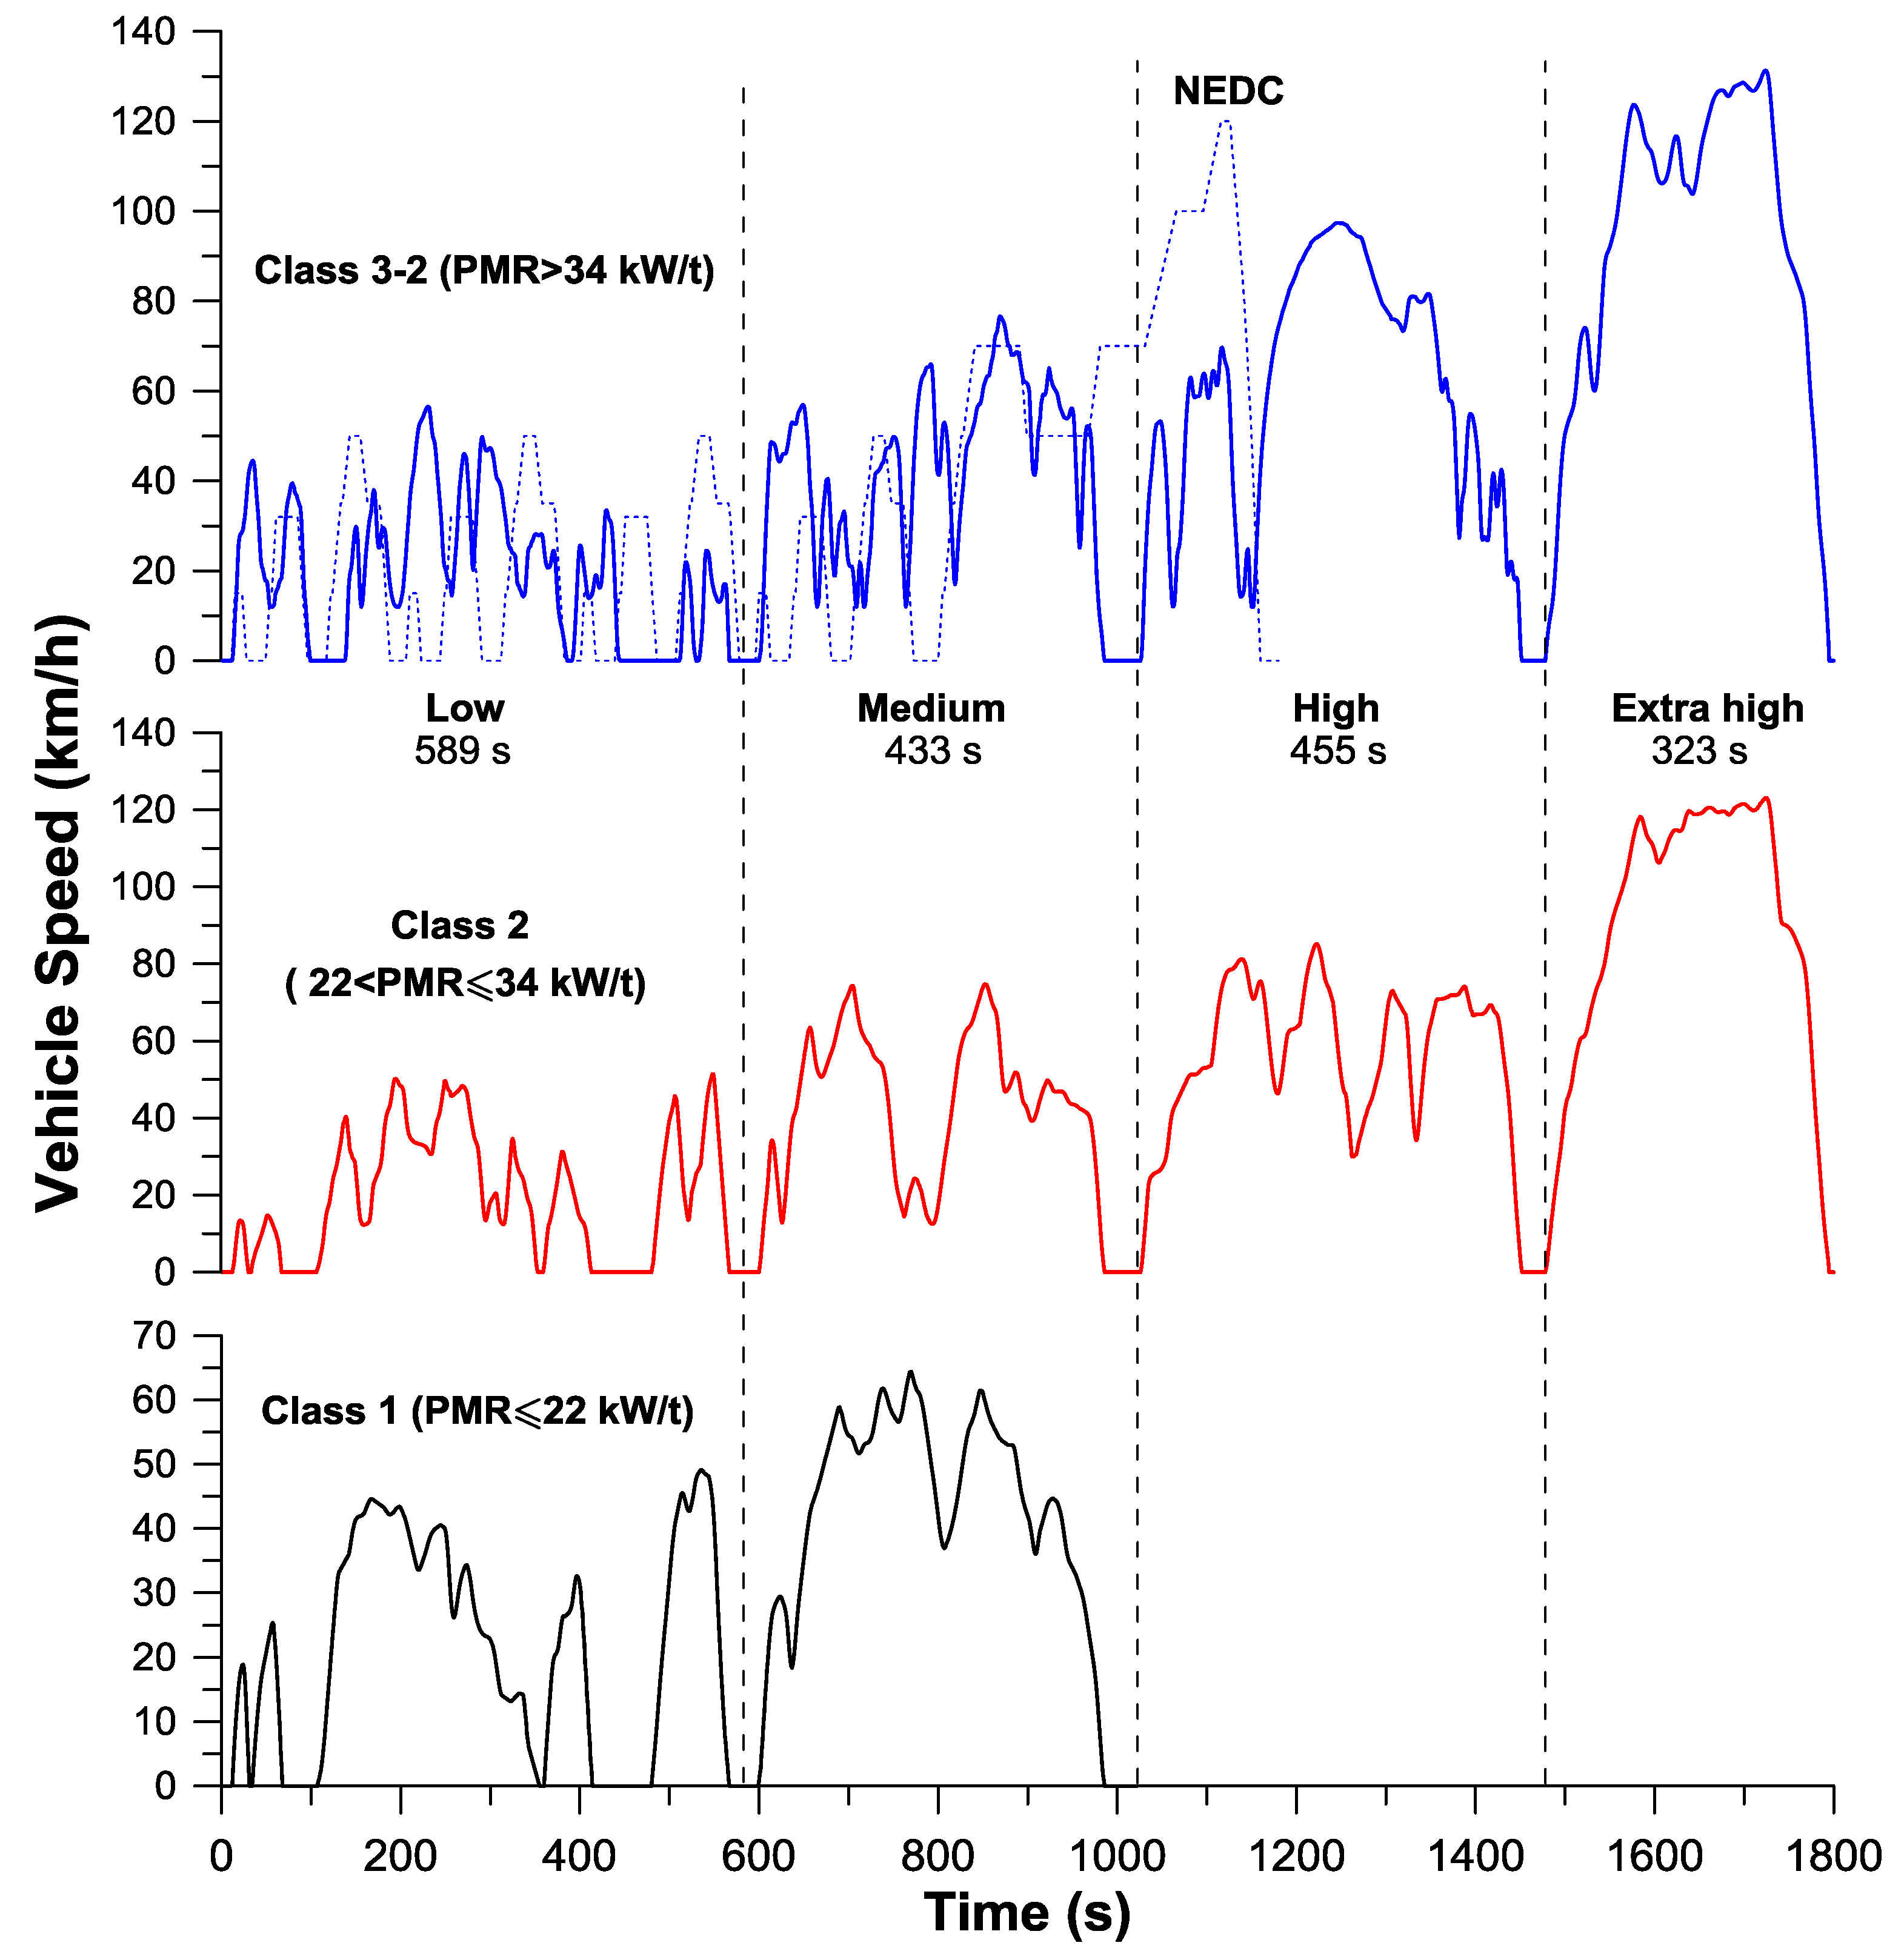
2. The WLTC and the NEDC Driving Cycles
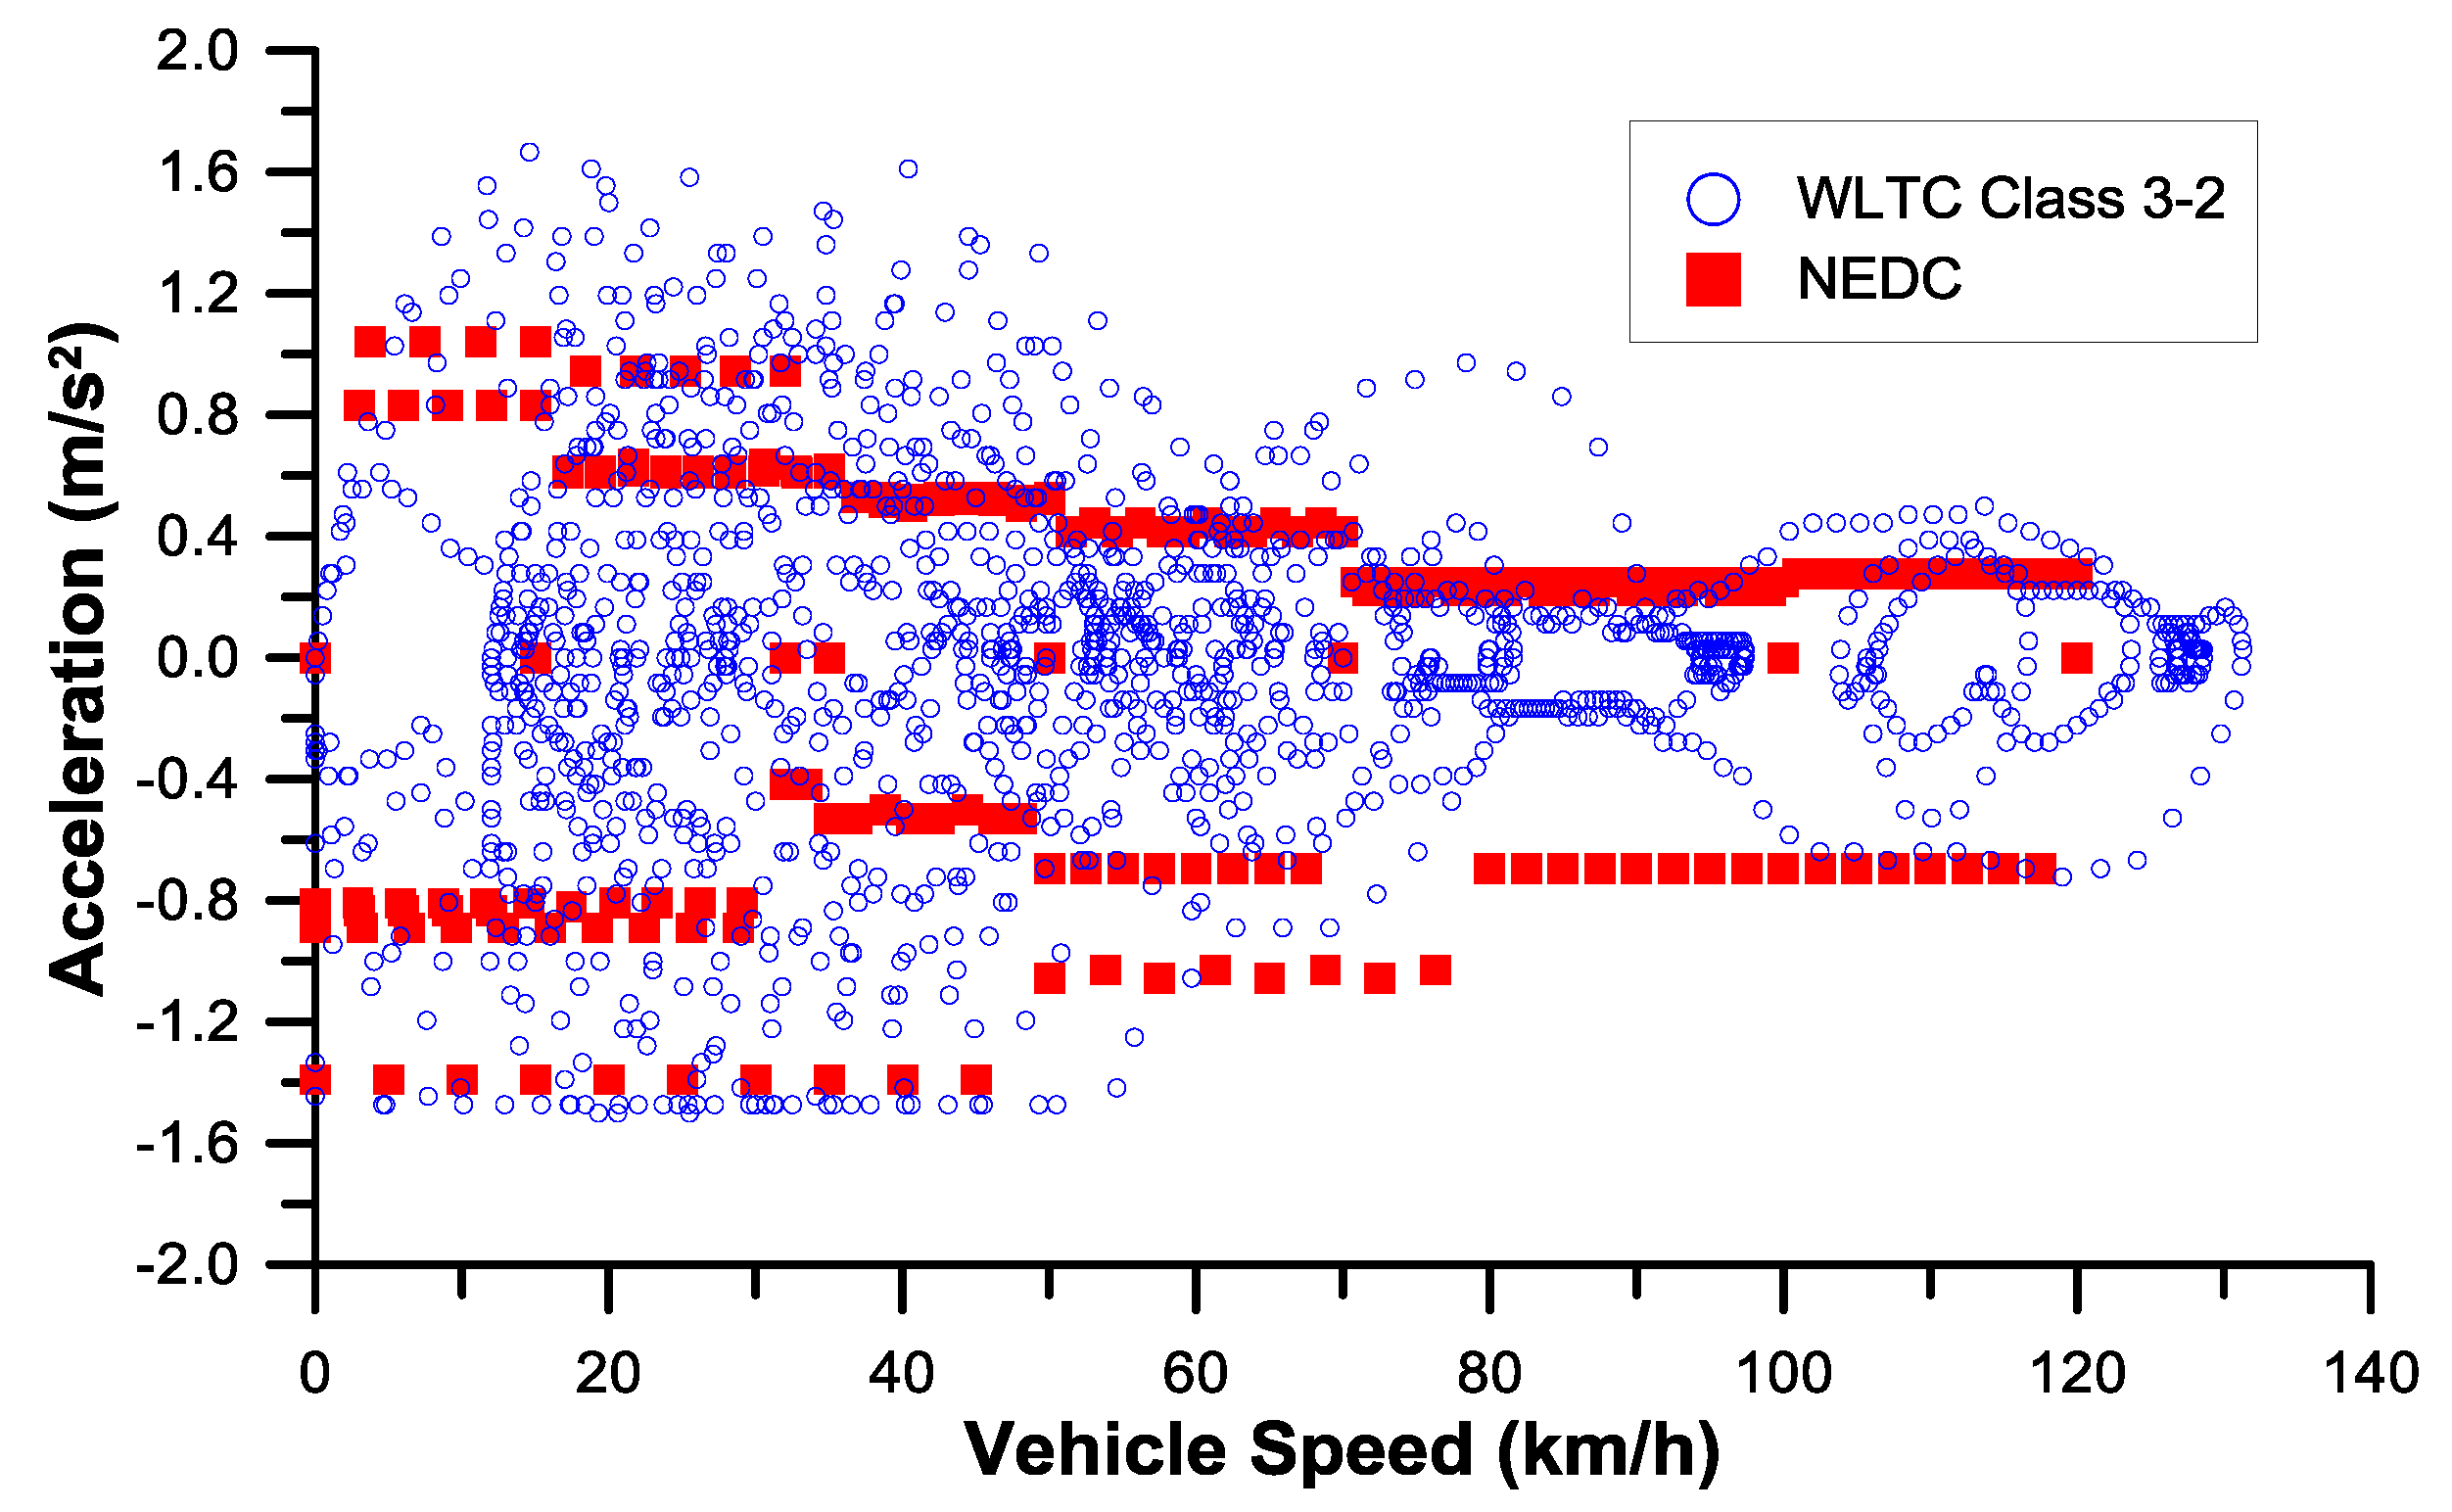
Comparison between the WLTC and the NEDC
3. Methodology
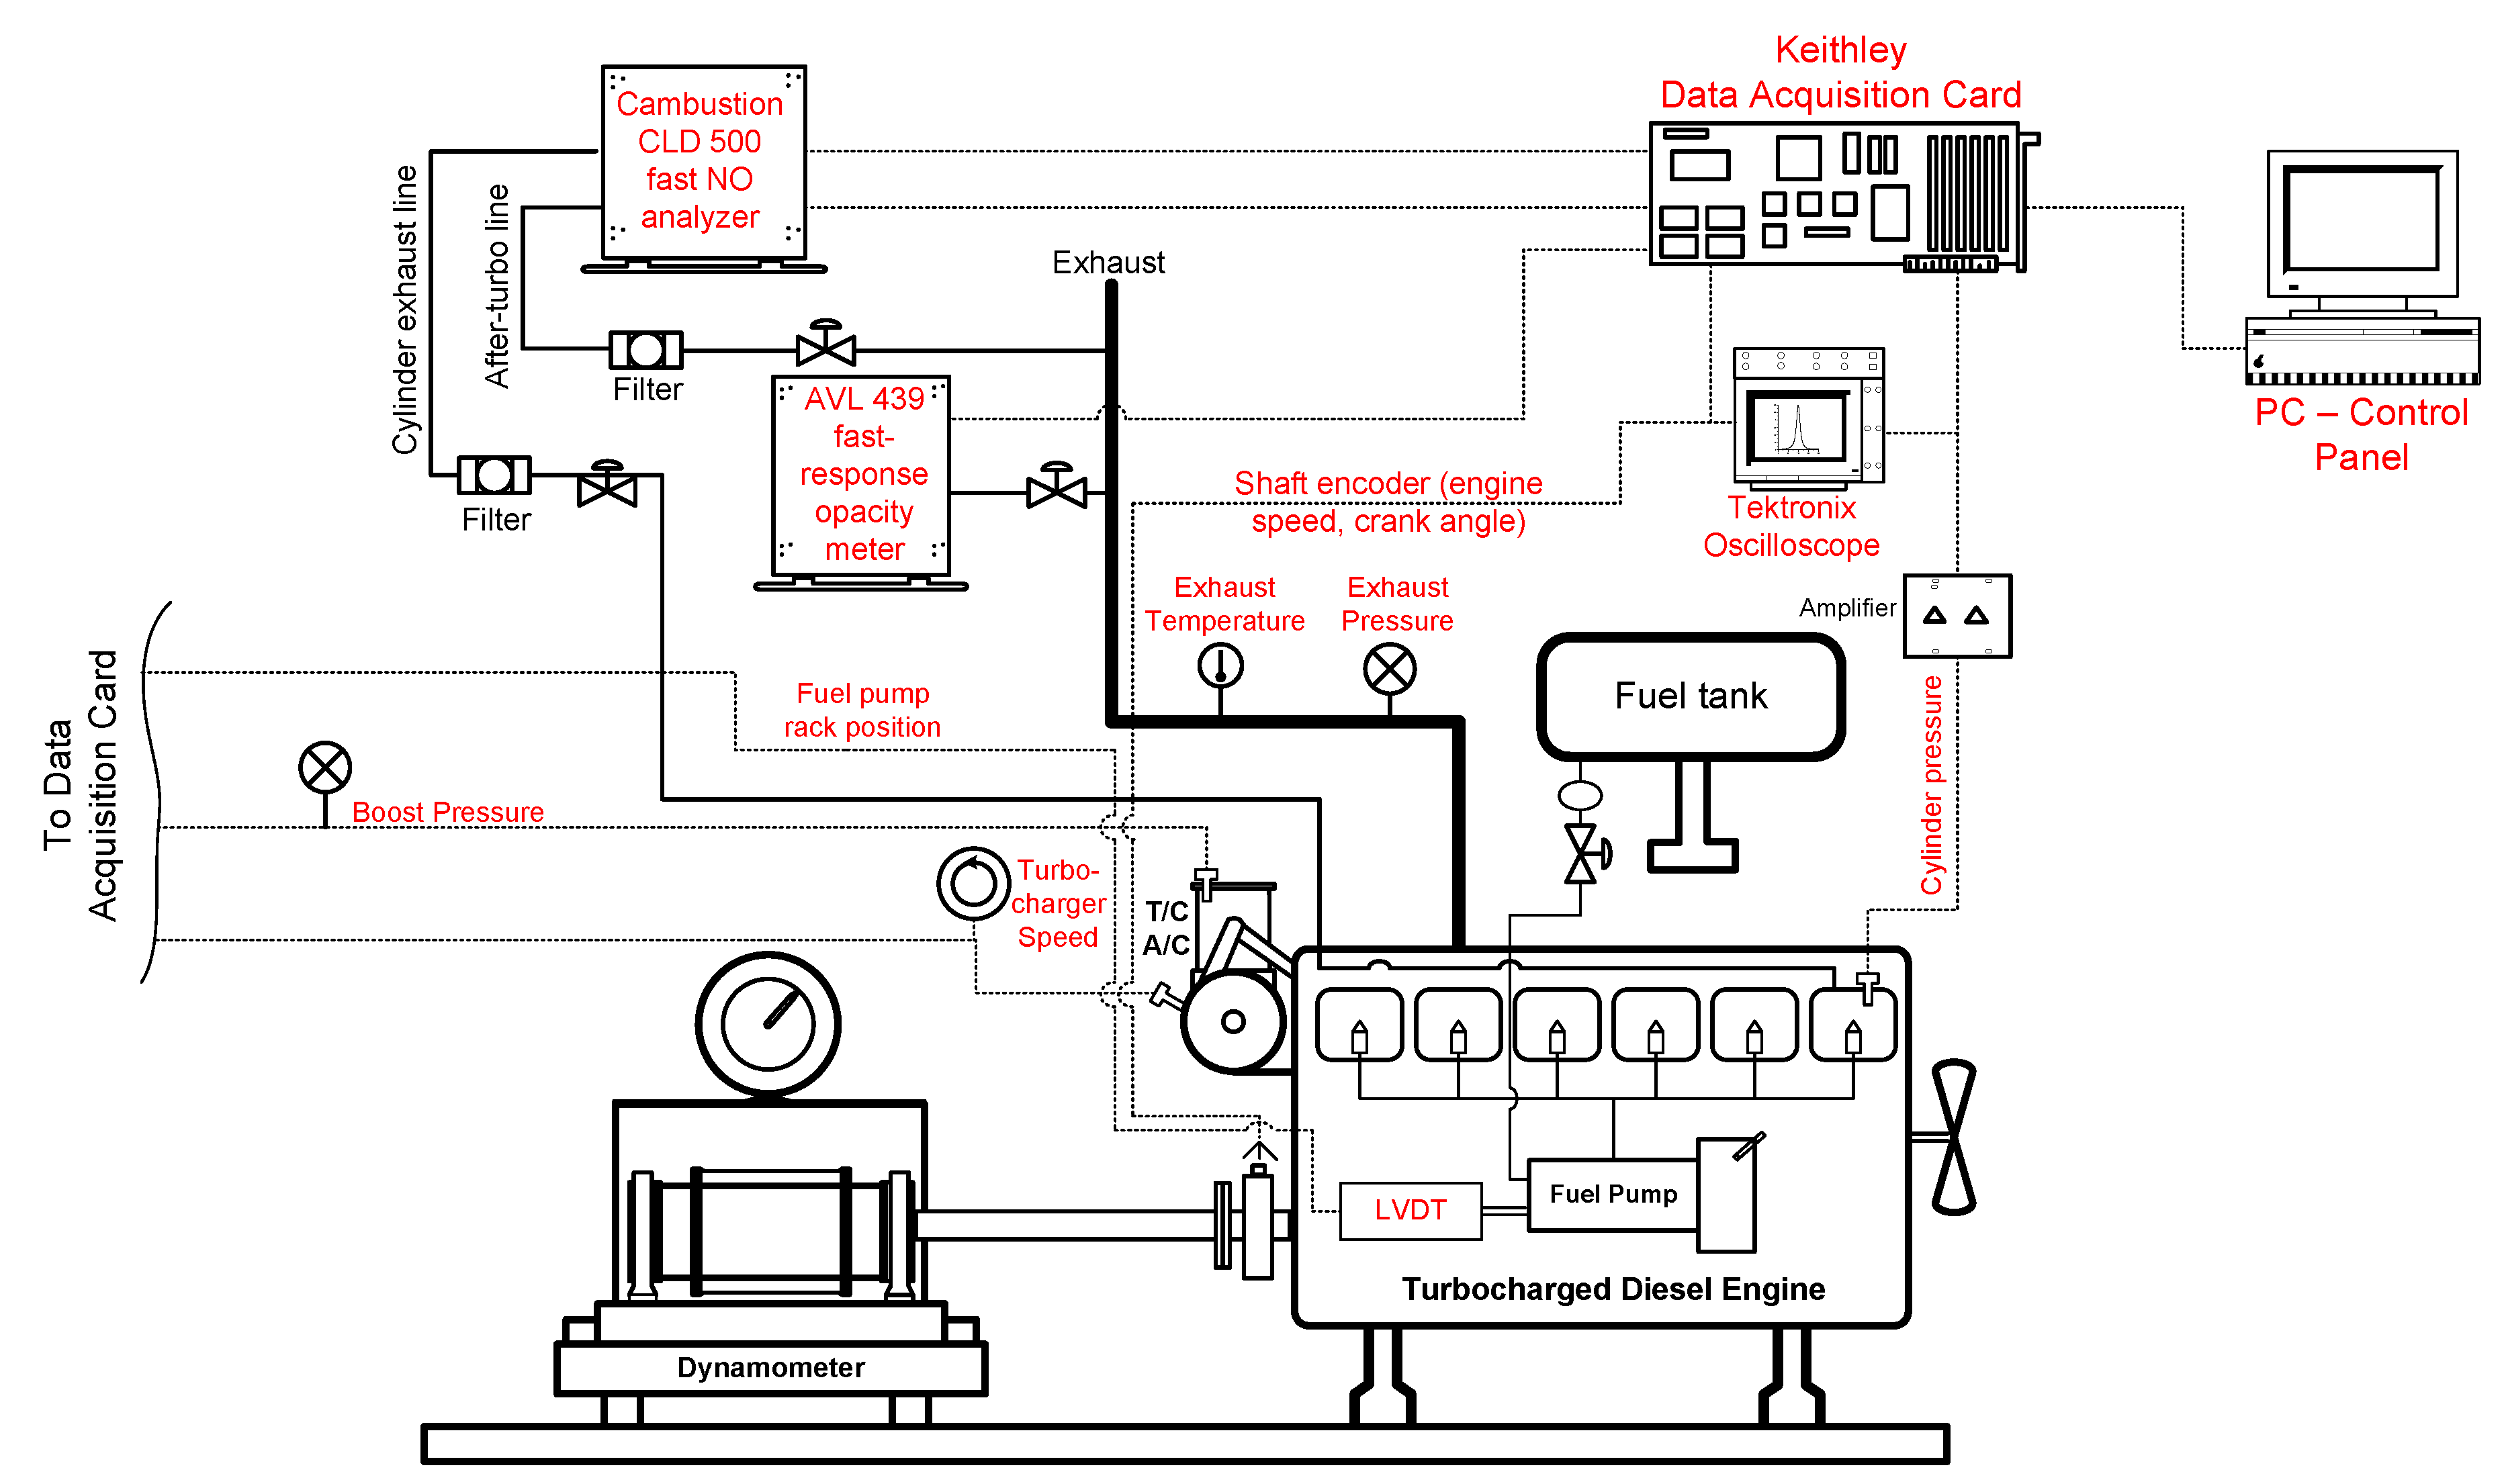
3.1. Description of the Experimental Procedure
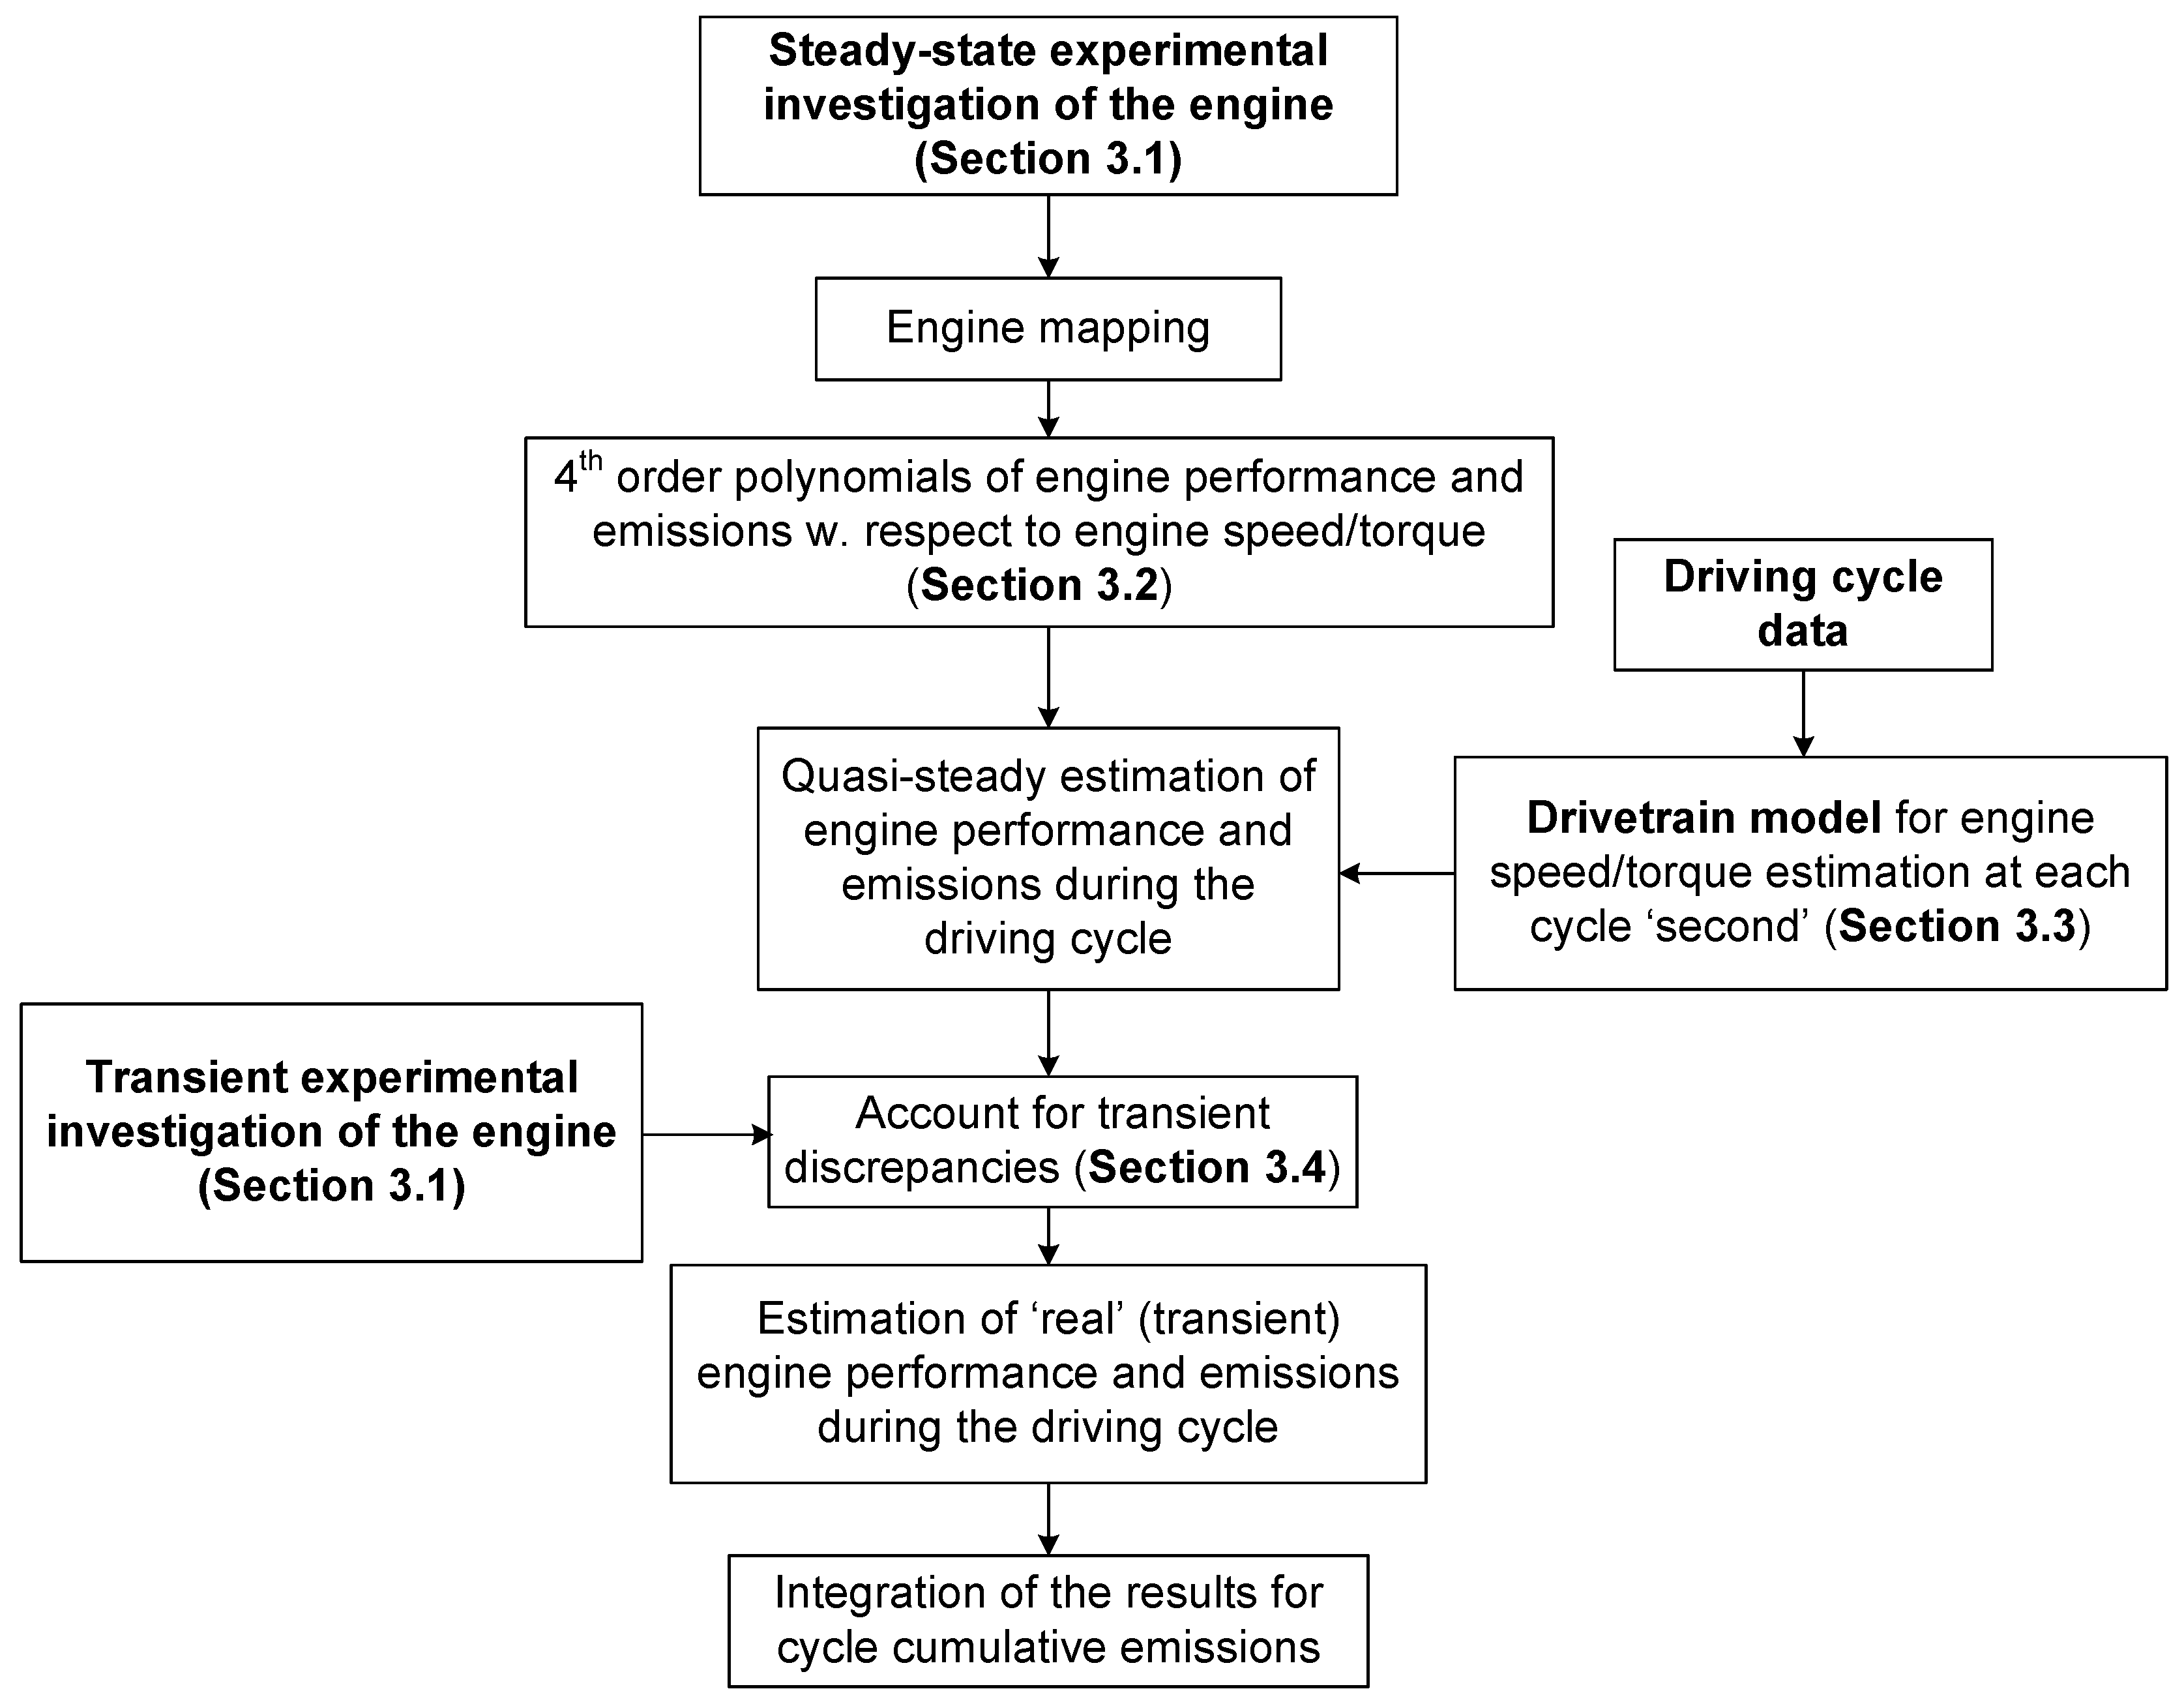
3.2. Description of the Computational Procedure
- (a)
- From the vehicle speed, which is the input in this study, the actual engine speed and torque are calculated employing the drive-train analysis that will be presented in Section 3.3;
- (b)
- An interpolation is performed from the digitized engine map in order to assess the corresponding steady-state emissions and fueling at the exact engine speed and load operating point;
- (c)
- Correction coefficients detailed in Section 3.4 are then applied to the steady-state emissions of the previous step in order to evaluate the “real” transient emissions; the coefficients are based on the specific transient condition (speed and/or load increase) experienced by the engine.
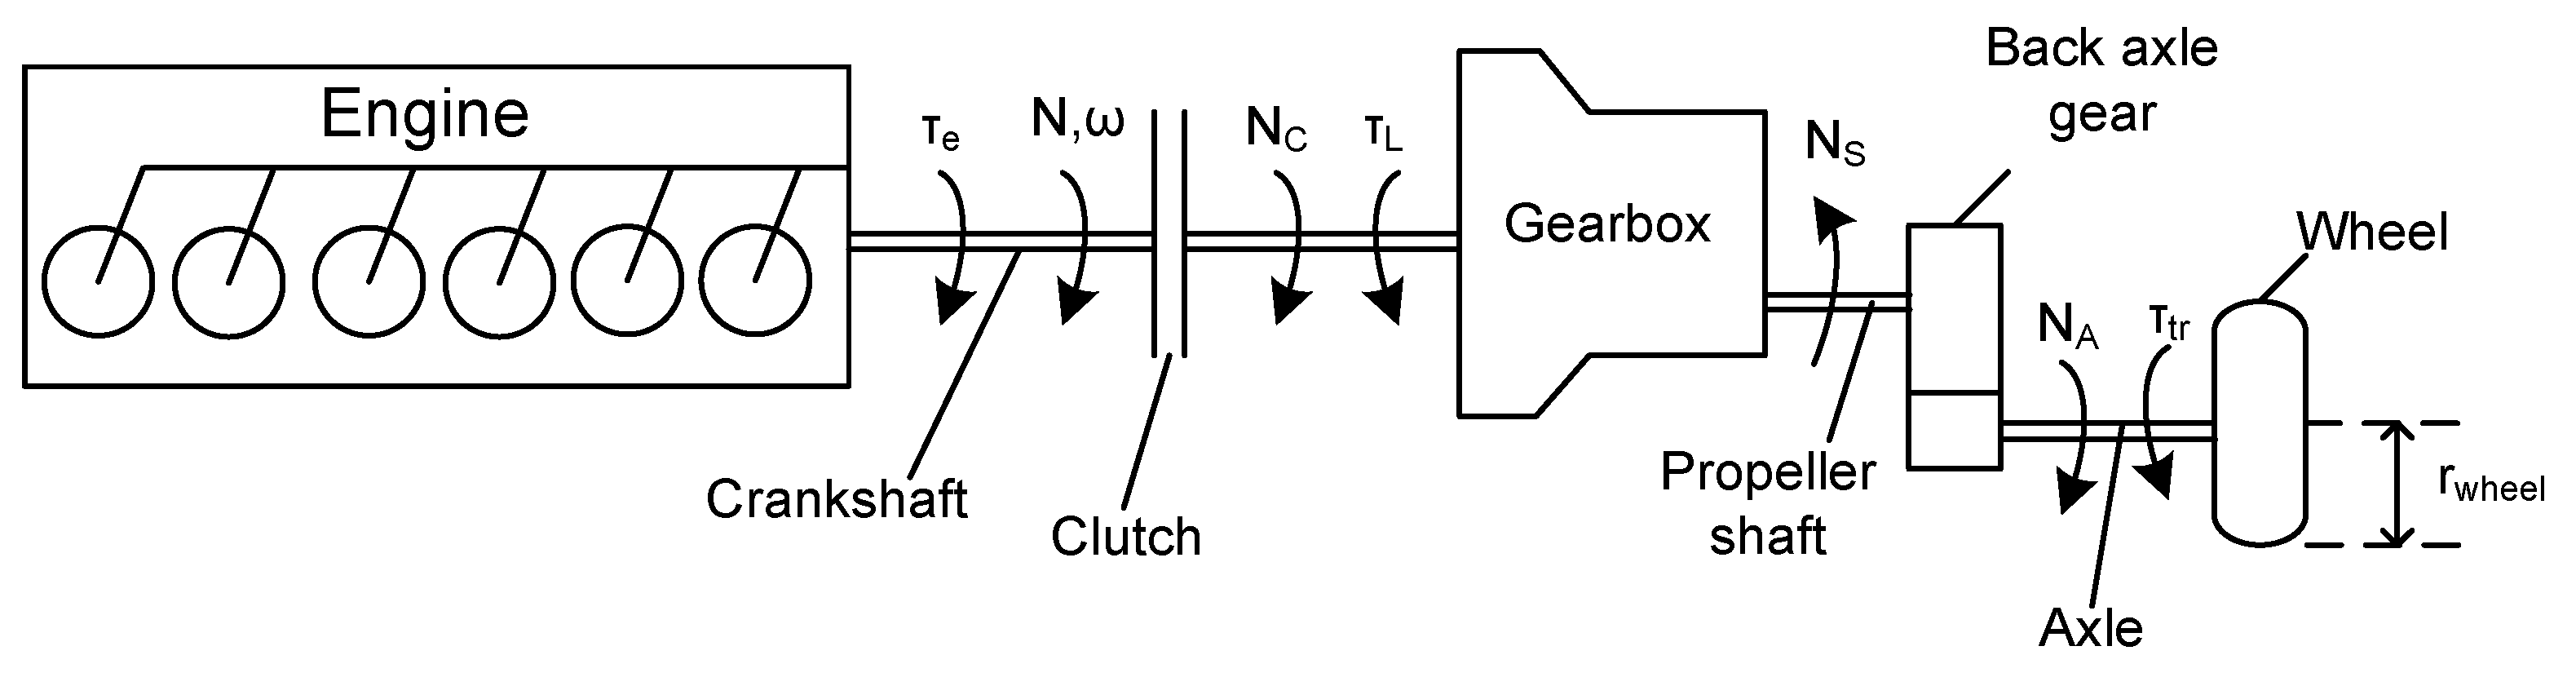
3.3. Drive-Train Analysis
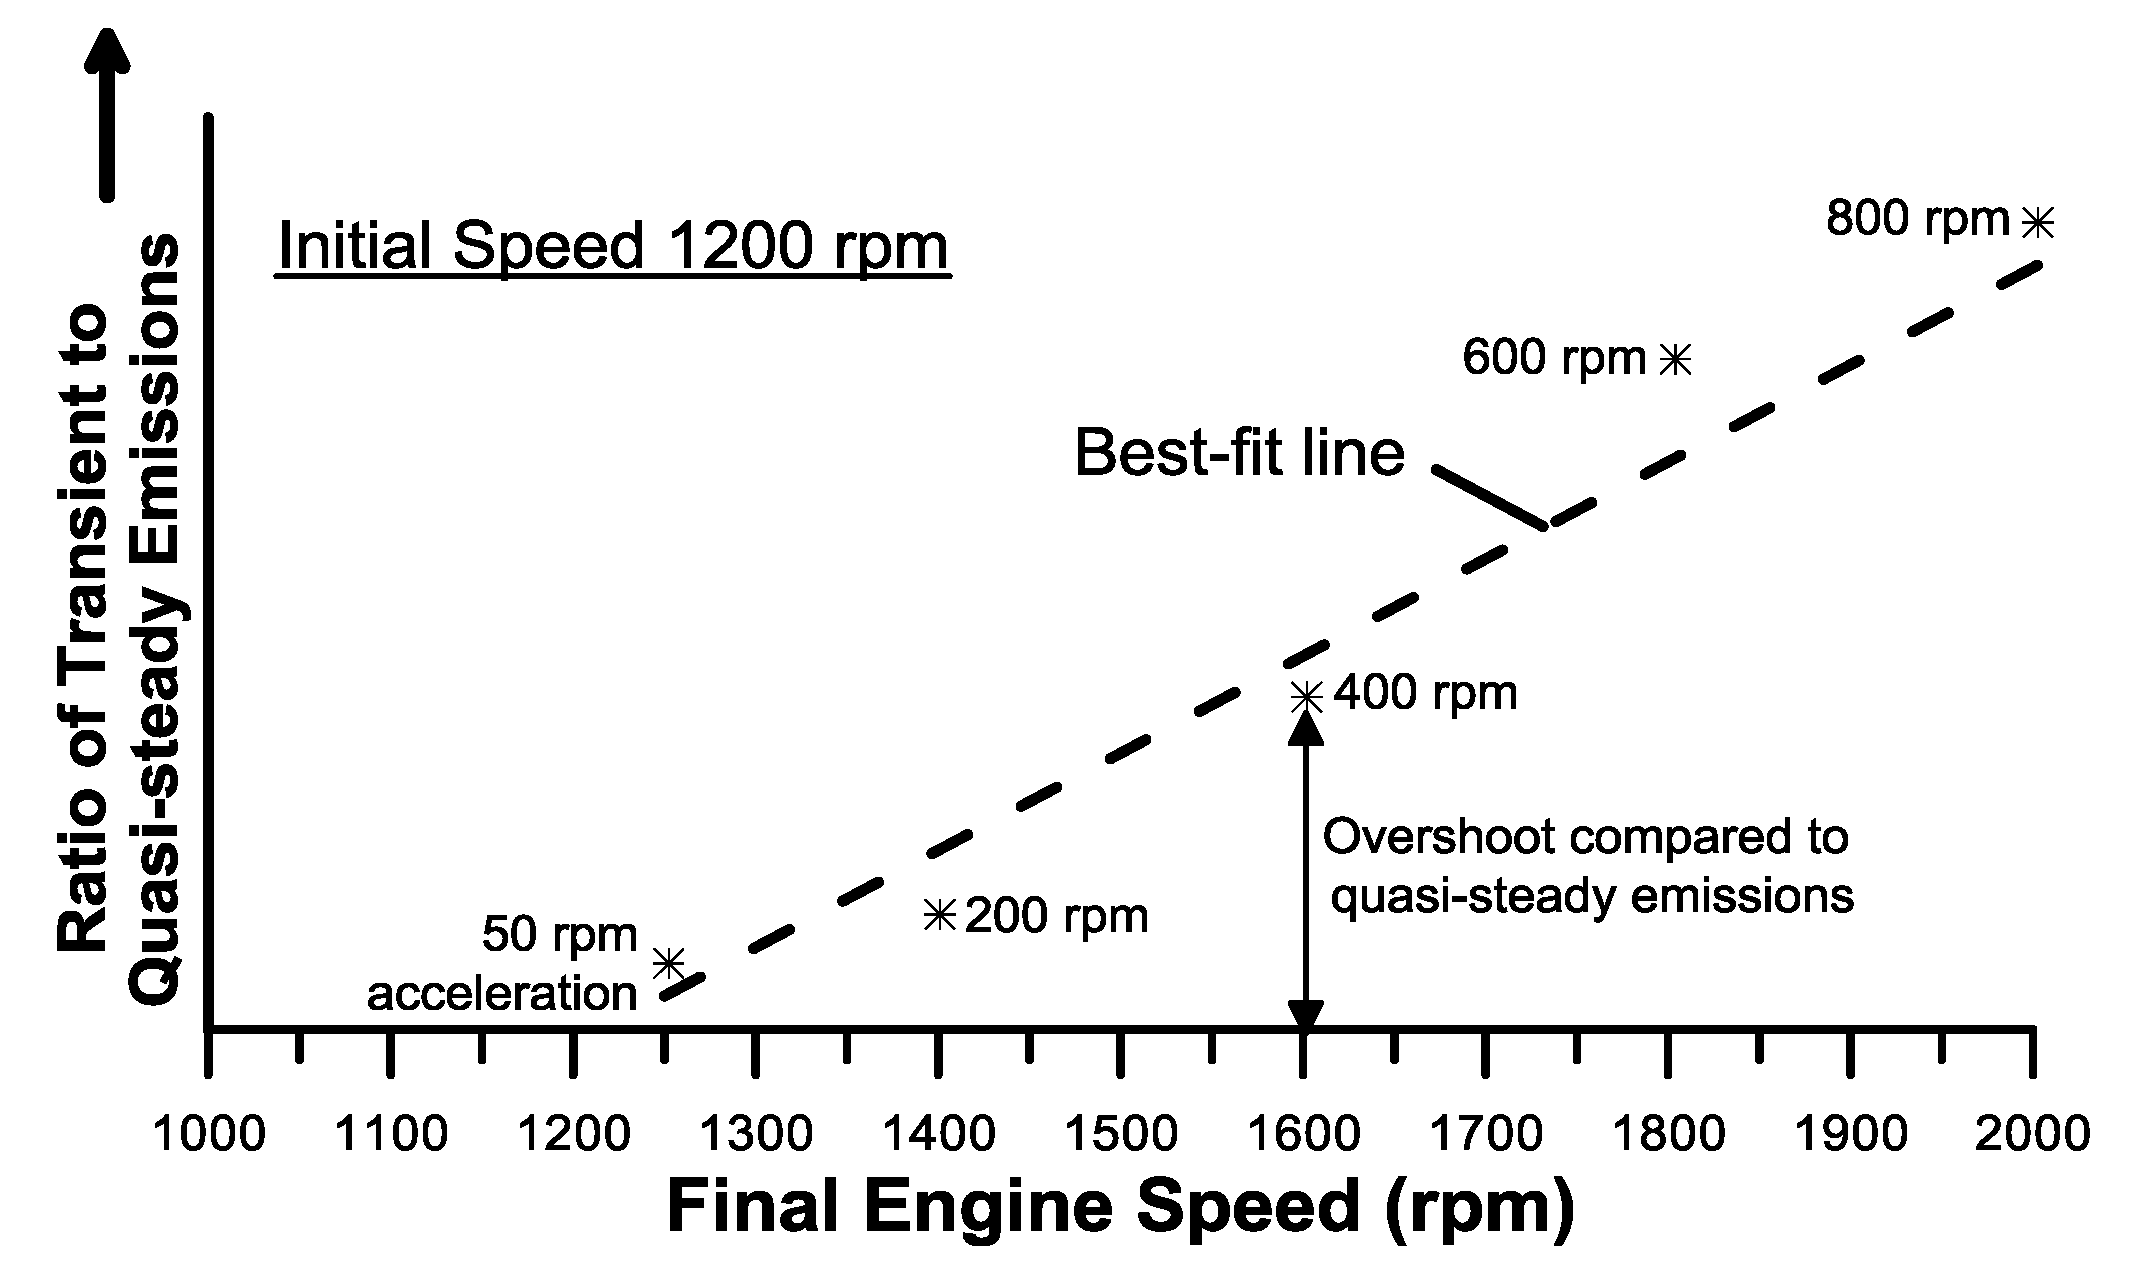
3.4. Discrepancies during Transient Operation
- (a)
- The transient emission overshoot is higher at lower initial speeds or loads (a lower initial turbocharger boost pressure results in “harsher” turbocharger lag);
- (b)
- The transient emission overshoot is higher at steeper accelerations.
4. Results and Discussion
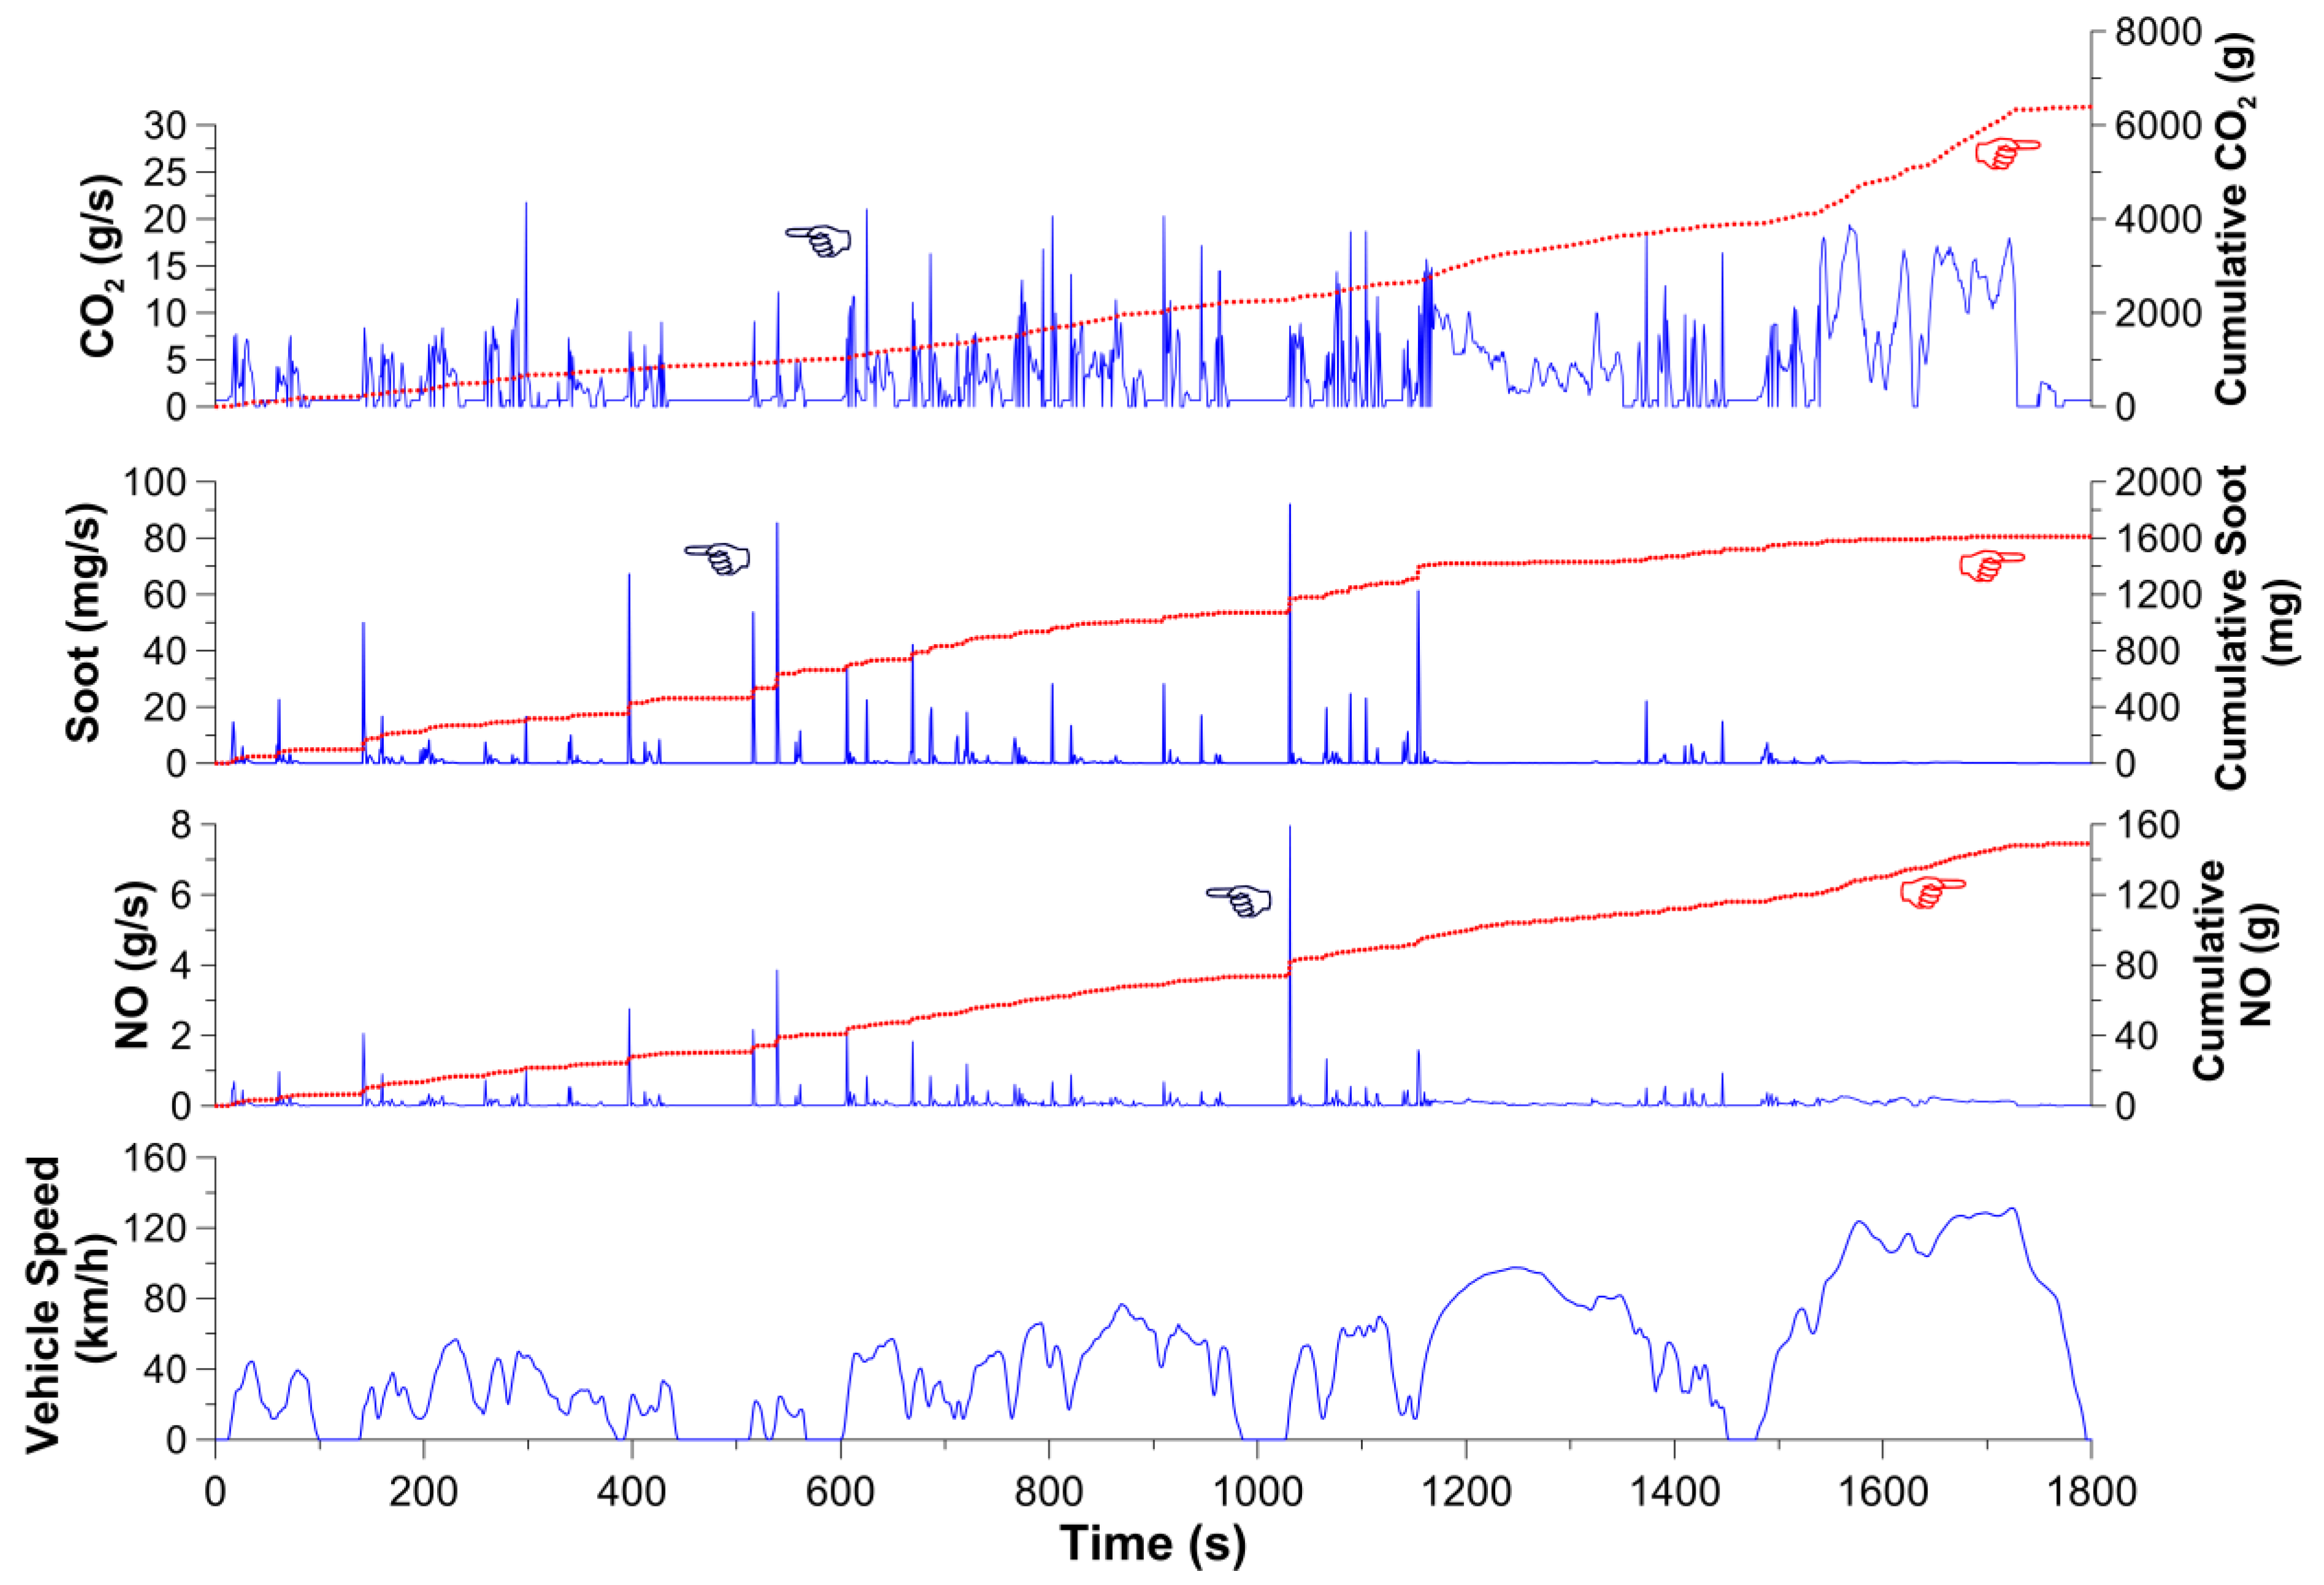
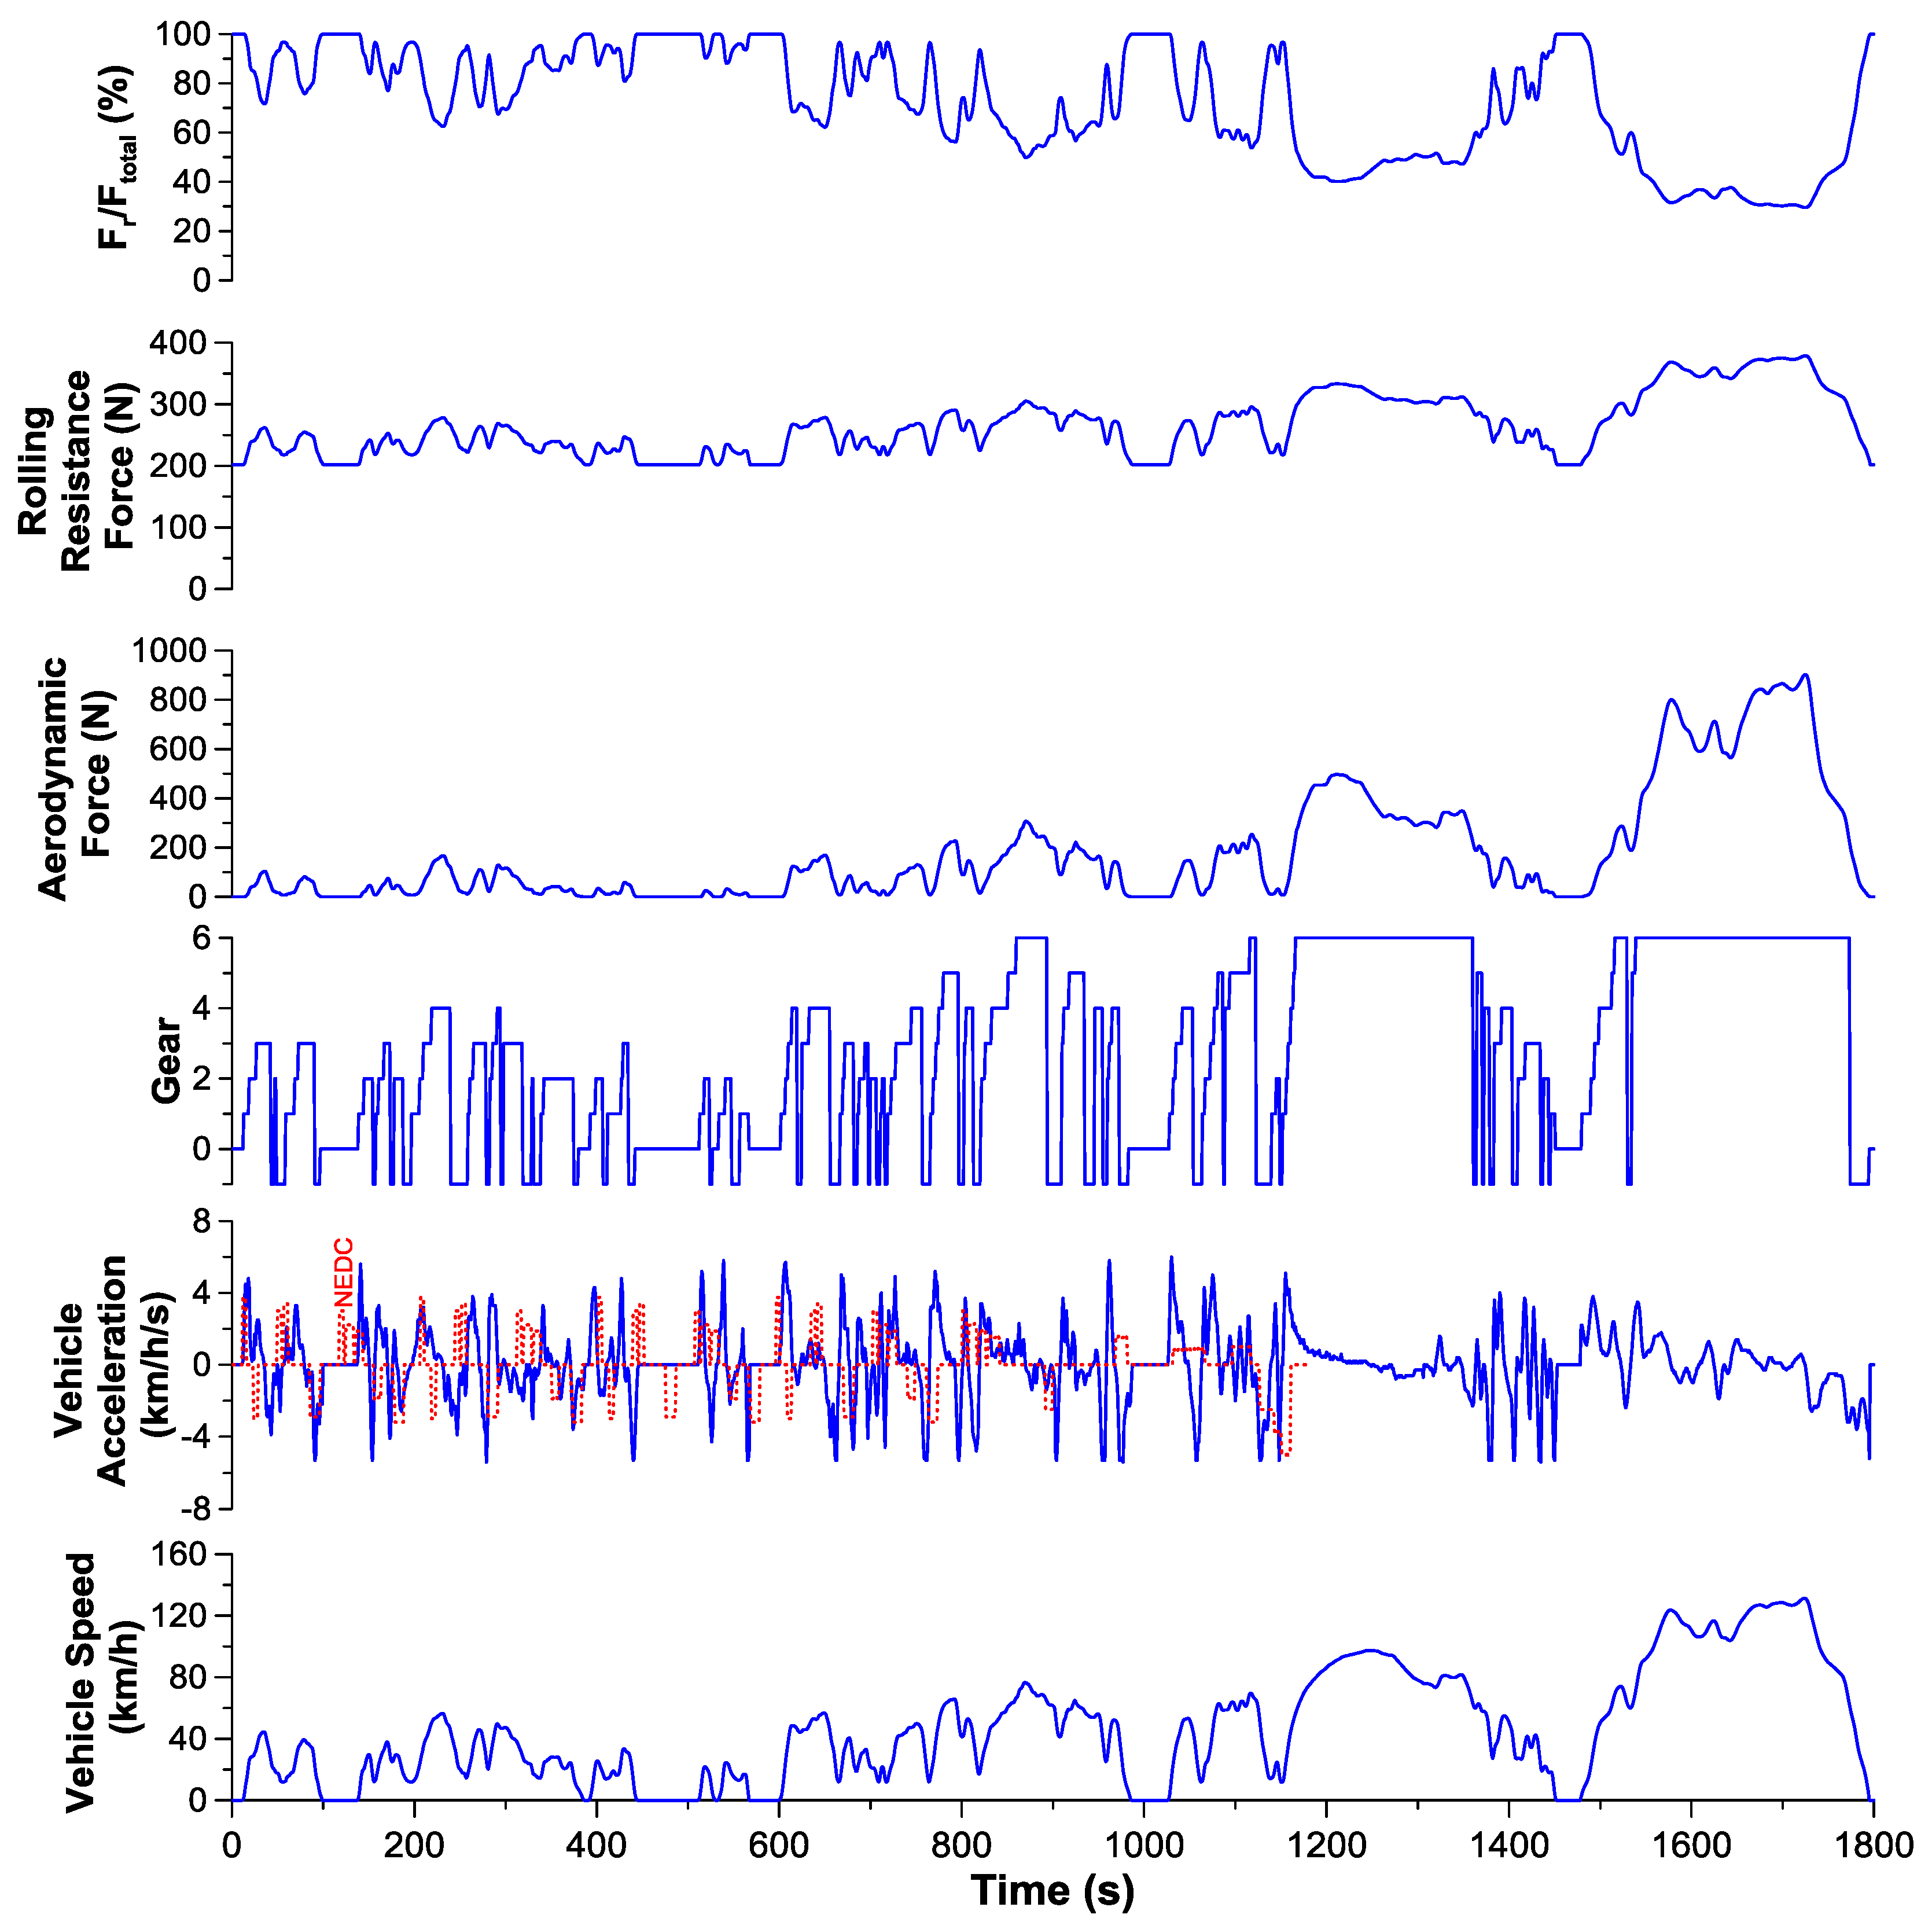
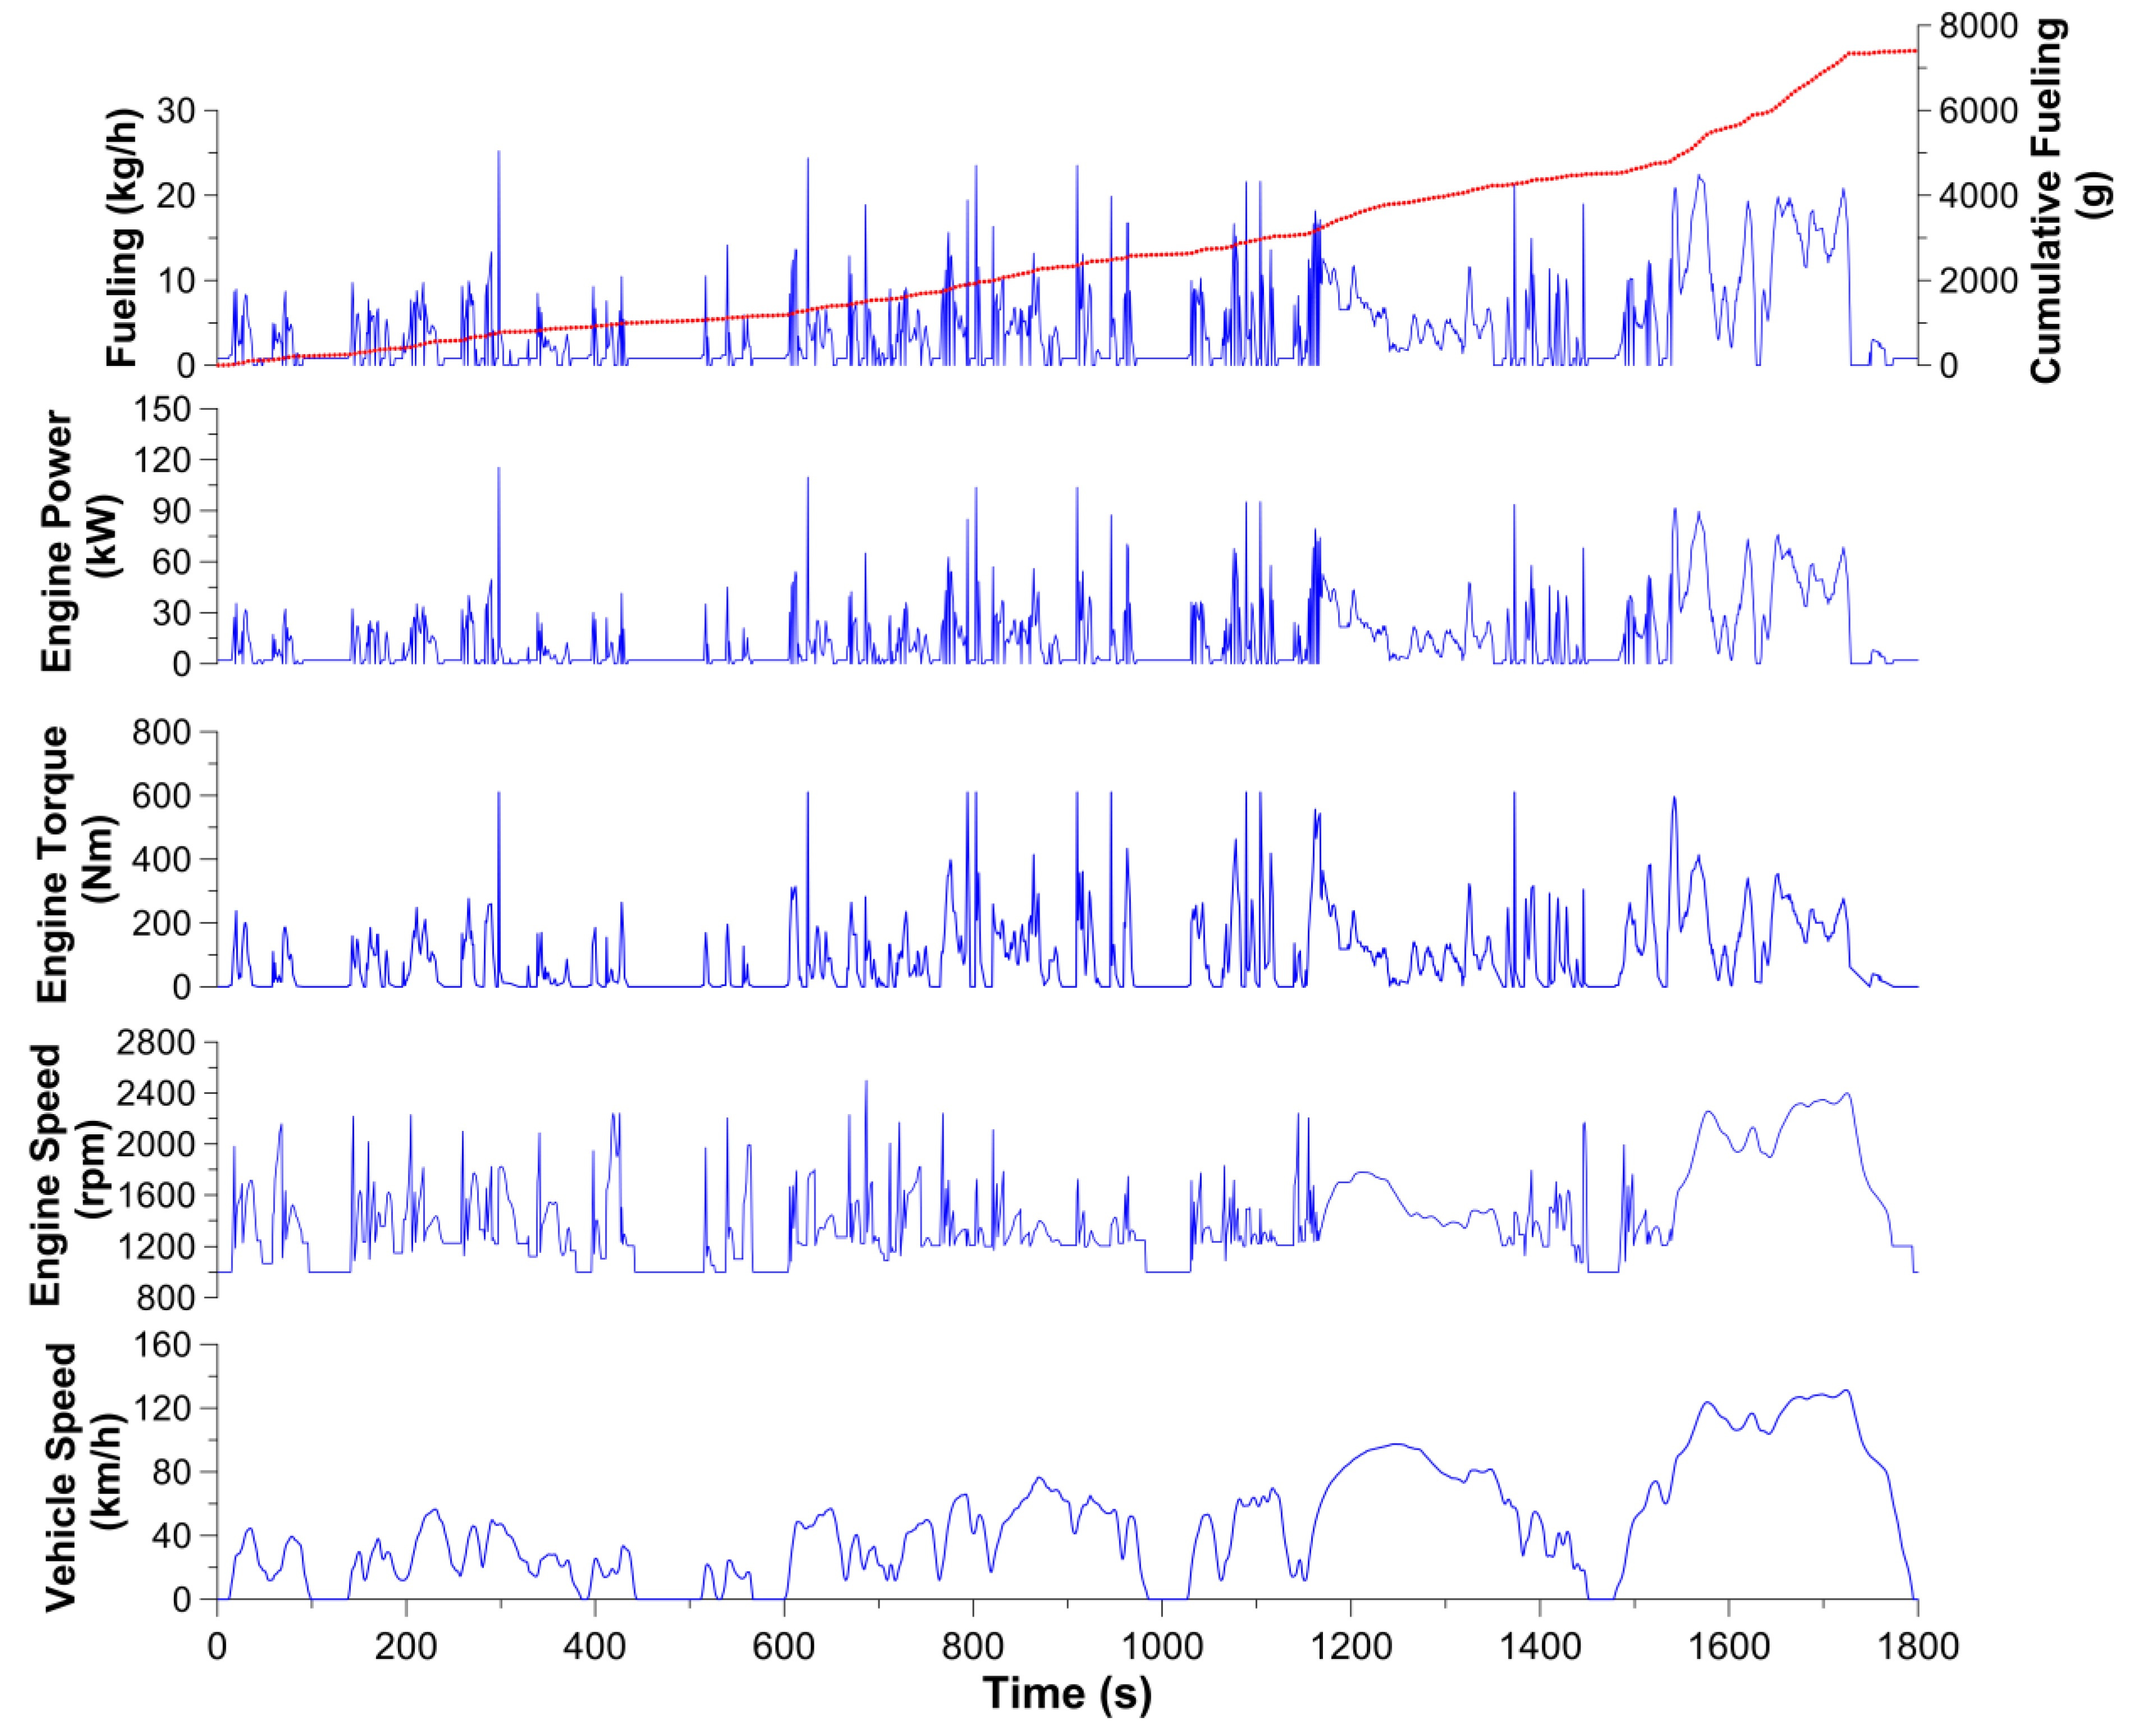
4.1. WLTC Results
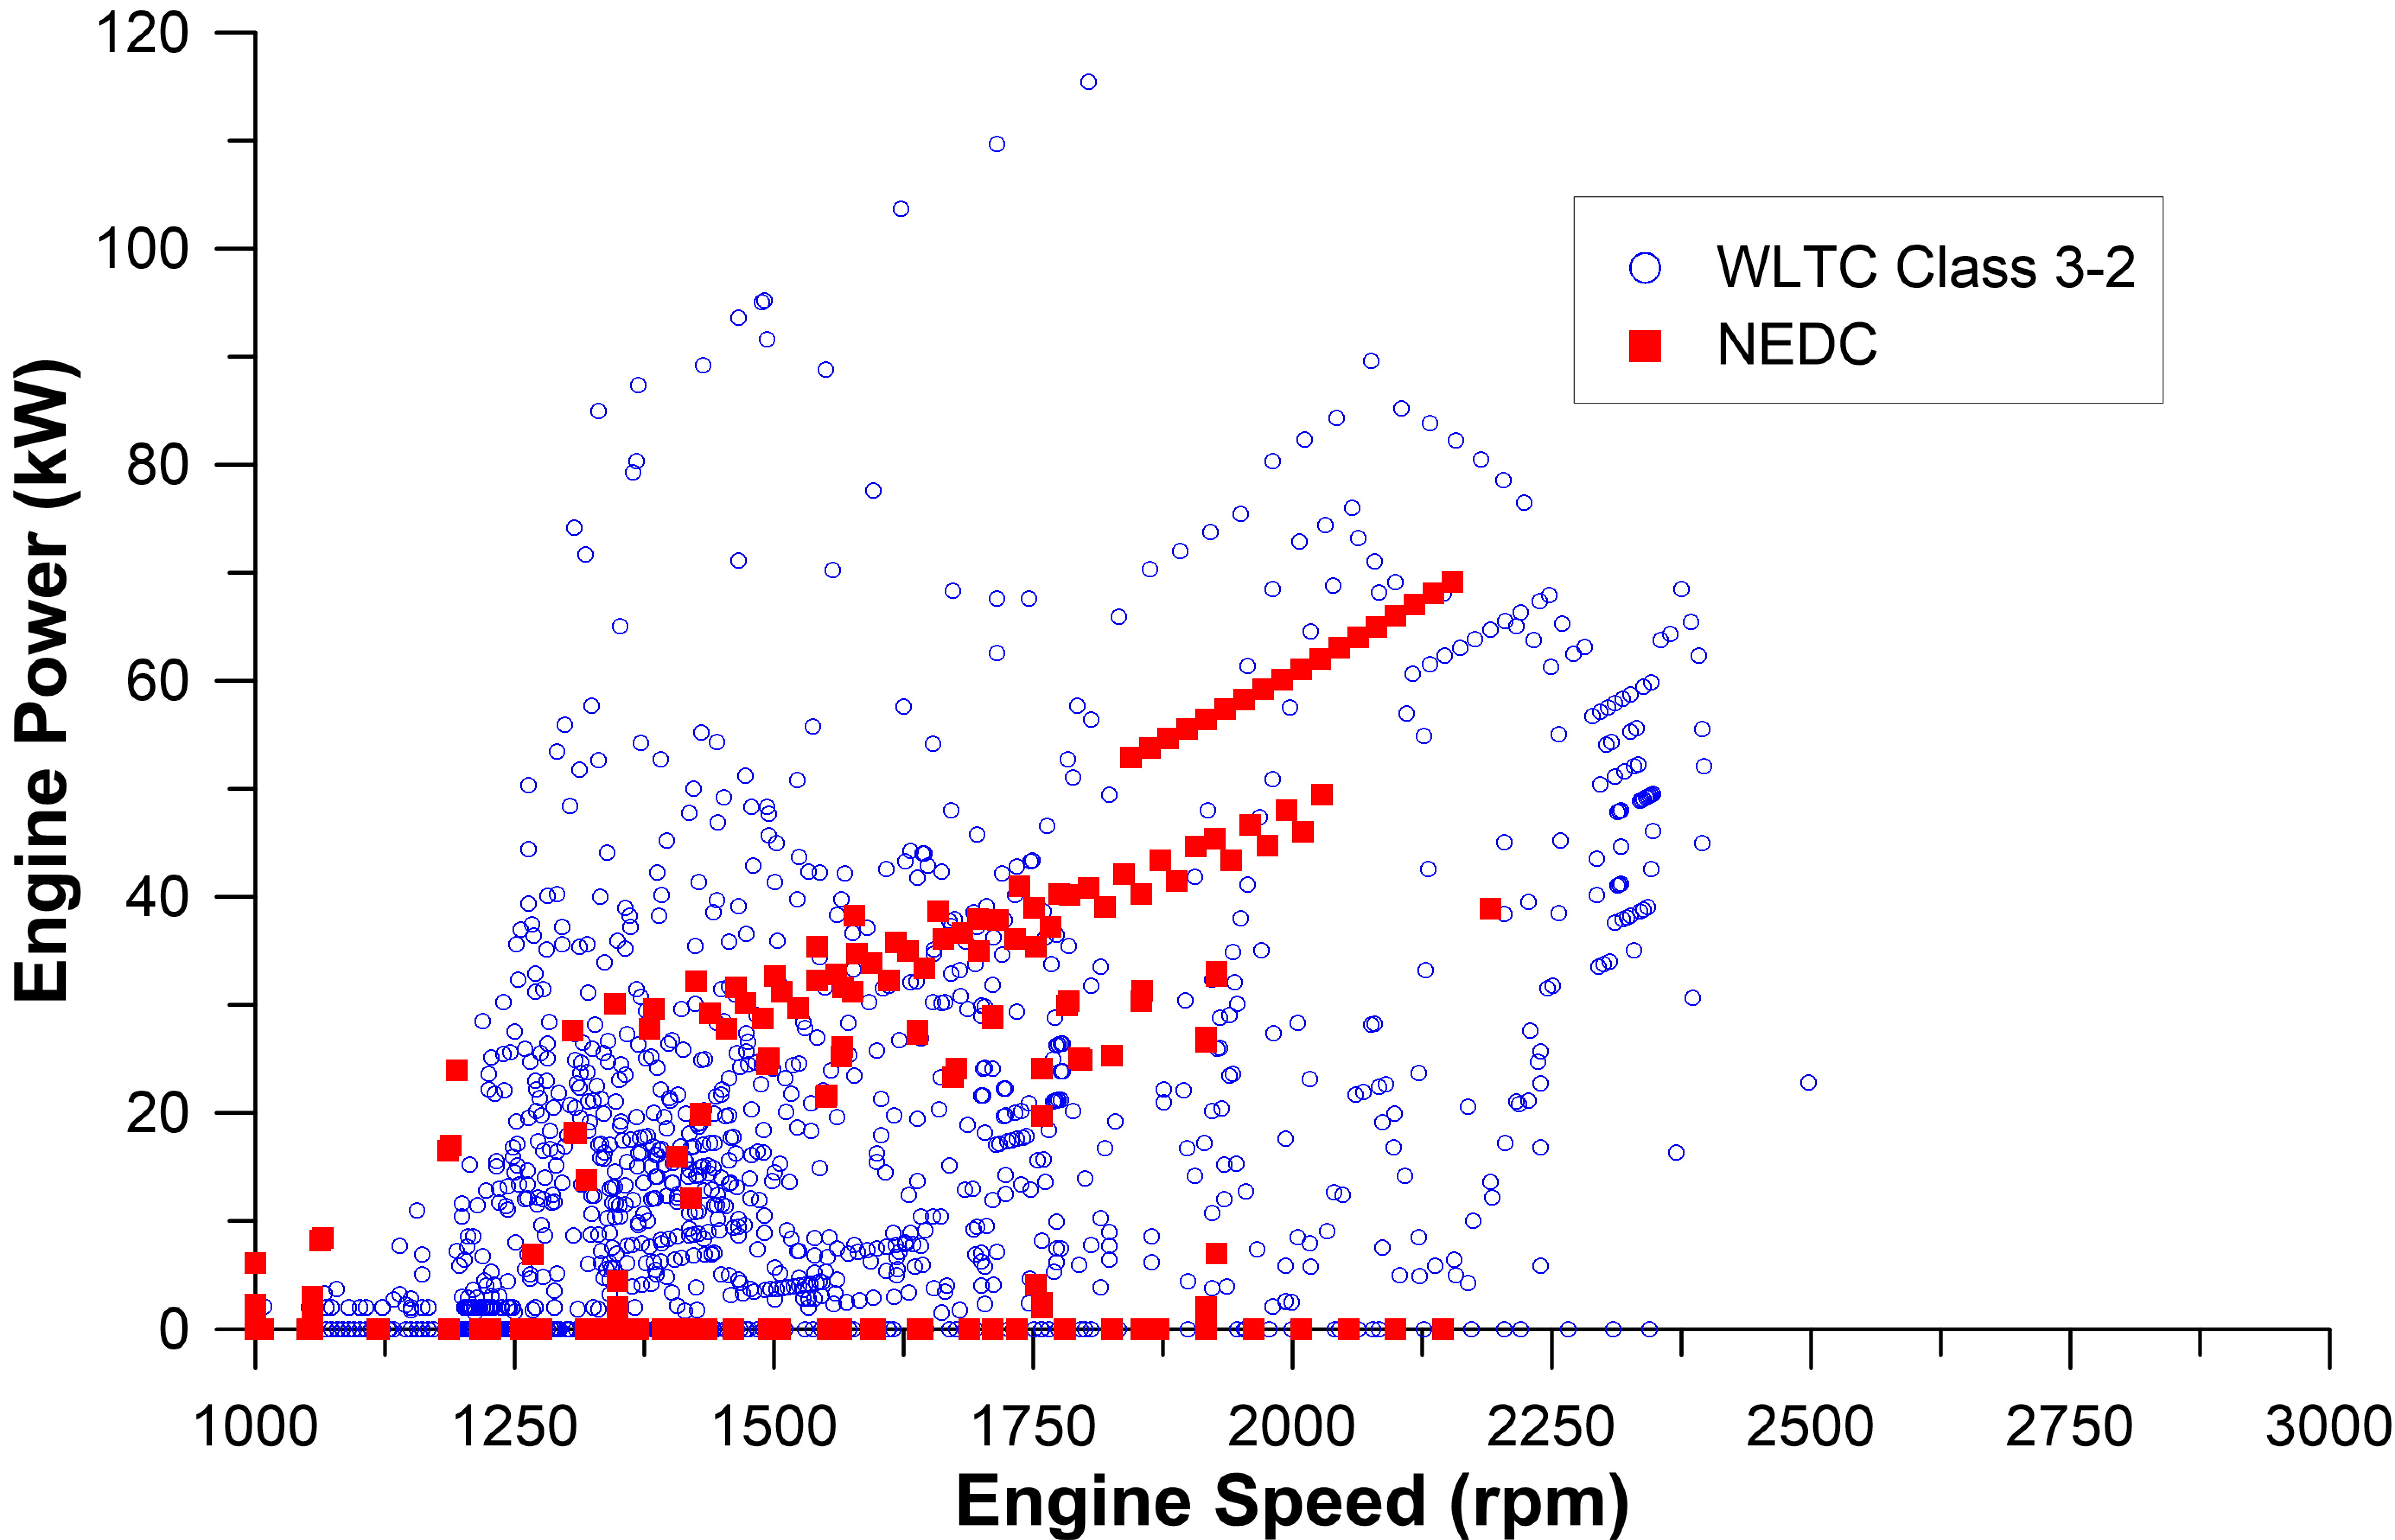
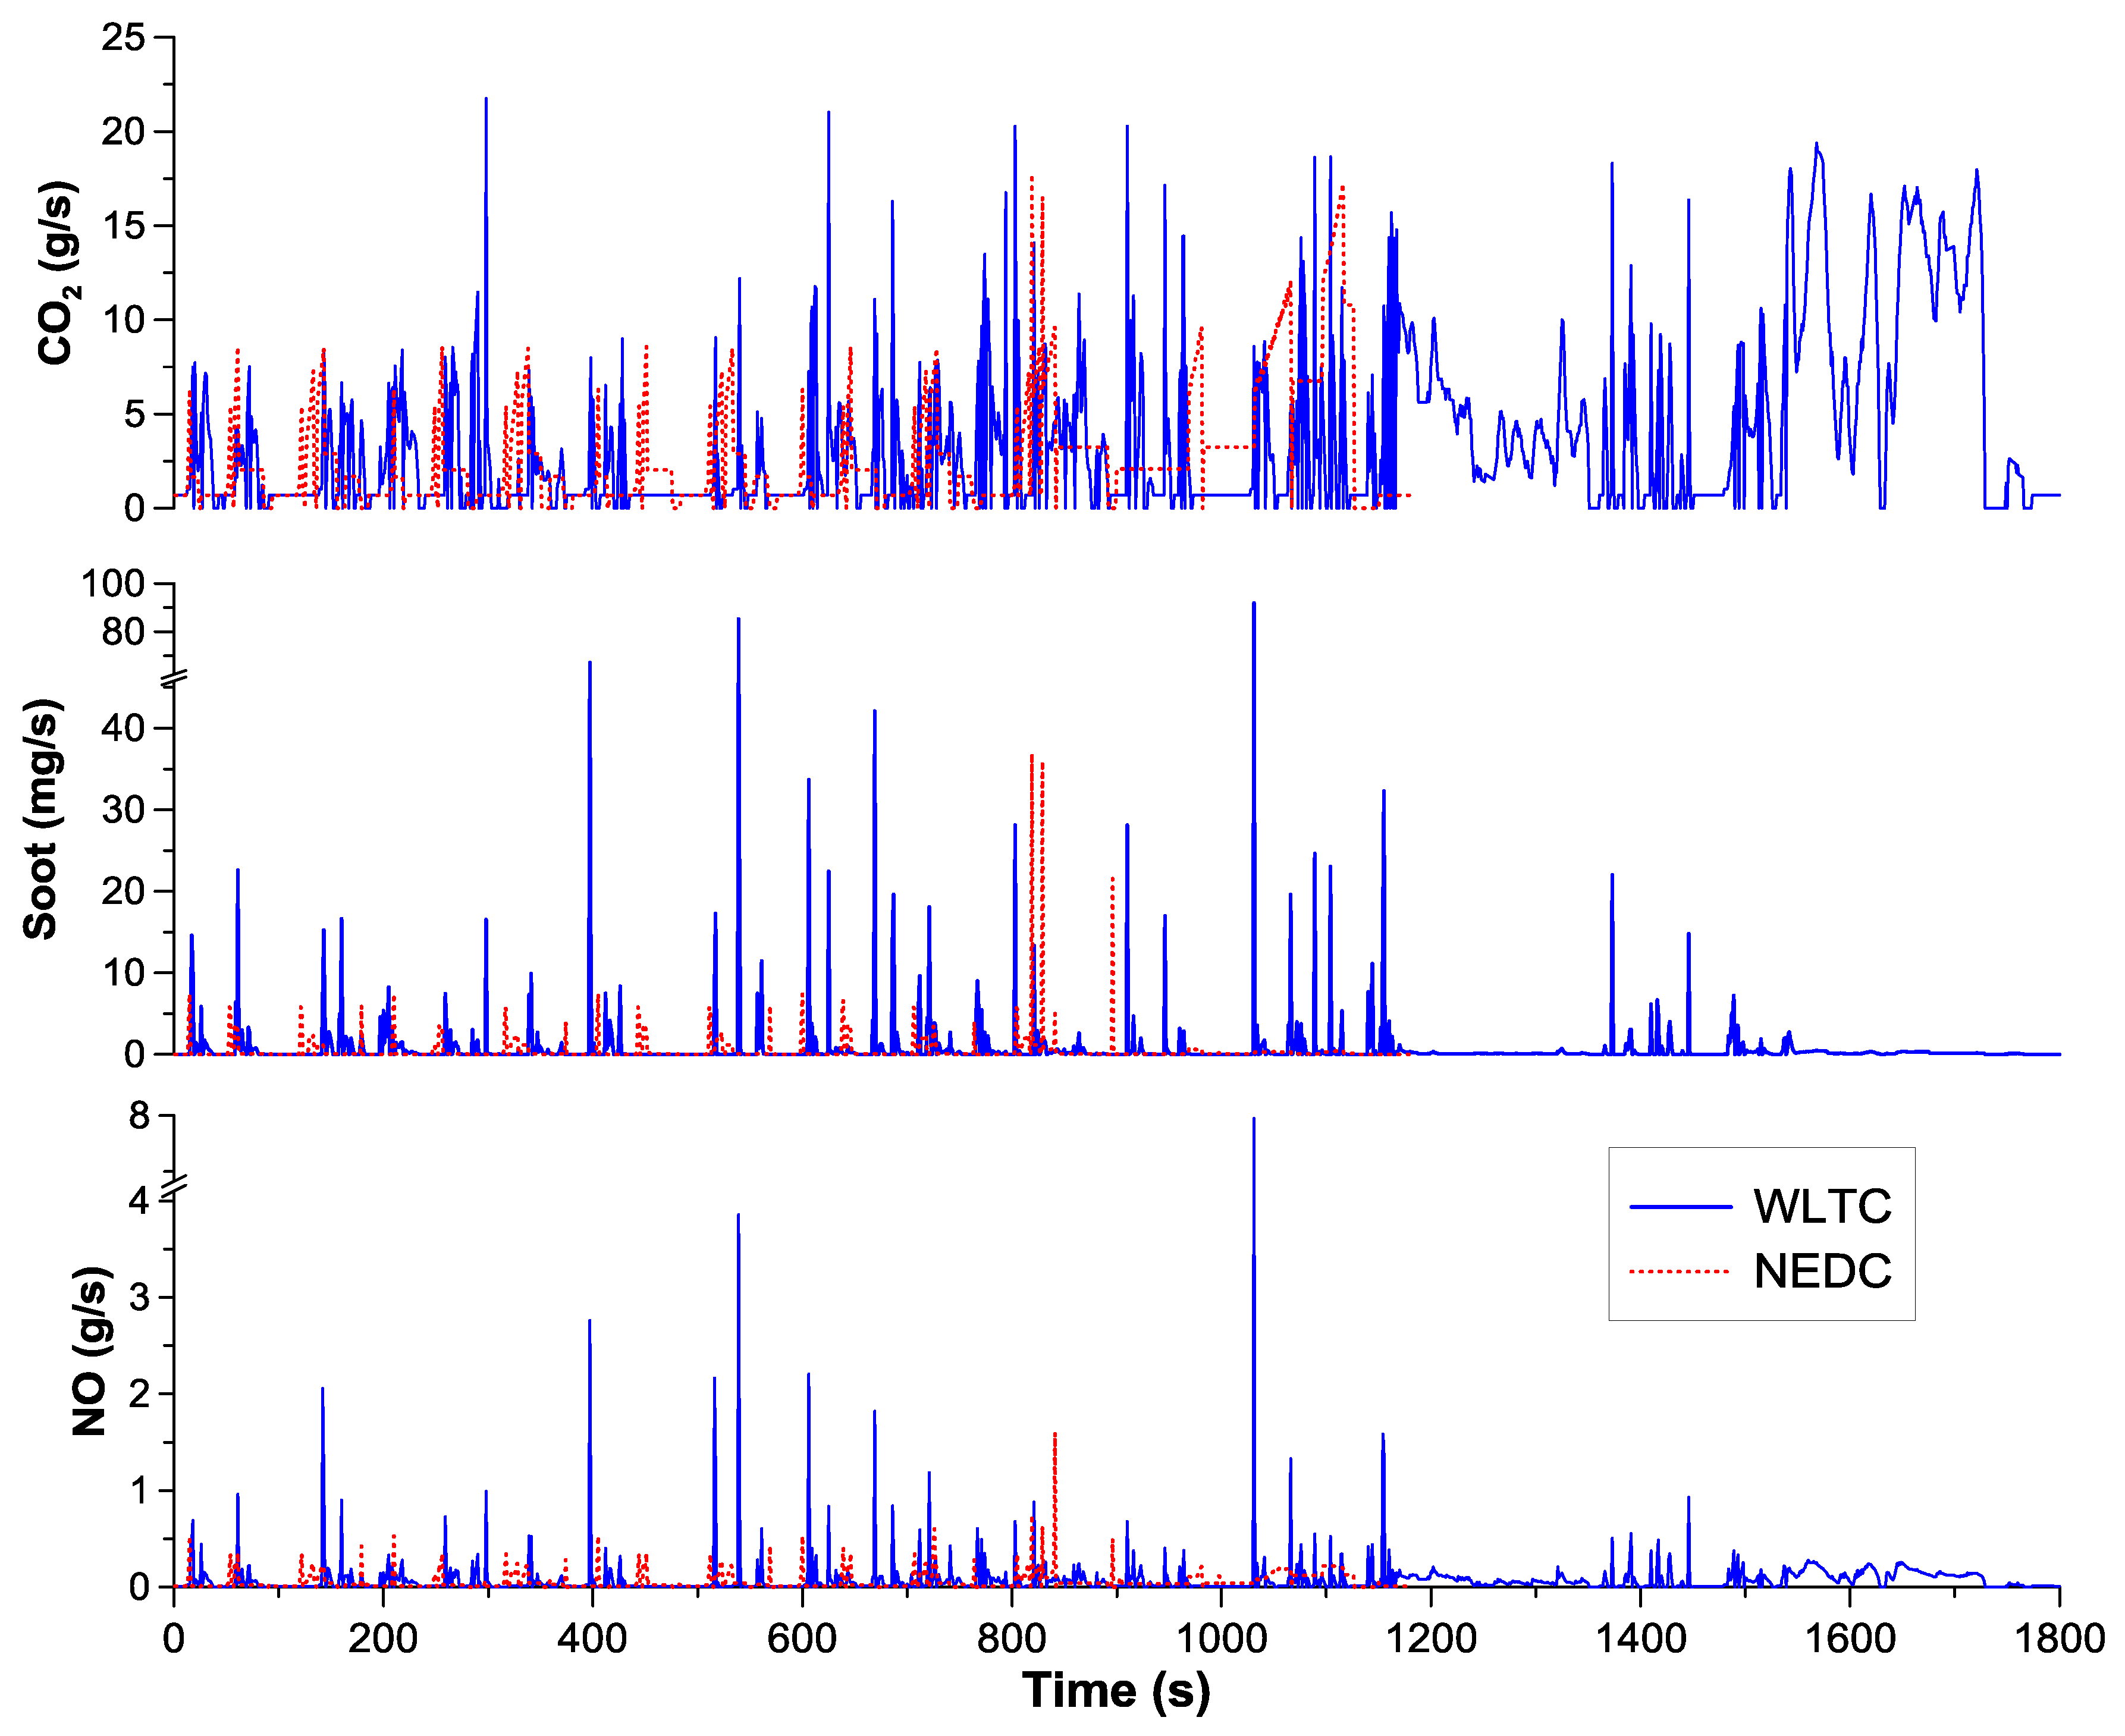
4.2. WLTC vs. NEDC Results
5. Summary and Conclusions
Acknowledgments
Author Contributions
Conflicts of Interest
References
- Giakoumis, E.G. Driving and Engine Cycles; Springer: Cham, Switzerland, 2017. [Google Scholar]
- Heywood, J.B. Internal Combustion Engine Fundamentals; McGraw-Hill: New York, NY, USA, 1988. [Google Scholar]
- Watson, N.; Janota, M.S. Turbocharging the Internal Combustion Engine; McMillan: London, UK, 1982. [Google Scholar]
- Rakopoulos, C.D.; Giakoumis, E.G. Diesel Engine Transient Operation; Springer: London, UK, 2009. [Google Scholar]
- Gambarotta, A.; Lucchetti, G.; Vaja, I. Real-time modelling of transient operation of turbocharged diesel engine. Proc. Inst. Mech. Eng. D J. Automob. Eng. 2001, 225, 1186–1203. [Google Scholar] [CrossRef]
- Berglund, S. A Model of Turbocharged Engines as Dynamic Drivetrain Members; SAE Technical Paper 933050; SAE International: New York, NY, USA, 1993. [Google Scholar]
- Rackmil, C.I.; Blumberg, P.N.; Becker, D.A.; Schuller, R.R.; Garvey, D.C. A dynamic model of a locomotive diesel engine and electrohydraulic governor. J. Eng. Gas Turbines Power 1988, 110, 405–414. [Google Scholar] [CrossRef]
- Jiang, Q.; Van Gerpen, J.H. Prediction of Diesel Engine Particulate Emission during Transient Cycles; SAE International: New York, NY, USA, 1992. [Google Scholar]
- Ericson, C.; Westerberg, B.; Egnell, R. Transient Emission Predictions with Quasi Stationary Models; SAE International: New York, NY, USA, 2005. [Google Scholar]
- Giakoumis, E.G.; Lioutas, S.C. Diesel-engined vehicle nitric oxide and soot emissions during the European light-duty driving cycle using a transient mapping approach. Transp. Res. D 2010, 15, 134–143. [Google Scholar] [CrossRef]
- Giakoumis, E.G.; Alysandratou, A. Performance and emissions of a heavy-duty truck during the UDDS driving cycle—Simulation analysis. ASCE J. Energy Eng. 2016, 142, E4015011. [Google Scholar] [CrossRef]
- Kirchen, P.; Obrecht, P.; Boulouchos, K. Soot emission measurements and validation of a mean value soot model for common-rail diesel engines during transient operation. SAE Int. J. Engines 2009, 2, 1663–1678. [Google Scholar] [CrossRef]
- Roy, S.; Banerjee, R.; Bose, P.K. Performance and exhaust emissions prediction of a CRDI assisted single cylinder diesel engine coupled with EGR using artificial neural network. Appl. Energy 2014, 119, 330–340. [Google Scholar] [CrossRef]
- Johri, R.; Filipi, Z. Neuro-fuzzy model tree approach to virtual sensing of transient diesel soot and NOx emissions. Int. J. Engine Res. 2014, 15, 918–927. [Google Scholar] [CrossRef]
- Bishop, J.D.K.; Stettler, M.E.J.; Molden, N.; Boies, A.M. Engine maps of fuel use and emissions from transient driving cycles. Appl. Energy 2016, 183, 202–217. [Google Scholar] [CrossRef]
- Tutuianu, M.; Bonnel, P.; Ciuffo, B.; Haniu, T.; Ichikawa, N.; Marotta, A.; Pavlovic, J.; Steven, H. Development of the worldwide harmonized light duty test cycle (WLTC) and a possible pathway for its introduction in the European legislation. Transp. Res. D 2015, 40, 61–75. [Google Scholar] [CrossRef]
- Mock, P.; Kühlwein, J.; Tietge, U.; Franco, V.; Bandivadekar, A.; German, J. The WLTP: How a New Test Procedure for Cars Will Affect Fuel Consumption Values in the EU. ICCT Working Paper 2014-9. 2014. Available online: http://www.theicct.org/wltp-how-new-test-procedure-cars-will-affect-fuel-consumption-values-eu (accessed on 25 November 2016).
- Favre, C.; Bosteels, D.; May, J. Exhaust Emissions from European Market-Available Passenger Cars Evaluated on Various Drive Cycles; SAE International: New York, NY, USA, 2013. [Google Scholar]
- Sileghem, L.; Bosteels, D.; May, J.; Favre, C.; Verhelst, S. Analysis of vehicle emission measurements on the new WLTC, the NEDC and the CADC. Transp. Res. D 2014, 32, 70–85. [Google Scholar] [CrossRef] [Green Version]
- Andersson, J.; May, J.; Favre, C.; Bosteels, D.; De Vries, S.; Heaney, M.; Keenan, M.; Mausell, J. On-Road and Chassis Dynamometer Evaluations of Emissions from Two Euro 6 Diesel Vehicles; SAE International: New York, NY, USA, 2014. [Google Scholar]
- Marotta, A.; Pavlovic, J.; Ciuffo, B.; Serra, S.; Fontaras, G. Gaseous emissions from light-duty vehicles: Moving from NEDC to the new WLTP test procedure. Environ. Sci. Technol. 2015, 49, 8315–8322. [Google Scholar] [CrossRef] [PubMed]
- Bielaczyc, P.; Woodburn, J.; Szczotka, A. A Comparison of Carbon Dioxide Exhaust Emissions and Fuel Consumption for Vehicles Tested over the NEDC, FTP-75 and WLTC Chassis Dynamometer Test Cycles; SAE International: New York, NY, USA, 2015. [Google Scholar]
- Tsokolis, D.; Tsiakmakis, S.; Dimaratos, A.; Fontaras, D.; Pistikopoulos, P.; Ciuffo, B.; Samaras, Z. Fuel consumption and CO2 emissions of passenger cars over the New Worldwide Harmonized Test Protocol. Appl. Energy 2016, 179, 1152–1165. [Google Scholar] [CrossRef]
- Global Technical Regulation No. 15. Worldwide Harmonized Light Vehicles Test Procedure. Established in the Global Registry on 12 March 2014. Available online: https://www.unece.org/fileadmin/DAM/trans/main/wp29/wp29r-1998agr-rules/ECE-TRANS-180a15e.pdf (accessed on 14 January 2017).
- Collier, T.; Gregory, D.; Rushton, M.; Hands, T. Investigation into the Performance of an Ultra-Fast Response NO Analyzer Equipped with a NO2 to NO Converter for Gasoline and Diesel Exhaust NOx Measurements; SAE International: New York, NY, USA, 2000. [Google Scholar]
- Rakopoulos, C.D.; Dimaratos, A.M.; Giakoumis, E.G.; Peckham, M.S. Experimental Assessment of Turbocharged Diesel Engine Transient Emissions during Acceleration, Load Change and Starting; SAE International: New York, NY, USA, 2010. [Google Scholar]
- Winterbone, D.E.; Benson, R.S.; Mortimer, A.G.; Kenyon, P.; Stotter, A. Transient Response of Turbocharged Diesel Engines; SAE International: New York, NY, USA, 1977. [Google Scholar]
- Gillespie, T.D. Fundamentals of Vehicle Dynamics; SAE International: Warrendale, PA, USA, 1992. [Google Scholar]
- Law, C.K. Combustion Physics; Cambridge University Press: Cambridge, UK, 2006. [Google Scholar]
- Hagena, J.R.; Filipi, Z.S.; Assanis, D.N. Transient Diesel Emissions: Analysis of Engine Operation during a Tip-In; SAE International: New York, NY, USA, 2006. [Google Scholar]
- Bielaczyc, P.; Merkisz, J.; Pielecha, J. Investigation of Exhaust Emissions from di Diesel Engine during Cold and Warm Start; SAE International: New York, NY, USA, 2001. [Google Scholar]
- Wijetunge, R.S.; Brace, C.J.; Hawley, J.G.; Vaughan, N.D.; Horrocks, R.W.; Bird, G.L. Dynamic Behavior of a High Speed Direct Injection Diesel Engine; SAE International: New York, NY, USA, 1999. [Google Scholar]
- Pavlovic, J.; Marotta, A.; Ciuffo, B. CO2 emissions and energy demands of vehicles tested under the NEDC and the new WLTP type approval test procedures. Appl. Energy 2016, 177, 661–670. [Google Scholar] [CrossRef]
- Dimaratos, A.; Tsokolis, D.; Fontaras, D.; Tsiakmakis, S.; Ciuffo, B.; Samaras, Z. Comparative evaluation of the effect of various technologies on light-duty vehicle CO2 emissions over NEDC and WLTP. Transp. Res. Procedia 2016, 14, 3169–3178. [Google Scholar] [CrossRef]
- Steven, H. Homologation Test Cycles Worldwide-Status of the WLTP. Green Global NCAP Labelling/Green Scoring Workshop. 30 April 2013. Available online: https://www.iea.org/media/workshops/2013/gfeilabelling/07.08.Homologationtestcyclesworldwide.pdf (accessed on 14 January 2017).


| Segment | Duration (s) | Distance (m) | Max. Speed (km/h) | Average Speed (km/h) | Max. Acceleration (m/s2) | Idling Time (%) | Relative Positive Accel. (RPA) (m/s2) |
|---|---|---|---|---|---|---|---|
| Low | 589 | 3094 | 56.5 | 18.9 | 1.61 | 24.4 | 0.219 |
| Medium | 433 | 4756 | 76.6 | 39.5 | 1.61 | 10.9 | 0.206 |
| High | 455 | 7162 | 97.4 | 56.7 | 1.67 | 6.4 | 0.138 |
| Extra high | 323 | 8254 | 131.3 | 92.0 | 1.06 | 1.9 | 0.127 |
| WLTC 3-2 | 1800 | 23,266 | 131.2 | 46.5 | 1.67 | 12.6 | 0.159 |
| Specification | NEDC | WLTC 3-2 | Difference (from NEDC Values) | Effect |
|---|---|---|---|---|
| Duration (s) | 1180 | 1800 | +53% | Lower influence of cold-start emissions |
| Distance (m) | 11,000 | 23,266 | +112% | |
| Average speed (km/h) | 33.6 | 46.5 | +38% | Most probably, better fuel efficiency |
| Maximum speed (km/h) | 120 | 131.3 | +9% | More realistic of today’s driving habits |
| Idling time (%) | 23.7 | 12.6 | −47% | Lower influence of start-stop systems |
| Cruising (%) | 39.6 | 3.7 | −91% | More transient, hence higher, pollutant and CO2 emissions |
| Transient time (%) | 36.7 | 83.7 | +128% | |
| Maximum acceleration (m/s2) | 1.04 | 1.67 | +60.5% | |
| Average acceleration (m/s2) | 0.594 | 0.406 | −31% | |
| RPA (m/s2) | 0.116 | 0.159 | +37% |
| Engine | |
|---|---|
| Engine type | Four-stroke, in-line, six-cylinder, turbocharged, after-cooled, DI diesel engine |
| Bore/Stroke | 97.5 mm/133 mm |
| Compression ratio | 18:1 |
| Maximum power | 177 kW @ 2600 rpm |
| Moment of inertia | 0.87 kg m2 |
| Vehicle | |
| Gross vehicle weight | 3.5 tn |
| Frontal area | 3 m2 |
| Aerodynamic resistance coefficient | 0.38 |
| Gear ratios | 5.78; 2.7; 1.9; 1.25; 1.0; 0.9 |
| Speed Range (rpm) | NO Coefficients | Soot Coefficients |
|---|---|---|
| 1000–1400 | 4.0 (load change 0%–30%) | 120 (load change 0%–30%) |
| 3.0 (load change 31%–60%) | 85 (load change 31%–60%) | |
| 1.6 (load change > 60%) | 50 (load change > 60%) | |
| 1401–1800 | 3.2 (load change 0%–30%) | 100 (load change 0%–30%) |
| 2.0 (load change 31%–60%) | 70 (load change 31%–60%) | |
| 1.2 (load change > 60%) | 40 (load change > 60%) | |
| >1800 | 2.0 (load change 0%–30%) | 60 (load change 0%–30%) |
| 1.2 (load change 31%–60%) | 36 (load change 31%–60%) | |
| 1.1 (load change > 60%) | 25 (load change > 60%) |
| Segment | Duration (s) | Distance (km) | Micro-Trips | Soot (g/km) | NO (g/km) | Fueling (L/100km) | CO2 (g/km) |
|---|---|---|---|---|---|---|---|
| Low | 589 | 3094 | 5 | 0.214 | 13.173 | 8.77 | 330.28 |
| Medium | 433 | 4756 | 1 | 0.086 | 6.935 | 6.93 | 260.87 |
| High | 455 | 7162 | 1 | 0.062 | 5.883 | 6.08 | 229.01 |
| Extra high | 323 | 8254 | 1 | 0.018 | 4.010 | 8.00 | 301.10 |
| Entire cycle | 1800 | 23,266 | 7 | 0.069 | 6.403 | 7.29 | 274.57 |
| Property | NEDC | WLTC 3-2 | Difference (from NEDC Values) |
|---|---|---|---|
| Specific Energy (kWh/100 km) | 28.40 | 30.10 | +6% |
| Soot (g/km) | 0.0447 | 0.0694 | +55% |
| NO (g/km) | 5.778 | 6.403 | +10.8% |
| Fueling (L/100 km) | 7.36 | 7.29 | −1% |
| CO2 (g/km) | 277.15 | 274.57 | −1% |
© 2017 by the authors. Licensee MDPI, Basel, Switzerland. This article is an open access article distributed under the terms and conditions of the Creative Commons Attribution (CC BY) license ( http://creativecommons.org/licenses/by/4.0/).
Share and Cite
Giakoumis, E.G.; Zachiotis, A.T. Investigation of a Diesel-Engined Vehicle’s Performance and Emissions during the WLTC Driving Cycle—Comparison with the NEDC. Energies 2017, 10, 240. https://doi.org/10.3390/en10020240
Giakoumis EG, Zachiotis AT. Investigation of a Diesel-Engined Vehicle’s Performance and Emissions during the WLTC Driving Cycle—Comparison with the NEDC. Energies. 2017; 10(2):240. https://doi.org/10.3390/en10020240
Chicago/Turabian StyleGiakoumis, Evangelos G., and Alexandros T. Zachiotis. 2017. "Investigation of a Diesel-Engined Vehicle’s Performance and Emissions during the WLTC Driving Cycle—Comparison with the NEDC" Energies 10, no. 2: 240. https://doi.org/10.3390/en10020240
APA StyleGiakoumis, E. G., & Zachiotis, A. T. (2017). Investigation of a Diesel-Engined Vehicle’s Performance and Emissions during the WLTC Driving Cycle—Comparison with the NEDC. Energies, 10(2), 240. https://doi.org/10.3390/en10020240