Abstract
As a type of engineering model used for solving lightning-shielding problems, the electrogeometric model has been widely used for assessing lightning-shielding failure in high-voltage and extra-high-voltage transmission lines. However, with the increase of voltage levels in ultra-high-voltage lines and the growth of the air gap, the results previously yielded by the electrogeometric model are no longer consistent with those observed. Therefore, this study corrected the equation for the relationship between lightning current and striking distance, by using data on a negative polarity 50% discharge voltage from the rod-rod gap −20/2500 μs switching impulse test wherein an air gap of up to 10 m was first tested. Subsequently, the return stroke velocity distribution observed by Idone was newly applied. In addition, the correction factor for the ground was corrected in this study. Thus, an improved electrogeometric model for application in EHV and UHV transmission lines is proposed in this paper. By employing the improved electrogeometric model to calculate the frequency of lightning strikes of 500 and 1000 kV transmission lines in Japan and a 1000 kV transmission line in China, we found that the results calculated using the improved electrogeometric model were closer to the actual observations in Japan than was the original electrogeometric model. The improved electrogeometric model provides a more reliable foundation for lightning-shielding design of extra-high-voltage and ultra-high-voltage transmission lines.
1. Introduction
To construct a more secure, efficient, and robust power grid, promote grid interaction with neighboring countries, and construct a global energy interconnection, it is necessary to construct an ultra-high-voltage (UHV) grid involving the coordinated development of all voltage level grids to serve as the core power grid [1]. However, with the improvement of the grids’ voltage level, the dimension of power facilities increase significantly, resulting in the existing lightning-shielding analysis methods and measures becoming unsuitable for lightning-shielding design of EHV and UHV transmission lines. This is an unsolved problem that hinders safe grid operation [2].
As a type of lightning shielding calculation model that combines electrical parameter and geometry, the electrogeometric model (EGM) has been widely used in assessing lightning-shielding failure in high-voltage (HV) and extra-high-voltage (EHV) transmission lines [3,4,5,6,7,8,9,10]. The EGM proposed by Whitehead and Armstrong in 1968 [3,11] originally applied a negative polarity discharge characteristic curve with long air gap to deduce the equation for the relationship between striking distance and lightning current. In 1988, Mousa and Srivastava [12] illuminated the reasons causing to the discrepancies between the calculated results and field observations, as well as some improvements, such as the equality of the striking distance, vertical direction of stroke, etc., were proposed in their study. Subsequently, many researchers have attempted to correct this method through various rod-rod and rod-plane gap discharge characteristic testing approaches. Through such tests, EGMs can continually be improved on the basis of engineering experience and data obtained from long air gap discharge tests, thereby enabling the development of an EGM suitable for the lightning-shielding design for HV and EHV transmission lines. However, the observed 500 and 1000 kV lightning strike data obtained in Japan between 2000 and 2005 (85 in total) indicate that the actual observed frequency of lightning strikes (3.33 strikes/100 km/year) was much higher than the rate predicted by the classic EGM (2.2 strokes/100 km/year) [13,14]. In the results yielded by the classic EGM for 500 kV and 1000 kV transmission lines, the calculated frequency of lightning strikes of the lower phase was the highest, whereas that of the upper phase was the lowest. These results were very different from the observed data, where the value of the lower phase was the lowest and the value of middle phase was the highest.
To solve the problem, in 2008, Taniguchi et al. conducted rod-rod and rod-plane gap discharge characteristic tests in Japan, with an air gap of up to 6 m and waveform of 80/2500 µs [15]. On the basis of the experimental data and the probability distribution of lightning stroke velocity, the equation for the relationship between striking distance and lightning current was corrected by the researchers. Furthermore, the correction factor for the ground was altered to 1.1 [16]. Through comparison between the results calculated by the improved EGM and the observed data in Japan, it was found that although difference between the calculated lighting stroke percentage of each phase and the observed data still exists, the results show significant progress that provides a new method to improving the EGM.
Due to the limitation of the experimental equipment, in the long air gap discharge test conducted by Taniguchi et al, the longest air gap distance was only 6 m. This inspired us to conduct a discharge test with longer air gap to obtain an improved EGM suitable for application in EHV and UHV transmission lines. Furthermore, in the test conducted by Taniguchi et al, the waveform was 80/2500 µs. He and He at the Huazhong University of Science and Technology in Wuhan, China observed the process of a negative impulse discharge test where the wave rise times were determined to be 20 and 80 µs, and they found that two to four stepped leaders appeared when the wave rise time was 80 µs, which was more than the number of step leaders that appeared when the wave rise time was 20 µs. In the EGM proposed by Whitehead and Armstrong, it assumed that the electrical potential of the last lightning stroke stepped leader was assumed to be equal to the 50% discharge voltage, which affects the accuracy of the algorithm in choosing different wave rise times for the discharge test.
In the present study, negative polarity switching impulses tests were conducted for rod-rod and rod-plane gap, among which the longest gap distance was 10 m. On the basis of the data from the negative polarity 20/2500 µs switching impulses test for the rod-rod gap [17], the equation of lightning leader electrical potential proposed by Wagner [18], and the probability distribution of lightning stroke velocity observed by Idone [19], a new equation for the relationship between striking distance and lightning current was obtained. In addition, according to the data from the negative polarity 20/2500 µs switching impulses test for rod-plate gap, the correction factor for the ground was modified. Finally, the improved EGM is applied to calculate the frequency of lightning strikes of EHV and UHV transmission lines for comparison with observed data and other published results.
2. Improvement of the Conventional Calculation
2.1. Influence of the Equation and the Correction Factor of the EGM
The steps for deducing the equation and correction factor for EGM based on the data from the negative polarity discharge test for long air gaps described herein:
Firstly, applying data from the negative polarity discharge test for long air gap, the equation for the relationship between gap discharge voltage and gap distance d is as follows:
where, U50% is the gap discharge voltage, the unit is MV; d is the striking distance, m; α and β are constants.
According the deduction proposed by Wagner [18], the equation for the electrical potential of step leaders is as follows:
where, Vs is the electrical potential of the step leader; I is the amplitude of the lightning current; v1 is the ratio of lightning stroke velocity to light speed; r’ is the radius of step leader; d’ is the corona radius of step leader; Armstrong and Whitehead valued the logarithm at 4.6 (2r’/d’ = 100).
According to a majority of the observed results, a relationship between lightning current and lightning stroke velocity exists, which can be expressed as follows:
where, Ki = 2400, and q = 3. By substituting Equation (3) into Equation (2) and assuming that the electrical potential of the last strike’s step leader is equal to the gap discharge voltage, Vs = U50%. By substituting this into Equation (1), we obtain the following equation:
Therefore, the equation for the relationship between striking distance and lightning current can be simplified as follows:
Since differences exist between the lightning attracting ability of ground and wire, the striking distance for the ground should be revised using the correction factor Kg:
As the crucial electrical parameters, a, b, and Kg have been valued differently by various researchers, shown in the Table 1.

Table 1.
Comparison of different striking distance parameters.
The fundamental principles for evaluating the lightning-shielding performance using EGM are shown in the Figure 1. Considering that lightning strikes the conductor after approaching the arc of the conductor, the striking distance of the conductor and the conductor are, respectively, considered as the radius and center of the circle. Subsequently, the projections of exposed surfaces are calculated through the geometric method. In addition, not only the lightning current peak value but also lightning stroke angles within the range ±90°, are taken into consideration. This clarifies that the parameters values in the EGM have considerable effect on the accuracy of lightning stroke rate.

Figure 1.
Sketch diagram of lightning stoke to transmission lines based on the EGM.
2.2. Modification of EGM Parameter
2.2.1. Influence of Wave Rise Time on the Modification for EGM Parameters
‘Striking distance’ refers to the distance between the lightning leader tip of the final jump and the target object. According to the definition of striking distance, when the equation for the relationship between striking distance and lighting current is modified on the basis of the results from the long air gap discharge tests, ideally no stepped—leader should appear during the entire discharge progress. However, as the gap distance increases, it is difficult to guarantee that no stepped-leader will appear during the test. Therefore, it is necessary to value the appropriate wave–rise time to reduce the number of stepped leaders.
During the interval time of the stepped leader, similar to the circumstances that arise when the voltages with wave rise times are applied to the air gap, the electrical charge in the leader tip is replenished, and the electrical field and electrical potential increase. Some information regarding the interval time of stepped leader is available in the literature. In Schonland’s data on the interval time of α-type lightning stepped leaders [21], the length range of a stepped leader is 10–200 m, and the corresponding dwell time is 37–124 µs. In Berger and Vogelsanger’s data [22], the length range of a stepped leader is 3–50 m, and the corresponding dwell time is 29–52 µs. The dwell time provided in [23] is 10–100 µs, with an average of 50 µs. The dwell time provided in [24] is 30–100 µs, with average of 60 µs. From the above the interval time ranges from 10 to 124 µs.
The results of a comparison between data from the long air gap negative polarity discharge tests where the wave rise time values were 20 and 80 µs are presented in [17]. The researchers found that the relationship curve between the discharge voltage and gap distance under a wave rise time of 80 µs had a deeper degree of saturation than the curve under the wave rise time of 20 µs. This is because the air gap discharge voltage was consistent with the voltage drop of upward and downward leader, as well as the leaping voltage of the gap. Furthermore, the channels of the upward and downward leader are a type of plasma channel, where the electrical field intensity is low. Therefore, if more stepped-leaders appear in discharge gap, the discharge voltage value will be smaller. From the above, it can be concluded that more stepped-leaders appear in discharge tests where the wave rise time is 20 µs.
To accurately simulate the final jump, it is necessary to guarantee that fewer stepped-leaders will appear. Hence, the data from the discharge test with a wave rise time of 20 µs can be used to correct the parameters of the EGM.
2.2.2. Modification of the EGM Equation
Since the average height of middle phase of 1000 kV transmission line in China was about 56 m and the scale of model valued 1:12.5 in this study, thus, the height of down rod is valued 4.5 m. The rod-rod (h = 4.5 m) and rod-plate discharge tests with the waveform of 20/2500 µs were conducted at UHV testing site. The experimental arrangement is shown in the Figure 2 and Figure 3 and details of testing apparatus and the environmental conditions are elaborated in [17,25,26].
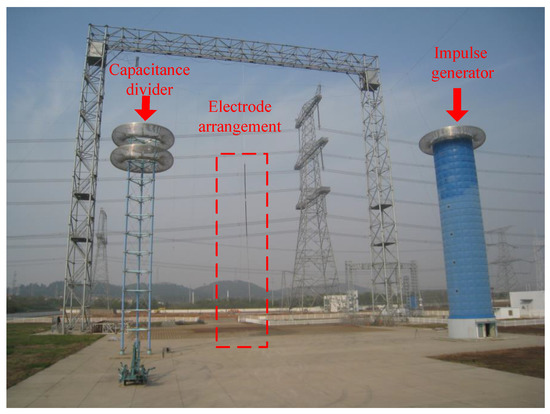
Figure 2.
Schematic diagram of the experimental arrangement.
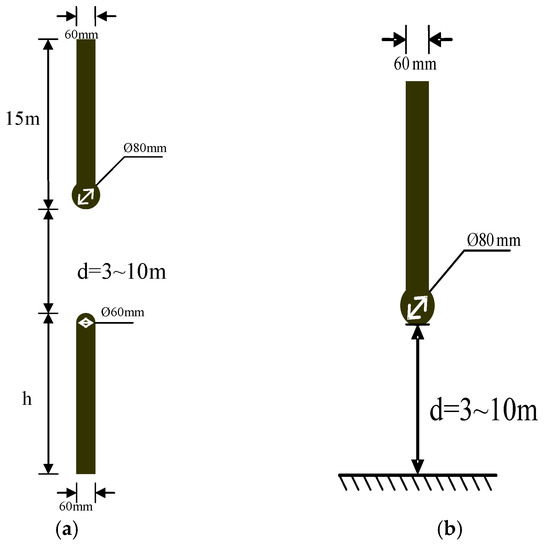
Figure 3.
Schematic of the air gap arrangement: (a) rod-rod (down rod: circular iron rod; 36 cm2 in section and hemisphere on the tip; 6 cm radius; 4.5 m length); and (b) rod-plate (plate: 20 m × 20 m iron plate placed on 50 m × 50 m iron net).
The equations at rod-rod (h = 4.5 m) and rod-plate for the relationship between the 50% discharge voltage and gap distance were obtained, shown respectively in Equations (7) and (8) and Figure 2.
With the development of lightning observation technology, the observed results of lightning discharge have been more accurate in recent years. The velocities of natural lightning observed by streak camera in the study of Idone and Orville (1982) [19] were most authoritative. According to the definition of EGM, the first stroke of the lightning flash was mainly concerned in this method. However, the number of observed first strokes in their study was just 16, which cannot give a viable frequency distribution of the velocity of the first strike. Thus, we use their observed velocities of 17 first return strikes and 46 subsequent return strikes, and the probability distribution of the return strike velocity can be obtained. In the future, more and more data of velocity of lightning first strikes will be obtained, and the viable frequency distribution of the velocity of the first strike will be fitted and can be used in the improved EGM.
Therefore, in the present study, the striking distance can be corrected on the basis of the probability distribution of return strike velocity, combined with the relationship of rod-rod (h = 4.5 m) and rod-plate between the discharge voltage and gap distance, shown below:
2.2.3. Modification of Correction Factor
As shown in Figure 4, when the gap distance was less than 4 m, the 50% discharge voltage of the rod-plane gap was larger than that of the rod-rod gap, and when the gap distance exceeded 4 m, the size relationship between the two gaps discharge voltage reversed, of which the reasons were stated in [17]. On the basis of the testing data, the ratios of discharge voltage between the rod-rod (h = 4.5 m) gap and rod-plane gap, when the gap distances valued 1, 2, 3, 4, 5, 6, 8, 10 m, were computed [17]. Then, the fitting equation for the relationship between correction factor Kg and gap distance can be expressed:
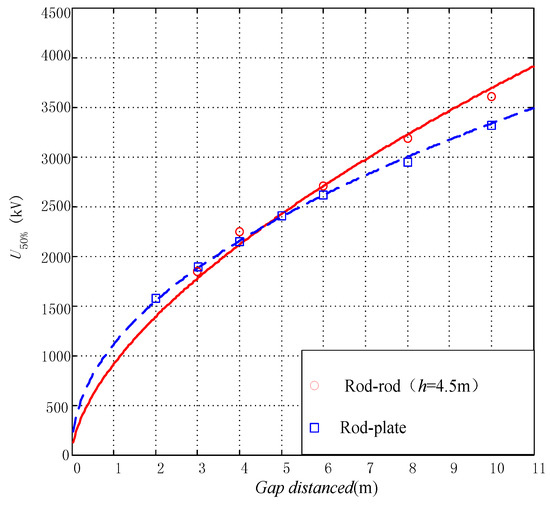
Figure 4.
Air gap discharge characteristics of negative switching impulses.
According to the relationship between striking distance and lightning current commanded by Armstrong and Whitehead, r = 6.72 × I0.8, when r values 100 m, I = 29.2 kA, which is close to the lightning current causing shielding failure in UHV transmission line. In addition, the relationship curve between the correction factor and gap distance was saturated at 100 m. Due to these factors, the distance of final jump was assumed to be 100 m. The correction factor was obtained as follows:
3. Comparisons of Calculation Results and the Lightning Observation Results in Japan
3.1. Computation Flow Based on the Improved EGM
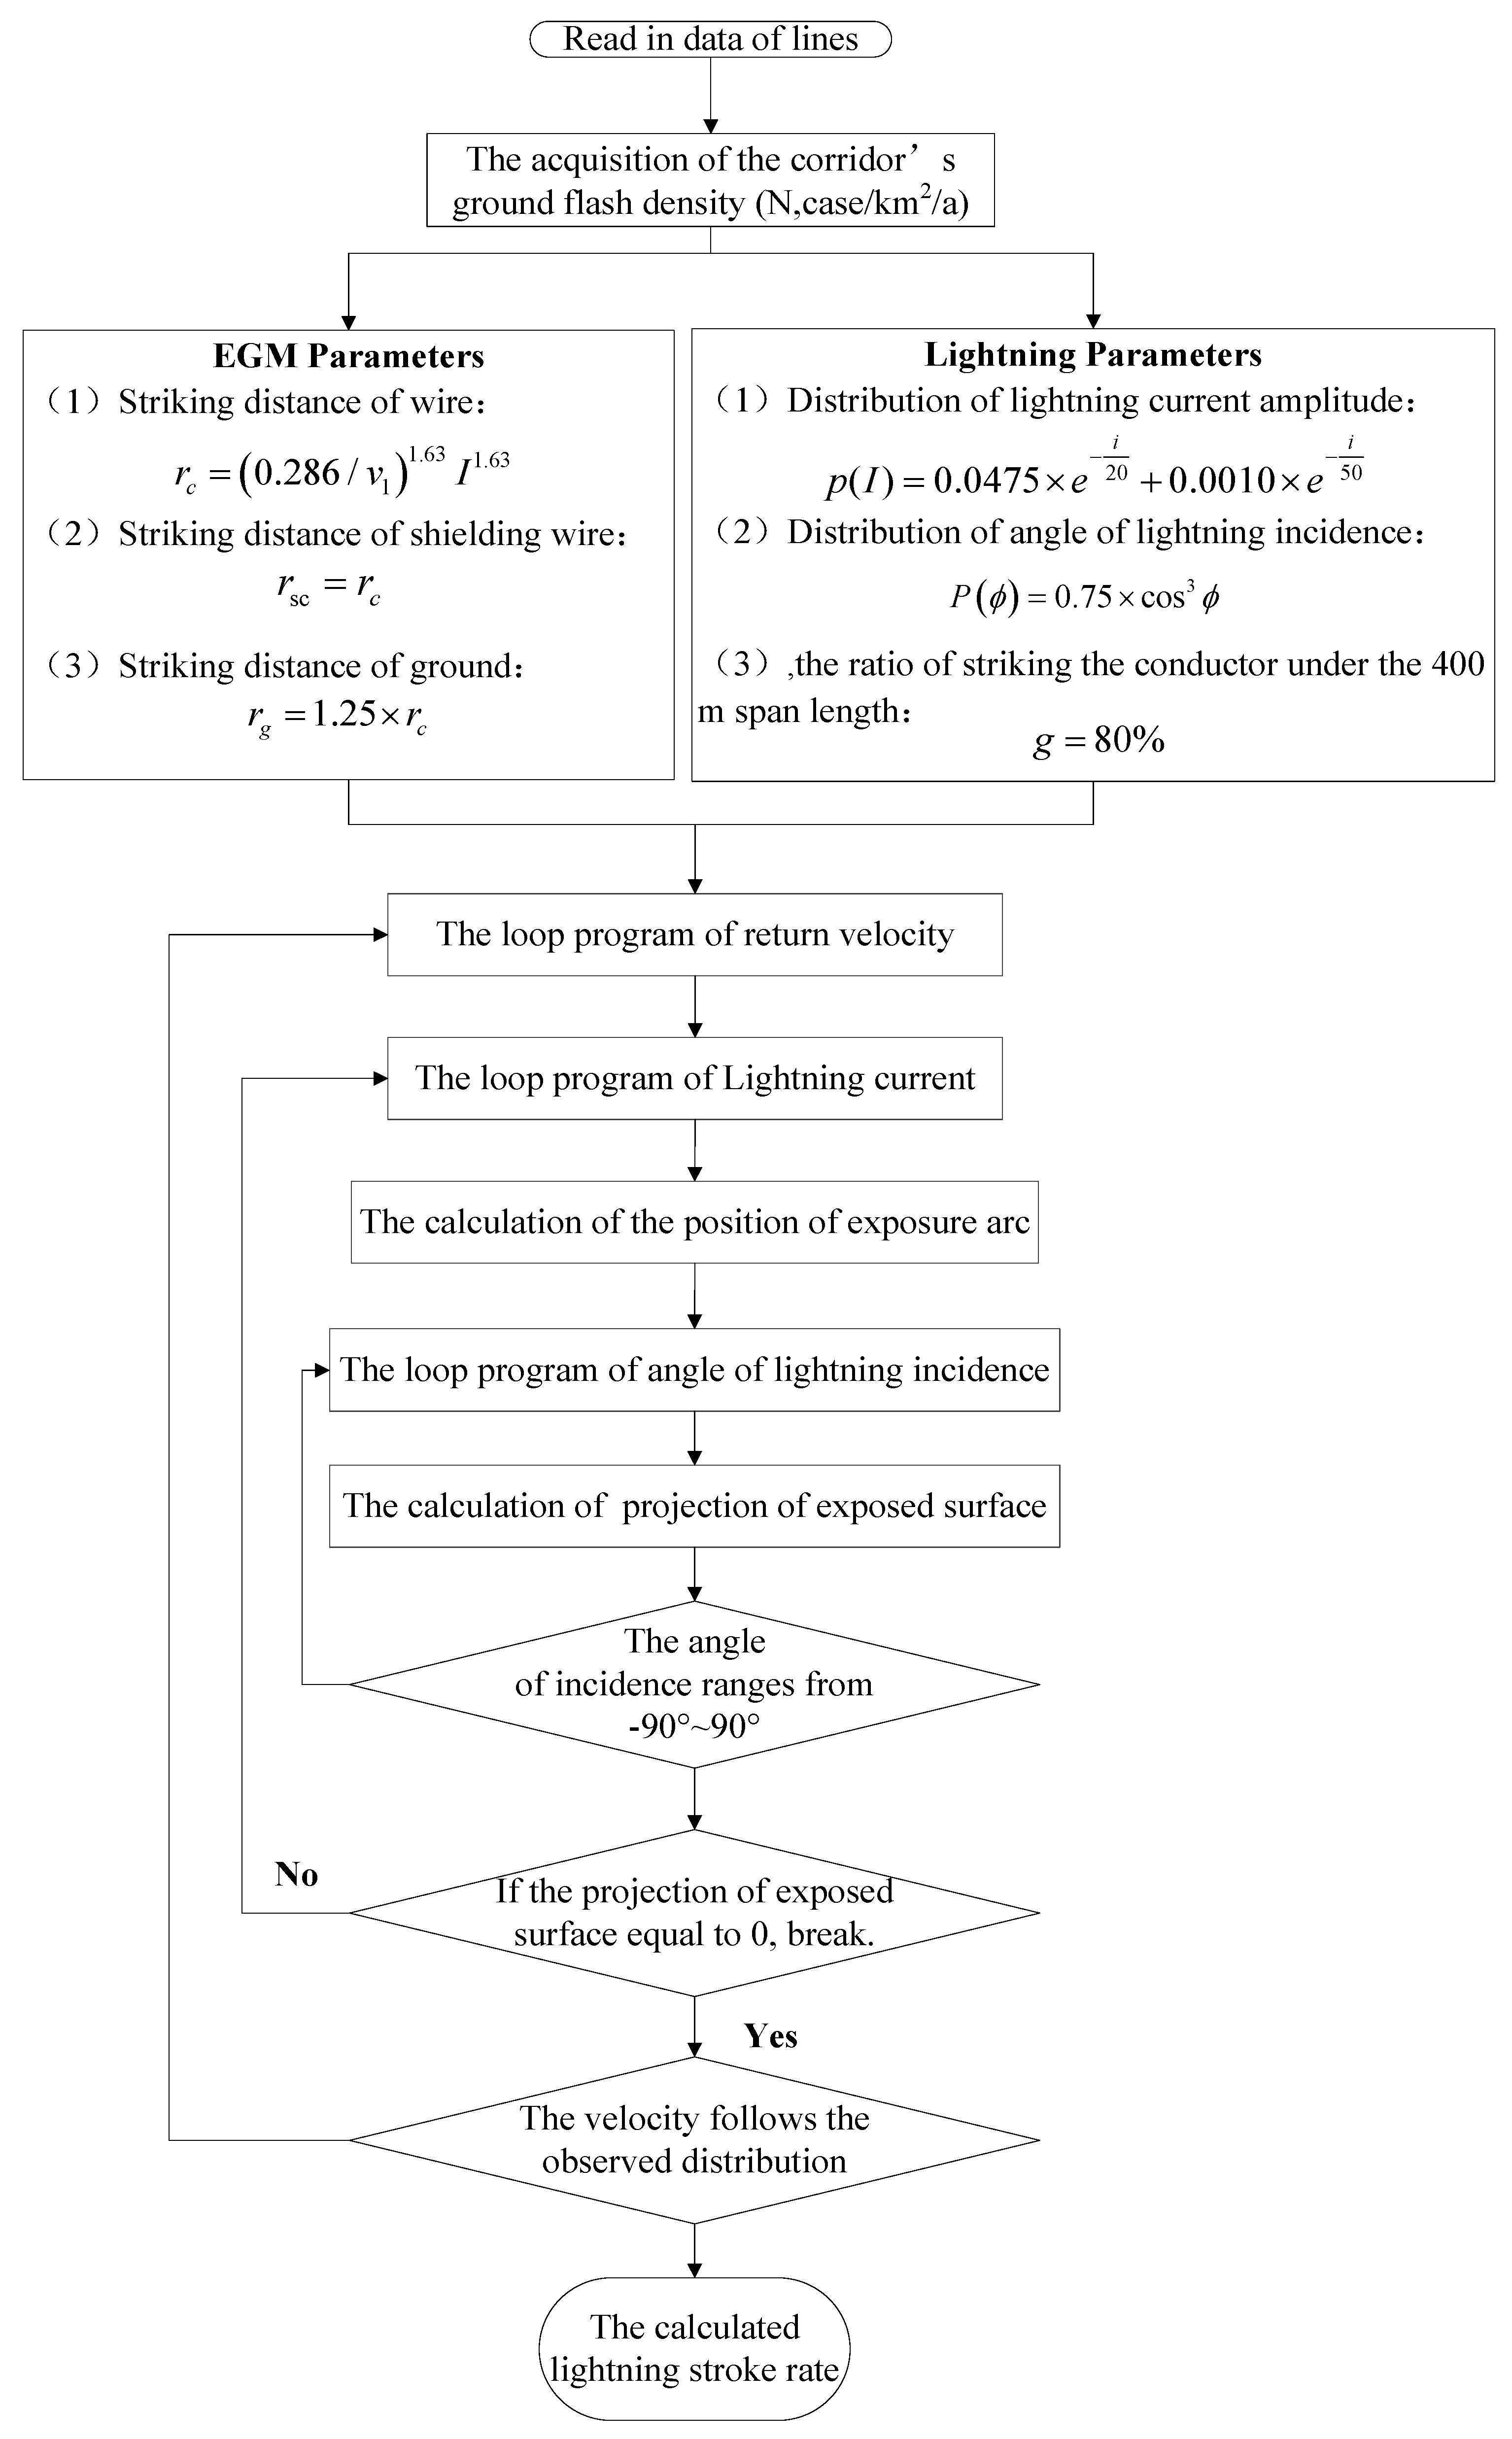
The computation flow chart based on the improved EGM is shown in Figure 5. The distribution of the lightning incidence angle was taken into consideration in this calculation. In addition, to validate the accuracy of this method, it is necessary to compare the calculated results with the observed lightning data of 500 kV as well as those of the UHV transmission line in Japan. According to the data, the ratio of striking the conductor under the 400 m span length [27] is valued at 80%, and the probability distribution fitting formula for lightning current amplitude was used in the calculation [15].
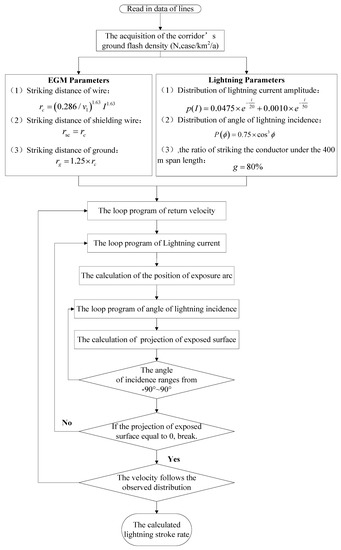
Figure 5.
Flowchart for calculating the lightning stroke rate.
To validate the accuracy of the improved EGM proposed in this paper, a comparison between the computed results by the improved EGM, the classical EGM, EGM proposed in [16] and observed frequency of lightning strikes data of 500 kV and 1000 kV transmission line in Japan are provided below. The frequency of lightning strikes and shielding failure rate of 1000 kV transmission line in China was also analyzed.
3.2. Analysis of Calculation Results and Lightning Observation Results in Japan
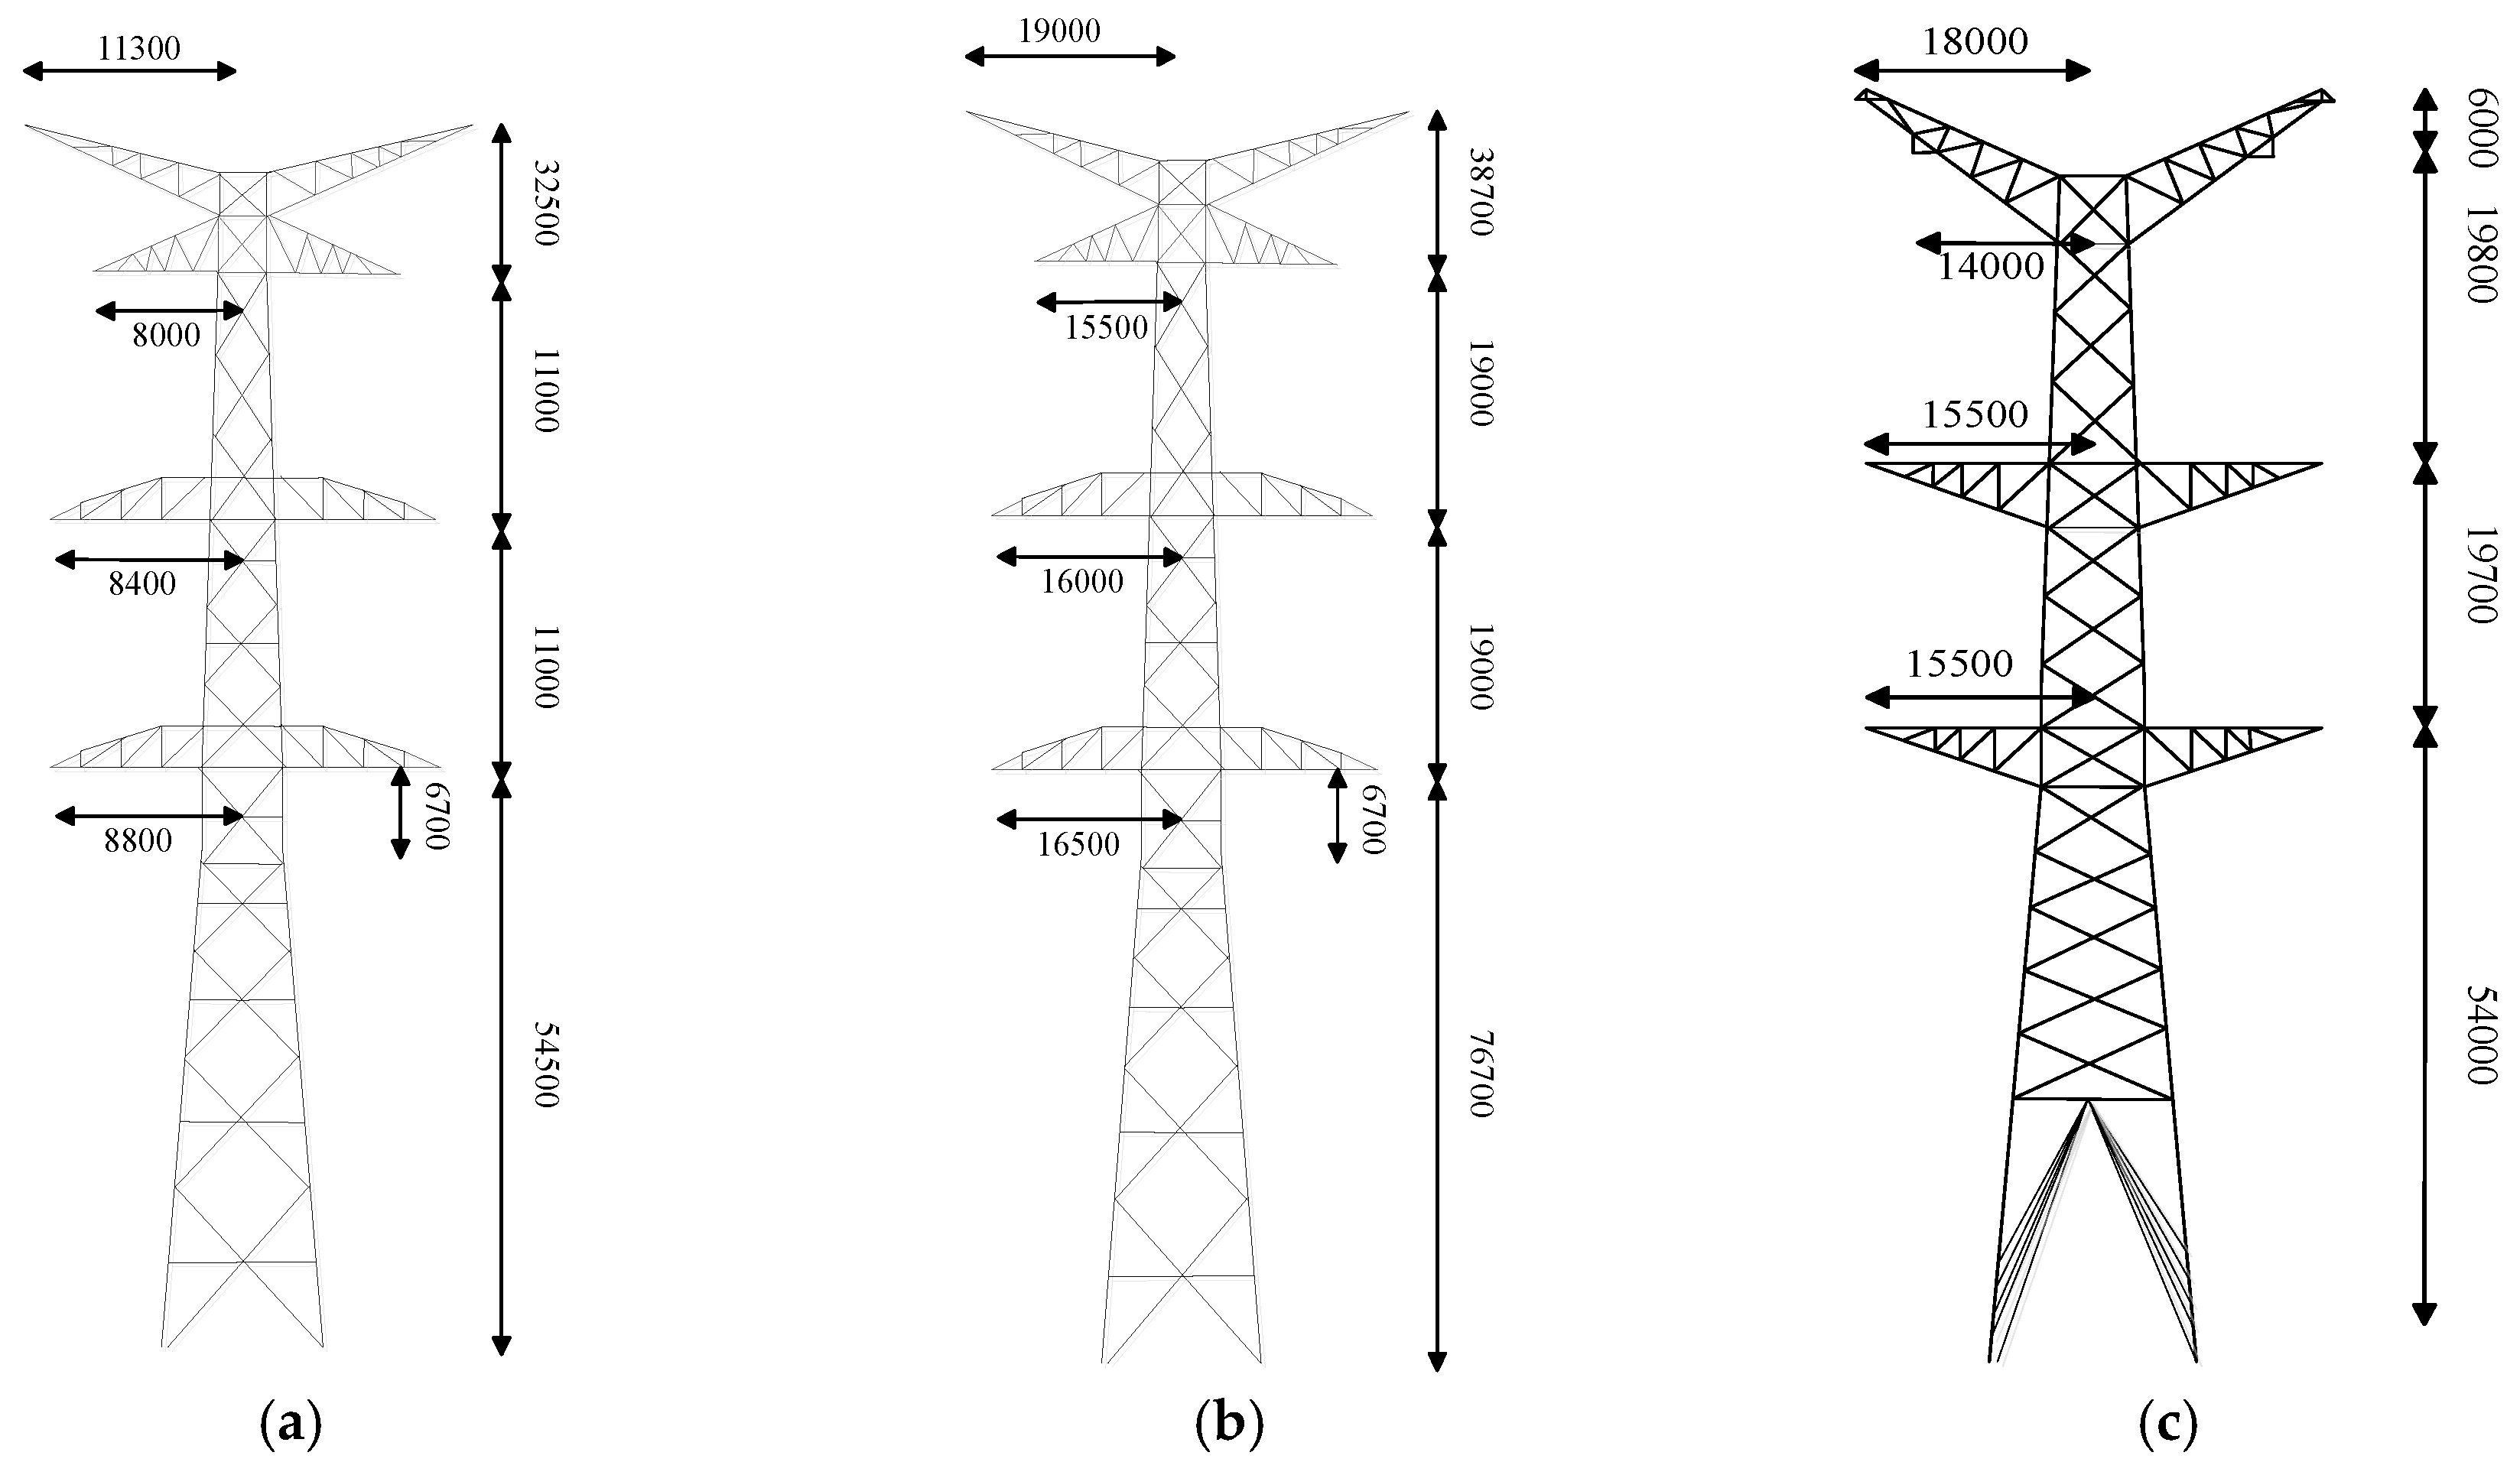
In the calculation, the typical double-circuit transmission lines of 500 kV and 1000 kV are shown in Figure 6a,b. Based on the lightning statistics regarding transmission lines in Japan, the ground flash density of 500 kV lines corridor NL is 4.9 strikes/km2/year, and the ground flash density of the 1000 kV line corridor NL is 5.2 strikes/km2/year. Thus, the frequency of lightning strikes of 500 kV and 1000 kV transmission lines calculated by different EGMs and the observed data are shown in the Figure 6 and Figure 7.
Figure 6.
Sketch diagram of tower model of 500 kV and 1000 kV lines: (a) 500 kV lines in Japan; (b) 1000 kV lines in Japan; and (c) 1000 kV lines in China.

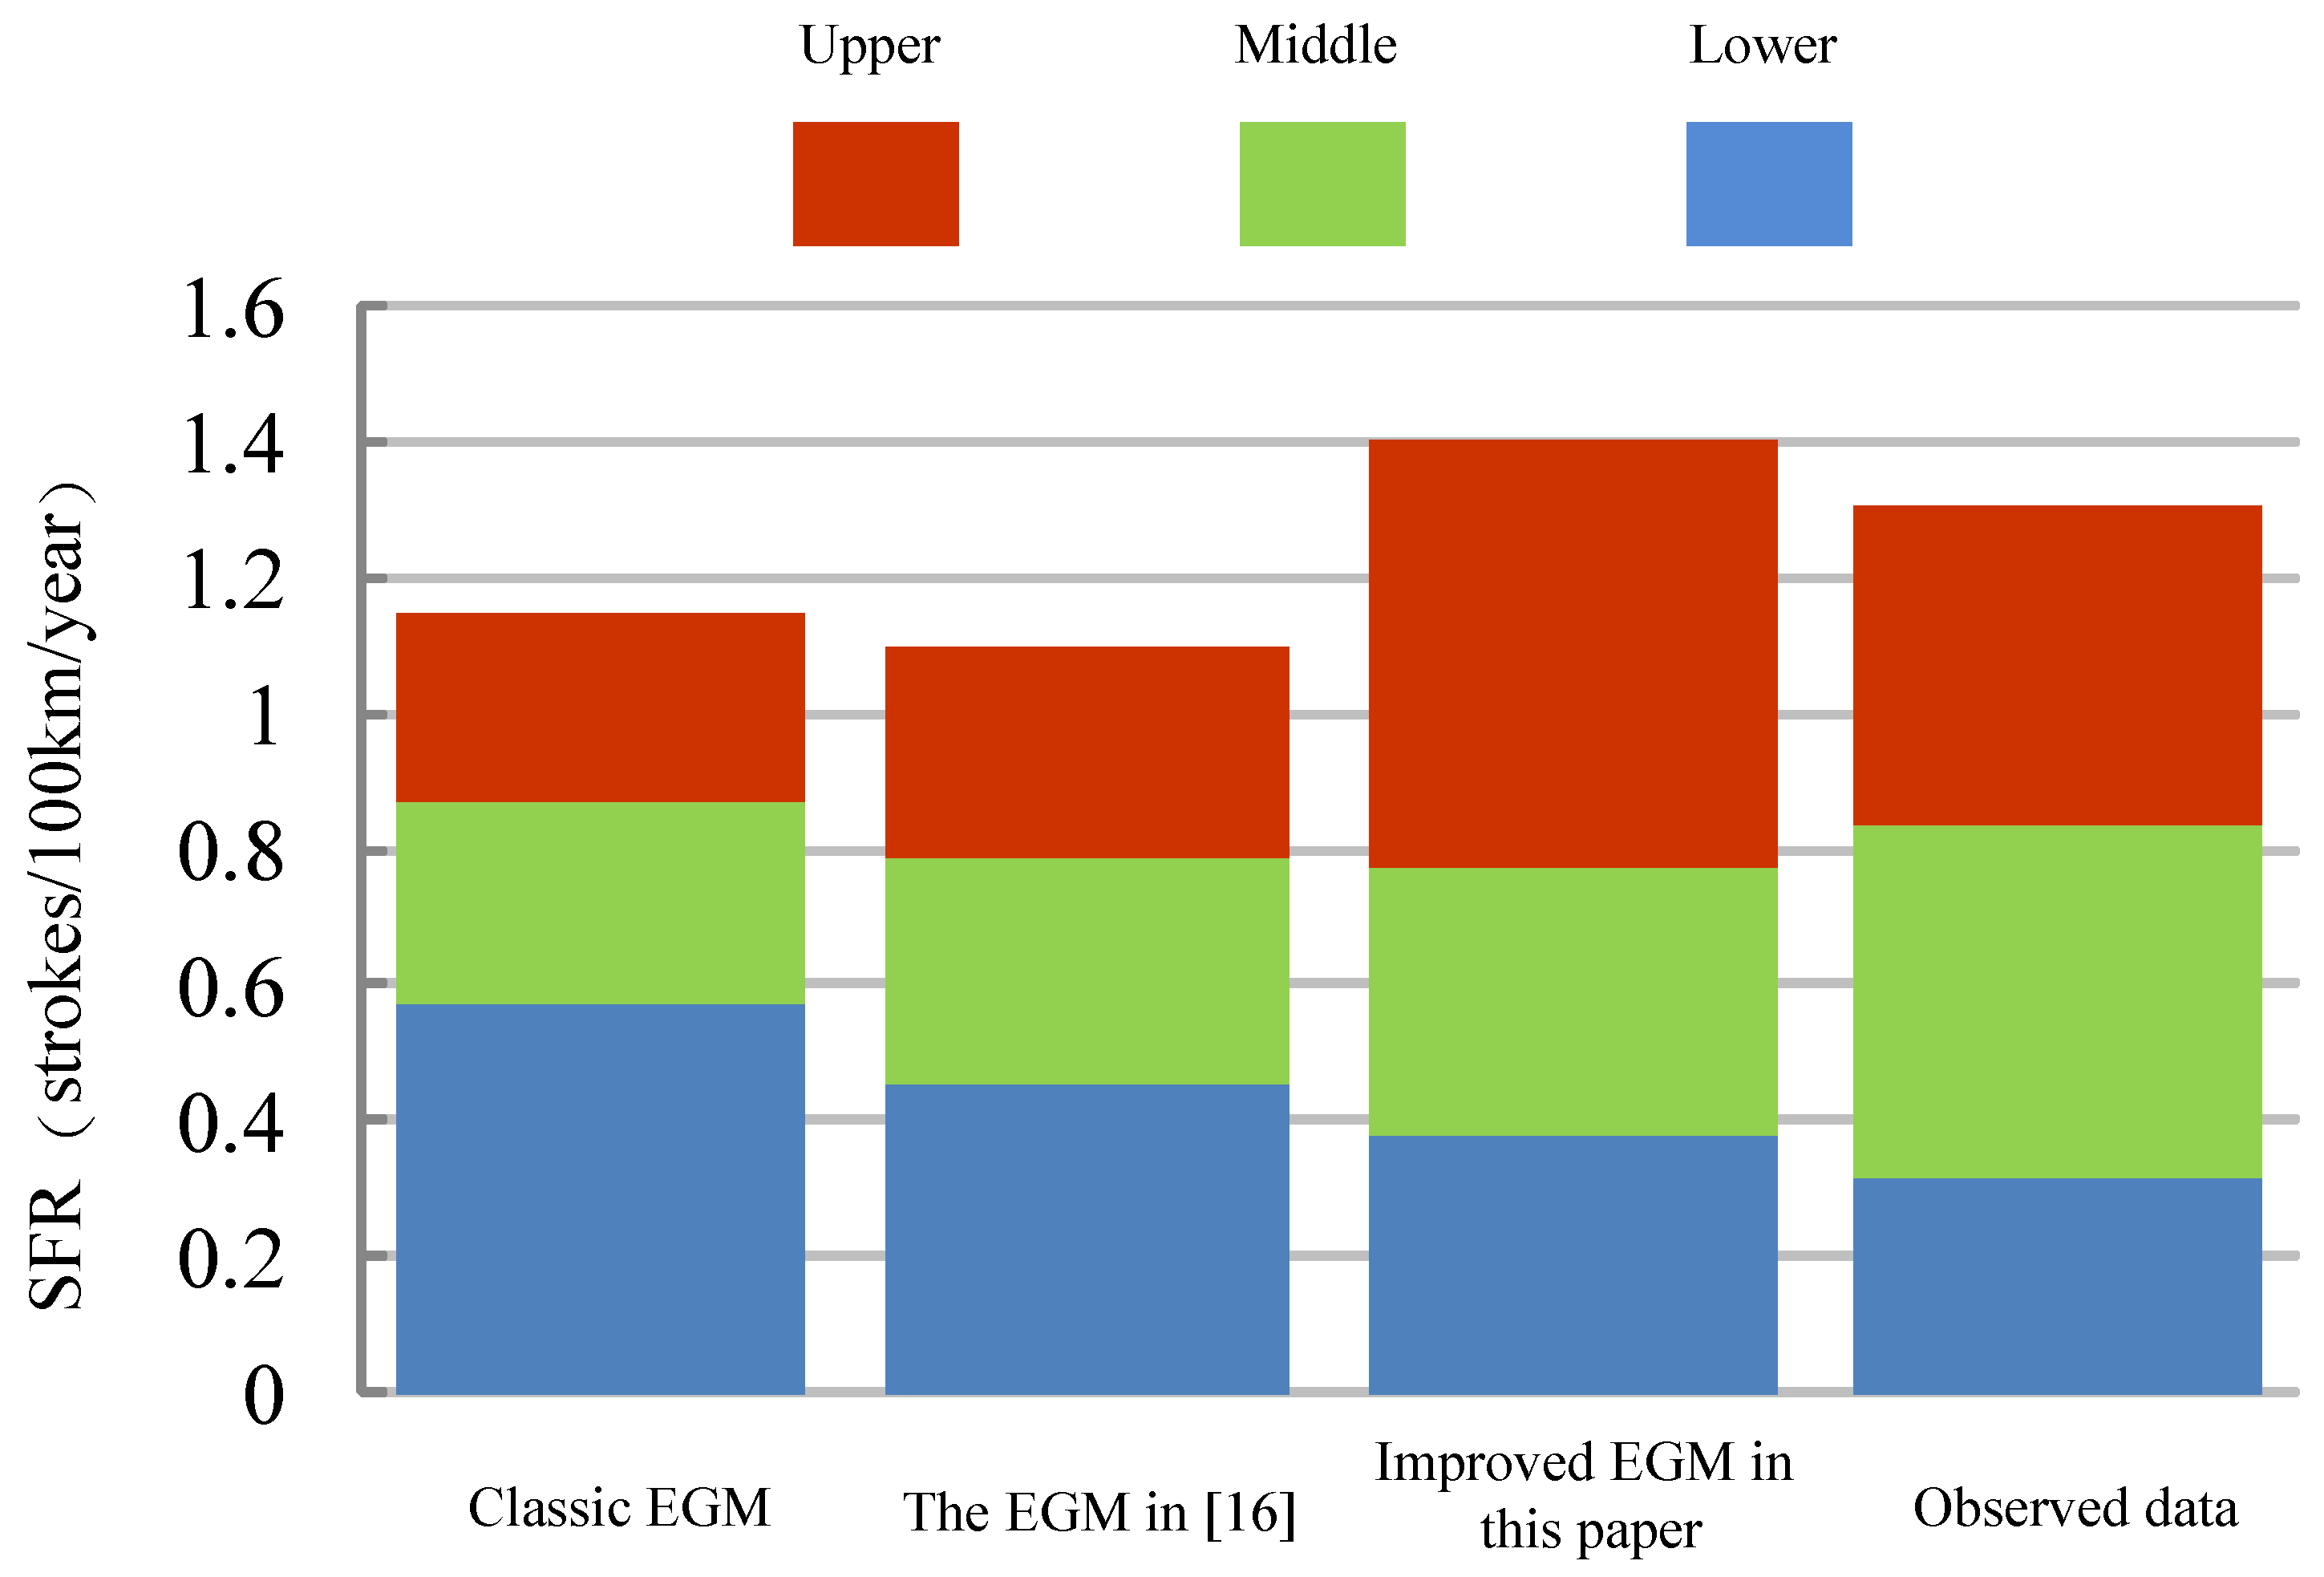
Figure 7.
The frequency of lightning strikes of 500 kV transmission lines observed and calculated by different EGMs.
We define the relative error as follows:
where, Pc% is the calculated ratio between the frequency of lightning strikes of each phase and the total frequency of lightning strikes. Po% is the observed ratio between the frequency of lightning strikes of each phase and the total frequency of lightning strikes.
In addition, we analyze the root mean square error in the paper. The equation of the root mean square error is shown below:
where, ei is the relative errors of some phase wire, and n is the number of wires. Then the results of the root mean square error (RMSE) are shown in Table 2.
Table 2.
The root mean square error of frequency of lightning strikes to power lines observed and calculated by different EGMs.
From the Figure 7, Figure 8 and Figure 9, the following conclusions can be drawn:
- (1)
- For the 500 kV transmission line, a large disparity exists between the total frequencies of lightning strikes calculated using classic model and the observed data.Regarding the 500 kV transmission line, the total frequency of lightning strikes obtained using the EGM proposed in [16] was close to that of observed data. However, a large difference can still be observed in the calculated frequency of lightning strikes of each phase, especially the upper and lower phases.The frequency of lightning strikes of each phase in 500 kV transmission line computed by the improved EGM proposed in the paper is in strong agreement with the observed data.
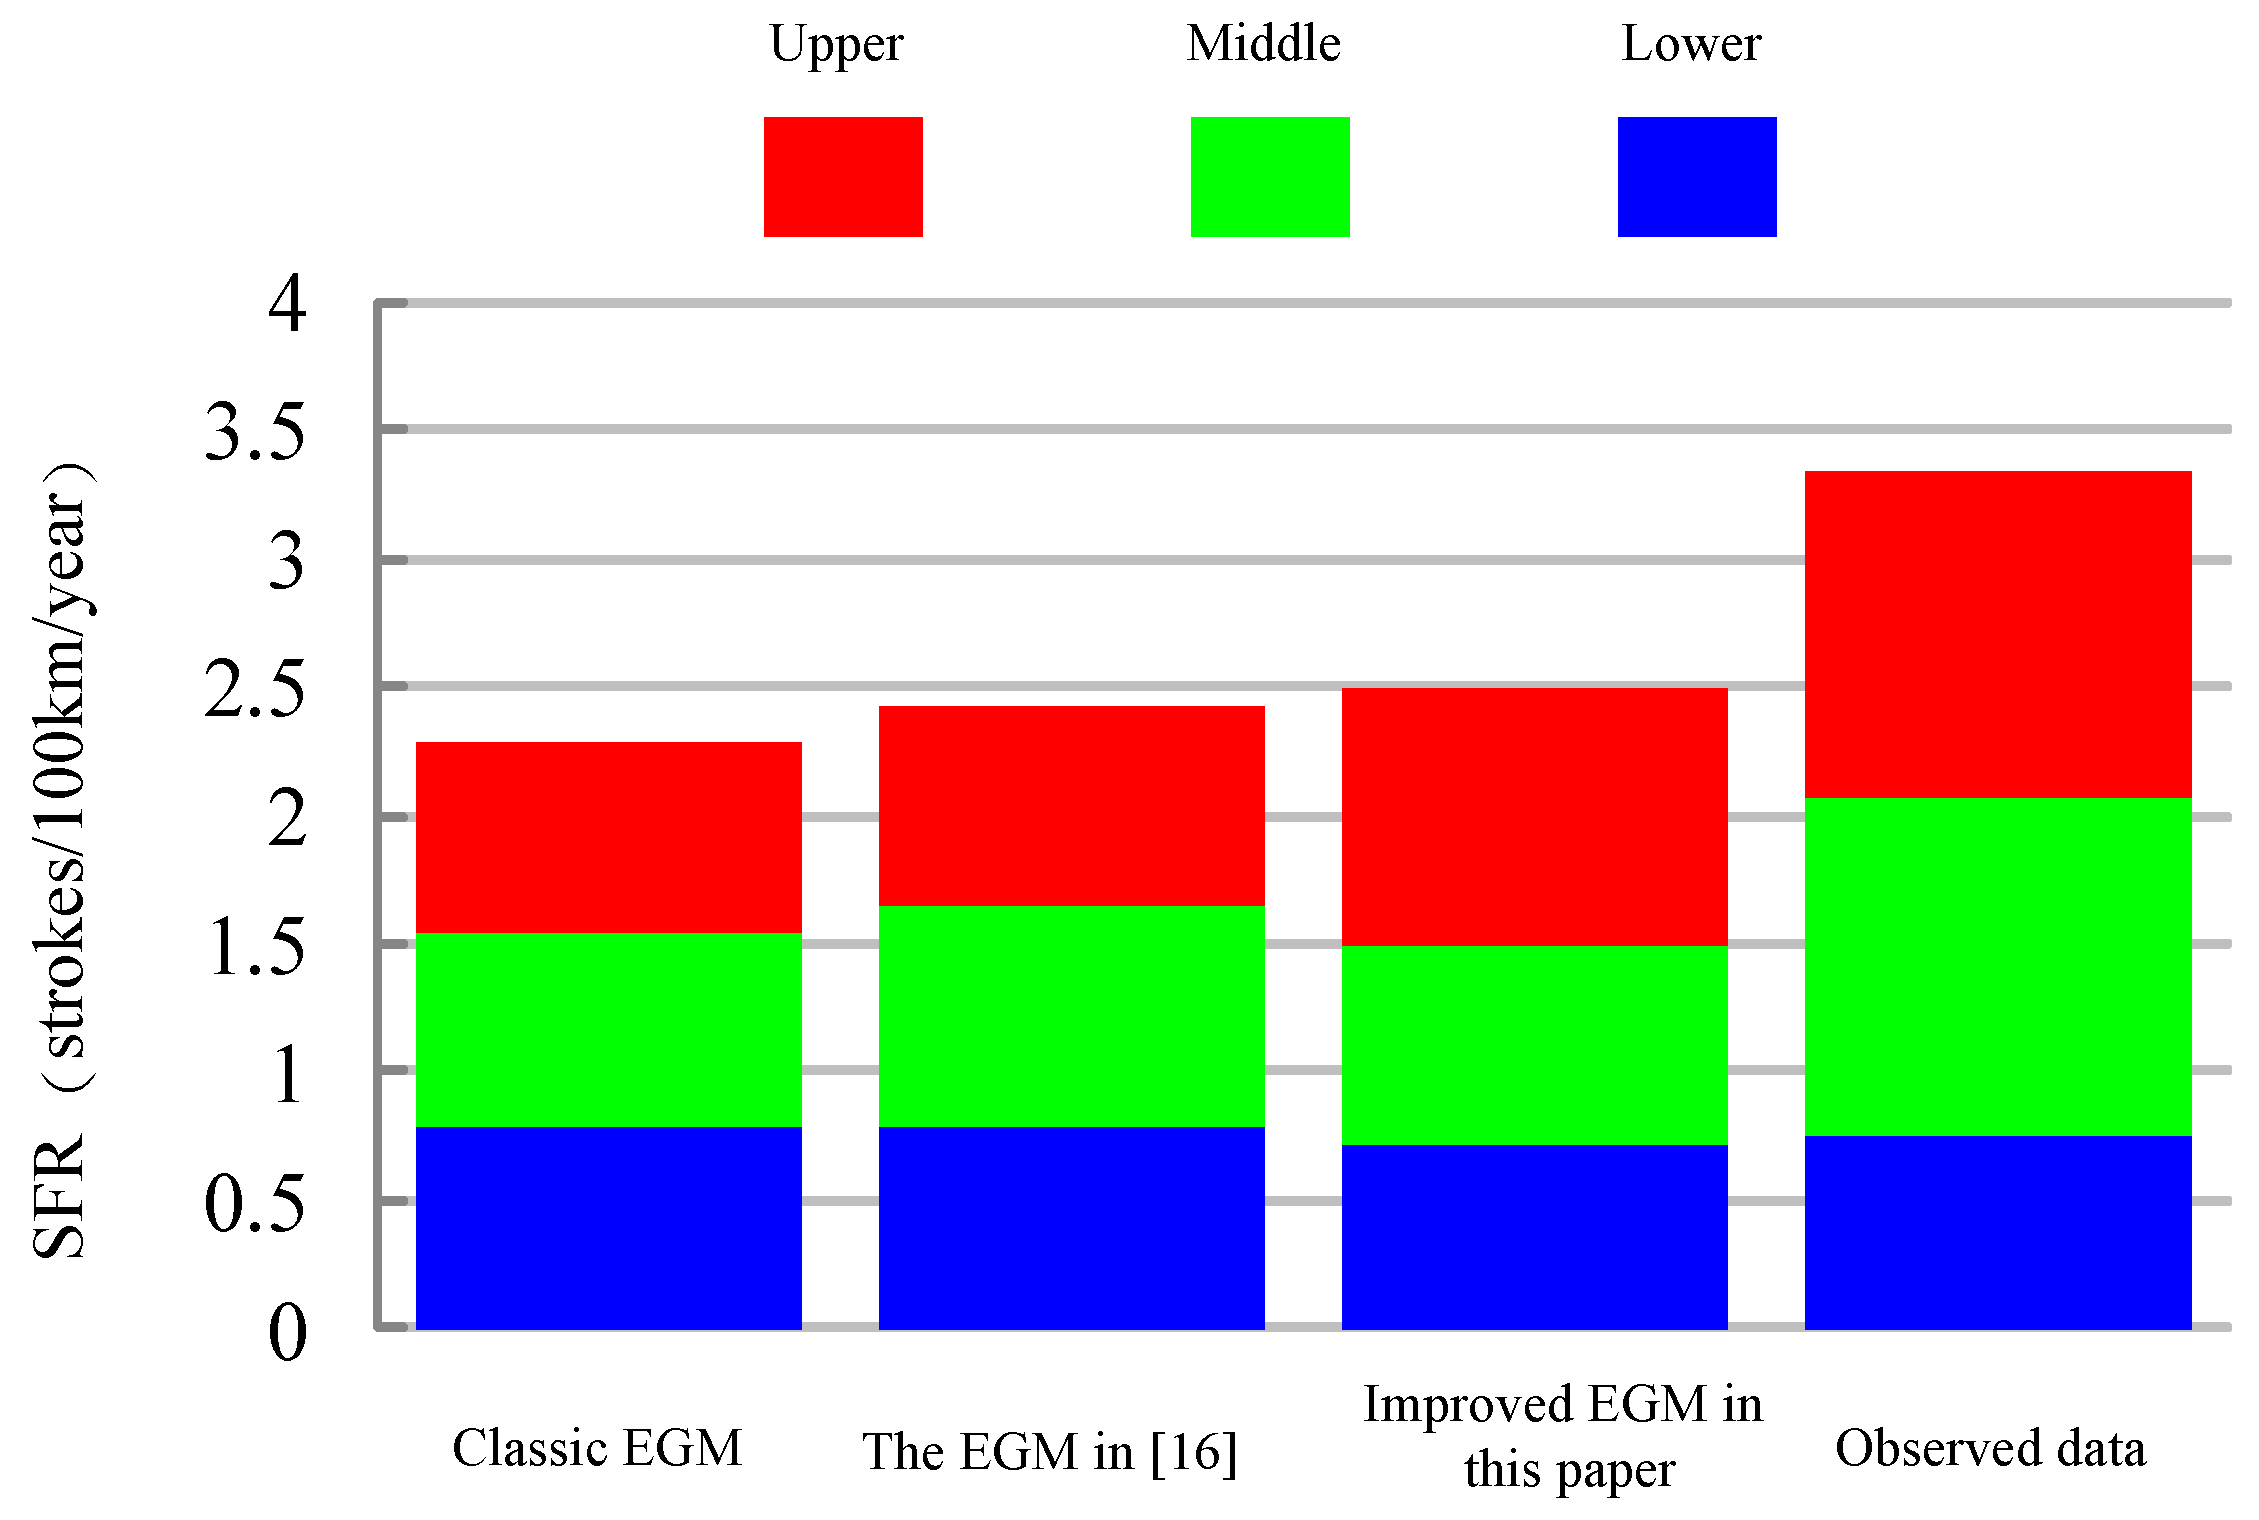
- (2)
- Regarding the 1000 kV transmission line, both the total frequency of lightning strikes and each phase calculated by the classic EGM are substantially different from those of the observed data, indicating that the classic EGM is not suitable for application in 1000 kV transmission lines.The total frequency of lightning strikes calculated by the EGM proposed in [16] was close to the observed data regarding the 1000 kV transmission lines. However, the substantial difference can still be observed between the calculated frequency of lightning strikes of each phase, especially the upper and lower phase.

Figure 8.
The frequency of lightning strikes of 1000 kV transmission lines observed and calculated by different EGMs.
Figure 9.
The relative errors between different calculated results and observed data of each phase of 500 kV and 1000 kV transmission line in Japan. (a) 500 kV; and (b) 1000 kV.
Based on the aforementioned information, the improved EGM proposed in the paper can be regarded as a more suitable method than the classic EGM and the EGM proposed in [16] for application in the EHV and UHV transmission lines.
3.3. Analysis of Calculation Results of UHV Transmssion Line in China
To adequately simulate the actual operational states of UHV transmission lines in China, according to [28], the probability distribution fitting formula for lightning current amplitude, based on the long term observation data from the lightning location system in China and widely used in Chinese lightning protection design, can been expressed as follows:
The ratio of striking the conductor under the 400 m span length was valued at 85.7%. The ground flash density of the 1000 kV line corridor NL was valued at 5.2 strokes/km2/year. The insulation level of UHV transmission lines in China was 4083 kV, and the typical double-circuit transmission of UHV lines in China, SZT1, is shown in Figure 6c.
According to the aforementioned parameters, the shielding failure rate and outage rate of UHV transmission lines in China were calculated using the improved EGM (Table 3).
Table 3.
Frequency of lightning strikes to power lines and shielding failure rate in China calculated based on improved method.
As can be observed in the results, For the SZT1 tower, the frequency of lightning strikes of the middle phase was the highest, whereas those of the upper and lower phase were lower. This is because the negative protection angle between the upper conductor and the ground wire was wide, implying that the shielding effect on the upper conductor is evident. The lower conductor was close to the ground, therefore tending to be shielded by the ground. Thus, the middle conductor suffered more lightning strikes.
The calculated shielding failure rates were low, which is consistent with the actual operation states of 1000 kV transmission lines in China.
4. Conclusions
This paper proposes an improved EGM based on the breakdown test regarding long air gaps. Comparisons of calculated results and observed data have also been analyzed. The following conclusions can be drawn from the results:
- In this study, using data from the rod-rod and rod-plane gap impulse voltage discharge test, where the gap distance were 1–10 m, voltage waveform was 20/2500 µs, with the probability distribution of lightning strike velocity observed by Idone, the relationship between the lightning current and striking distance was amended.
- According to the test results, when the gap distance was lower than 4 m, the 50% discharge voltage of the rod-plane gap was larger than that of the rod-rod gap. When the gap distance exceeded 4 m, the size relationship between two gaps discharge voltages reversed. Thus, the correction factor for the ground was revised to 1.25 based on data firstly.
- By comparing the results calculated using various EGMs and observed data in Japan, both the total frequency of lightning strikes and each phase calculated by the improved EGM proposed in this paper were close to those of the observed data.
- As observed in the calculated results of 1000 kV transmission line in China, the middle conductor tended to suffer more lightning strikes, but the whole shielding failure rate was minor, which is consistent with the actual operation states of 1000 kV transmission lines in China.
- The EGM proposed in the paper is suitable for application in EHV and UHV transmission lines and, therefore, could serve as a basis for lightning shielding designs for EHV and UHV transmission lines.
Acknowledgments
The authors would like to thank the reviewers of this paper for the useful comments. This work is supported by Project Supported by China Postdoctoral Science Foundation (2014M560624) and the China State Grid Corp headquarters project in 2015 (SGTYHT/14-JS-188). The authors also would like to particularly thank Qiming Ye and Yeming Ma (China Electric Power Research Institute, China) for their consistent support throughout the experiment procedure.
Author Contributions
Zhijun Li, Xishan Wen, Yu Wang, and Lei Lan conceived and designed the experiments; Min Dai, Yeqiang Deng, Yunzhu An and Shenglong E performed the experiments; Yeqiang Deng wrote the program of improved the EGM; Yeqiang Deng and Yu Wang wrote the paper.
Conflicts of Interest
The authors declare no conflict of interest.
References
- Liu, Z. Global Energy Internet; China Electric Power Press: Beijing, China, 2015. [Google Scholar]
- Chen, W.; He, H.; Qian, G.; Chen, J.; He, J.; Gu, S.; Xie, S.; Xiang, N. Review of the lightning shielding against direct lightning strokes based on laboratory long air gap discharges. Proc. Chin. Soc. Electr. Eng. 2012, 32, 1–12. [Google Scholar]
- Armstrong, H.R.; Whitehead, E.R. Field and analytical studies of transmission line shielding. IEEE Trans. Power Appar. Syst. 1968, 87, 270–281. [Google Scholar] [CrossRef]
- Golde, R.H. The lightning conductor. J. Frankl. Inst. 1967, 283, 451–463. [Google Scholar] [CrossRef]
- Young, F.S.; Clayton, J.M.; Hileman, A.R. Shielding of transmission lines. IEEE Trans. Power Appar. Syst. 1963, 66, 313–328. [Google Scholar]
- Brown, G.W.; Whitehead, E.R. Field and analytical studies of transmission lines: Part II. IEEE Trans. Power Appar. Syst. 1969, 82, 132–154. [Google Scholar]
- Love, E.R. Improvements in Lightning Stroke Modeling and Applications to the Design of EHV and UHV Transmission Lines; University of Colorado: Boulder, CO, USA, 1973. [Google Scholar]
- Anderson, J.G. Transmission Line Reference Book: 345 kV and above; Electric Power Research Institute: Palo Alto, CA, USA, 1982. [Google Scholar]
- IEEE Working Group. A simplified method for estimating lightning performance of transmission lines. IEEE Trans. Power Appar. Syst. 1985, 104, 919–932. [Google Scholar]
- IEEE Guide for Improving the Lightning Performance of Transmission Lines; IEEE Std 1243-1997; IEEE Working Group: New York, NY, USA, 1997.
- Paris, L. Influence of air gap characteristics on line-to-ground switching surge strength. IEEE Trans. Power Appar. Syst. 1967, 86, 936–947. [Google Scholar] [CrossRef]
- Mousa, A.M.; Srivastava, K.D. A revised electrogeometric model for the termination of lightning strokes on ground objects. In Proceedings of the International Aerospace and Ground Conference on Lightning and Static Electricity, Oklahoma City, OK, USA, 19–22 April 1988; pp. 342–352.
- Taniguchi, S.; Tsuboi, T.; Okabe, S. Observation results of lightning shielding for large-scale transmission lines. IEEE Trans. Dielectr. Electr. Insul. 2009, 16, 552–559. [Google Scholar] [CrossRef]
- Takami, J.; Okabe, S. Characteristics of direct lightning strokes to phase conductors of UHV transmission line. IEEE Trans. Power Deliv. 2007, 22, 537–546. [Google Scholar] [CrossRef]
- Taniguchi, S.; Okabe, S. Flashover Characteristics of long air gaps with negative switching impulses. IEEE Trans. Dielectr. Electr. Insul. 2008, 15, 399–406. [Google Scholar] [CrossRef]
- Taniguchi, S. Improved method of calculating lightning stroke rate to large-sized transmission lines based on electric geometry model. IEEE Trans. Dielectr. Electr. Insul. 2010, 17. [Google Scholar] [CrossRef]
- Wang, Y.; Wen, X.; Lan, L.; An, Y.; Dai, M.; Gu, D.; Li, Z. Breakdown characteristics of long air gap with negative polarity switching impulse. IEEE Trans. Dielectr. Electr. Insul. 2014, 21, 603–611. [Google Scholar] [CrossRef]
- Wagner, C.F. The relation between stroke current and the velocity of the return stroke. Power Appar. Syst. 1963, 82, 609–617. [Google Scholar] [CrossRef]
- Idone, V.P.; Orville, R.E. Lightning return stroke velocities in the thunderstorm research international program (TRIP). J. Geophys. Res. 1982, 87, 4903–4916. [Google Scholar] [CrossRef]
- Wagner, C.F.; Hileman, A.R. The lightning stroke-II. Power Appar. Syst. Part III Trans. Am. Inst. Electr. Eng. 1961, 80, 622–636. [Google Scholar] [CrossRef]
- Uman, M.A. The Lightning Discharge; Academic Press, Inc.: Orlando, FL, USA, 1987. [Google Scholar]
- Berger, K. Novel observations on lightning discharges results of research on mount san Salvatore. J. Frankl. Inst. 1967, 283, 478–525. [Google Scholar] [CrossRef]
- Golde, R.H. Lightning (Volume 1); Academic Press: London, UK, 1977. [Google Scholar]
- Bazelyan, E.M.; Raizer, Y.P. Lightning Physics and Lightning Protection; CRC Press: Boca Raton, FL, USA, 2000. [Google Scholar]
- Wang, Y.; Li, Z.; Dai, M.; Wen, X.; Lan, L.; An, Y.; Ye, Q. Research on typical long air gaps with negative switching impulses (i)-experiments. Proc. Chin. Soc. Electr. Eng. 2014, 34, 3534–3540. [Google Scholar]
- An, Y.; Dai, M.; Li, Z.; Lan, L.; Wen, X.; Wang, Y.; Ye, Q. Research on typical long air gaps with negative switching impulses (ii)-gap factor. Proc. Chin. Soc. Electr. Eng. 2014, 34, 4145–4151. [Google Scholar]
- Mousa, A.M.; Srivastava, K.D. The distribution of lightning strokes to towers and along the span of shielded and unshielded power lines. Can. J. Electr. Comput. Eng. 1990, 15, 115–122. [Google Scholar] [CrossRef]
- DL/T620-1997 Overvoltage Protection and Insulation Coordination for AC Electrical Installations. Available online: http://d.g.wanfangdata.com.cn/Standard_DL/T%20620-1997.aspx (accessed on 10 January 2017).


© 2017 by the authors. Licensee MDPI, Basel, Switzerland. This article is an open access article distributed under the terms and conditions of the Creative Commons Attribution (CC BY) license ( http://creativecommons.org/licenses/by/4.0/).