Abstract
Non-linear high-power devices produce electromagnetic noise (EMN) sources of great intensity that can disrupt and damage the surrounding electrical equipment and devices. This radiative phenomenon is very common at facilities where pulsed power generators are required, particularly those that are needed to produce dense transient plasma experiments. These conditions are found at the Chilean Nuclear Energy Commission (CCHEN), due to the presence of pulsed power generators that switch large currents (kA-MA) in short times (10–100 ns). In order to characterize and establish conditions to mitigate the effects of the EMN on nearby devices, a measurement system based on an ultra-high frequency (UHF) dipole antenna was developed. We evaluated the system measuring the EMN emanated from a plasma focus device, the PF-400J. Measurements at the place indicated broadband and intense electric fields that can couple to nearby cables and equipment (10–300 MHz bandwidth, up to 350 V/MHz spectral intensity, 100 V coupled voltage). Based on these measurements a compact and simple protection system was designed, built and tested, capable of effectively mitigating the high levels of EMN. The proper EMN impact mitigation indicates the correct operation of the suggested system. The developed system can be of interest to the energy community by facilitating EMN measurement produced by arc discharges.
1. Introduction
The international plasma community has demonstrated a renewed interest in dense plasma focus devices (DPFs), due to their many capabilities that make them versatile apparatus in research and applications [1]. These self-scale plasma devices can generate neutron pulses [2,3,4], work as a pulsed X-ray source [5], produce plasma shocks [6], supersonic plasma jets [7], plasma filamentation [8], scaled astrophysical experiments [7] and they can also be used as a source to test new materials for the first wall of future fusion devices [9].
During operation, DPF devices generate dynamical plasma structures at the top of concentric electrodes, where the central electrode is partially covered by an insulator sleeve (Figure 1). These plasmas are produced in a vacuum vessel that is filled with a small amount of a working gas, for example, hydrogen or deuterium (~7–15 mbar). A capacitor bank is charged and a triggered high voltage switch (spark gap) is closed, allowing the current to flow through the insulator surface as shown in Figure 2. Lorentz forces detach the current sheath from the insulator, forcing its movement towards the electrode end. At that moment, the same forces generate a compressional effect which produces a plasma column of very small volume with a high temperature and density [10]. Depending on the working gas, this column can produce pulses of neutrons, ions and electrons, as well as visible to X-ray pulsed radiation. Unfortunately, during the plasma generation process, electrical disruption processes are created which originate very large amplitude EMN sources whose spectral and temporal behavior is very similar to that generated by other types of physical and electrical phenomena (Z-pinches [11,12], wire arrays [13], capillary discharges [14], partial discharges [15], etc.). These transient electromagnetic emissions can easily couple to cables, conductors and electronic systems of the surrounding equipment [16,17], causing permanent damage and catastrophic failure of these equipment [18,19].
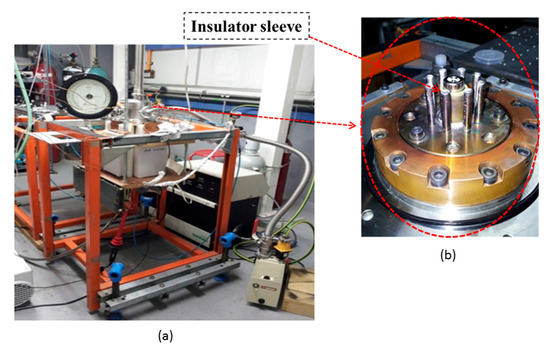
Figure 1.
(a) Image of the PF-400J discharge, with the vacuum chamber on top and the capacitor bank at the center of the frame. The frame is approximately 50 × 60 × 90 cm; (b) Coaxial electrode assembly. Anode is at the center; the insulator sleeve covering most of the electrode; cathode bars on the outside.
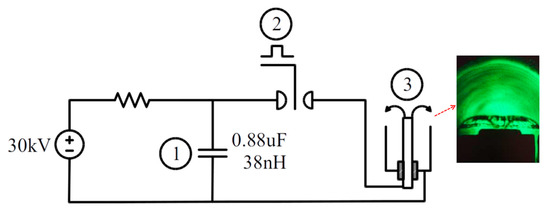
Figure 2.
Schematic of plasma focus PF-400J. Operation: ① the capacitor is charged up to 27 kV; ② a signal triggers the spark-gap and ③ the current flows through the coaxial electrodes.
Characterization of the transient electromagnetic noise from industrial devices has been developed extensively, in order to comply with emission regulations. Nevertheless, measurement of the EMN emitted from experimental devices developed in research laboratories is less common. Gayen et al. [20] measured the electromagnetic noise emission from a copper vapor laser in a research laboratory environment, where a high voltage, high current power supply (15–20 kV, 1–2 kA) was used to generate the laser emission. They found an EM signal emitted from the pulsed power supply unit with several peaks between 1 to 37 MHz with amplitudes above the standard limit of 40 dBμV/m.
Plasma foci are experimental devices, mainly composed of high voltage capacitors and high voltage/high current switches, expected to produce intense pulses of EM noise [21] which can damage nearby devices. Siew et al. [22] addresses this issue in a high voltage generator similar to a plasma focus. The authors reported electric and magnetic field measurements made with E-dot and H-dot probes, from which they suggest the use of a series of filters and a shielding system to protect the electronic devices which are under the electromagnetic effects described above.
This paper presents the design and implementation of a measurement system for high and fast intensity fields, generated by the operation of the PF-400J device, available at CCHEN (30 kV, 140 kA achieved at 300 ns at short circuit). Additionally, the authors implemented a simple but effective protection system, in order to validate the results obtained with the proposed measurement system. Finally, this stage of protection allowed to adequately minimize the harmful effects of EM noise signals in commercial equipment available in the laboratory.
2. Electrical Noise
In general, the electrical noise can be classified into three types—capacitive, inductive and electromagnetic interference—depending on its coupling mechanism. These types of disturbances, which in some cases may be of great amplitude, are directly coupled to the lines or power cables of any device or electrical equipment, causing irreparable damage to the insulation systems and electronic components of the latter [18,23]. Traditionally, the noise that appears due to the inductive or capacitive coupling of the transient phenomena can be easily measured by capacitive/resistive voltage dividers, high-frequency current transformers (HFCT), inductive loop sensors (ILS) and Rogowski coils (RC) [24]. For the case of EMN, which is the type of noise addressed in this paper, the measurement can be done easily, through antennas or UHF sensors [25]. However, it is necessary to establish in advance the nature of the signal under study according to its temporal and frequency characteristics, to select the most appropriate antenna at the time of the measurement. In this sense, the EMN can be classified into several categories [25]:
- Continuous sinusoidal noise from communication systems such as FM radio, digital TV, Digital Audio Broadcasting, Global System for Mobile communications and Wi-Fi.
- Stochastic noise, random in both time and amplitude such as corona or plasma in air that can emit energy up to 500 MHz, though in most cases (sparking and lamp ignition) they only reach 250 MHz [26].
- Periodic-pulsing noise from thyristor operation, i.e., inverters and voltage or current regulated sources among others.
According to the above, a low cost, simple to manufacture and maintain electromagnetic burst measurement system to measure EMN generated from a DPF devices, has been developed. This method can also be used to measure and study the noise produced by other type of phenomena just making changes in the type of antenna according to the spectral content of the signals to be measured. For the system presented in this paper, the EMN measurement was performed by a dipole antenna characterized to remove its own spectral response. Although the antenna was optimized for a narrow band of frequencies, the electromagnetic burst has a high amplitude, which allows the detection of frequencies far from the optimal region of antenna.
Since we will measure burst signals with frequencies way below the resonance frequency of the UHF antenna, we need to compensate for the attenuation that the signals will suffer by being detected with this antenna optimized for higher frequencies. Thus, we need to determine the antenna factor (AF) at these low frequencies to properly estimate the electric field of the EMN. The antenna was selected at higher frequencies for two main reasons: (1) to produce the smallest perturbation of the electric field of the burst, which is achieved by a small antenna (optimized for high frequencies); and (2) to avoid damage in the equipment acting as receiver, in our case an oscilloscope. To be able to receive EMN signals far from the resonance frequency of the antenna guaranties that the voltage getting into the oscilloscope is at safe levels even for intense EMN bursts. To determine the AF for the frequency range of interest of the antenna, the Standard Site Method was used, which is described in the following section [27,28].
3. Characterization and Calibration of the Measurement System
This section describes the proposed system, which is based on a dipole antenna. The EMN intensity estimation at different frequencies is obtained by weighting the voltage measured at the antenna terminals by the named antenna factors. The AF is the ratio between the electric field magnitude and the voltage at the antenna terminals for each frequency of interest (AF(f) = E(f)/V(f)). The AF for our antenna was obtained theoretically (via simulation) and validated for a range of frequencies by using the Standard Site Method (SSM) [27,28].
3.1. Antenna Design and EMN Intensity Estimation Procedure
The electromagnetic fields generated by an electric device can be coupled to cables and electronic circuits of the surrounding equipment and cause malfunctions on them. In particular, the varying magnetic fields generate currents in electrical circuits that can have a current flow through the perimeter of an area perpendicular to the field (induction). In general, the larger the area of the current path, the greater the inducted signal. This phenomenon is not addressed in the present article, since the induction is not significant in electronic circuits due to their small area and the cables connecting electrical components can be arranged to minimize the surface surrounded by the current.
On the other hand, even if circuit areas are negligible, cables can behave as antennas and absorb energy from the environmental electromagnetic field, which can distort measurements and even damage equipment if the fields are strong enough [29]. An alternative to minimize this effect is to enclose everything in a Faraday cage, but this is not always practical or economical. For example, at CCHEN there are devices that must be physically connected to the source of noise, and therefore cannot be isolated from other equipment by means of a large cage. Therefore, it is required to block electric field coupling at the site, which involves prior knowledge of the electrical field spectrum to select filters and arrange cables trying to minimize the coupling.
According to the above, it was necessary to design and implement a UHF sensor (antenna) which allowed to adequately measure the different spectral components associated with the EMN that are produced from the dense plasma focus devices. Additionally, the antenna was developed to satisfy the following requirements: (1) to induce small perturbations in the measured field; (2) to have a fast response; (3) to have a linear response for signals of large amplitude; (4) to provide a signal measurable by a normal oscilloscope without the need of amplification; (5) to be low cost and (6) to be easy to build. Additionally, was necessary to have a calibration method to transform the signal given by the probe into a reliable estimation of the electric field spectrum.
After numerous laboratory tests, a 0.3 m small dipole antenna with a coaxial balun (Figure 3) was implemented as sensor. The final prototype antenna was printed on a circuit board of 0.30 m long and 0.025 m wide. The conductive wire was set to a width of 1.5 mm and both ends were connected to two coaxial connectors that are used as the output of the antenna. It was calibrated with a set of AF which allows the estimation of the electric filed intensity from the voltage signal at the antenna terminals for each frequency of interest. The coaxial balun was used since its response has a linear trend for large electrical fields, due to its composition based on shielded conductors and its absence of coils and magnetic components that can saturate with intense magnetic signals, as occurs with coil baluns and ferrites [24,30]. As described later in this section, the broadband requirements were reached by the use of the AF, which compensate for the frequency response of the antenna.
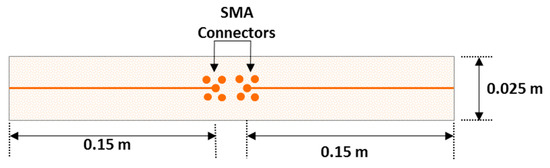
Figure 3.
Small dipole antenna with coaxial balun used as electric field probe. The arms are connected through SMA ports to coaxial cables.
With respect to the design of the antenna, it is necessary to point out that several tradeoffs were applied. On one hand, while the smaller the antenna, the less its sensitivity for low frequencies. On the other hand, while the larger the probe, the greater the perturbation introduced by the antenna to the field, making the measurements less reliable and the response slower [15]. Finally, the resonant frequency (RF) of the antenna was selected to be far from the high intensity fields radiated by the measured phenomenon. These high intensity fields can damage the receiver, which in our case is an oscilloscope, in addition to hamper the estimation procedure at other frequencies due to the high sensitivity of the antenna at the resonant frequency. For this reason, the resonant frequency of the antenna was located close to 500 MHz which is much higher than the expected frequency for the high intensity EMN, yielding an antenna of 0.3 m in length. In addition to the antenna, an oscilloscope with two-channels available was required for the measurements. Each arm of the antenna was connected to a different oscilloscope channel using the inner conductor of coaxial cables.
The external shield of each of the cables was connected to the oscilloscope ground to protect the antenna signals from interference. Both channels of the oscilloscope had common ground and they sampled synchronously. The signal of the antenna was computed as the subtraction of the measurements of the oscilloscope channels. The electric field spectrum was calculated using the Fast Fourier Transform (FFT) of the dipole signal and multiplying each frequency component with the corresponding AF. The oscilloscope used had a 600 MHz bandwidth.
3.2. Calculation of the Antenna Factor
The AF is the ratio between the electric field and the voltage at the antenna terminals for each frequency of interest. The AF for each frequency of interest was estimated through simulation of the dipole antenna by using the High Frequency Structural Simulator (HFSS) software package [31]. The model of the antenna was exposed to a sinusoidal electrical field of specific frequency and intensity. The voltage appearing at the terminals of the antenna was measured and, together with the electrical field used in the simulation, the AF was computed for each frequency. The procedure was repeated in a frequency sweep, ranging from 1 MHz to 300 MHz, producing the results shown in Figure 4.
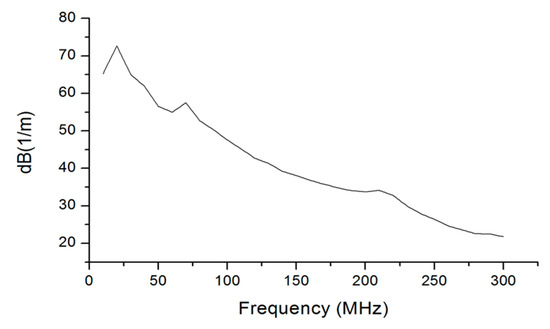
Figure 4.
Simulated antenna factors for 0.3 m dipole with coaxial balun. The antenna model was simulated in HFSS.
As expected, the simulation indicates that at lower frequencies the electric field must be stronger to generate a measurable signal in the antenna, and the opposite happens with higher frequency stimulus. For instance, at 300 MHz the AF is about 20 dB, which means that the electric field is 10 times the voltage measured at the terminals. At 50 MHz, the AF is about 60 dB, and, in this case, the electric field is 1000 times the magnitude of the voltage signal generated by the probe. In our application, the field generated by the PF-400J can produce a strong signal in the antenna that must be attenuated around 20 dB to 40 dB to avoid saturation in the oscilloscope at high frequency, still allowing detectability at low frequencies.
3.3. Experimental Validation of the Antenna Factor
To verify the simulation results, the AF were also experimentally measured using the Standard Site Method (SSM) [27,28] for a subset of frequencies. The used setup comprises a metallic ground plane in an open area, a set of three antennas (two 2 m-dipoles and one 0.3 m-dipole), a RF generator and an oscilloscope as receiver.
The procedure consisted in using one of the 2 m-dipole antennas as the generator. Thus, first it was necessary to use the other 2 m-dipole antenna as the receiver antenna to obtain the AF for this antenna. Then with these factors it was possible to estimate the electric field that would be generated by the 2 m-dipole antenna as transceiver, if its frequency response was flat over a broad range of frequencies. Thus, allowing the estimation of the AF of the 0.3 m-dipole-antenna when used as the receiver.
The experimental setup to perform SSM is depicted in Figure 5. The procedure considered an initial measurement phase with two identical 2 m-dipoles with a ferrite balun. This phase was necessary to obtain the AF for the 2 m-dipole in a single measurement, by using a simplified version of the SSM, valid only for identical antennas [27,28]. The final measurement phase, using the standard site method, considered one 2 m-dipole and one 0.3 m-dipole with a coaxial balun. The antennas were separated a distance of 10 m above a 15 m × 5 m metallic plane, which was the greatest surface attainable in our dependencies. The larger the separation between antennas and ground plane area, the better the accuracy of the SSM. The emitter antenna was placed at 2 m height from the ground plane to prevent coupling with the plane, following the SSM configuration which allows the use of the mathematical model for this configuration. The receiving antenna was scanned between 1 m and 4 m to search the maximum signal for each frequency.
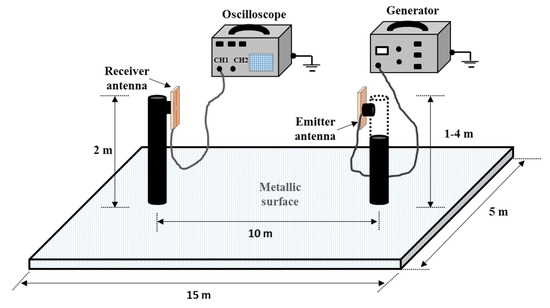
Figure 5.
Schematic of the experimental set up used to estimate the antenna factors of the 0.3 m dipole antenna (or electric field probe). The transmitter antenna was a 2 m-dipole antenna. The 2 m-dipole antenna was used as a transceiver to avoid complex coupling connection to the 0.3 m-dipole antenna to be used as a transceiver. The initial measurement phase considered the 2 m-dipole antenna, in order to find the AF for that configuration. In the final measurement stage the transceiver was replaced with a 0.3 m-dipole, in order to determine the AF of that receiving antenna.
The experimental validation of the AF was made for sinusoids with frequencies ranging from 100 MHz and 220 MHz, imposed by the operational range of our RF generator and the detection of strong enough signals in our oscilloscope. Then, the 0.3 m-dipole was used as receiver and the amplitude of the detected signals were recorded. The AF measured and simulated within the frequency range for the 0.3 m-dipole are shown in Figure 6. When comparing the AF simulated and measured, a very similar behavior was observed for the frequency band analyzed, confirming the validity of the simulation. Thus, we use the measured AF for the range 100 MHz to 200 MHz and simulated below 100 MHz and over 200 MHz (up to 300 MHz).
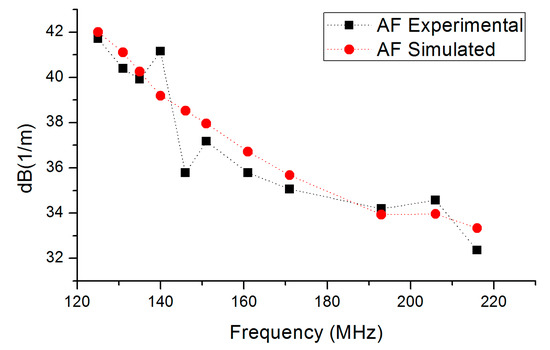
Figure 6.
Experimental and simulated antenna factors versus frequency. Connecting lines are referential, to help the reader.
4. Measurement of an EMN Case
To evaluate the capacity of the proposed system to properly measure EMN features, the results obtained with the system were compared to other methodologies of measurements. To directly characterize the PF-400J operation and EMN correspondence with the discharge phases, a resistive voltage divider was connected to the discharge electrodes and a Rogowski coil was placed in the current return path, to measure the current derivative evolution. The electric field that affects instruments close to the PF-400J discharge was registered by the dipole antenna with a coaxial balun, placed in the near field at 1.75 m from the EMN source. This is the typical separation of the instruments and sensitive equipment used in the laboratory. The voltage between the antenna terminals was recorded during pulsed plasma discharges.
The data was processed to get the electric field spectrum by decomposing the voltage signal using the FFT and then multiplying the AF to the frequency components. The method assumes that the electric field generated by the plasma focus is a mixture of several sinusoids and that the probe will provide a voltage signal containing the same frequencies with intensities weighted by the inverse of the AF (). Thus, taking the FFT of the voltage registered by the probe, yields the frequencies that compose the electric field, and multiplying the FFT coefficients by the AF, the electric field intensity is recovered for each frequency.
Figure 7a shows as a function of time: the voltage between the electrodes measured with a resistive voltage divider; the derivative of the discharge current registered with a Rogowski coil; and the EMN signal measured by the dipole antenna. All the signals were captured synchronously by the same oscilloscope during a plasma discharge. It is possible to see that despite a difference in the detection time of the order of tens of nanoseconds the antenna probe captures the main features of the electromagnetic burst. The signals have two abrupt transitions: the first corresponds to the breakdown of the spark gap and the gas over the insulator sleeve that covers the anode of the discharge (location 2 in Figure 2); the second corresponds to the moment of maximum compression of the plasma column (called plasma pinch) inside the PF-400J discharge (location 3 in Figure 2).
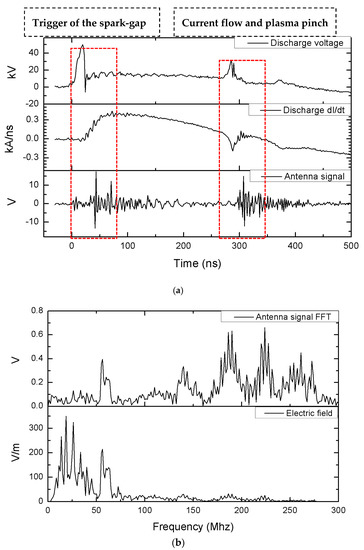
Figure 7.
Time evolution of the electrical signals in the experiment; (a) Signals from the PF-400J voltage divider (top), PF-400J Rogowski coil (middle) and dipole antenna connected to the oscilloscope (bottom); (b) FFT of the signal detected by the antenna (top) and the estimated electric field with the AF (bottom).
Figure 7b depicts the FFT of the antenna signal and the spectrum estimated using the AF. The voltage spectrum displays one component at 70 MHz and several peaks for frequencies above 100 MHz. In general the higher frequencies have stronger peaks, because the dipole is more sensitive to these components. As shown in Equation (1), its resonant frequency (Fr) is around 500 MHz:
where λ = c/Fr, L is the length of the antenna and c the speed of light (3 × 10⁸ ms−1).
After applying the AF correction, the low spectral components acquire greater importance than the higher ones, since the antenna is optimized to detect signals at higher frequencies. According to the calculation, below 70 MHz several peaks exceeding 100 V/m reaching up to 350 V/m can be found. Such high electric field values might affect electronic devices designed for industrial environments, since manufacturers test them with weaker fields [32].
The electric field spectrum is useful to have an estimation of the frequency components present in the burst and their absolute intensity, which is helpful to assess how the fields will affect a device and to select means of EM noise attenuation. The results in Figure 7b show that the spectrum has a 70 MHz peak and other strong components at lower frequencies, which should produce large resonances with cables of 2 m or longer (2 m is half the wavelength for 70 MHz).
EMN Estimation Made with the Antenna System: Measurement Coupled to a Cable Section
Once the nature of the electromagnetic burst was measured and its magnitudes at different frequencies were estimated, a cable was used to evaluate what type of EMN the electronic equipment might receive if the electromagnetic burst is coupled through the cables. For this purpose, a Leybold NT10 turbo molecular pump controller cable was used, which is employed to connect the NT10 pump with its electrical controller in order to attain low pressures (~10−6 mbar) in the PF-400J discharge vessel. It was observed before that if the vacuum system was operated at the same time as the Plasma Focus discharges, the controller exhibited an erratic behavior or ultimately, a catastrophic failure occurred. The cable, comprised of 6 shielded threads of 3 m length each one, was placed between 1 m and 2 m from the PF-400J device (in operation) and its terminals were connected to the oscilloscope.
The noise signal and its FFT are shown in Figure 8. The data shows two electromagnetic noise peaks similar to the ones seen in the previous experiment where the 0.3 m-dipole antenna was used to probe the EM noise. The perturbation has an amplitude exceeding 100 V peak to peak and frequency components reaching 200 MHz. The results confirm that the signal is intense enough to cause permanent damage in electronic devices [18,33,34]. The displacements of the spectral components of greater amplitude to higher frequencies occur due to the inductive and capacitive effects of the cable itself. However, the results resemble that shown in Figure 7b, where there was a high spectral content around 70 MHz and the (100–200) MHz band.
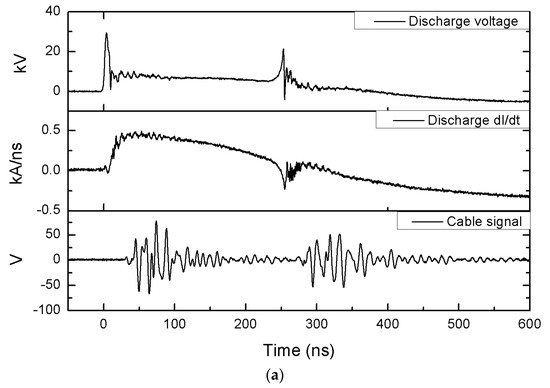
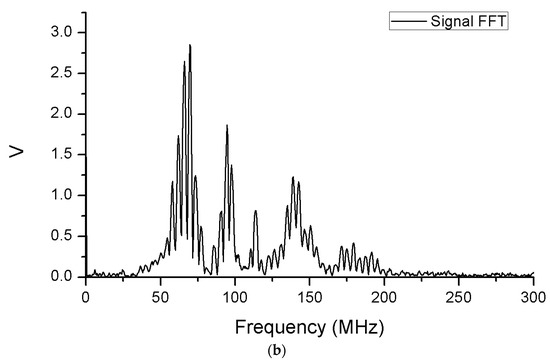
Figure 8.
Time evolution of the signals in the discharge for the cable coupling measurements; (a) Signals from the PF-400J voltage divider (top), PF-400J Rogowski coil (middle) and cable connected to the oscilloscope (bottom); (b) FFT of the signal couple to the cable.
5. Protection System
The previous EMN measurements were helpful to establish the protection system requirements. The electric field data indicated that the noise has significant amplitude in all of the frequencies analyzed. The cable test showed that the voltage fluctuations can surpass 100 V peak to peak and are broadband. From these measurements, we could determine that the electric field and voltage has to be reduced at least one order of magnitude to keep the electronic devices safe [18,33,34].
To reduce the harmful effects of the EMN generated from the plasma production in the DPF device, a protection system was implemented to be installed in each of the devices surrounding the PF-400J. This system consisted of two protection mechanisms: the first corresponds to a series of commercial electromagnetic interference suppression filters, attached to the input and/or output cables of each of the devices exposed to this type of radiation. This enabled the protection of the device from the noise that is coupled in each of the cables, which act like antennas to certain frequencies. The second protection mechanism corresponds to a shielding system based on a Faraday cage that attenuated and successfully protected (from the direct radiation that arrived as consequence of the high amplitude electric fields) the electronics of the devices including the filtering step of the first protection mechanism. Figure 9 shows the protection system scheme and its details are described in the following section.
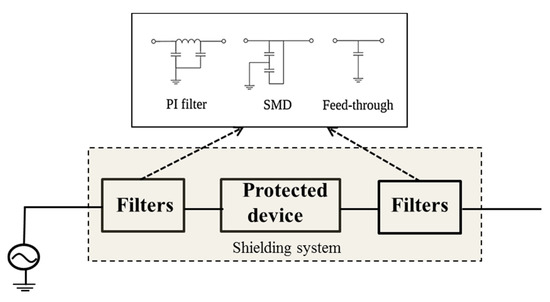
Figure 9.
Protection system scheme and the different filters used.
5.1. Filtering Stage
Based on the results obtained in Section 4, a series of filters were selected, in order to obtain attenuation greater than 20 dB between 30 MHz and 300 MHz. Three types of filters were evaluated on the input and output cables of the protected device: capacitive surface mount device (SMD), PI (due to the geometry of its construction) and feed-through [35].
The capacitive SMD filters excel at low frequencies and are capable to perform well up to several hundreds of MHz due to their small size. The PI and feed-through types are less effective at low frequencies but have an excellent response up to several GHz. Schematics of these filters are seen in Figure 9. The models and their manufacturer specifications are listed in Table 1.

Table 1.
Nominal filter attenuations.
To test each of the filters indicated in Table 1, and simulate real operation conditions, electromagnetic noise was generated with the PF-400J discharge and a turbo-molecular pump was attached to the vacuum chamber, where its control cable was used as antenna.
Each filter was placed inside a small Faraday cage (whose characteristics are explained in the next section), and connected to the turbo pump controller cable. The signals before and after the noise reducer where measured and their attenuations as a function of the frequency were calculated using FFT. The overall damping was obtained with the ratio of the peak-to-peak amplitudes. The results shown in Table 2 indicate that the PI filter performs better with an overall attenuation of 28 dB that surpasses the minimum requirement. Due to these results, this type of filter was selected to reduce the noise in all the cables crossing the protection system.
Table 2.
Effective filter attenuations.
5.2. Shielding System Based on a Faraday Cage
The design and implementation of the shielding system that protects the equipment and its filtering system, from any direct radiation produced by the plasma generation, is based on a Faraday cage which was made using the guidelines reported in [36,37] (see Equations (2)–(5)). These are:
- The field leaked through a slot increases with its maximum diameter and frequency [38]. The attenuation of a single aperture is approximated by:
- The field leaked through a 2 D array of equal slots increases with the squared root of the number of apertures in the largest straight line n [39]:
- The field leaked through a slot decreases exponentially with its depth [39]. For a squared aperture:
- The global attenuation in dB is the sum of the components:
The procedure described above was applied to a Faraday cage, whose dimensions were adapted to completely house the turbo molecular pump and filtering system (30 cm × 20 cm × 20 cm). The cage was made with a metallic square mesh of 6 mm inter spacing and 0.5 mm thickness. The attenuation curve is shown in Figure 10a and indicates an effectiveness over 20 dB between 10 MHz and 300 MHz. To experimentally test these results the 0.3 m dipole antenna was placed inside the Faraday cage and its spectrum was measured during the operation of the PF-400J. The results are depicted in Figure 10b. It is clear that the signal drops over 20 dB for most of the frequency bands.
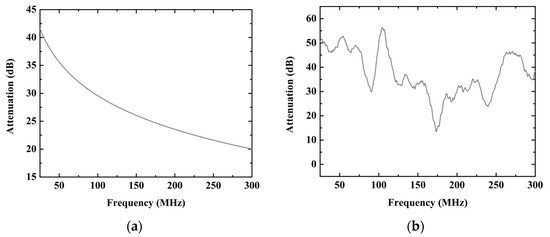
Figure 10.
(a) Estimated attenuation of the Faraday cage calculated by Equation (5); (b) Measured attenuation of the Faraday cage, characterized with the 0.3 m-dipole antenna placed inside the cage.
6. Discussion
It is evident that the level of electromagnetic noise generated from the DPF devices is pulsating in character and of great amplitude. On the other hand, it was observed that these signals can easily couple to electronic devices and equipment close to the noise source, causing immediate damage in the electronics of this equipment, in addition to the long-term consequences that can be suffered the insulation systems involved, as a result of fast coupled transients. In this paper, the authors have proposed a novel measurement system based on a dipole antenna, which allows one to effectively characterize the spectral and temporal nature of the electromagnetic emissions associated to this type of noise. The information obtained from the measurement system, allowed to implement a simple but effective protection system based on commercial filters and a standard shielding system, which adequately mitigated this type of noise.
The performance of the protection system was assessed by measuring the electric field and the voltage induced in the controller cable. The ultimate test was made with a turbo molecular pump controller operating inside a Faraday cage while the PF-400J discharge was running. After hundreds of cycles, the electronic device continued working normally without any evidence of failure. In Figure 11 the results obtained experimentally are shown when the protection system is used in the turbo molecular pump controller/control cable system.
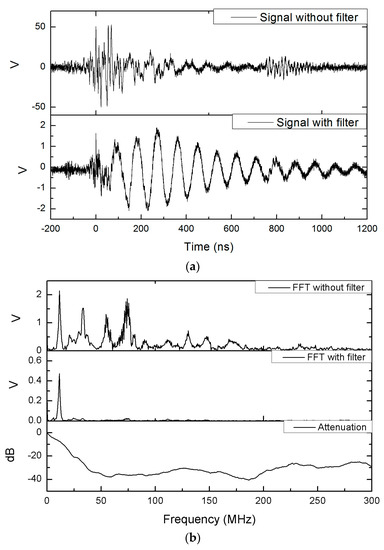
Figure 11.
Signal obtained with the application of the protection system: (a) EMN signal acquired at the controller cable when is connected directly to the pump, compared with the measured signal while passing through the filtering system; (b) FFT plots showing the attenuation of EMN signal for frequencies above 25 MHz. The overall attenuation of the filter system is shown with respect to the frequency.
Clearly, an attenuation of the coupled signal of approximately 28 dB is observed compared with the signal without filter. On the other hand, in Figure 11b, a significant attenuation of the spectral power can be observed in the whole frequency band (20 dB), being more significant above 20 MHz. This indicates that both the filter system and the shielding system work properly. In addition, when the protection system was used, no fault was observed when the equipment was put into operation.
7. Conclusions
A low cost compact electromagnetic noise measurement system based on a 30 cm dipole antenna was designed, developed and tested. The measurement procedure of electric field requires the calibration of the antenna with a coaxial balun. The procedure includes the calculation and validation of antenna factors, which are used to estimate the electric field from the voltage signal at the terminals of the antenna. The validation of the antenna factors was performed by following the standard site method. The system was tested by measuring the electromagnetic noise intensity generated for the operation of a plasma device, the PF-400J. The measured electromagnetic noise radiated from the PF-400J had peaks close to 350 V/m at frequencies below 70 MHz and faster oscillations had an average of 10.8 V/m. The electromagnetic noise estimation made with the antenna probe was compared with measurements obtained with a 3 m cable. The measurements in the cable had an amplitude over 100 Vpp and significant frequency components up to 200 MHz. The main features estimated with the antenna probe were seen within the 3 m-cable confirming the effectiveness of the measurement system.
Based on the antenna probe measurements, a protection system with filters for the cables crossing its boundaries and a shielding system for the electronics of the equipment was designed. The characteristics of the box and the filters were selected to attenuate the perturbations passing through them by at least one order of magnitude. The constructed system had an attenuation over 20 dB for electric fields and 28 dB for voltage signals in frequencies below 300 MHz. The equipment installed inside the cage displayed no signs of perturbations when exposed to electromagnetic noise, which confirms the effectiveness of the electric field measurements and the protection devices.
To the best of our knowledge this type of system is not used for calculating electromagnetic noise produced by other phenomena, such as discharges and arcs. Discharges and arcs are events that usually occur in the operation of high power energy systems. Thus, the proposed system might contribute to estimate the intensity of electromagnetic bursts in energy operation facilitating the protection design of surrounding equipment.
As future work, the authors propose to study new antenna topologies (monopole, Vivaldi and log-periodic, among others) that can be used in the measurements, as well as to evaluate the spectral behavior of these noise signals at higher frequencies.
Acknowledgments
The authors would like to thank Luis Altamirano, for the technical assistance and equipment. Gonzalo Avaria acknowledges the financial support from Fondecyt Iniciación 11121587, Conicyt PAI-Inserción 791100020, Jorge Ardila-Rey acknowledges the financial support from Fondecyt Iniciación 11160115, Marcos Diaz acknowledges the support of Fondecyt 1151476. The authors also acknowledge the financial support from Conicyt PIA-Anillo ACT1115.
Author Contributions
Ismael Escalona and Gonzalo Avaria conceived and designed the experiments, performed measurements and data analyses; Marcos Díaz participated in the design, construction and characterization of the antenna, as well as data analysis; Jorge Ardila-Rey proof-read and proposed major changes to the paper; José Moreno and Cristian Pavez participated in the measurements and operation of the PF-400J; Leopoldo Soto designed and constructed the PF-400J device; Ismael Escalona, Gonzalo Avaria, Marcos Díaz, Jorge Ardila-Rey, Cristian Pavez and Leopoldo Soto wrote the paper.
Conflicts of Interest
The authors declare no conflict of interest.
References
- Soto, L. New trends and future perspectives on plasma focus research. Plasma Phys. Control. Fusion 2005, 47, A361. [Google Scholar] [CrossRef]
- Silva, P.; Moreno, J.; Soto, L.; Birstein, L.; Mayer, R.E.; Kies, W. Neutron emission from a fast plasma focus of 400 joules. Appl. Phys. Lett. 2003, 83, 3269–3271. [Google Scholar] [CrossRef]
- Soto, L.; Silva, P.; Moreno, J.; Zambra, M.; Kies, W.; Mayer, R.E.; Clausse, A.; Altamirano, L.; Pavez, C.; Huerta, L. Demonstration of neutron production in a table-top pinch plasma focus device operating at only tens of joules. J. Phys. D 2008, 41, 205215. [Google Scholar] [CrossRef]
- Soto, L.; Pavéz, C.; Moreno, J.; Altamirano, L.; Huerta, L.; Barbaglia, M.; Clausse, A.; Mayer, R.E. Evidence of nuclear fusion neutrons in an extremely small plasma focus device operating at 0.1 Joules. Phys. Plasmas 2017, 24, 082703. [Google Scholar] [CrossRef]
- Pavez, C.; Pedreros, J.; Zambra, M.; Veloso, F.; Moreno, J.; Tarifeño-Saldivia, A.; Soto, L. Potentiality of a small and fast dense plasma focus as hard x-ray source for radiographic applications. Plasma Phys. Control. Fusion 2012, 54, 105018. [Google Scholar] [CrossRef]
- Soto, L.; Pavez, C.; Moreno, J.; Inestrosa-Izurieta, M.J.; Veloso, F.; Gutiérrez, G.; Vergara, J.; Clausse, A.; Bruzzone, H.; Castillo, F. Characterization of the axial plasma shock in a table top plasma focus after the pinch and its possible application to testing materials for fusion reactors. Phys. Plasmas 2014, 21, 122703. [Google Scholar] [CrossRef]
- Pavez, C.; Pedreros, J.; Tarifeño-Saldivia, A.; Soto, L. Observation of plasma jets in a table top plasma focus discharge. Phys. Plasmas 2015, 22, 040705. [Google Scholar] [CrossRef]
- Soto, L.; Pavez, C.; Castillo, F.; Veloso, F.; Moreno, J.; Auluck, S. Filamentary structures in dense plasma focus: Current filaments or vortex filaments? Phys. Plasmas 2014, 21, 072702. [Google Scholar] [CrossRef]
- Inestrosa-Izurieta, M.; Ramos-Moore, E.; Soto, L. Morphological and structural effects on tungsten targets produced by fusion plasma pulses from a table top plasma focus. Nucl. Fusion 2015, 55, 093011. [Google Scholar] [CrossRef]
- Soto, L.; Pavez, C.; Tarifeno, A.; Moreno, J.; Veloso, F. Studies on scalability and scaling laws for the plasma focus: Similarities and differences in devices from 1 MJ to 0.1 J. Plasma Sources Sci. Technol. 2010, 19, 055017. [Google Scholar] [CrossRef]
- Pavéz, C.; Soto, L.; Sylvester, G. Progress in z-pinch research driven by the mega-ampere device SPEED2. J. Phys. Conf. Ser. 2008, 134, 012050. [Google Scholar] [CrossRef]
- Haines, M. A review of the dense Z-pinch. Plasma Phys. Control. Fusion 2011, 53, 093001. [Google Scholar] [CrossRef]
- Cabrini, N.; Pavez, C.; Avaria, G.; San Martin, P.; Veloso, F.; Zúñiga, B.; Sepúlveda, A.; Soto, L. Wire array experiments in a low impedance and low current generator. J. Phys. Conf. Ser. 2015, 591, 012026. [Google Scholar] [CrossRef]
- Favre, M.; Wyndham, E.; Suzuki, F.; Valenzuela, J.; Avaria, G.; Ruiz, M.; Bhuyan, H.; Chuaqui, H.; Choi, P. Experimental observations in compact capillary discharges. Plasma Sources Sci. Technol. 2008, 17, 024011. [Google Scholar] [CrossRef]
- Albarracín, R.; Ardila-Rey, J.; Mas’ud, A. On the Use of Monopole Antennas for Determining the Effect of the Enclosure of a Power Transformer Tank in Partial Discharges Electromagnetic Propagation. Sensors 2016, 16, 148. [Google Scholar] [CrossRef] [PubMed]
- Standler, R.B. Transients on the Mains in a Residential Environment. IEEE Trans. Electromagn. Compat. 1989, 31, 170–176. [Google Scholar] [CrossRef]
- Klapas, D.; Apperley, R.H.; Hackam, R.; Benson, F.A. Electromagnetic interference from electric arcs in the frequency range 0.1–1000 MHz. IEEE Trans. Electromagn. Compat. 1978, EMC-20, 198–202. [Google Scholar] [CrossRef]
- Leach, R.; Alexander, M.B. Electronic Systems Failures and Anomalies Attributed to Electromagnetic Interference. Available online: https://ntrs.nasa.gov/archive/nasa/casi.ntrs.nasa.gov/19960009442.pdf (accessed on 16 August 2017).
- Xiao, J.S.; Liu, W.H.; Zhang, S.Y.; Zhang, J.H.; Xing, X.F. Study of Damage Mechanism of High power Microwave on Electronic Equipments. In Proceedings of the 2008 China-Japan Joint Microwave Conference, Shanghai, China, 10–12 September 2008; pp. 454–457. [Google Scholar]
- Gayen, A.; Das, B.; Poddar, D. Study of electromagnetic interference from a high power copper vapor laser. In Proceedings of the 2005 International Symposium on Electromagnetic Compatibility, Chicago, IL, USA, 8–12 August 2005; pp. 847–850. [Google Scholar]
- Naff, J.T. Spark gaps for EMP and SREMP pulsers. In Proceedings of the 2009 IEEE Pulsed Power Conference, Washington, DC, USA, 28 June–2 July 2009. [Google Scholar]
- Siew, W.; Chalmers, I. Radiated interference from a high voltage impulse generator. IEEE Trans. Electromagn. Compat. 1994, 38, 600–604. [Google Scholar] [CrossRef]
- Hoad, R.; Leaver, A. EMC for installations-practical design and assessment methods. In Proceedings of the 2007 IET Seminar on New Regulatory Requirements and Techniques for Achieving Electromagnetic Compatibility in Commercial Buildings, London, UK, 13 April 2007. [Google Scholar]
- Ardila-Rey, J.A.; Rojas-Moreno, M.V.; Martínez-Tarifa, J.M.; Robles, G. Inductive sensor performance in partial discharges and noise separation by means of spectral power ratios. Sensors 2014, 14, 3408–3427. [Google Scholar] [CrossRef] [PubMed]
- Albarracín, R.; Robles, G.; Martínez-Tarifa, J.M.; Ardila-Rey, J. Separation of sources in radiofrequency measurements of partial discharges using time–power ratio maps. ISA Trans. 2015, 58, 389–397. [Google Scholar] [CrossRef] [PubMed]
- Tenbohlen, S.; Denissov, D.; Hoek, S.M.; Markalous, S. Partial discharge measurement in the ultra high frequency (UHF) range. IEEE Trans. Dielectr. Electr. Insul. 2008, 15. [Google Scholar] [CrossRef]
- Smith, A.A. Standard-site method for determining antenna factors. IEEE Trans. Electr. Compat. 1982, EMC-24, 316–322. [Google Scholar] [CrossRef]
- American National Standard for Electromagnetic Compatibility. Radiated Emission Measurements in Electromagnetic Interference (EMI) Control-Calibration of Antennas (9 kHz to 40 GHz); IEEE Std.: Piscataway, NJ, USA, 2006. [Google Scholar]
- Ghassempouri, M. Measurements of coupling through braided shield via new conducted immunity technique. Prog. Electromagn. Res. C 2009, 11, 61–68. [Google Scholar] [CrossRef]
- Morey, A.M.; Bhujade, S.; Bhuiya, T.; Thakur, S.; Pandey, T. Design and development of phased-array coils for 1.5 T MRI scanner. In Proceedings of the 2015 International Conference on Advancements in Power and Energy (TAP Energy), Kollam, India, 24–26 June 2015; pp. 165–169. [Google Scholar]
- Ansoft Corp. High Frequency Structure Simmulator; Ansoft Corporation: Pittsburgh, PA, USA, 2005. [Google Scholar]
- Electromagnetic Compatibility (EMC)-Part 4-3: Testing and Measurement Techniques-Radiated, Radio-Frequency, Electromagnetic Field Immunity Test. Available online: https://webstore.iec.ch/publication4209 (accessed on 11 September 2017).
- Failure Mechanisms of Semiconductor Devices. Available online: https://industrial.panasonic.com/content/data/SC/PDF/ww_aboutus_reliability_t04007be-3.pdf (accessed on 11 September 2017).
- Enlow, E.; Wunsch, D. Semiconductor failure threshold estimation problem in electromagnetic assessment. IEEE Trans. Nuclear Sci. 1984, 31, 1316–1321. [Google Scholar] [CrossRef]
- Cain, J.; Makl, S. Capacitor Selection and EMI Filtering. Available online: https://www.avx.com/docs/techinfo/CircuitProtection_EMIFiltering/cap_sel.pdf (accessed on 11 September 2017).
- Vance, E.F. Electromagnetic-interference control. IEEE Trans. Electromagn. Compat. 1980, 22, 319–328. [Google Scholar]
- Ott, H.W. Electromagnetic Compatibility Engineering; John Wiley & Sons: Hoboken, NJ, USA, 2011. [Google Scholar]
- Booker, H.G. Slot aerials and their relation to complementary wire aerials (Babinet’s principle). J. Inst. Electr. Eng. Part IIIA 1946, 93, 620–626. [Google Scholar] [CrossRef]
- Quine, J.P. Theoretical formulas for calculating the shielding effectiveness of perforated sheets and wire mesh screens. In Proceedings of the Third Conference on Radio Interference Reduction, Chicago, IL, USA, 26–27 February 1957. [Google Scholar]
© 2017 by the authors. Licensee MDPI, Basel, Switzerland. This article is an open access article distributed under the terms and conditions of the Creative Commons Attribution (CC BY) license (http://creativecommons.org/licenses/by/4.0/).