1. Introduction
The rising demand for sustainable and renewable energy in the world has led to increasing research into and development of alternative energy resources. By now, energy from, e.g., wind and solar is well developed and an active part of the energy mix in industrialised countries worldwide. Despite a comparatively large energy potential, one resource that still is not a part of the energy mix is wave energy. During the last few decades, the amount of research in wave energy absorption has been significant, resulting in a considerable amount of concepts for new wave energy converter (WECs), with varying levels of development. Despite the effort, the wave energy sector is not yet at a commercial stage, and further improvement must take place before wave energy can contribute to the energy mix.
The work in [
1,
2,
3] list the levelized cost of energy (LCOE) for a range of energy resources, indicating the high price of wave energy compared to oil and gas (O&G) and even other renewable resources. As a result, there is an urgent demand to decrease the cost in order for wave energy to evolve from the current pre-commercial stage. According to [
4,
5], several parameters can be improved and take a considerable part in the cost reduction of wave energy. Despite different evaluations of the importance, station keeping moorings are listed as a driver towards lower cost, as they are estimated by [
6,
7] to compose 20–30% of the total structural cost of a WEC. In [
8], the mooring is estimated to take up 8% of the CAPEX cost.
In addition to the cost, by now, mooring has also taken part in the failure of several WECs due to insufficient durability of the mooring system [
7,
9,
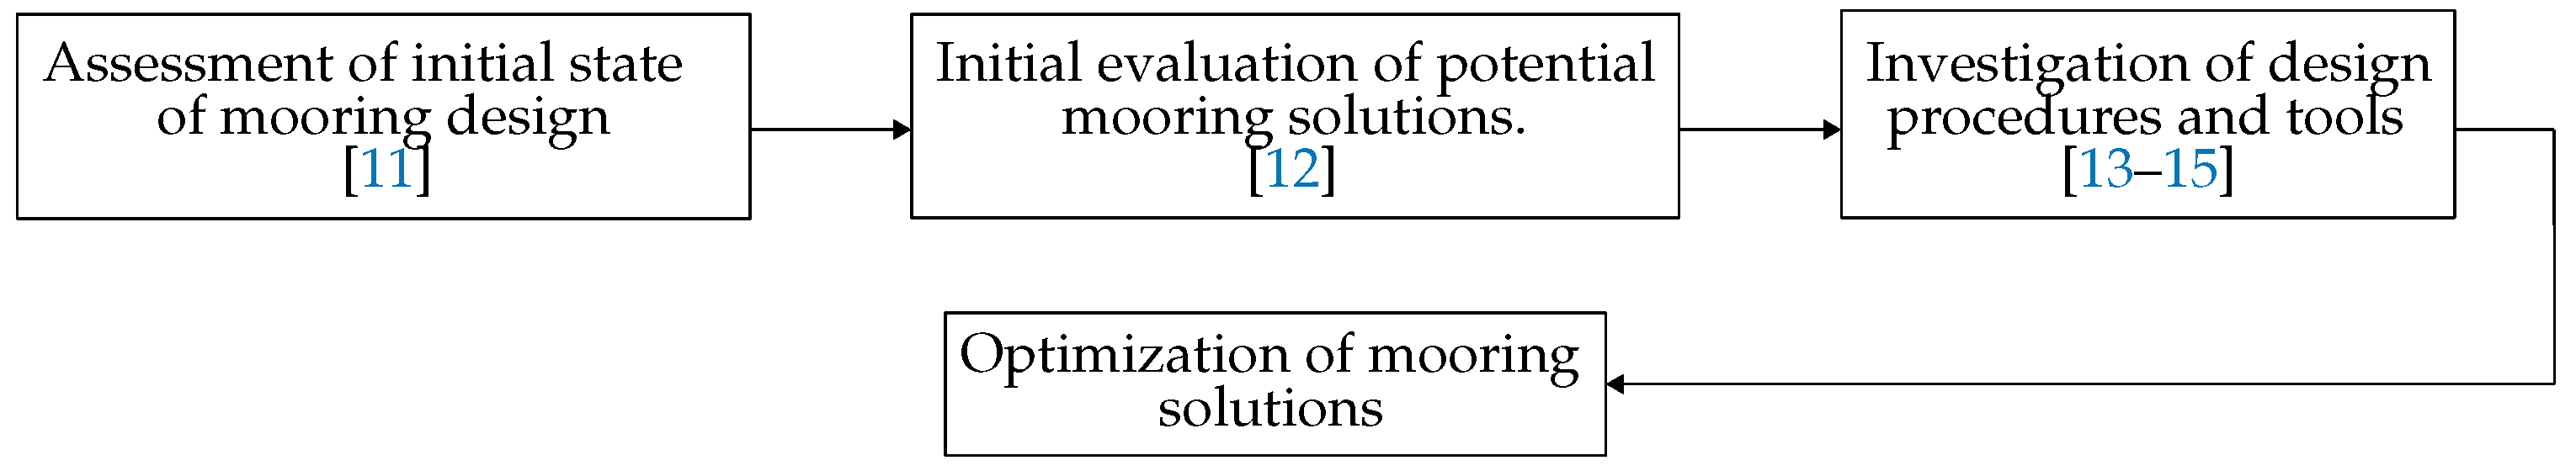
10]. Consequently, a Danish research project entitled “Mooring Solutions for Large Wave Energy Converters” (MSLWEC) was initiated in 2014, which aimed at reducing the cost of the system, improving the applied design procedure and increasing the durability of the systems.
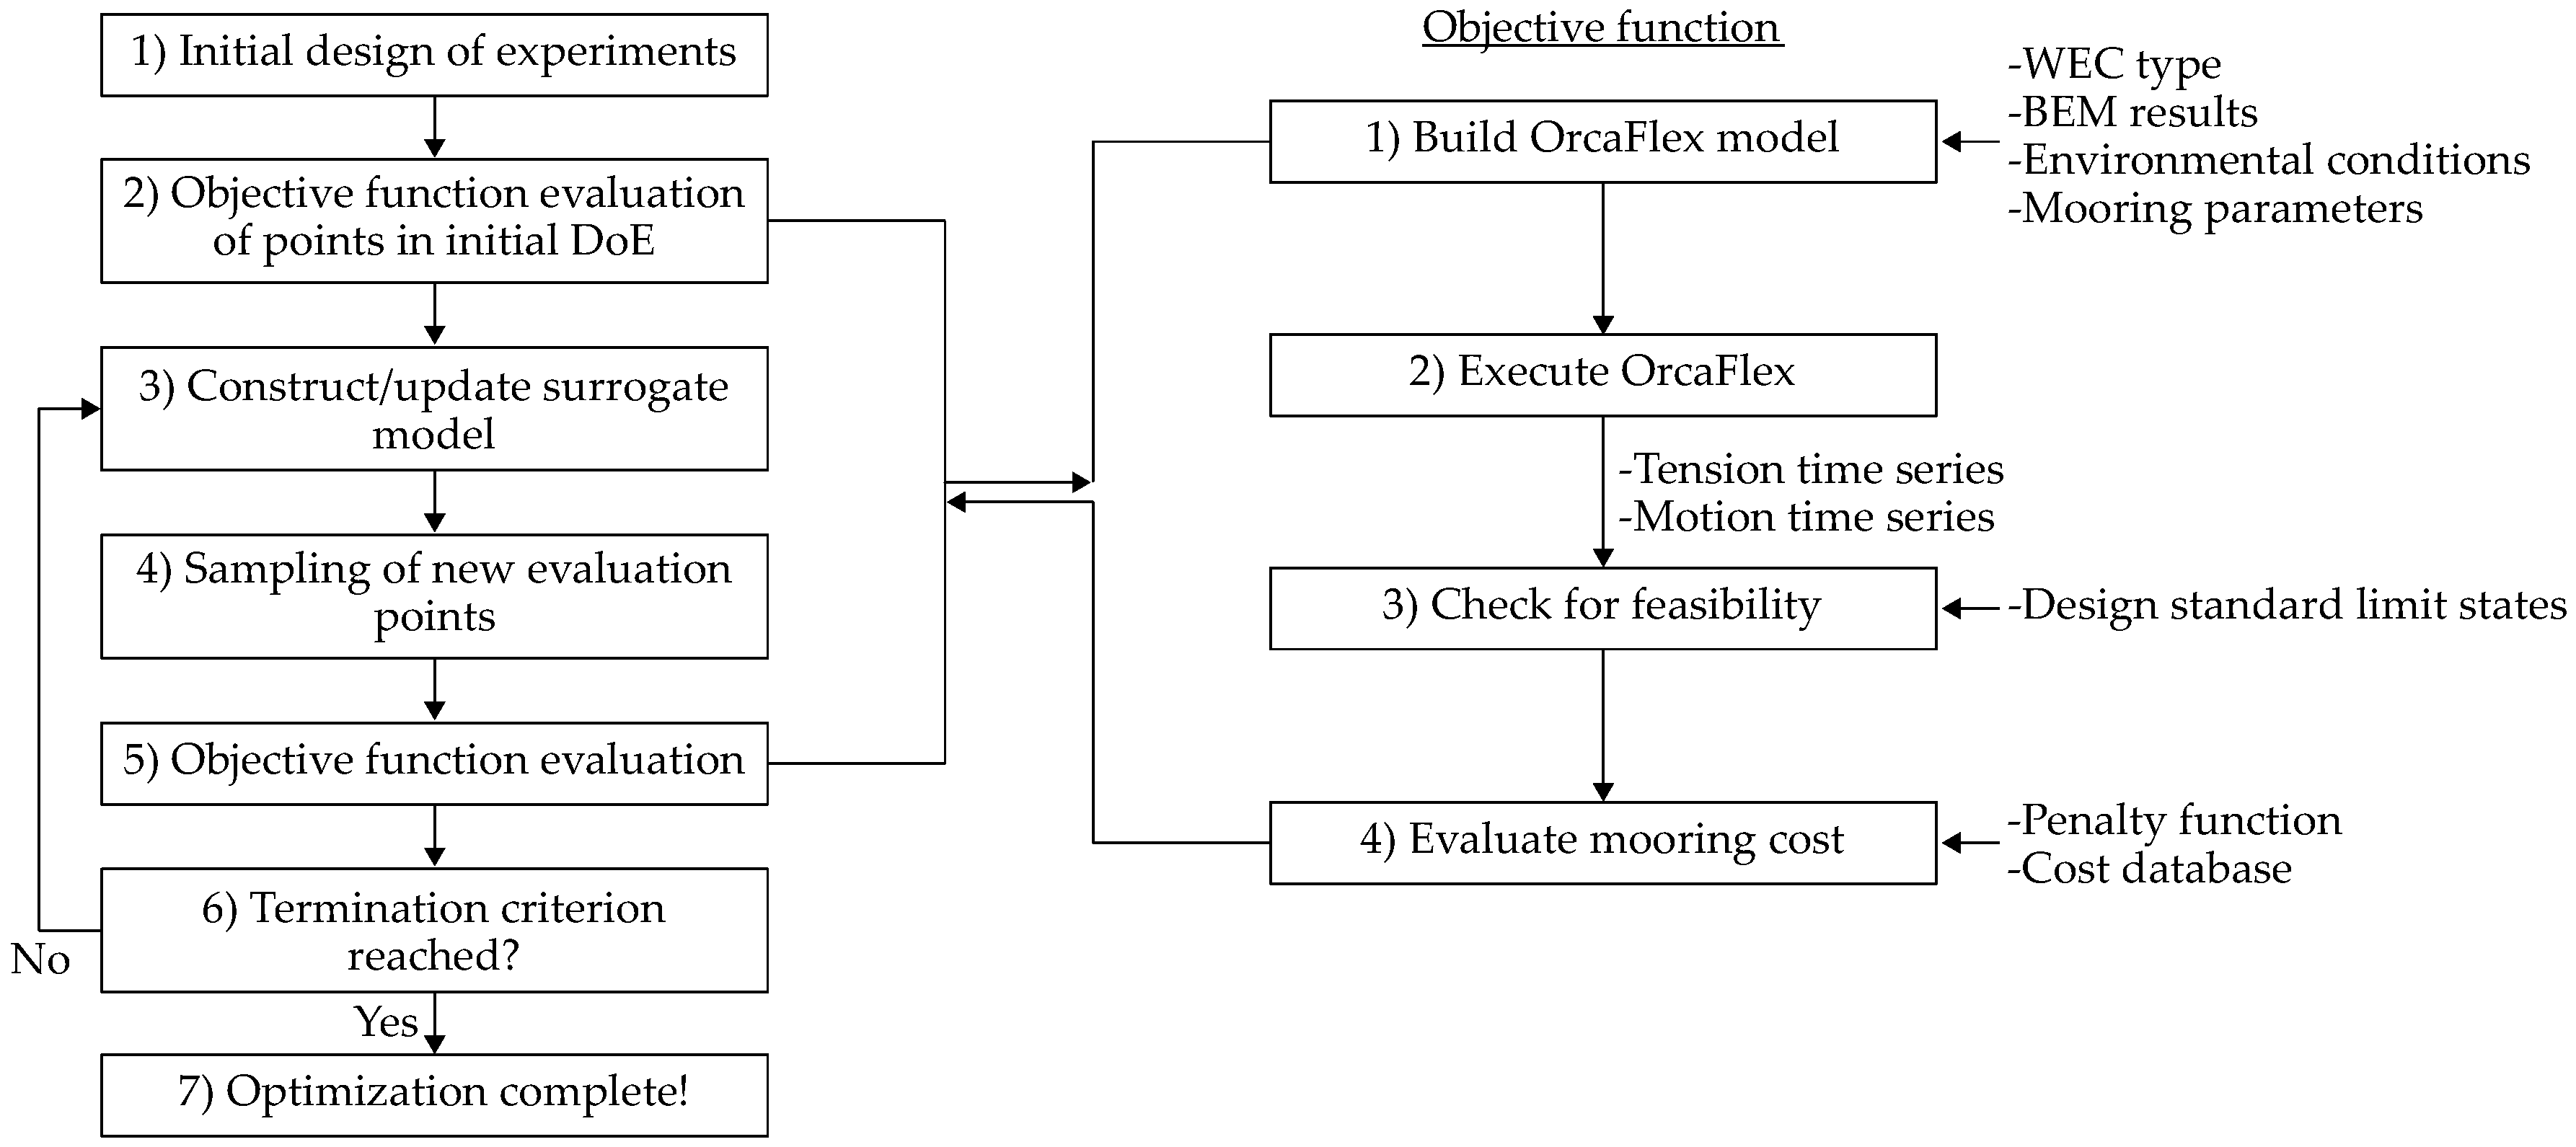
Figure 1 illustrates a diagram of the project work and presents how the previous tasks have provided the basis and experience for this paper.
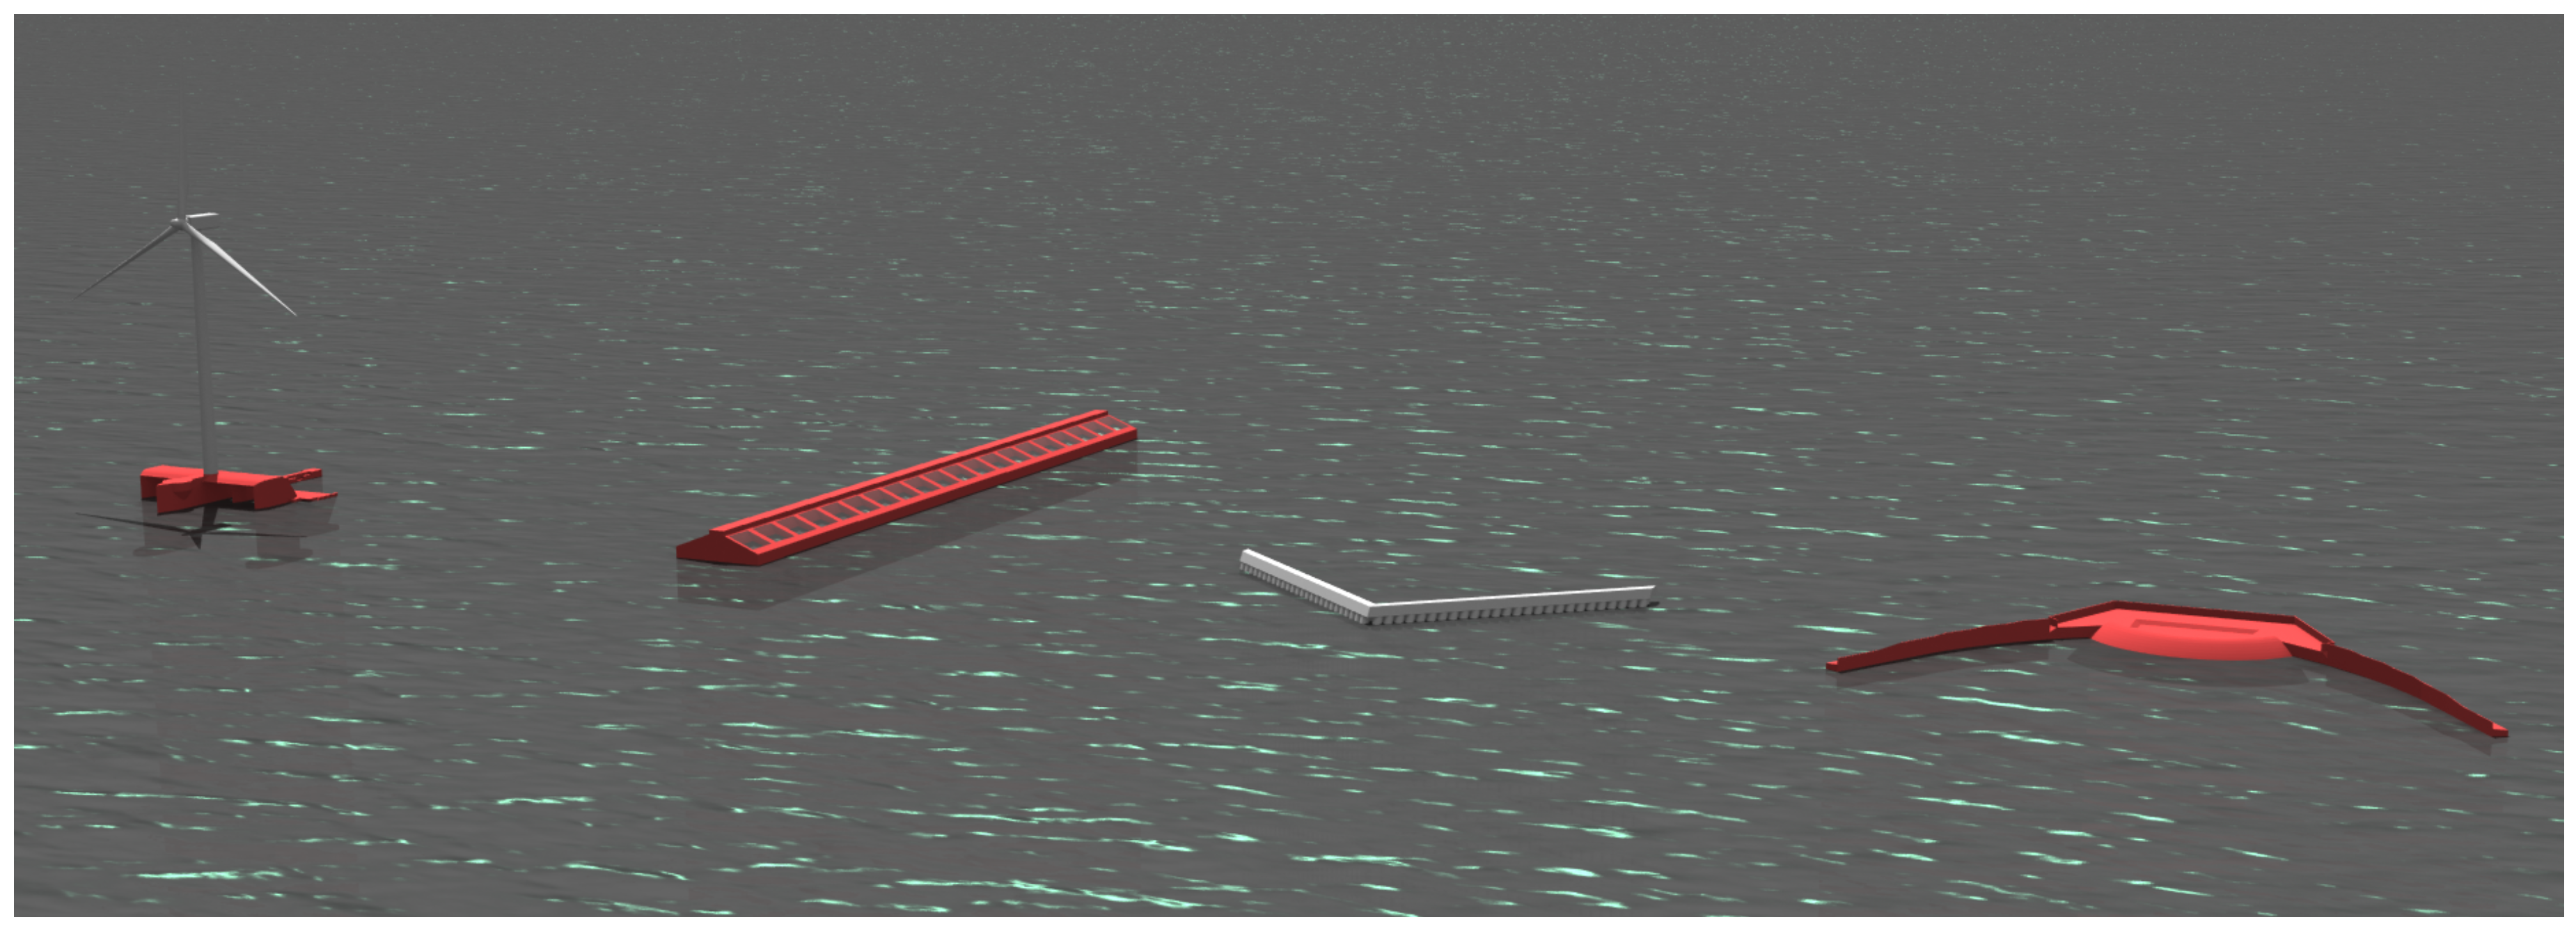
The project took its point of departure in the Danish wave energy sector and four WECs, all considered to be large floating structures with passive moorings, meaning that the mooring does not take an active part in the energy conversion. The four WECs are the Floating Power Plant [
16], KNSwing [
17,
18], LEANCON Wave Energy [
19] and Wave Dragon [
20], cf.
Figure 2. In the early research works, the initial layout and design procedures were investigated (cf. [
11]), and they highlighted a significant need for a more thorough and detailed design and investigation of the applied mooring systems. This conclusion was based on the fact that all environmental conditions were not fully included, and in most cases, a quasi-static approach was used. Finally, the project also concluded that there was a common tendency of applying traditions from the O&G sector in, e.g., using heavy mooring chains for the system. The following task [
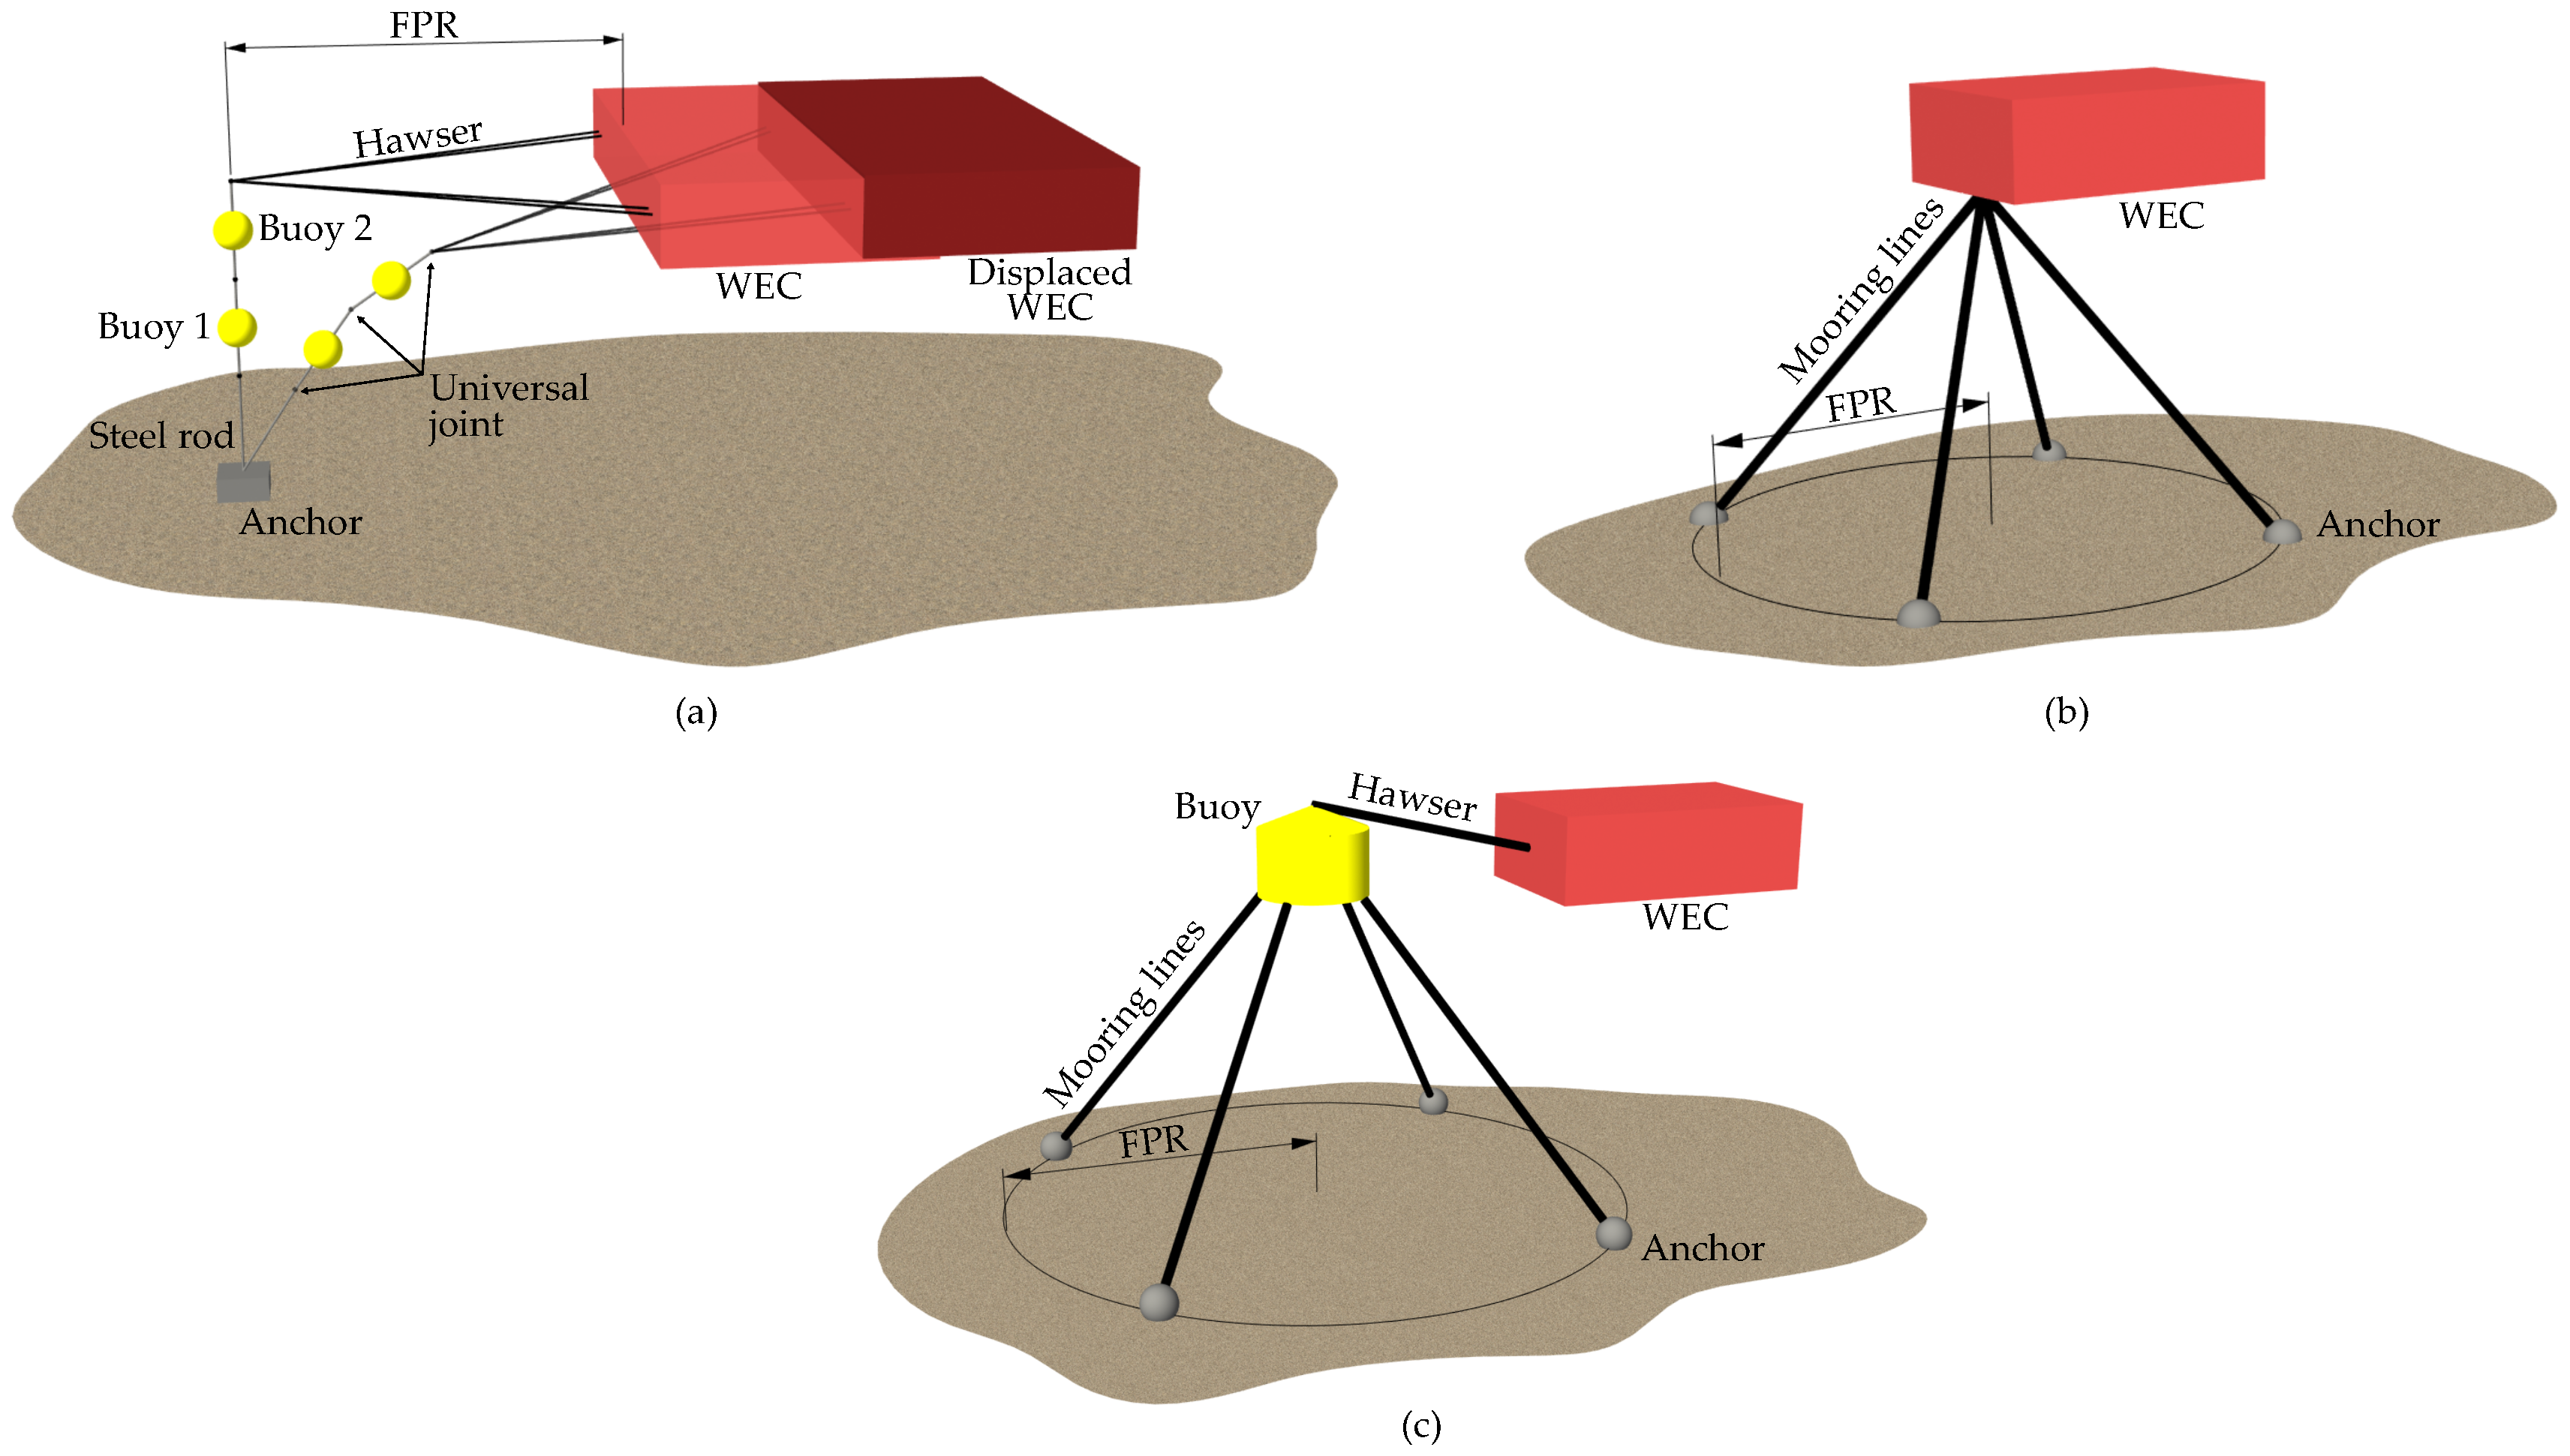
12] evaluated the initially-applied systems, identified the use of mooring chains as an inefficient solution and instead highlighted compliant, synthetic ropes as a potentially inexpensive and useful solution and, furthermore, identified a single anchor leg mooring (SALM) system as a strong potential for WEC mooring. Other studied like, e.g., Ref. [
21,
22] similarly identified synthetic ropes as an appealing solution.
The following study [
13] produced a large database of experimental data, used it to validate the initially-considered quasi-static design approach, and it identified a clear underestimation of mooring loads in extreme seas. Consequently, there was a need for a full dynamic analysis, as well as for further optimization of the initial mooring solutions since there was a clear possibility that these would not be capable of surviving in design storm conditions with extreme wind, wave and current.
Many different software packages are available for mooring analysis and have the capability to analyse the motion response and tensions under environmental load exposure according to limit states defined in design standards as in [
23,
24,
25,
26]. A number of tools was investigated in the project (cf. [
14]) and has also been listed in other publications like [
27]. A selected software package was validated against the experimental data in order to gain knowledge about the applicability of the tools on initial design, and the software proved its ability to model line tensions with acceptable overestimation of the tension without major tuning of the numerical model.
As presented in [
13,
27,
28], the mooring characteristics are highly dependent on the site specification, mooring layout, materials, etc., and the response is, therefore, highly affected by the choices. The mooring design procedure is iterative, and it can be extremely time consuming to cover the full design space in order to find a solution that fulfils all defined requirements and, at the same time, provides a low cost. Based on the gained experience from the previous work on selecting tools, building hydrodynamic models and designing mooring, an optimization procedure must be utilized in order to find a cost-optimized solution, which introduces more reliable and fully-designed solutions compared to the initial layout.
In several studies like, e.g., [
29,
30,
31], the energy absorption has been the objective of optimization with additional investigation of mooring line loads. The studies vary in the level of detail, the number of investigations of mooring configurations and the applied methodology, but they generally focus on operational conditions and the aim of improving the energy absorption as much as possible. This type of mooring is consequently reactive or active, and the actual cost of the moorings is not the objective of the studies. Naturally, optimizing mooring loads might reduce the needed strength of, e.g., lines and thereby reduce cost, but no actual cost investigation was done. Other optimization studies like, e.g., Ref. [
32] treat the WEC farm layout in order to achieve the most feasible layouts for energy harvesting.
A passive mooring does not take an active part in the power take-off (PTO), and the cost is mostly determined by the extreme sea states during which survivability must be ensured. The present study focusses on the large floating WECs with passive moorings and uses an optimization procedure to reduce the mooring cost while securing that a reliable solution is found. The study continues the already presented work in the project “Mooring Solutions for Large Wave Energy Converters” and uses the four Danish WECs in
Figure 2 as case studies.
The paper is structured with four sections including this Introduction.
Section 2 describes the applied method and the design variables for the four cases, while
Section 3 presents the results from each case. In
Section 4, the work is summarized and discussed.
3. Results
This section presents the outcome of the optimization routine when using the method as described in the previous section. Each case is presented separately and followed by a common discussion in the next section.
3.1. Case 1
The mooring solution in Case 1 consists of a synthetic turret system, and based on the optimization, the optimal layout has parameters as listed in
Table 4. The mooring cost has been normalized according to the total CAPEX and OPEX of the WEC.
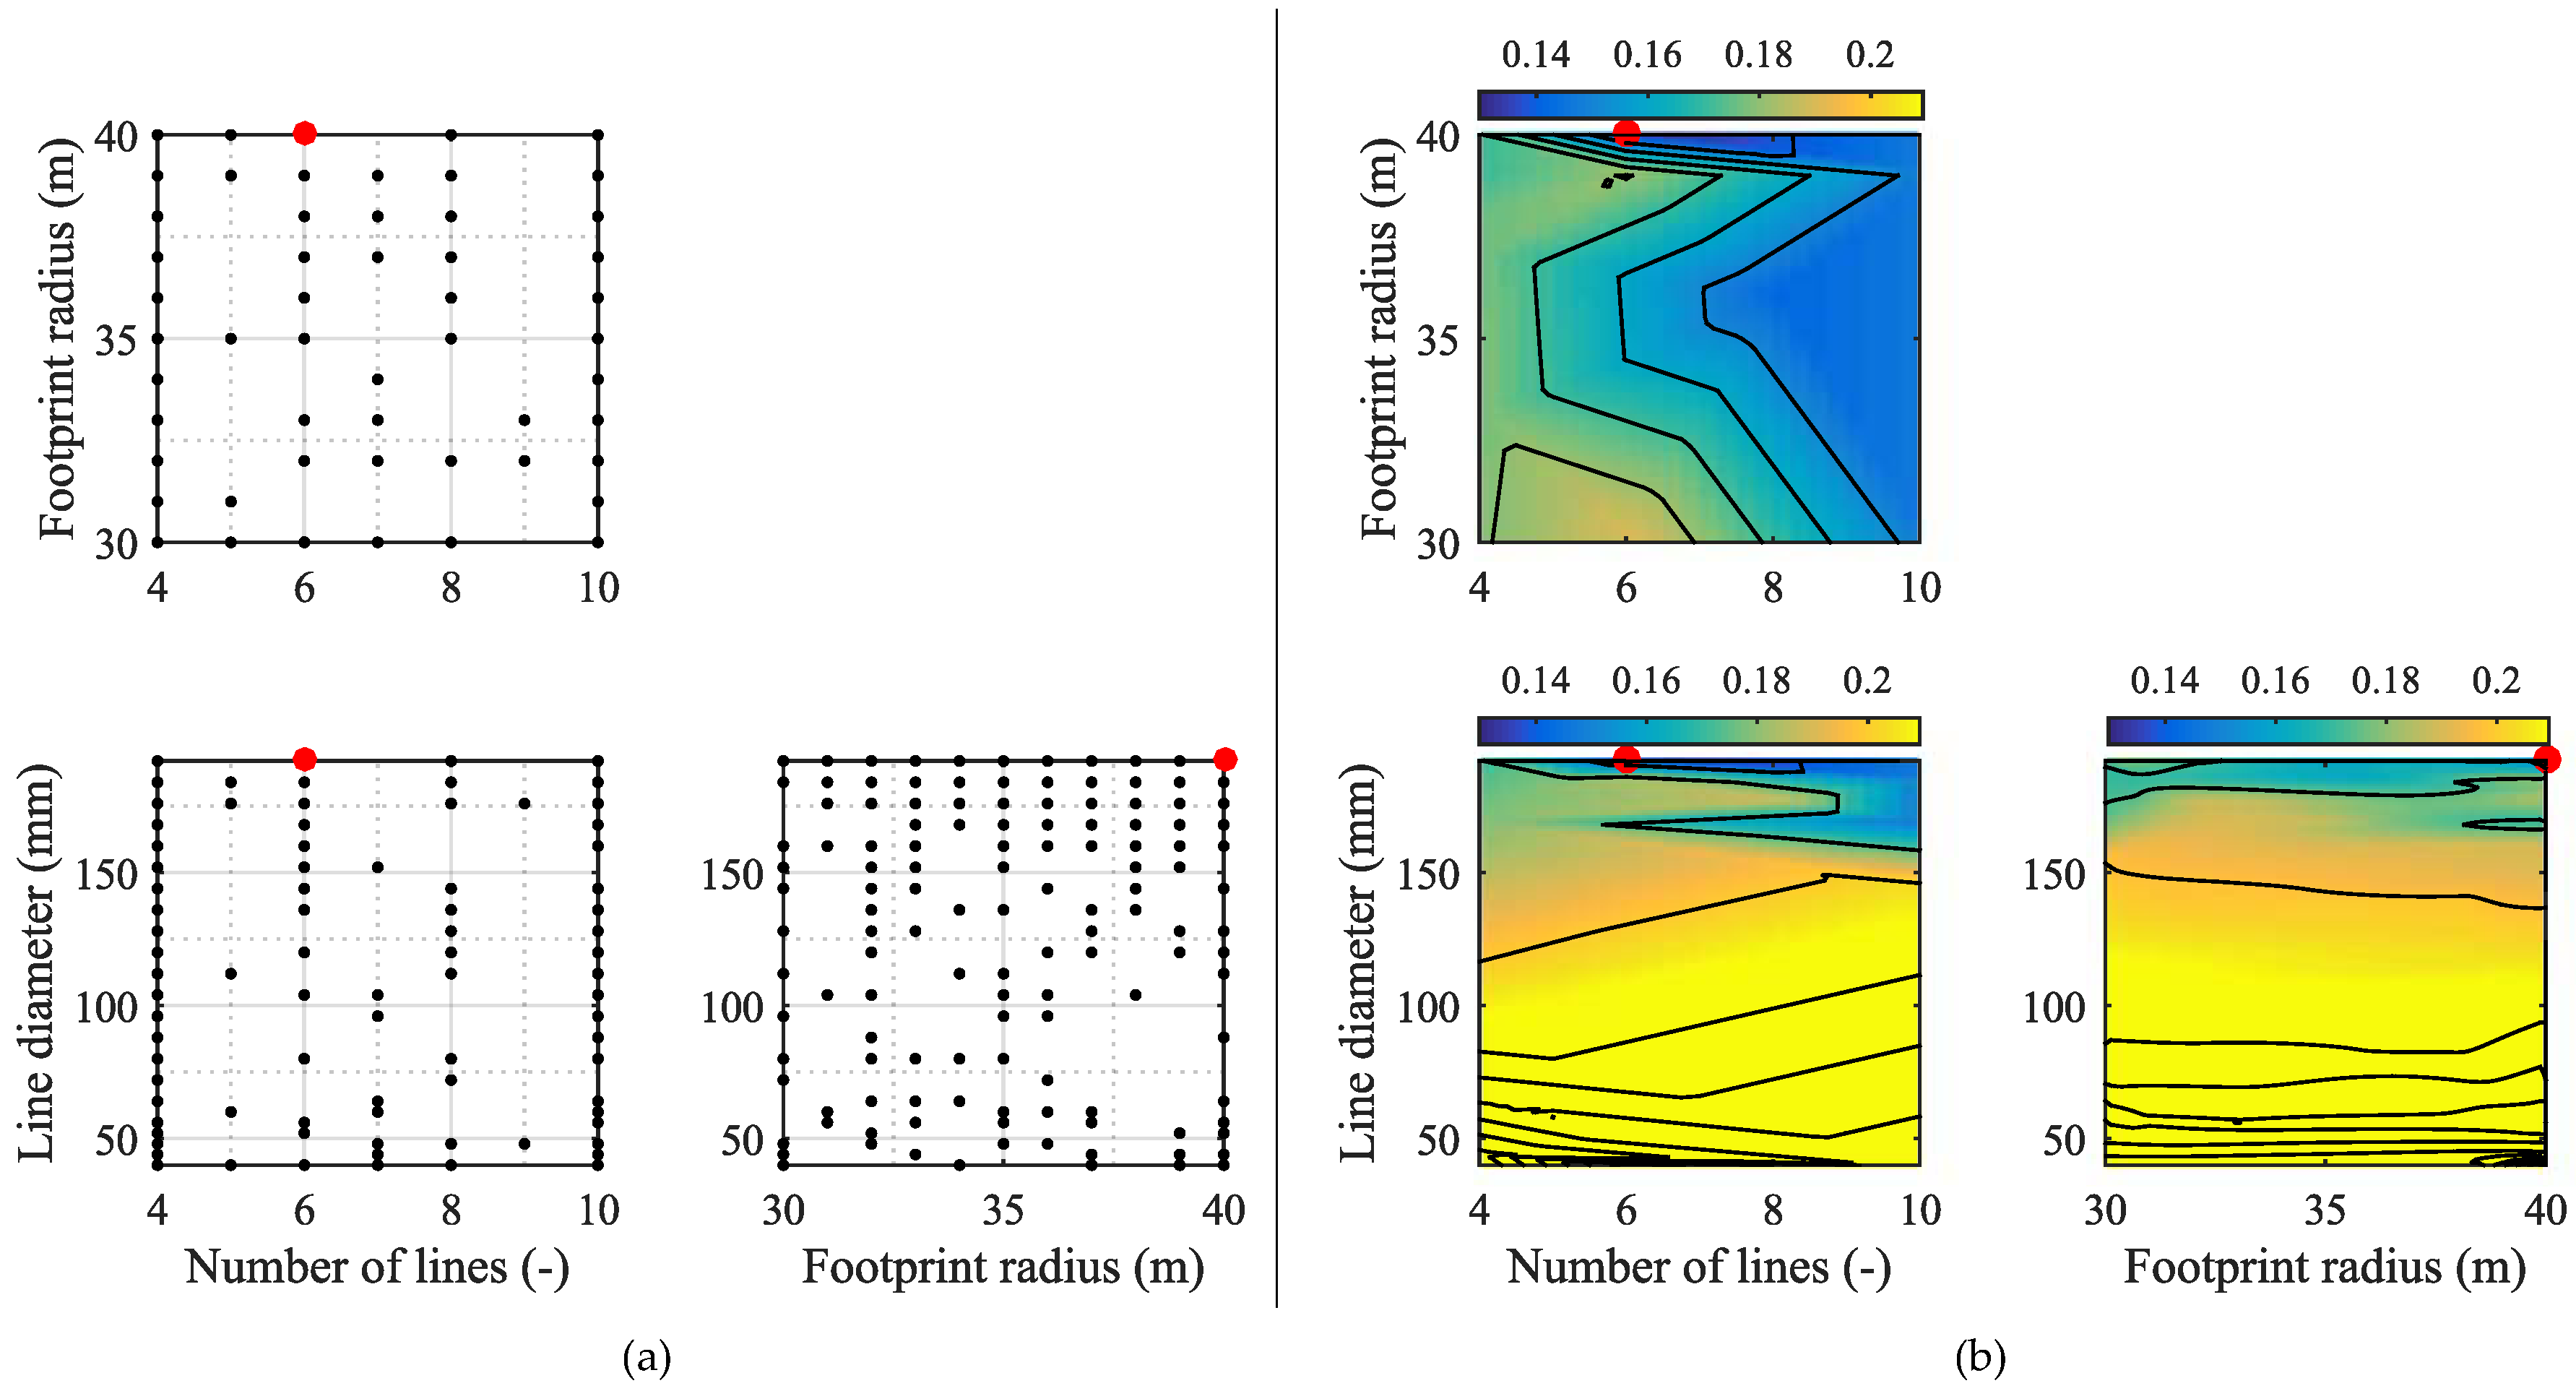
Figure 9a illustrates the evaluated points, with the optimum as a red marker.
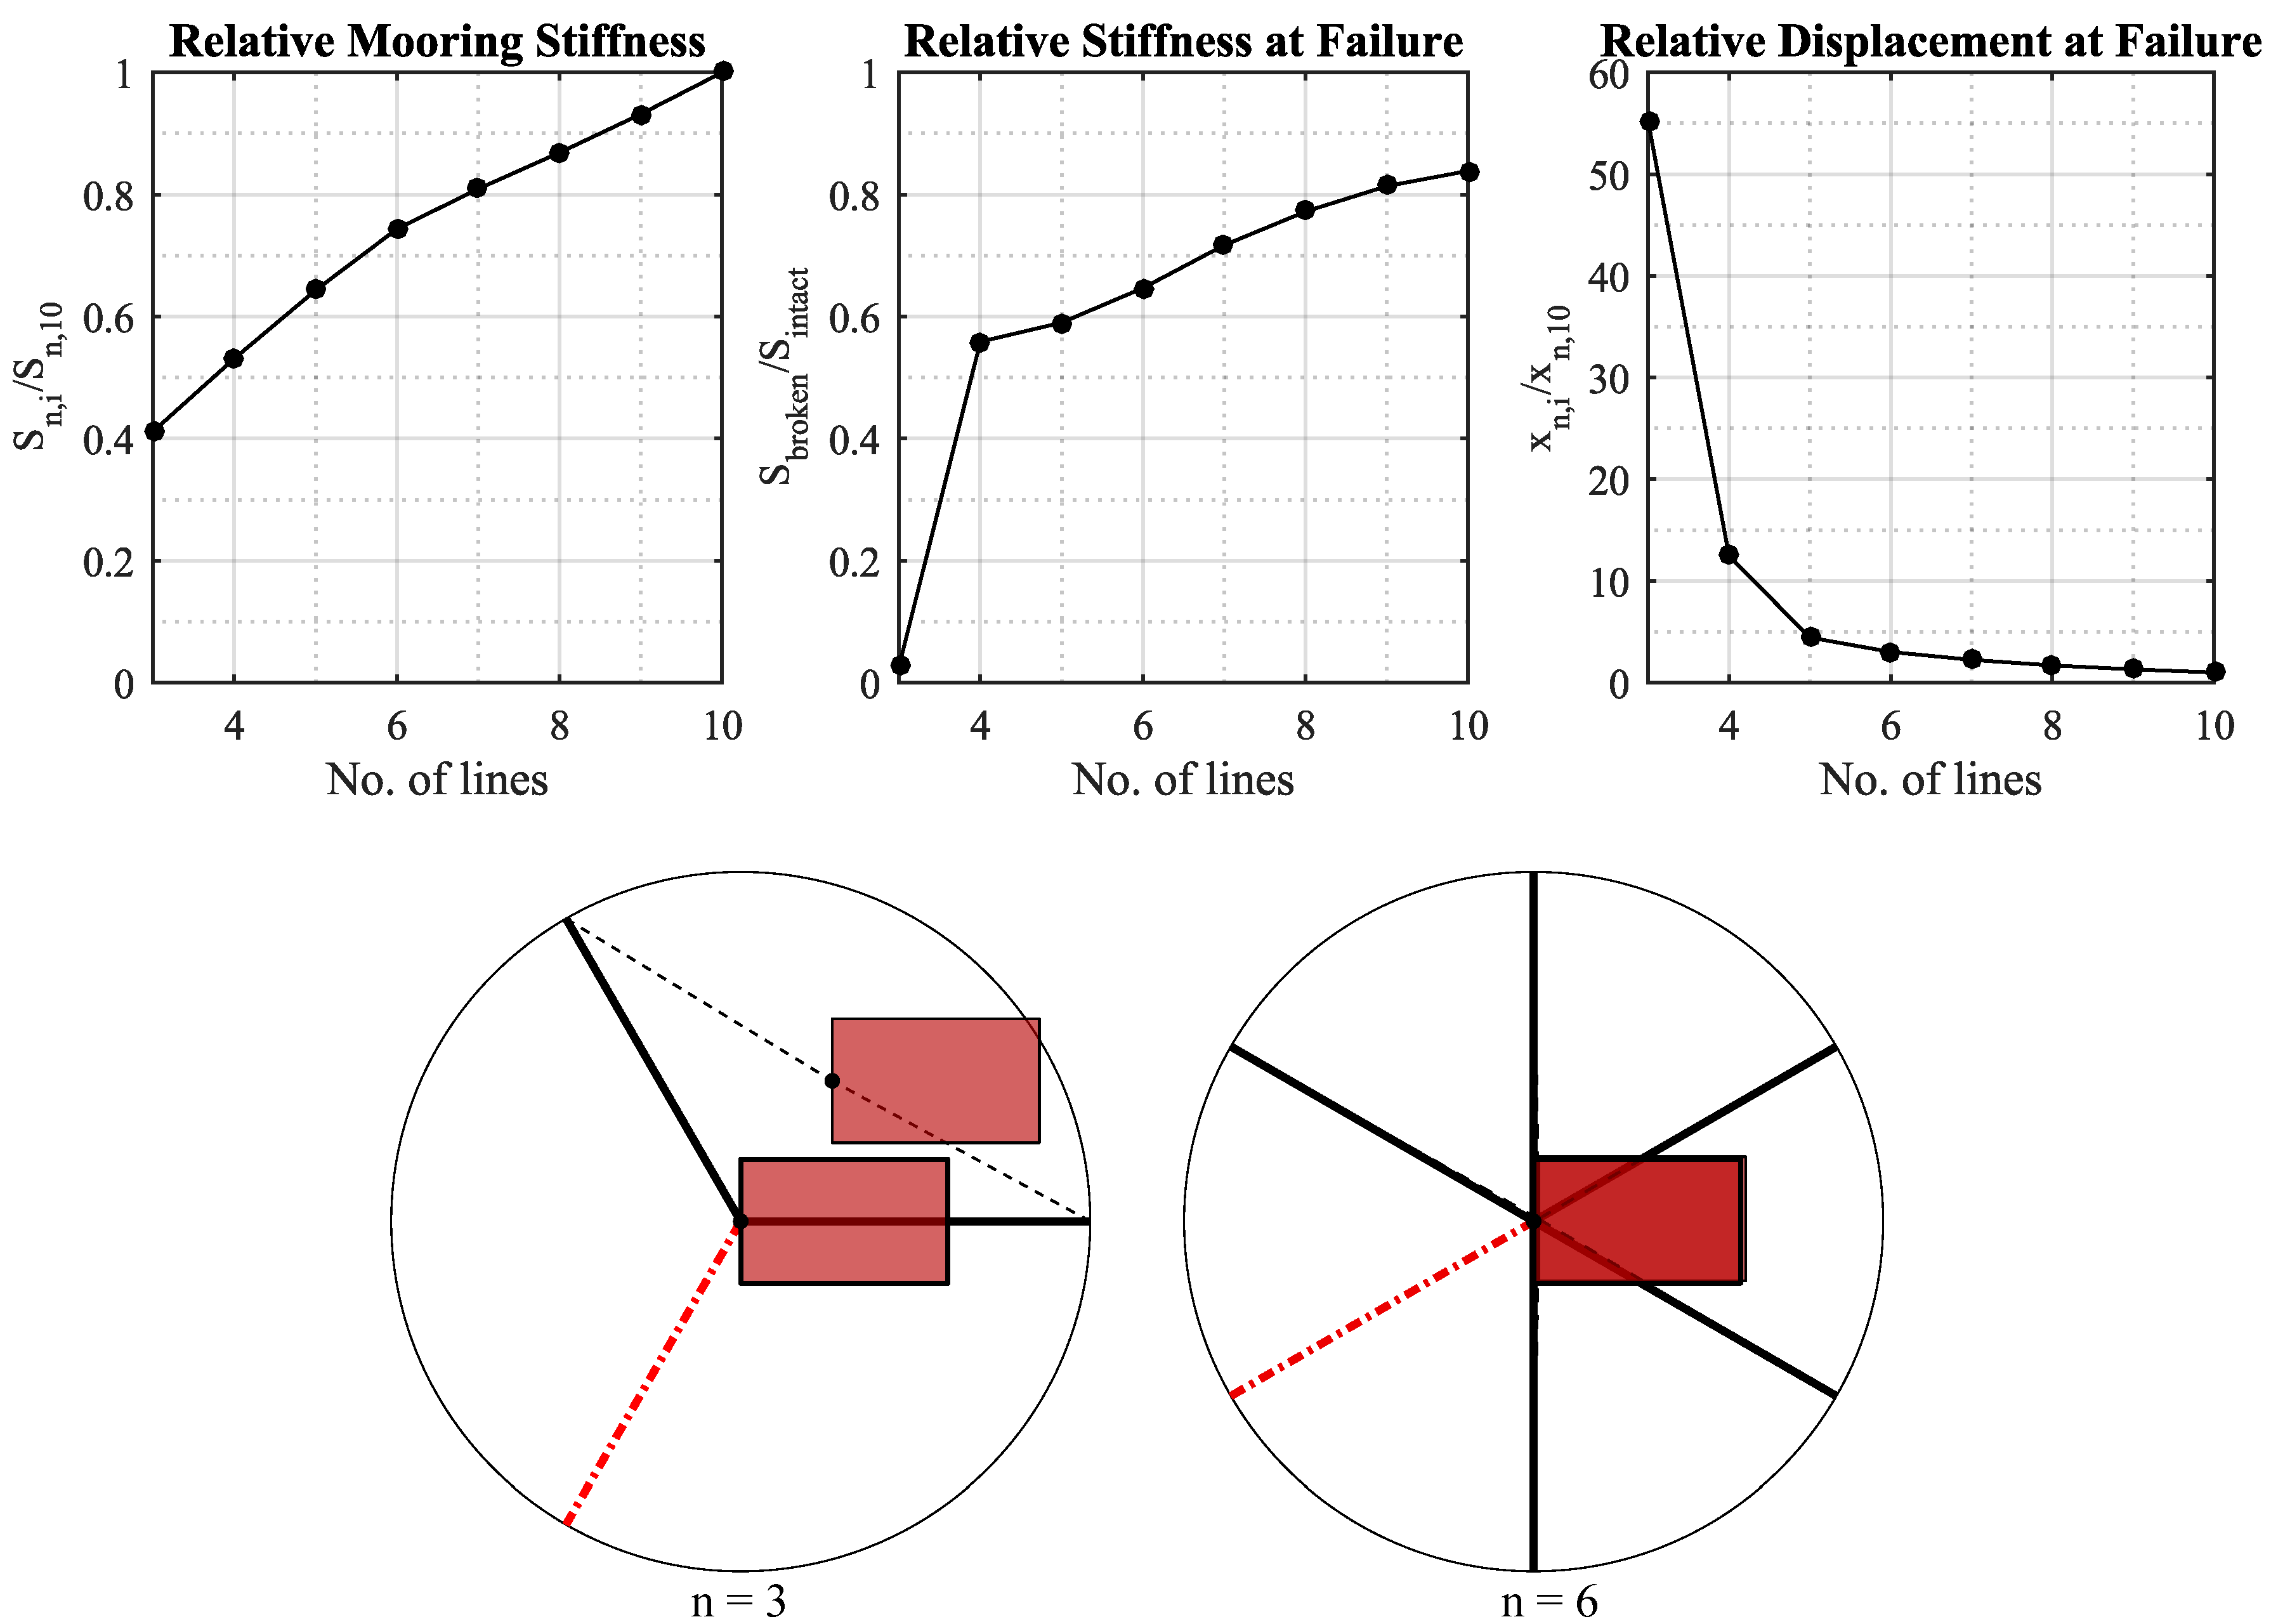
Figure 9b presents a contour plot for the cost of the mooring when normalized according to the total WEC cost. The figure presents systems with and without cost penalty, but the satisfying solutions are found in the normalized cost range 0.13–0.15. In this plot, it is possible to detect the influence of each parameter. In the top right plot, the footprint radius is plotted against the number of lines. The line diameter is kept constant in this plot and corresponds to the optimum. It is clearly seen that the footprint radius only provides a small influence on the cost, while an approximately 15% cost reduction can be achieved by varying the number of lines. Naturally, a large number of lines increases the cost due to installation, the amount of anchors and line materials, etc., but it also highly influences the mooring stiffness, corresponding motions and line tensions. Decreasing the line number from six to four decreases the mooring stiffness by 32% and results in larger excursions. Fewer lines also need to each take up a larger part of the load, and the tension with four lines is 10% larger than with six lines, resulting in insufficient strength. Increasing the line number to 10 lines increases the stiffness by 63%, but the larger number of lines means that each line only takes 75% of the tension experienced in the system with six lines. This means that the anchor size can be decreased. The installation cost is primarily dependent on the number of lines and is, therefore, largest for the system with 10 lines (80% larger than the cost for four lines); but since the motion limit is exceeded with four lines, the cost penalty has been applied to the system, and the difference appears smaller in
Figure 9. Clearly, the optimum value is found as a balance between finding the lowest number of lines, where low installation cost is present, and finding a high enough number of lines to ensure small tensions in the lines with a corresponding need for smaller anchors and certainty on the line strength.
Considering the number of lines against the line diameter, it is clear that the most dominating parameter is the diameter. Having a small line results in a very compliant system, which in many cases causes a violation of the surge limit, while the line also provides less and insufficient strength. It is necessary to use some of the largest considered diameters in order to find a suitable solution, and the least expensive is found by using the strongest lines and reducing the line number.
In the final plot, this tendency is also observed as the footprint radius only provides minor importance while the line diameter is paramount to optimize. Considering all the graphs by
Figure 9, it is noticeable that a large part of the evaluation provides insufficient solutions, and it would merely have been necessary to consider a few of the largest line diameters.
3.2. Case 2
As presented in
Table 2, Case 2 considers an overall mooring design similar to the system in Case 1. However, this structure is located at a greater water depth and has less restriction on surge and none on pitch; cf.
Table 1. By also considering
Table 2, it is observed that this case allows for a larger footprint radius, which provides a larger range to find an optimum solution.
Table 5 presents the results from the optimization.
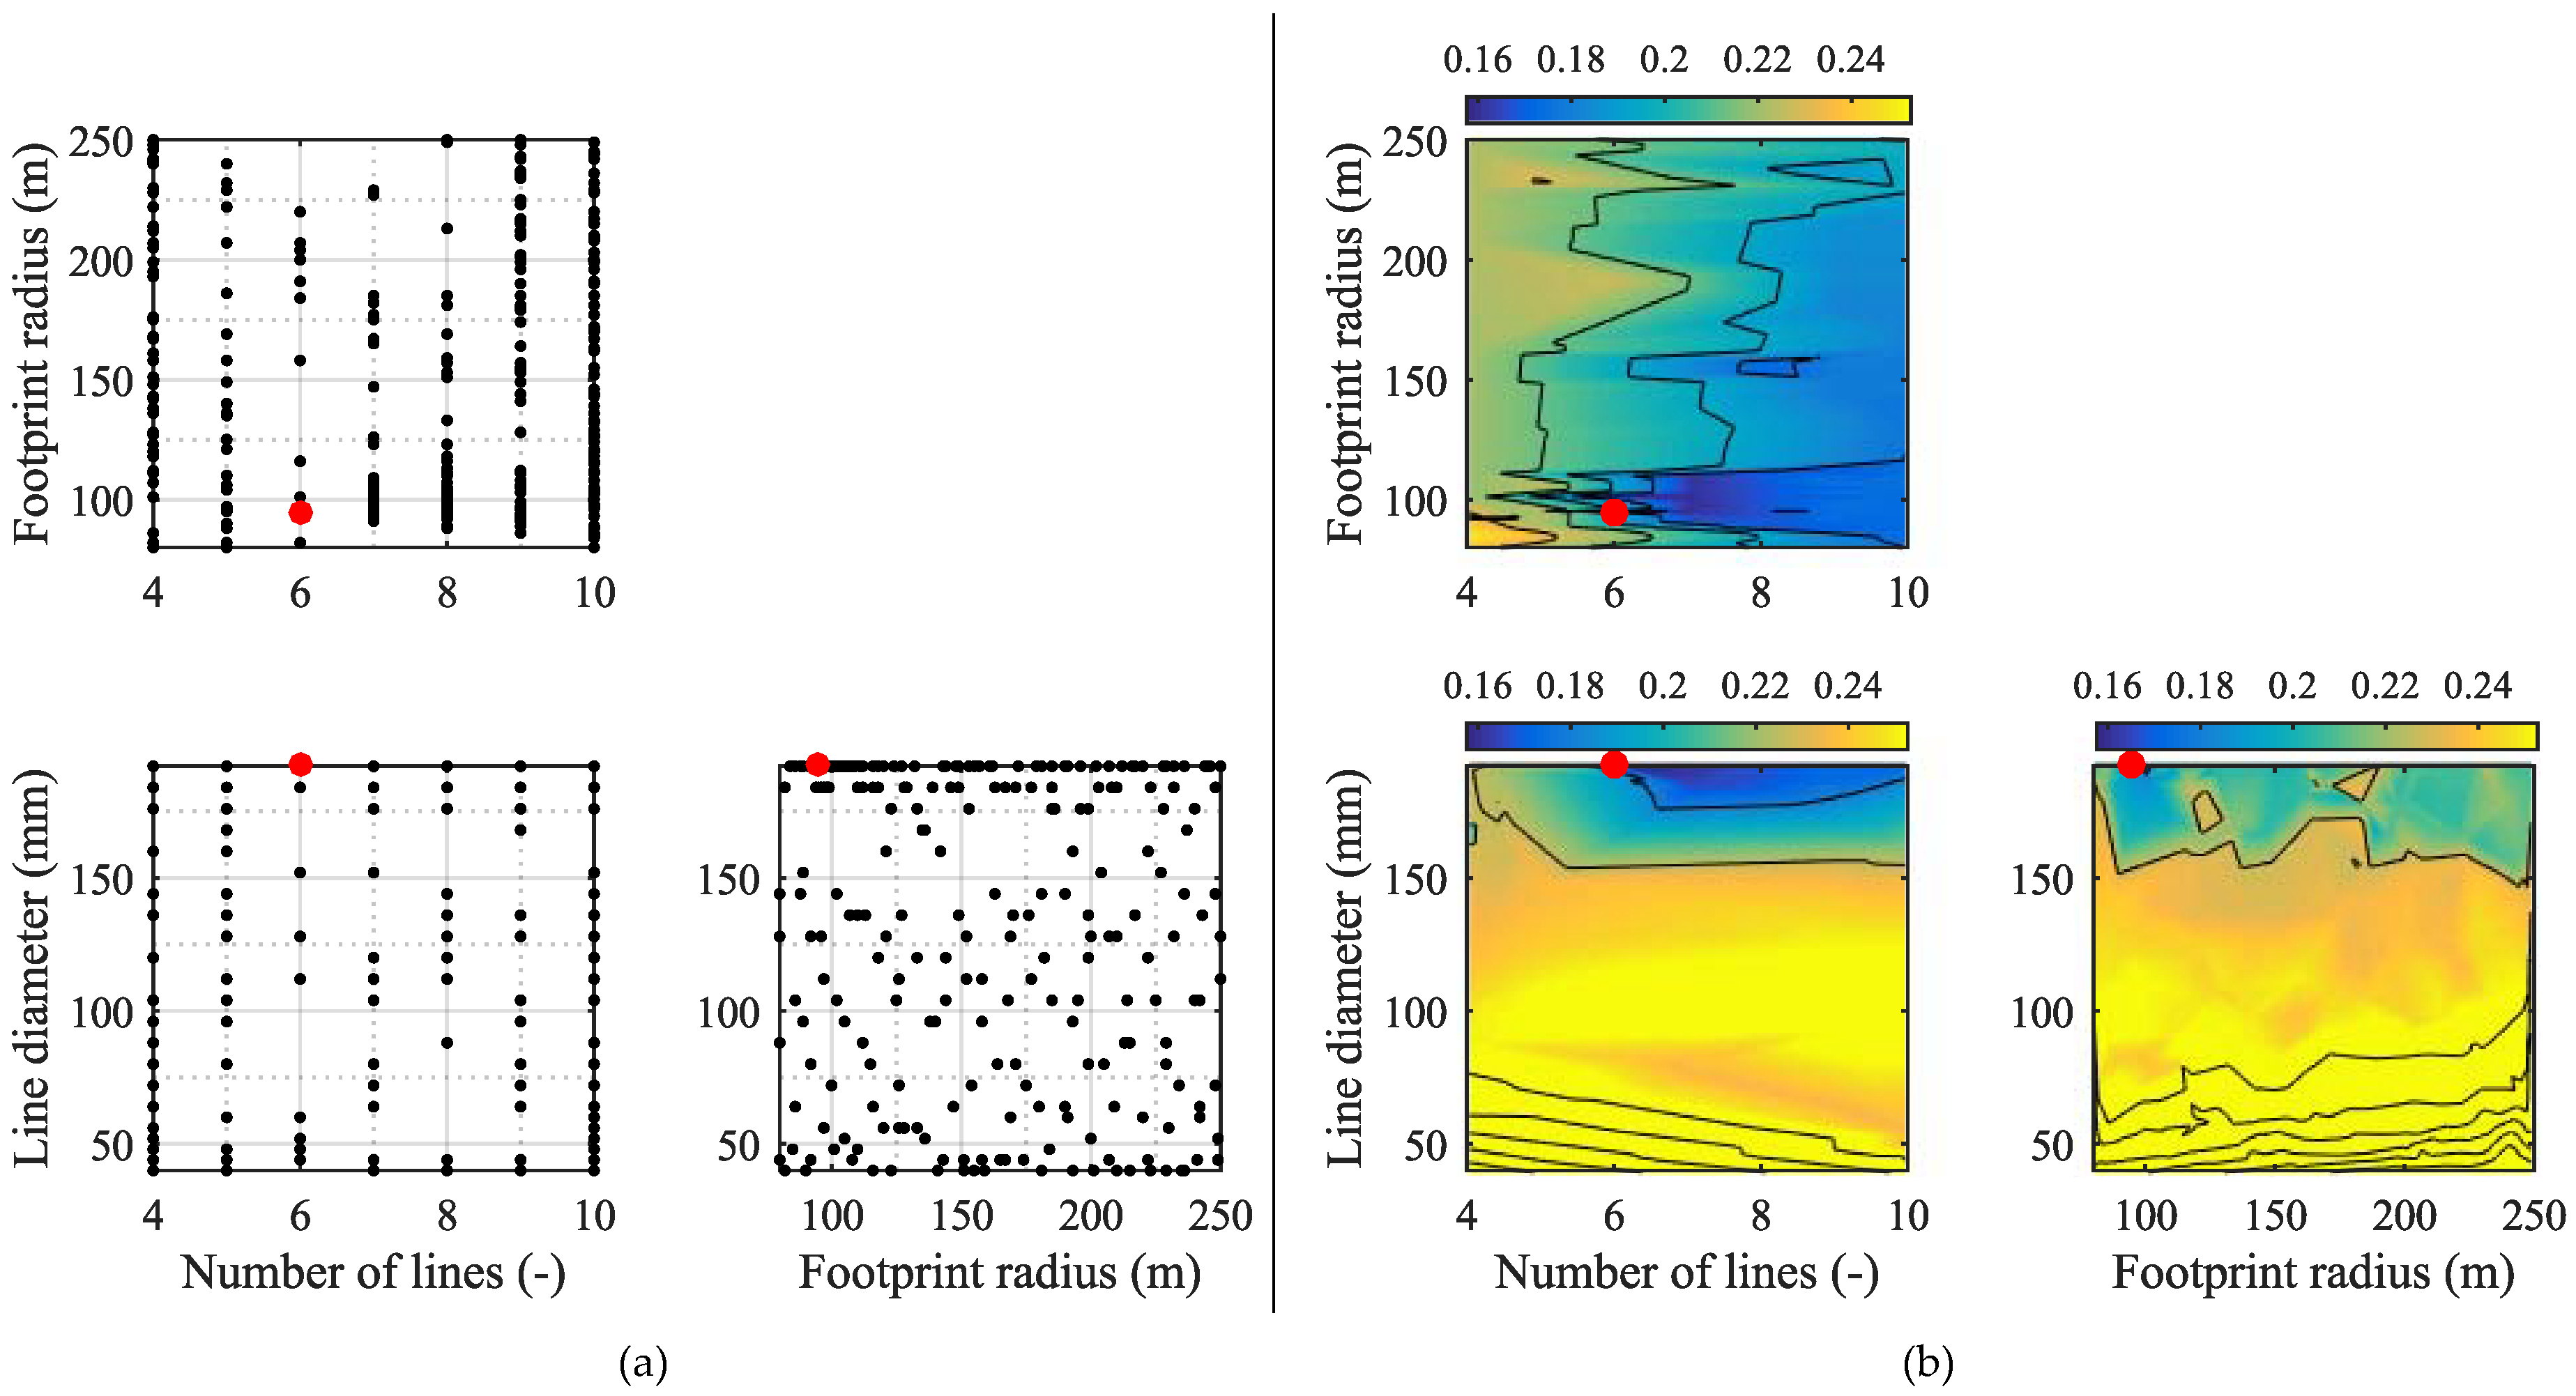
Figure 10a presents the sample points. It is clearly indicated that the solver identified the need for large line diameters and aimed the search at these diameters. Similarly, it is indicated that smaller footprint radii were sufficient.
Figure 10b presents the cost contour for the problem where the working solutions are found in the normalized cost range 0.15–0.19. Similar to the previous case, one parameter (the optimum) is kept constant in each diagram, and the influence from the remaining can be identified.
When considering the footprint radius against the number of lines, a similar tendency as in Case 1 is observed. Variation in the number of lines provides a cost difference of approximately 20%. This difference is primarily caused by the influence on anchor and line loads. A large number of anchors might cause a high cost, but having too few lines causes large loads and insufficient strength. The cost is less independent of the footprint radius.
In the plot of line diameter against the number of lines, the influence from the former is seen to be crucial for the cost. Decreasing the line diameter leads to a paramount cost increase, because of the penalty function, as the line strength tends to become insufficient or the compliance so large that the excursion limit is exceeded. The number of lines plays a less important role, but it is seen how too few lines cause a higher cost.
In the final plot, the footprint radius and line diameter are presented with the number of lines kept constant. Similar conclusions can be made from this, which indicates that the main parameter is the line diameter. The footprint radius has a minor influence, but by decreasing it, the line material is decreased and results in some minor cost reduction.
3.3. Case 3
Case 3 consists of a larger number of optimization parameters compared to the first two cases.
Table 6 presents the result of the optimization.
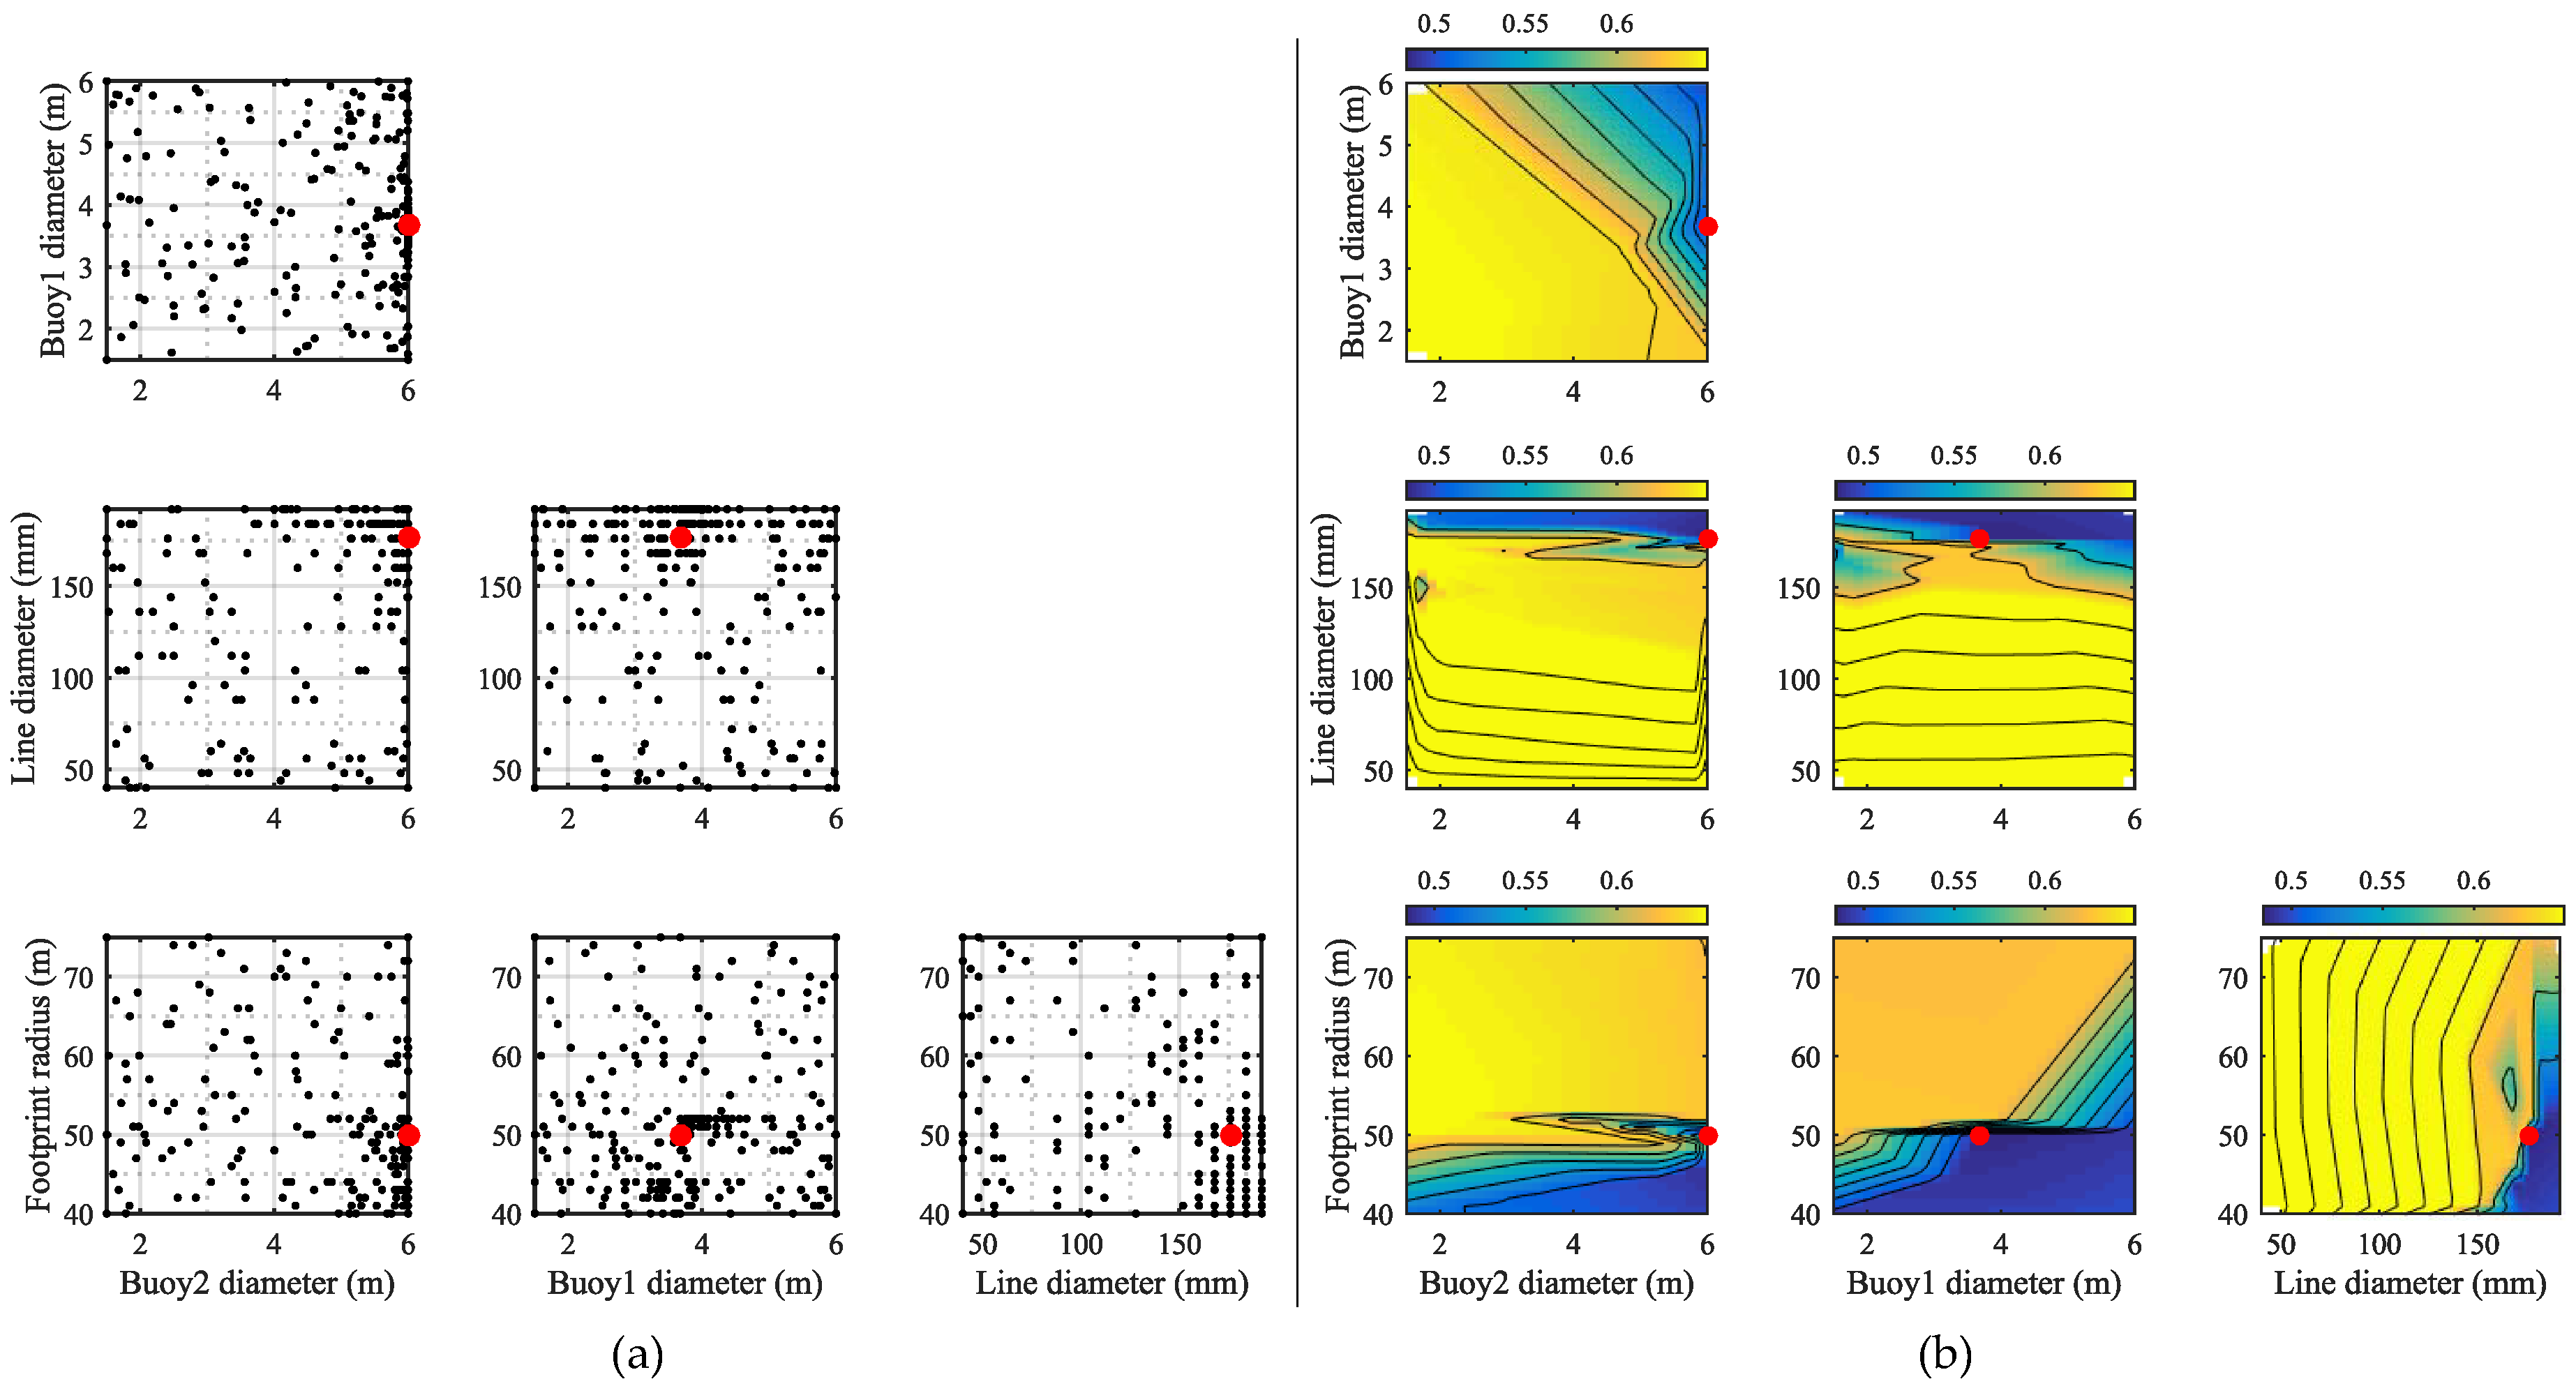
When considering
Figure 11a, it is obvious that the code identified the minimum and concentrated the evaluation around this point. In
Figure 11b, where the working range of the normalized cost is 0.48–0.52, it is apparent that a significant parameter for the cost is the line diameter. Similar to Cases 1 and 2, only the largest line diameters provide sufficient strength, but in this system, a larger range of diameters is adequate. Considering the very low stiffness presented in
Table 6, it will be expected to obtain smaller loads. In the top graph, the influence from the two buoys can be identified. Buoy 1, which is the bottom buoy, provides the lowest influence on the cost, while the top buoy provides the most influence in the system and hence determines the cost. The best solution is found by having a large buoy at the top, while the other can be relatively small. The footprint radius (and thereby, the hawser line length) also provides an important influence on the system, as it highly determines the overall stiffness. Having a large radius provides large compliance and mainly causes problems with exceedance of the surge restraint. A small radius still ensures satisfaction of all requirements, but results in larger loads, hence the need for a larger anchor. Compared to Cases 1 and 2, the mooring cost of this system is taking up a larger part of the total cost. This is partly because the device itself is less expensive, but also because the gravity type anchor in this system is expensive and other types should be investigated.
3.4. Case 4
As described in
Section 2.2, the hydrodynamic model of the WEC in Case 4 provides a significant inaccuracy, which also affects the optimization procedure.
Table 7 presents the result for this case.
Due to the implications of using linear theory on an overtopping device, very large loads are seen and cause difficulty in finding an adequate solution. Consequently, the strongest line is chosen and with the highest number of lines.
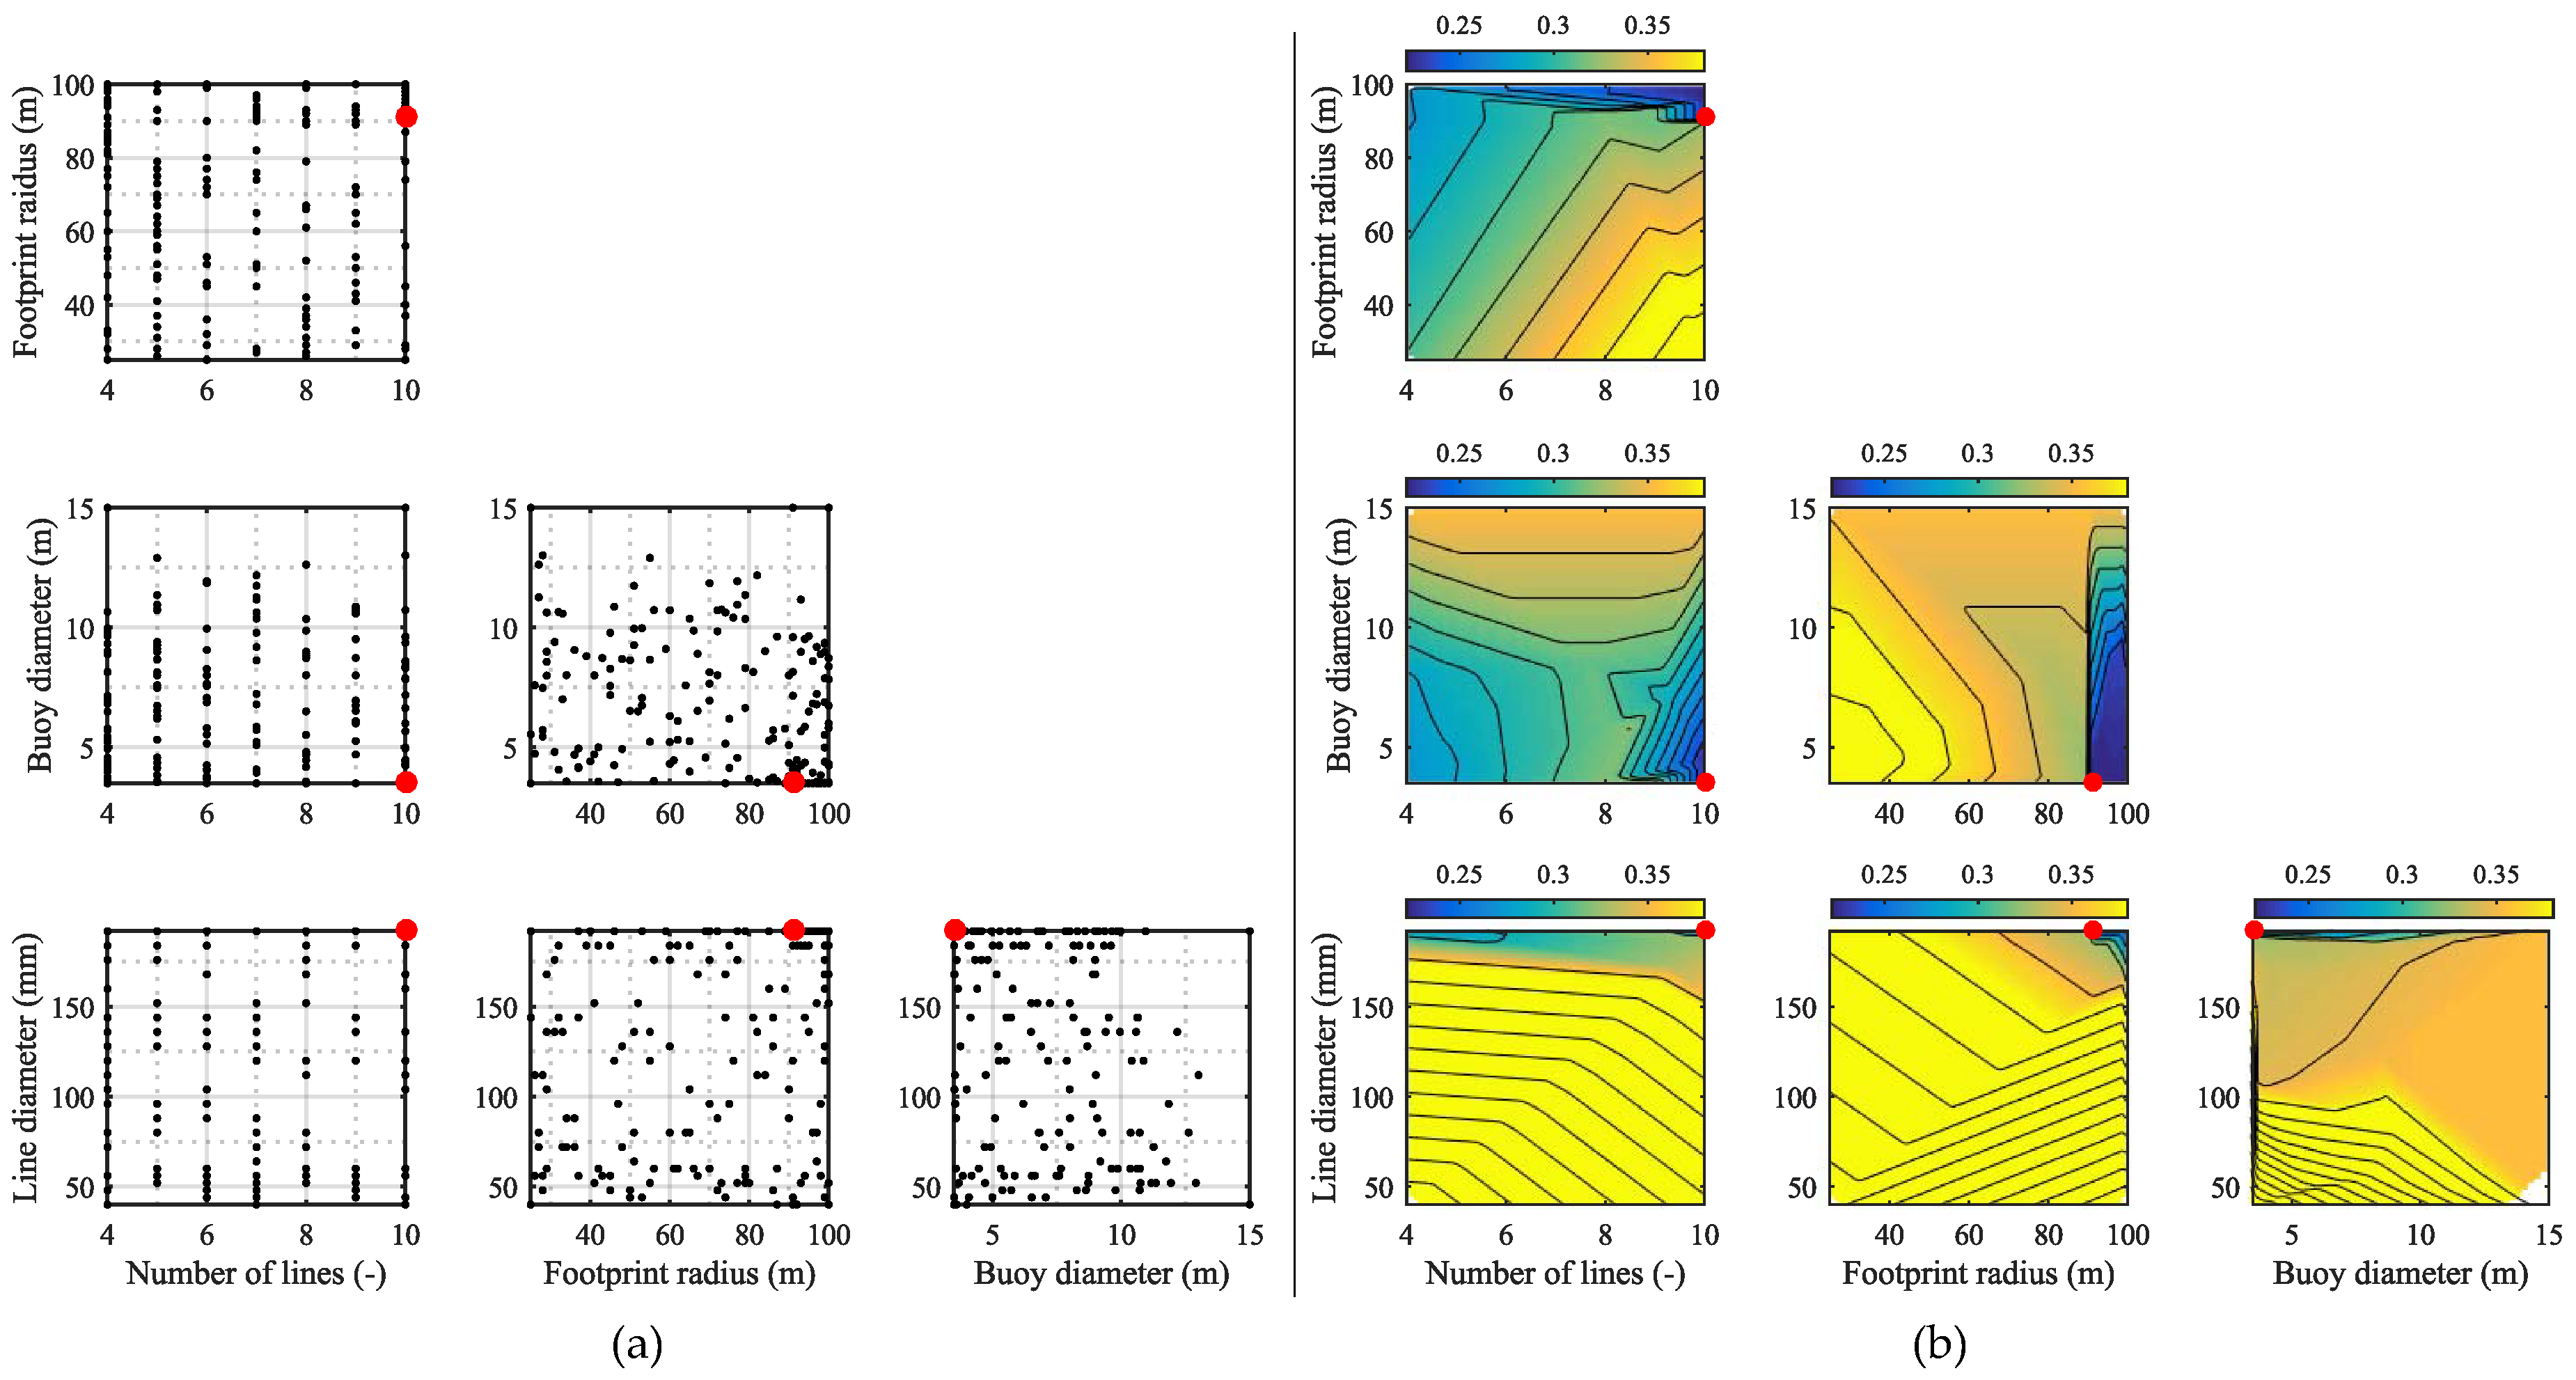
Figure 12 clearly identifies the problem of finding a solution since a significant part of the design space gives a high cost due to the penalty function. The normalized cost of the working systems is in the range 0.22–0.24. The number of lines provides an influence as it helps distribute the loads into more lines and thereby secures sufficient strength in each and also lighter anchors. Similar, the footprint radius can be used for modifying the cost through its effect on the stiffness and load on anchors. Clearly, a large radius is desired as the longer lines introduce more compliance.
The buoy size also plays an import part in the system response and cost. By having a large buoy with high buoyancy, the stiffness of the system is primarily an effect of the line stiffness, while also a large pretension in obtained. A smaller buoy results in more vertical compliance and reduces the line tensions. The optimizer identifies a small buoy as the most feasible solution and instead requires strong lines and a larger footprint radius.
4. Discussion and Conclusions
This paper used a surrogate-based optimization model to find the most suitable mooring configuration for four large floating WECs, considering design in the ULS and aiming to find the least costly solutions. Based on the presented environmental conditions and design constraints for each device, numerical models were constructed in the BEM code NEMOH and time domain model OrcaFlex. In this connection, a database of costs was constructed and used to calculate the total lifetime cost for each solution.
Based on the optimization routine, four working solutions were found. Even though it is not possible to detect from the normalized values in
Figure 9,
Figure 10,
Figure 11 and
Figure 12, it was found that the cost for Cases 1, 2 and 3 approached comparable values despite some differences in the mooring layouts as Case 3 is equipped with a buoy and hawser, while Case 1 and 2 are turret systems. The cost for these two become high due to the turret system, while Case 4 becomes expensive due to larger loads and more anchors. Case 3 provides a clear low value when compared to the other cases and can both be explained by the fact that the mooring layout is much different, but also by the fact that the WEC is extremely light compared to the other devices and with a much smaller draught, which induces smaller loads on the WEC. As the devices are different in layout, it is not possible to directly compare the cost between the cases. In [
8], the cost of mooring for a single point absorber buoy is listed to take up 8% of the total CAPEX, which for the current four cases is in the range 8–25%. The larger structures, hence, result in relatively more expensive moorings due to increased loads.
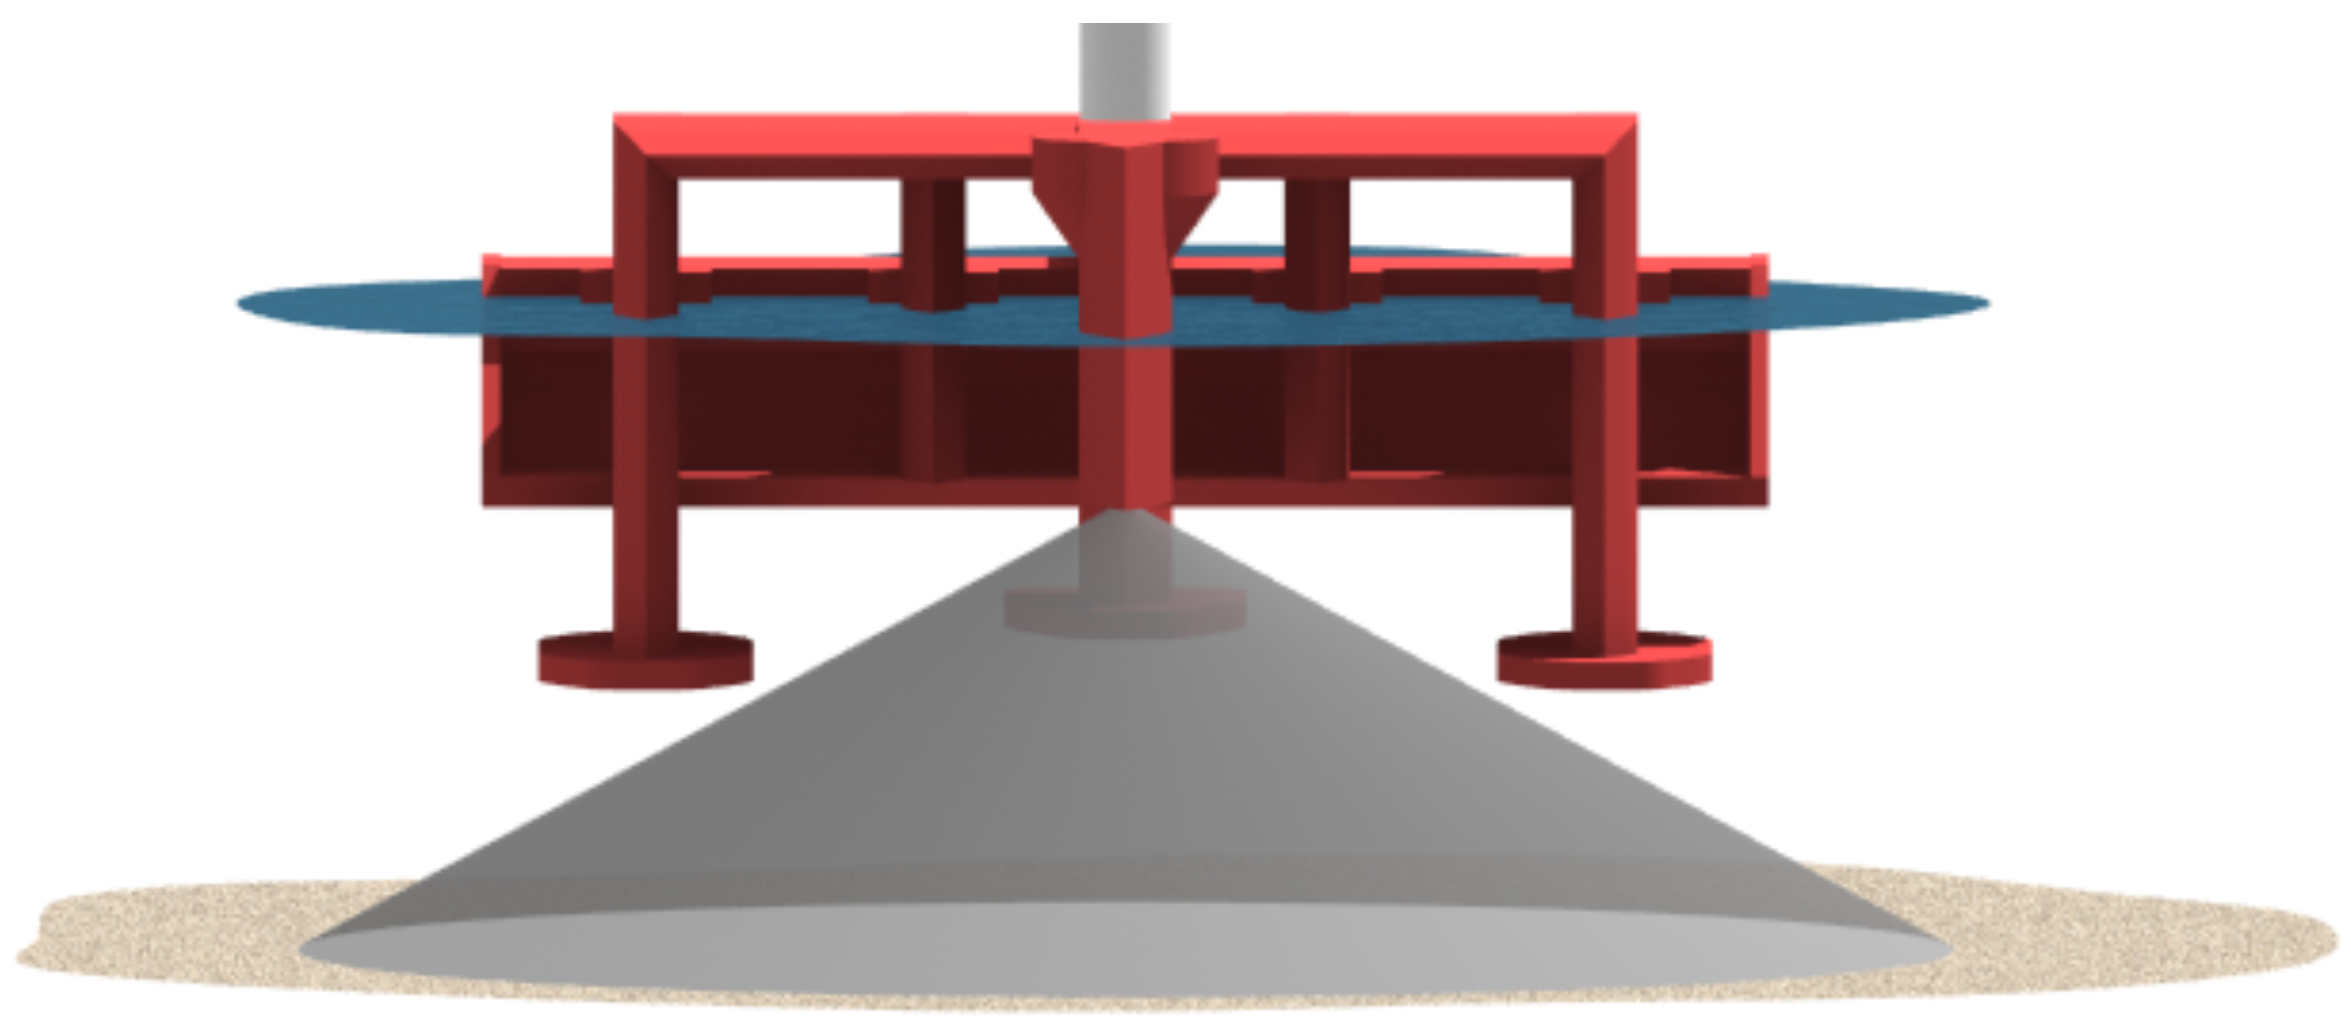
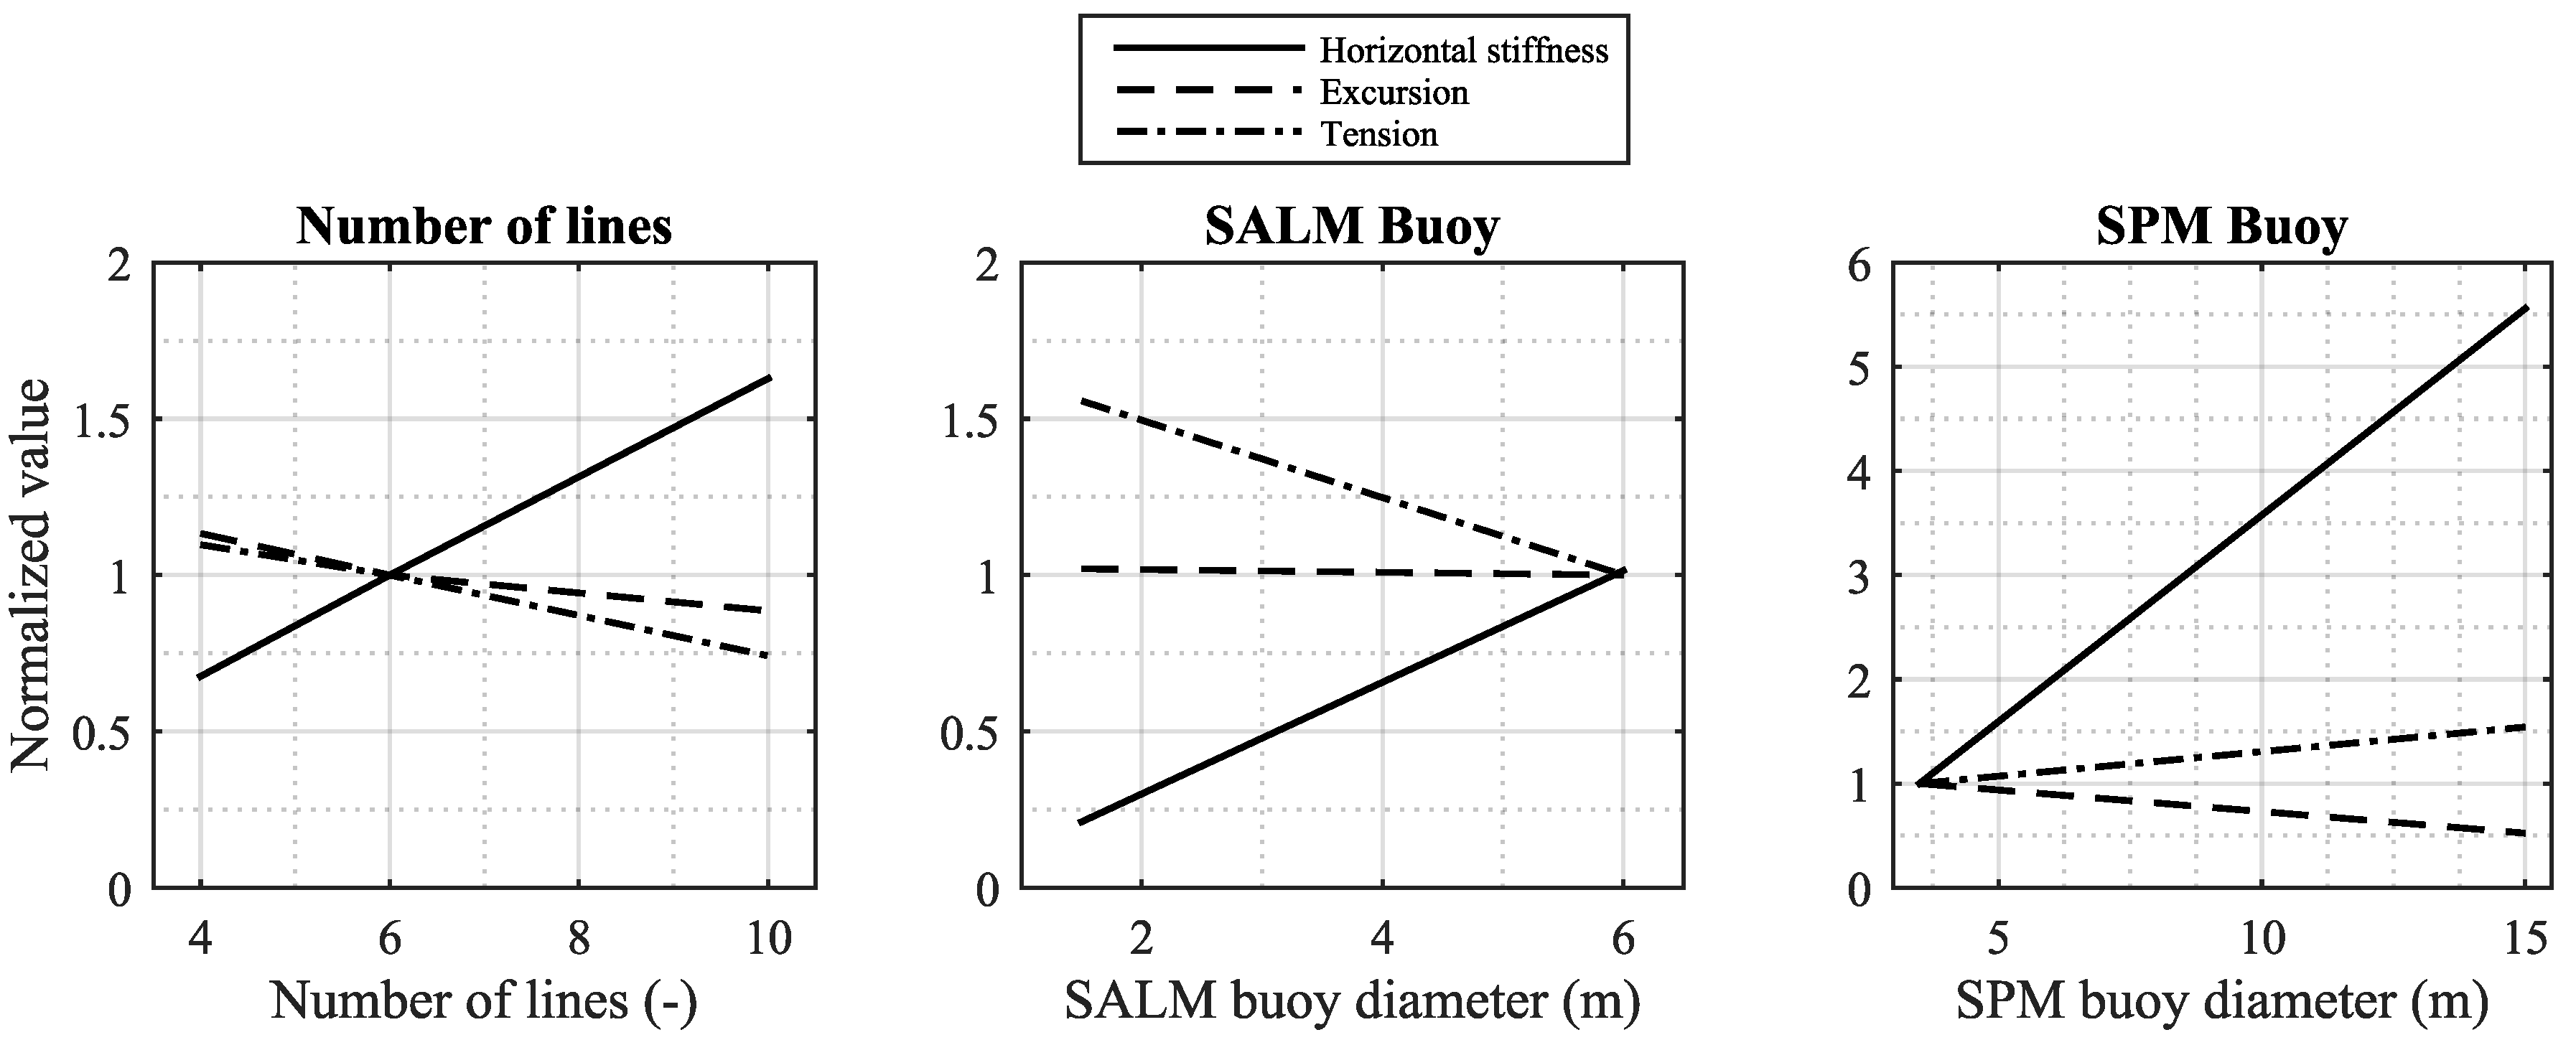
For all cases, the line diameter provided the largest impact on the cost of the mooring, as a relatively large line diameter was needed in the layouts in order to ensure sufficient strength to avoid line failure and to provide enough stiffness to avoid undesirably large motions. In the SALM system, some cost was saved by adjusting primarily the size of the top buoy as it highly influences the stiffness; cf.
Figure 13. When having a small buoy, the stiffness is low for small motions, but the risk increases of fully stretching the system where the stiffness curve becomes steep and large tensions can occur (also seen in
Figure 13). Similarly, the footprint radius was important to restrain in order to avoid large motions. In addition to the line diameter, the SPM system was influenced by most parameters. In this case, very high loads were obtained due to the problems of using linear theory on the device, but it was shown how the number of lines and footprint radius could affect the stiffness and thereby loads and cost; cf.
Figure 13. The surface buoy provided a great impact on the cost as it is a paramount influencer on the stiffness. Having a large buoy provides a much stiffer system and thereby introduces large line loads, also because much more pretension is in the lines due to higher buoyancy. The study showed that decreasing the size as much as possible provided the least expensive solution. Similar to the SALM system, the use of a small buoy in this solution increases the risk of fully stretching the system, with risk of high loads. In this case, however, it was still found more feasible to use a small buoy; cf.
Figure 13. For this particular case, there might be more cost savings, possibly by first improving the model to account for the energy dissipation by overtopping. Afterwards, it is highly relevant to consider a synthetic hawser, as well. This will introduce additional compliance to the system, but needs to be balanced with the stiffness from the buoy. Having a large buoy implies that much tension will be put on the hawser, and in this case, a small buoy is expected.
When considering
Figure 9,
Figure 10,
Figure 11 and
Figure 12, it is clear that some of the optimum solutions are found in minimums on the response surface where the gradient is large. Even minor changes to the system layout in these areas can result in significant changes of the cost, meaning that the solution is very sensitive to input parameters and their uncertainties. In some applications, it would be reasonable to search for areas where also the gradient is low in order to find solutions where the cost estimate is more reliable. In addition, the study also showed that some parameters had a minor effect on the mooring cost. From a safety point of view, it would be beneficial, e.g., to use more lines if the effect on cost is only minor in order to apply more redundancy and safety. These considerations are not included in the optimization routine, but a very strong benefit of the surrogate-based model is that information of the entire response surface is achieved and allows for additional and manual evaluation of the surface and potential use of other solutions than the global minimum.
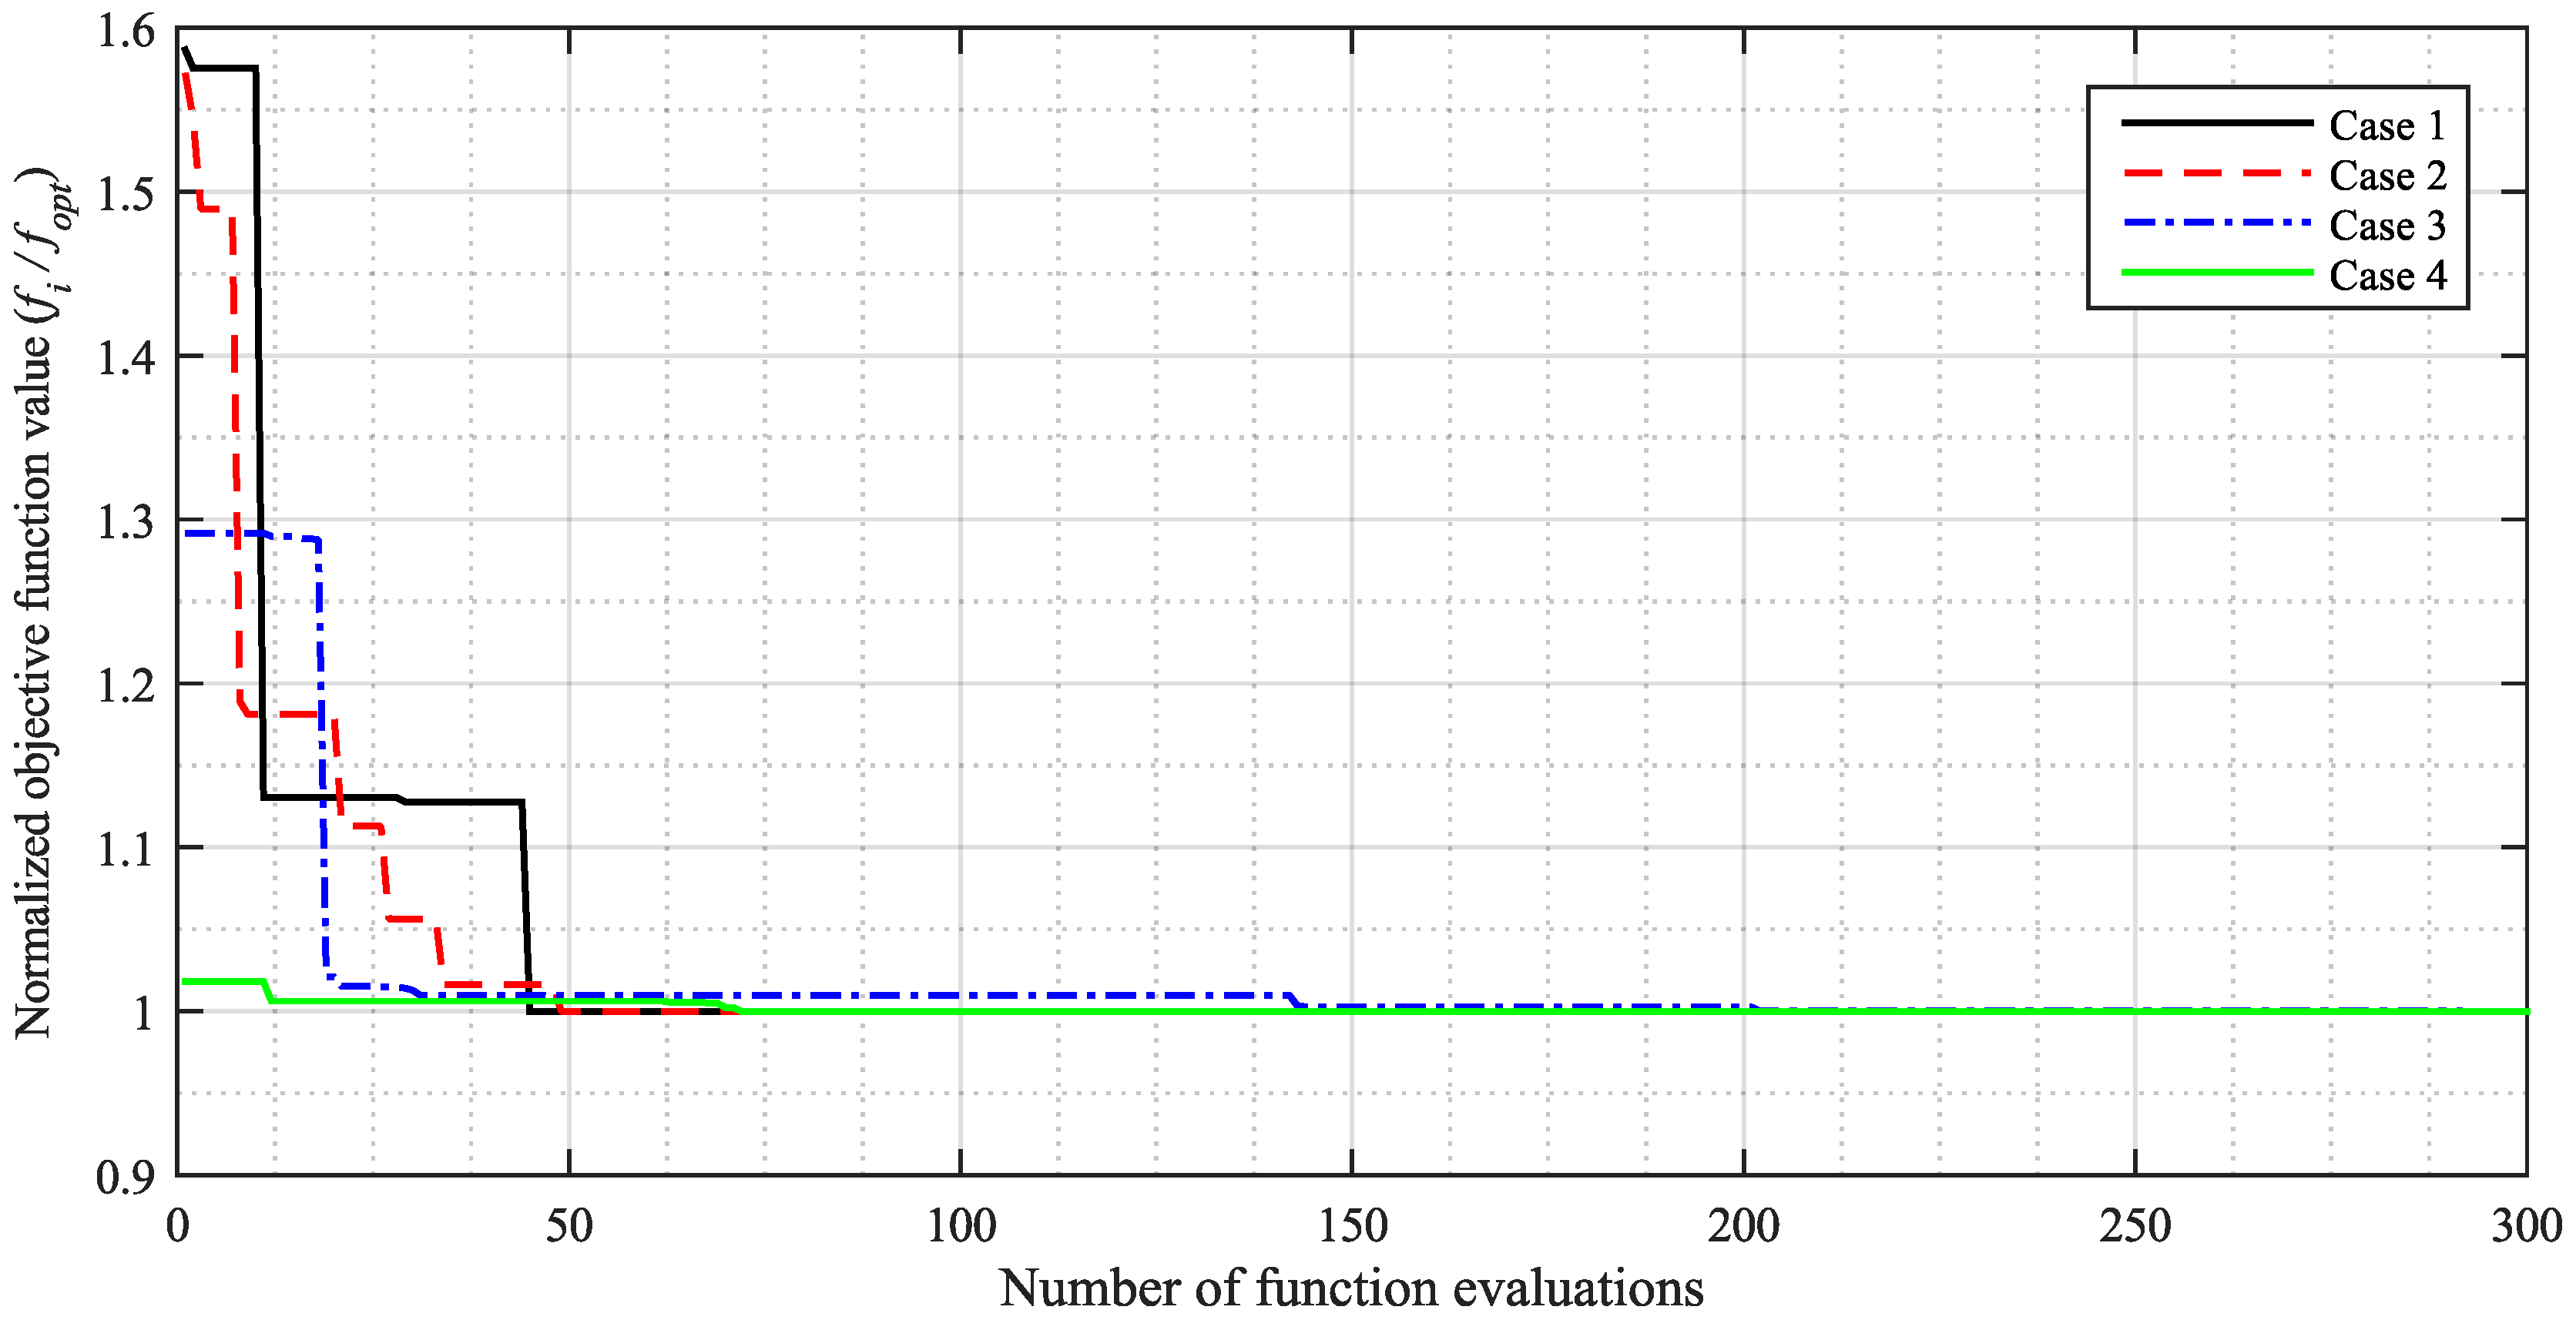
The paper showed that it was possible to use a surrogate-based optimization routine to determine an optimum mooring solution with only a limited number of evaluations. The total computational time for each case was in the range of 25–30 h, which is reasonably low for a design process. For each case, a solution fulfilling all specified design criteria and ensuring survivability was found, and the parameters affecting the mooring cost for each layout were identified. In future studies, it would be natural to improve the hydrodynamic models further and investigate their further potential cost reduction. This study only considered a surrogate-based optimization procedure with a limited number of models, while many others exist, both surrogate models and other types of optimization routines. The advantage of the present method is considerable where only a limited number of function evaluations is needed and can be used for this type of problem.


