Abstract
In this paper, we propose a new scheme for probabilistic power flow in networks with renewable power generation by making use of a data clustering technique. The proposed clustering technique is based on the combination of Principal Component Analysis and Differential Evolution clustering algorithm to deal with input random variables in probabilistic power flow. Extensive testing on the modified IEEE-118 bus test system shows good performance of the proposed approach in terms of significant reduction of computation time compared to the traditional Monte Carlo simulation, while maintaining an appropriate level of accuracy.
1. Introduction
The great proliferation of integration of renewable energy into power systems has introduced additional uncertainty into power system studies in conjunction with the conventional sources of uncertainty from the loads and the availability of resources and transmission assets. For power system studies, conventional Deterministic Power Flow (DPF) is one of the best-known mechanisms in the literature. It makes a computation for a specific operating point of the power system using constant values of loads, generations and network configuration, hence, ignoring uncertainty in the computation. To deal with uncertainty, Probabilistic Power Flow (PPF) has been developed and become an important tool in power system planning and operation. In PPF, uncertainties from input variables are modeled by probability distributions and thus the obtained output variables, such as voltage magnitudes, line power flows, etc., are represented by probability distributions as well.
PPF was first proposed in 1974 [1]. Since then, various methods such as analytical, approximate and numerical methods have been developed to solve the PPF problem. In analytical approaches [2,3,4,5,6], power flow equations are linearized and arithmetic algorithms such as convolution and cumulant techniques are used to obtain probability density functions (PDFs) or/and cumulative distribution functions (CDFs) of output random variables based on PDFs and CDFs of input random variables. On the other hand, approximate approaches (e.g., point estimate methods) [7,8,9] do not require the linearization of power flow equations. Input random variables are decomposed into a number of pairs of values and weights and the moments of the output random variables are computed as a function of the inputs. In general, the analytical and approximate methods are fast ones for PPF computation; however, the main concerns about their methods are the complexity of mathematical theories used and the effect of approximation technique on the accuracy of the obtained result. Monte Carlo simulation (MCS) [10,11,12] is a typical numerical method. MCS approaches are based on a repetition process in which multiple DPF is run for sampled values of the realizations of the input random variables and its solutions are collected to build probability distributions for output random variables. In MCS, non-linear power flow equations can be directly used. MCS has been widely used in power systems analysis. It is recognized as a most accurate and robust method, so it is usually used as a reference to evaluate the accuracy of other methods. In addition, various types of probability distributions of input random variables as well as their relations can be easily to be modeled and managed. However, the main drawback of MCS is that it requires a large number of simulations, so it is very time consuming compared to analytical and approximate methods and difficult to apply for large power systems in practice.
In order to reduce the computational burden associated with MCS, several sampling methods such as Latin hypercube sampling [13,14], Latin super cube sampling [10] and importance sampling [15,16] are developed and applied. In another attempt, to improve computational efficiency, Quasi-Monte Carlo simulation (Q-MCS) is proposed. In [17], Q-MCS is applied to calculate the PPF for the radial distribution system. In [18], combination of Quasi-Monte Carlo and multiple linear regression is proposed. In [19,20], it is shown that Q-MCS has better performance than the traditional MCS. In [21], MCS and Q-MCS are investigated. In [12], uncertainties of power load demand and power production from renewable generation systems are taken into account by using a method based on combination of MCS technique and multi-linearized power flow equations. MCS using importance sampling techniques via the cross-entropy method is proposed to estimate PPF risk events such as probabilities of line flow overload, bus under-/over-voltage magnitude, etc., in [22].
Considering the advantages and drawbacks of different PPF methods in the literature, in another way to manage uncertainty and reduce simulation time, data clustering is used to deal with input data before running MCS. This method does not require either any modification in the non-linear power flow equations or applying complex mathematical methods. In [23], to reduce the complexity of the transfer capability problem, a method based on data clustering using K-means algorithm is developed to group the input data, including the output from wind farms and systems’ loads, into different clusters, then, cluster agents are employed instead of the large dataset. In [24], a K-means based data clustering algorithm is also used in solving PPF for radial distribution systems including wind farms. The proposed method in [24] can significantly reduce the calculation burden without having compromising the accuracy of results. For MCS based PPF, data clustering can effectively enhance the performance of MCS; however, high-dimensional input data of PPF problem associated with a large-scale power system incorporating renewable energy sources make the task of clustering more challenging. Several existing techniques like K-means do not usually produce good results in such cases.
To overcome the above-mentioned issues, a data clustering approach based on the combination of Principal Component Analysis (PCA) and Differential Evolution (DE) is proposed in this paper. First, PCA is performed for input of PPF problem to reduce its dimension, and then DE algorithm is used for clustering. The clustering approach proposed is very useful in reducing the computational burden associated with MCS and make it practical for calculation and analysis of large power systems, while keeping the acceptable level of accuracy. In addition, in order to reflect the actual operation of power systems, distributed slack bus model is also used in PPF in this paper. The proposed data clustering as well as PPF methodologies are tested on the modified IEEE-118 bus test system to demonstrate the performance of the proposed PPF method compared to the traditional MCS.
The remainder of the paper is organized as follows: In Section 2, PCA is presented. In Section 3, the proposed clustering technique is described, while the PPF methodology developed is given in Section 4. In Section 5, the testing of the proposed methodology on the modified IEEE-118 bus test system is described and the results are discussed. We discuss some main features and some aspects of applications of the proposed method in Section 6. Finally, Section 7 concludes the paper.
2. Principal Component Analysis
PCA [25,26,27] is a powerful tool for high-dimensional data analysis. It performs an orthogonal transformation on data to transform a number of possibly correlated variables into a number of uncorrelated variables called principal components (PCs). PCA could be used to reduce a large set of variables to a small set without losing significant information in the original set. The underlying technique of PCA is the eigen analysis. Traditionally, PCA is performed on a square symmetric matrix, i.e., the correlation or the covariance matrix of the dataset. The covariance matrix can be directly used if the scales of the considered variables are similar. Otherwise, the correlation matrix is used or the data need to be standardized before performing PCA [27].
Use of the PCA technique is presented in detail in [25,26,27], while procedure of PCA is summarized in the following.
Suppose n-by-m matrix A contains the original dataset (rows of A correspond to observations and columns correspond to variables, e.g., load at each bus, output from renewable energy sources), we perform PCA on the dataset as follows:
- Center the data (by subtracting the mean of each variable) to obtain centered matrix
- Form covariance matrix or correlation matrix and calculate its eigenvalues () and corresponding eigenvectors ();
- Sort eigenvalues in descending order, i.e., ;
- Construct the projection matrix:
- Transform the dataset via E to obtain a n-by-m matrix , where each column of Y is called a PC.
The variance of the ith PC () is equal to the eigenvalue associated with that PC. The first column of Y (the first PC) corresponding to the largest eigenvalue is the most important component, which contains most of the variance (information) in the dataset A, followed by the second component, and so on.
The contribution of the ith PC to total variance of the data can be calculated as:
If the first k eigenvectors that correspond to the k largest eigenvalues are selected, we could obtain a reduced matrix (i.e., select the first k PCs), where .
The cumulative contribution of the first k PCs is:
Consequently, PCA projects the data in matrix A (size n-by-m) into lower dimension subspace (size n-by-k) by picking up a few numbers of components (i.e., k) with the largest variances. In this paper, after finding reduced set of data, a clustering technique is applied to perform clustering.
3. Proposed Clustering Technique
Data clustering [28] is one of important data mining techniques with variety of applications. Among many partitional clustering algorithms, K-means is one of the most popular ones and it is easy to execute. Nevertheless, it only converges to arbitrary local optima. In addition, for K-means, the number of clusters needs to be specified a priori. Clustering algorithms partition a dataset into groups by maximizing the similarities among members within the same groups, while minimizing the dissimilarities between different groups. In that sense, clustering problem can be solved as an optimization problem. Hence, optimization algorithms, such as Genetic Algorithms (GA) [29,30,31], Particle Swarm Optimization (PSO) [32,33,34], etc., can be applied for clustering. In more recent years, a promising approach, namely DE [35,36,37,38], emerged for numerical optimization problems. Different from K-means, all these algorithms provide globally optimal solution. DE is simple to implement and requires little or no parameter tuning; however, it can give a good performance for clustering. As a result, DE is chosen to use in the current paper. Details of DE algorithm can be found in [35,36,37,38].
In practice, clustering high-dimensional dataset is really a challenging task. Moreover, it is worth noting that for high-dimensional data many clustering methods do not usually produce good results. To overcome this difficulty, in this paper we perform PCA to reduce dimension of the dataset before using DE algorithm.
The proposed clustering technique, based on combination of PCA and DE clustering algorithm (named PCA + DE), is used to deal with inputs in PPF problem. It proceeds as follows:
- Form input data matrix A with size of n-by-m (rows of A correspond to observations and columns correspond to variables);
- Perform PCA and select first k PCs (having largest variances);
- Transform data into the reduced projected data (in projected space with size of n-by-k).
- Perform DE algorithm to partition data.
4. Probabilistic Power Flow Methodology
4.1. Distributed Slack Bus Probabilistic Power Flow
Power flow analysis is the most widely used tool in power system studies. The conventional power flow model is based on the concept of a single slack bus that is responsible for balancing any power mismatch in the system. However, there is no slack bus in actual power systems. In an actual system, power mismatch is usually shared by multiple generators which participate with participation factors in the regulation of power mismatch in advance. The corresponding model is known as distributed slack bus model [5,39,40] that is appropriate to the actual operation of power systems.
Given a power system with nb buses, buses 1 to ng are the generator buses that take care of the power mismatch in the system ∆PM, while buses from ng + 1 to nb, i.e., including remaining generator buses and load buses, are not involved in the imbalance sharing.
Compared to the conventional single slack bus model, in distributed slack bus model, only the real power part of the Jacobian matrix is modified as follows:
where is injected real power at bus i (i = 1,2,...,nb); is voltage phase angle at bus i (i = 2,3,...,nb; bus 1 is assumed as a voltage phase angle reference for other buses).
In Equation (3), each element of the first column from 1 to ng is called participation factor of corresponding generator:
In order to solve the real power flow Equations (3), an iterative process is used. For the convergent power flow, the amount of real power imbalance in the system is distributed among generators based on participation factors .
In distributed slack bus model, ng generator buses share power mismatch in the system in a predetermined manner. There are several ways of sharing that are suitable for various applications. Among them, two popular methods of sharing are: (1) proportional to the current injections; (2) proportional to the margin between the current injections and the lower or upper limits, accordingly [40]. In the current paper, the latter is used in Section 5.
Real power output of each generator can be represented as
where:
- : real power output of generator i,
- : scheduled real power output of generator i,
- : total real power mismatch at solution point,
- , : the upper and lower limits of generator i, respectively.
The power flow equations for distributed slack bus model can be expressed in a matrix form as:
where:
- w: vector of nodal injected powers (including power injection at the slack bus in the single slack bus model),
- x: vector of state variables,
- z: vector of line power flows,
- f(x): power flow equations,
- h(x): functions to compute line power flows.
In PPF, the uncertainties of loads, power outputs of generators and so on can be taken into account. Each element of w in Equation (8) is represented by a random variable that is modeled by a suitable probabilistic distribution. Therefore, from Equations (8) and (9), each element of x and z is also random variable.
4.2. Data Clustering Based Probabilistic Power Flow
In this paper, in order to reduce the computation time associated with MCS, while keeping the acceptable level of accuracy, we make use of PCA + DE clustering algorithm to group the input data into distinct groups (clusters). The proposed PPF methodology is implemented step by step as follows:
- Step 1:
- Build probabilistic models for input variables of PPF problem;
- Step 2:
- Generate samples for the inputs based on their probabilistic models;
- Step 3:
- Perform PCA + DE clustering algorithm to obtain cluster agents and corresponding probabilities;
- Step 4:
- Run DPF for each cluster agent and save the outputs;
- Step 5:
- Extract statistical information of output variables and make probabilistic analysis such as probability of line overloading, probability of over-/under-voltage, etc.
5. Case Study
In this section, we apply the proposed PPF approach to a case study on the modified IEEE 118-bus test system. The single line diagram, branch, bus, and generator data of the IEEE 118-bus test system are given in [41]. We modify the system by adding ten wind farms to ten buses as in Table 1. In this test, we focus on the proposed data clustering technique while considering uncertainties of both loads and wind generation. The information of loads, wind power outputs, and their uncertainties are assumed to be known. For the sake of simplicity and without loss of generality, load at each bus is represented by a normal distribution with the mean equal to the base value and standard deviation of 10% of its mean, while the uncertainties of wind power outputs are assumed to have Weibull distributions with their parameters as shown in Table 1. Wind power outputs at different buses are correlated with correlation coefficient equal to 0.8.

Table 1.
Wind power at ten buses.
In order to assess the performance of the proposed PPF method, at the same time a MCS with 10,000 samples has been carried out and taken as reference. We also perform K-means method with different number of clusters for comparison of their performance. The test is implemented in Matlab (R2015b) on an Intel Core i5 CPU 2.53 GHz/4.00 GB RAM PC.
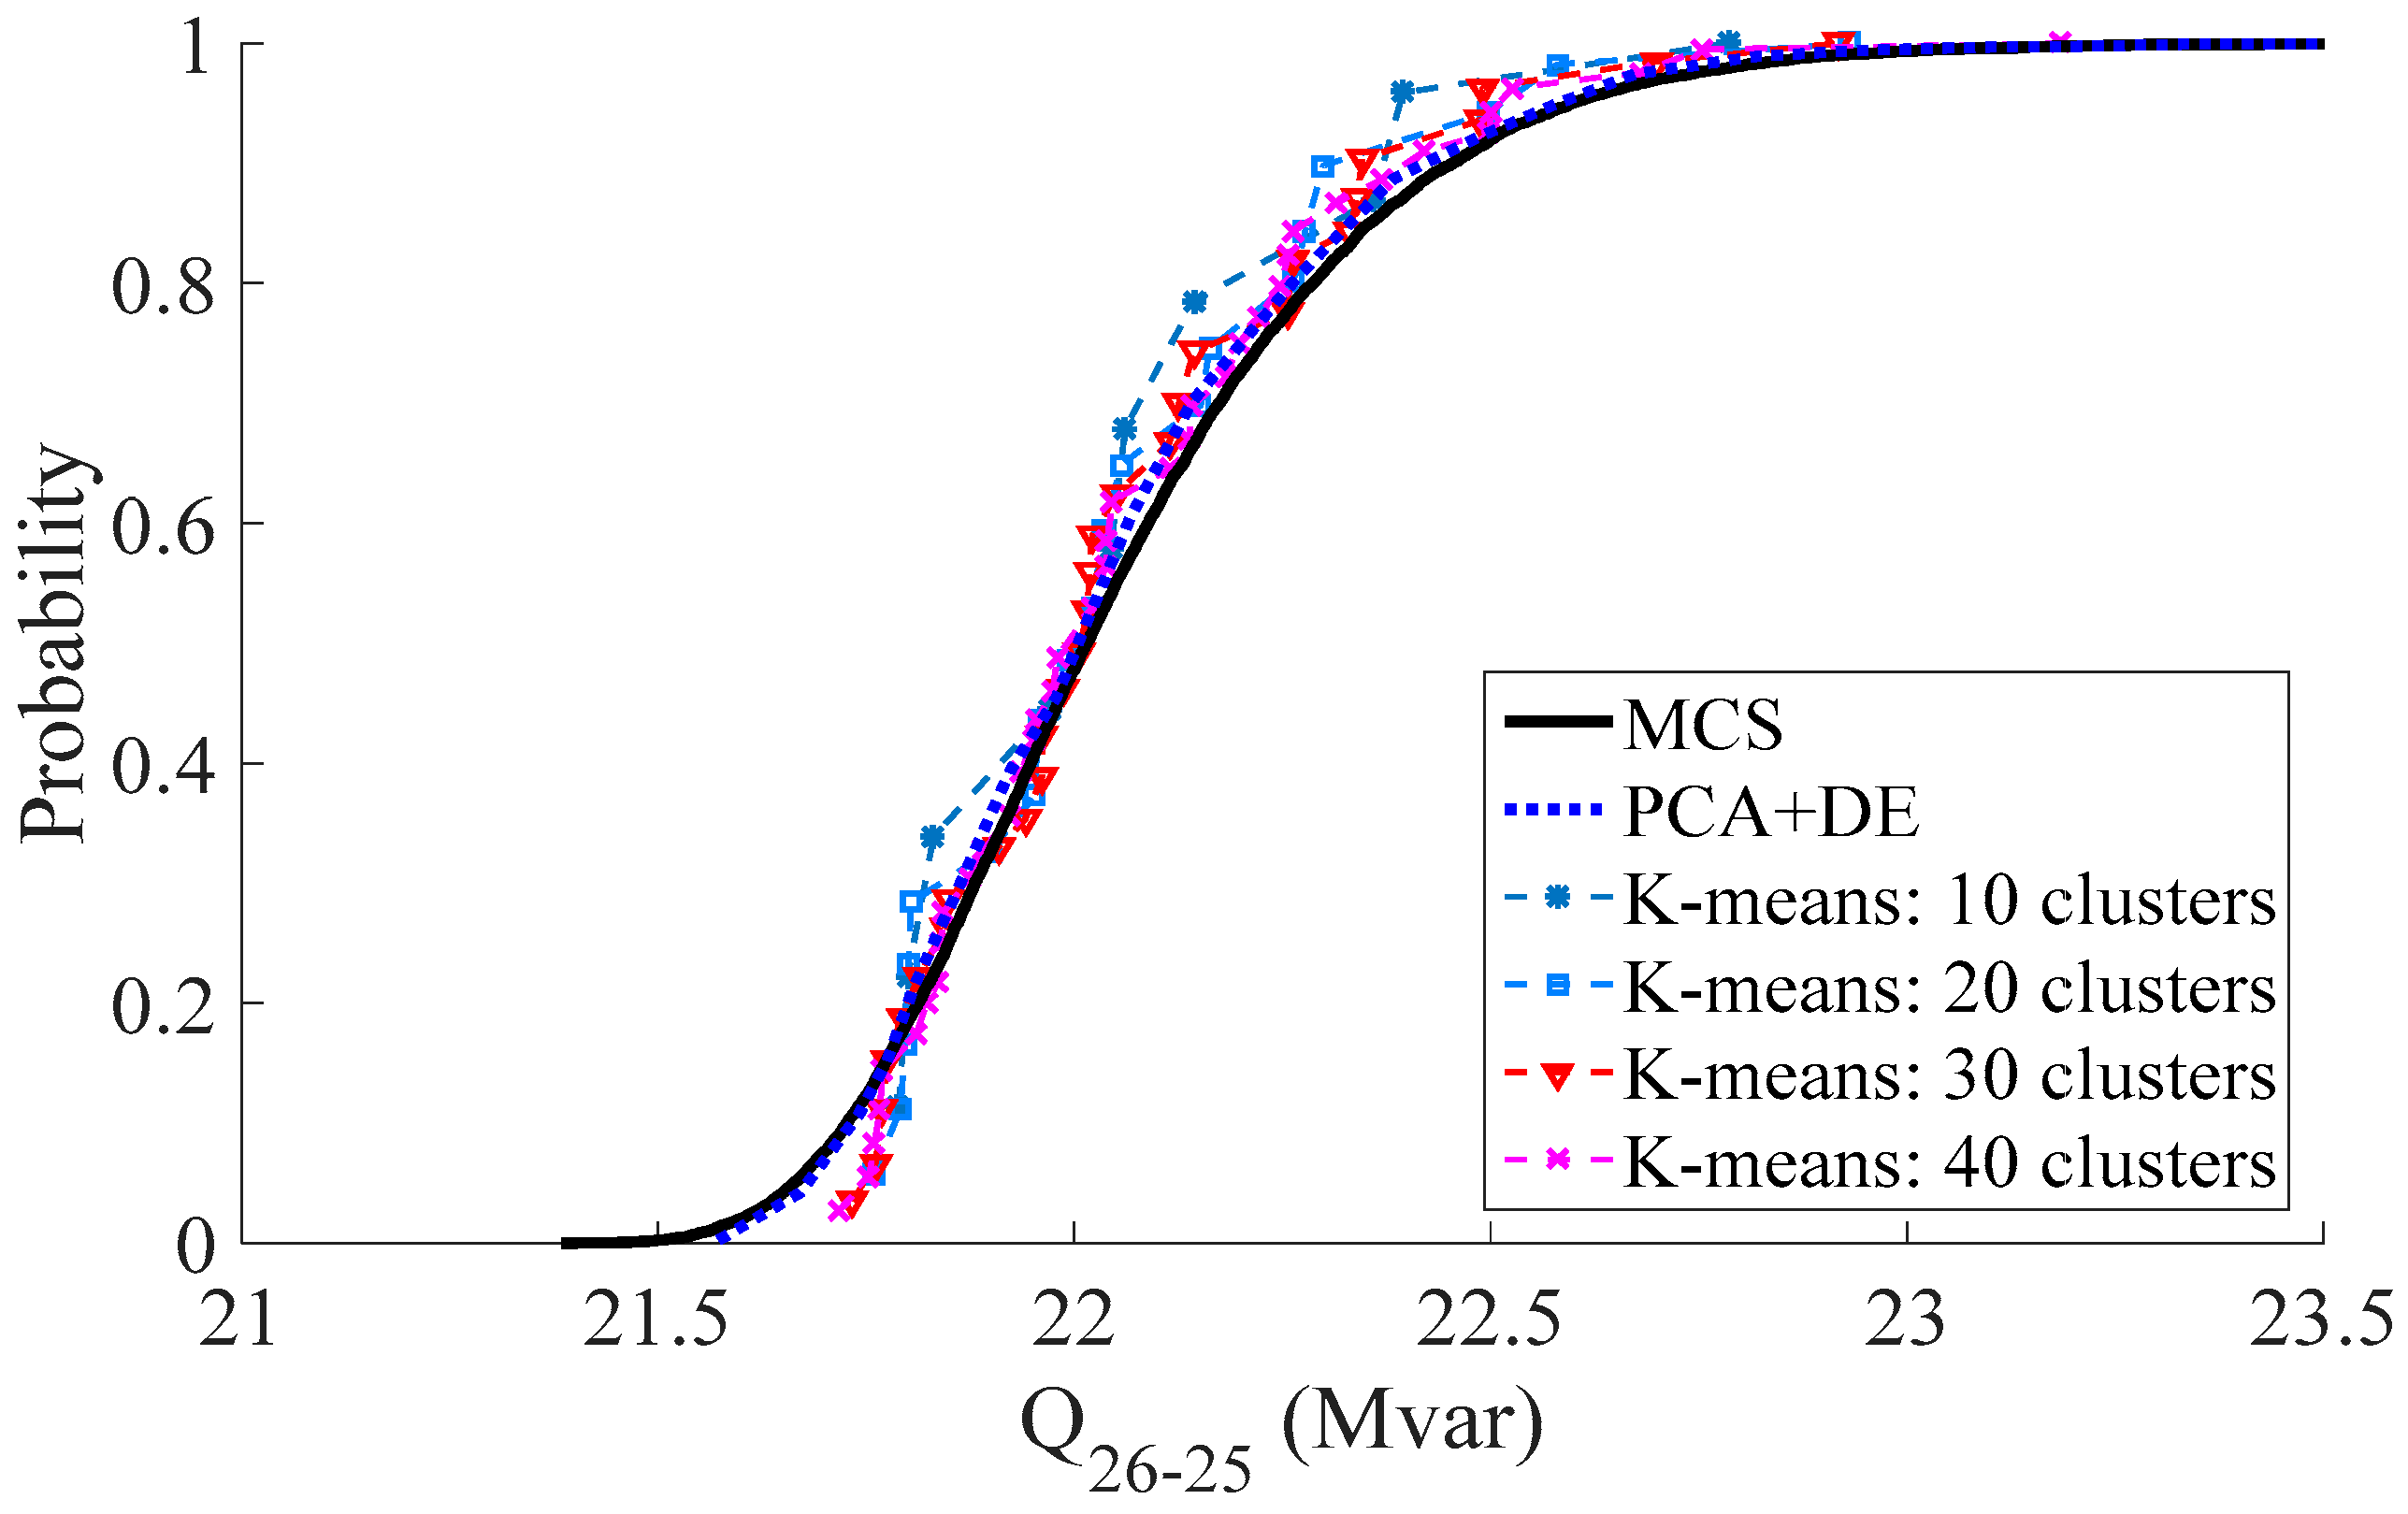
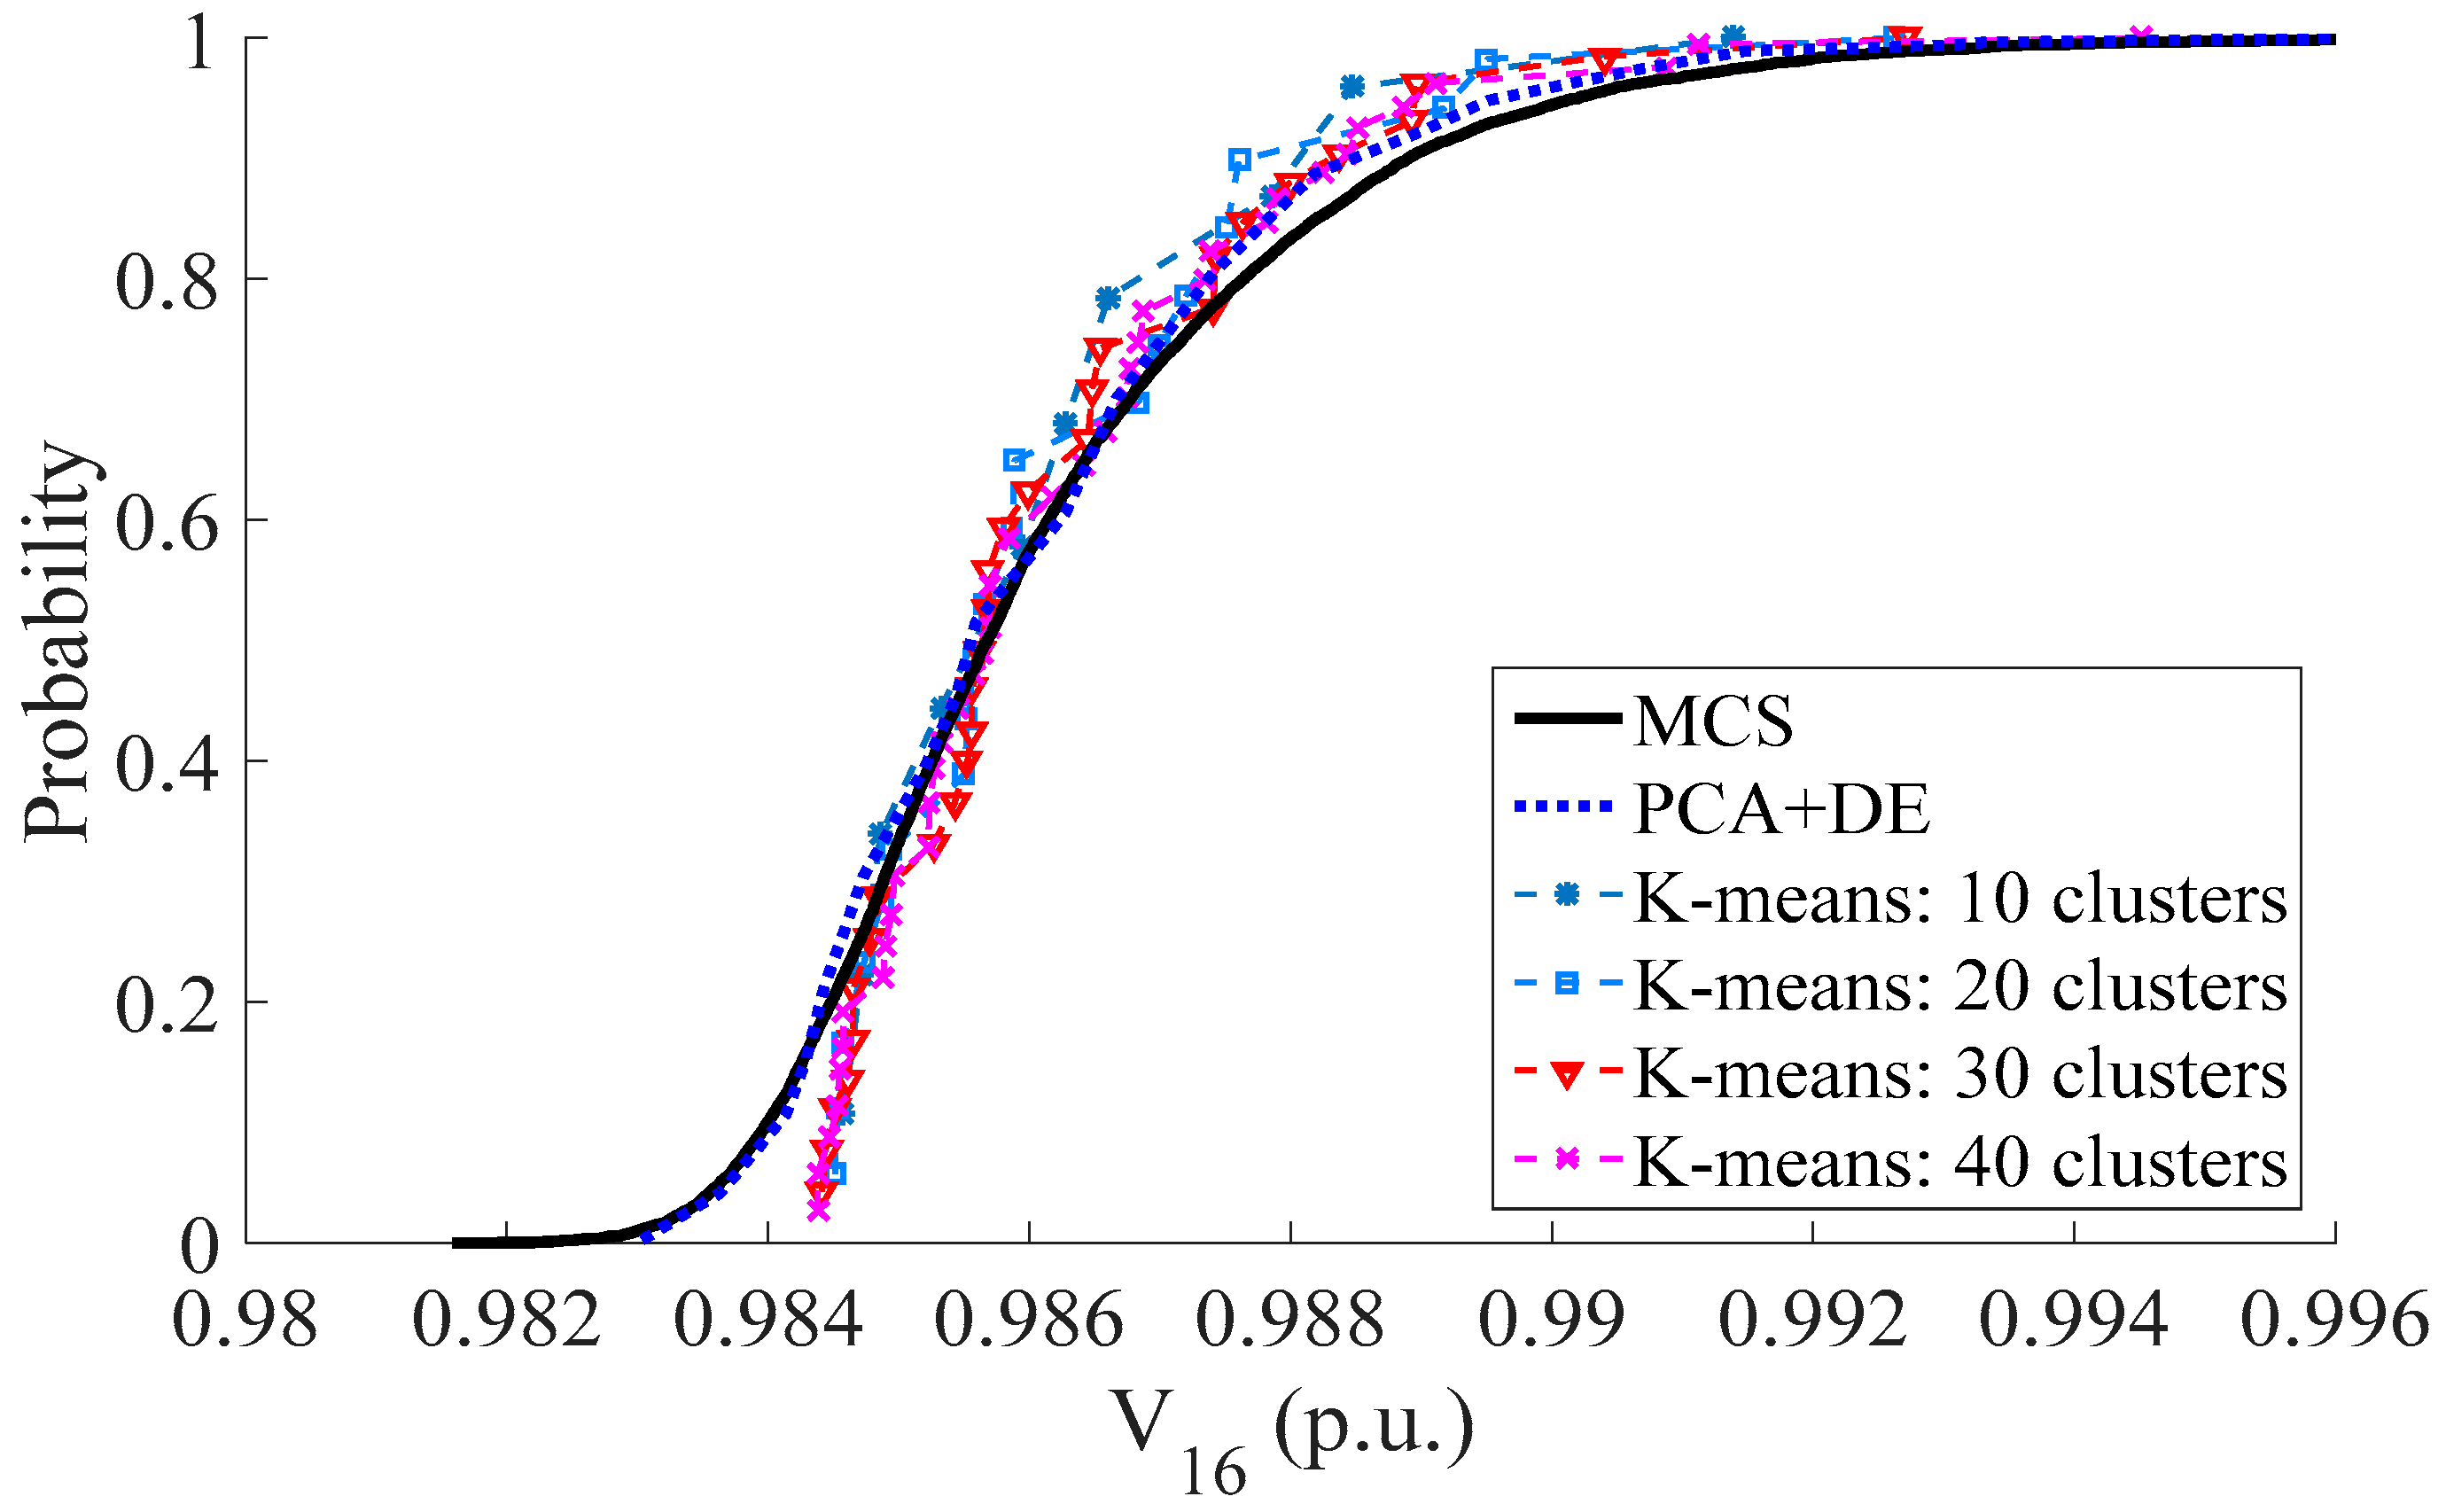
Taken as examples, Figure 1, Figure 2 and Figure 3 show results in the form of CDFs obtained from different methods for active power flow through line 30–38 (P30–38), reactive power flow through line 26–25 (Q26–25), and voltage at bus 16, respectively. The figures indicate that the obtained results from PCA + DE approach are more accurate and closer to the MCS method in comparison with the K-means method results. Moreover, it is worth noting that, due to the issues with K-means algorithm as mentioned in Section 3, the K-means method should be run a number of times and then the best solution is selected, while the proposed PCA + DE method can give similar results in different runs. Table 2, Table 3 and Table 4 also show comparison of results from different methods for the above random variables. For K-means method, when the number of clusters increases, the accuracy increases as well; however, it needs more time for computation. The obtained results in terms of mean values (µ), standard deviations (σ) and their relative errors (eµ and eσ) show the good performance of the proposed method.
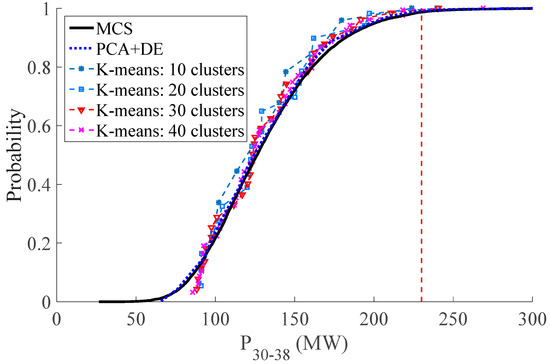
Figure 1.
CDFs of active power flow through line 30–38.
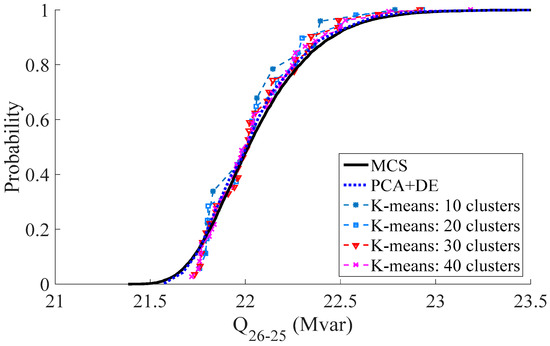
Figure 2.
CDFs of reactive power flow through line 26–25.
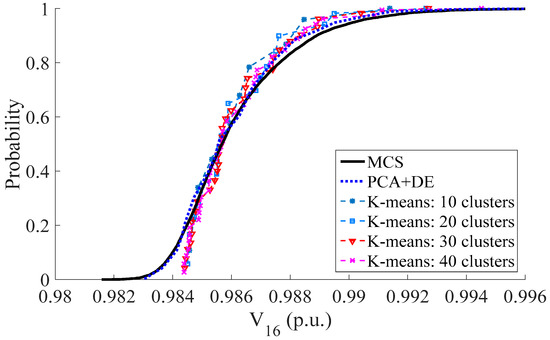
Figure 3.
CDFs of voltage at bus 16.
Table 2.
Comparison of results from different methods for active power flow through line 30–38.
Table 3.
Comparison of results from different methods for reactive power flow through line 26–25.
Table 4.
Comparison of results from different methods for voltage at bus 16.
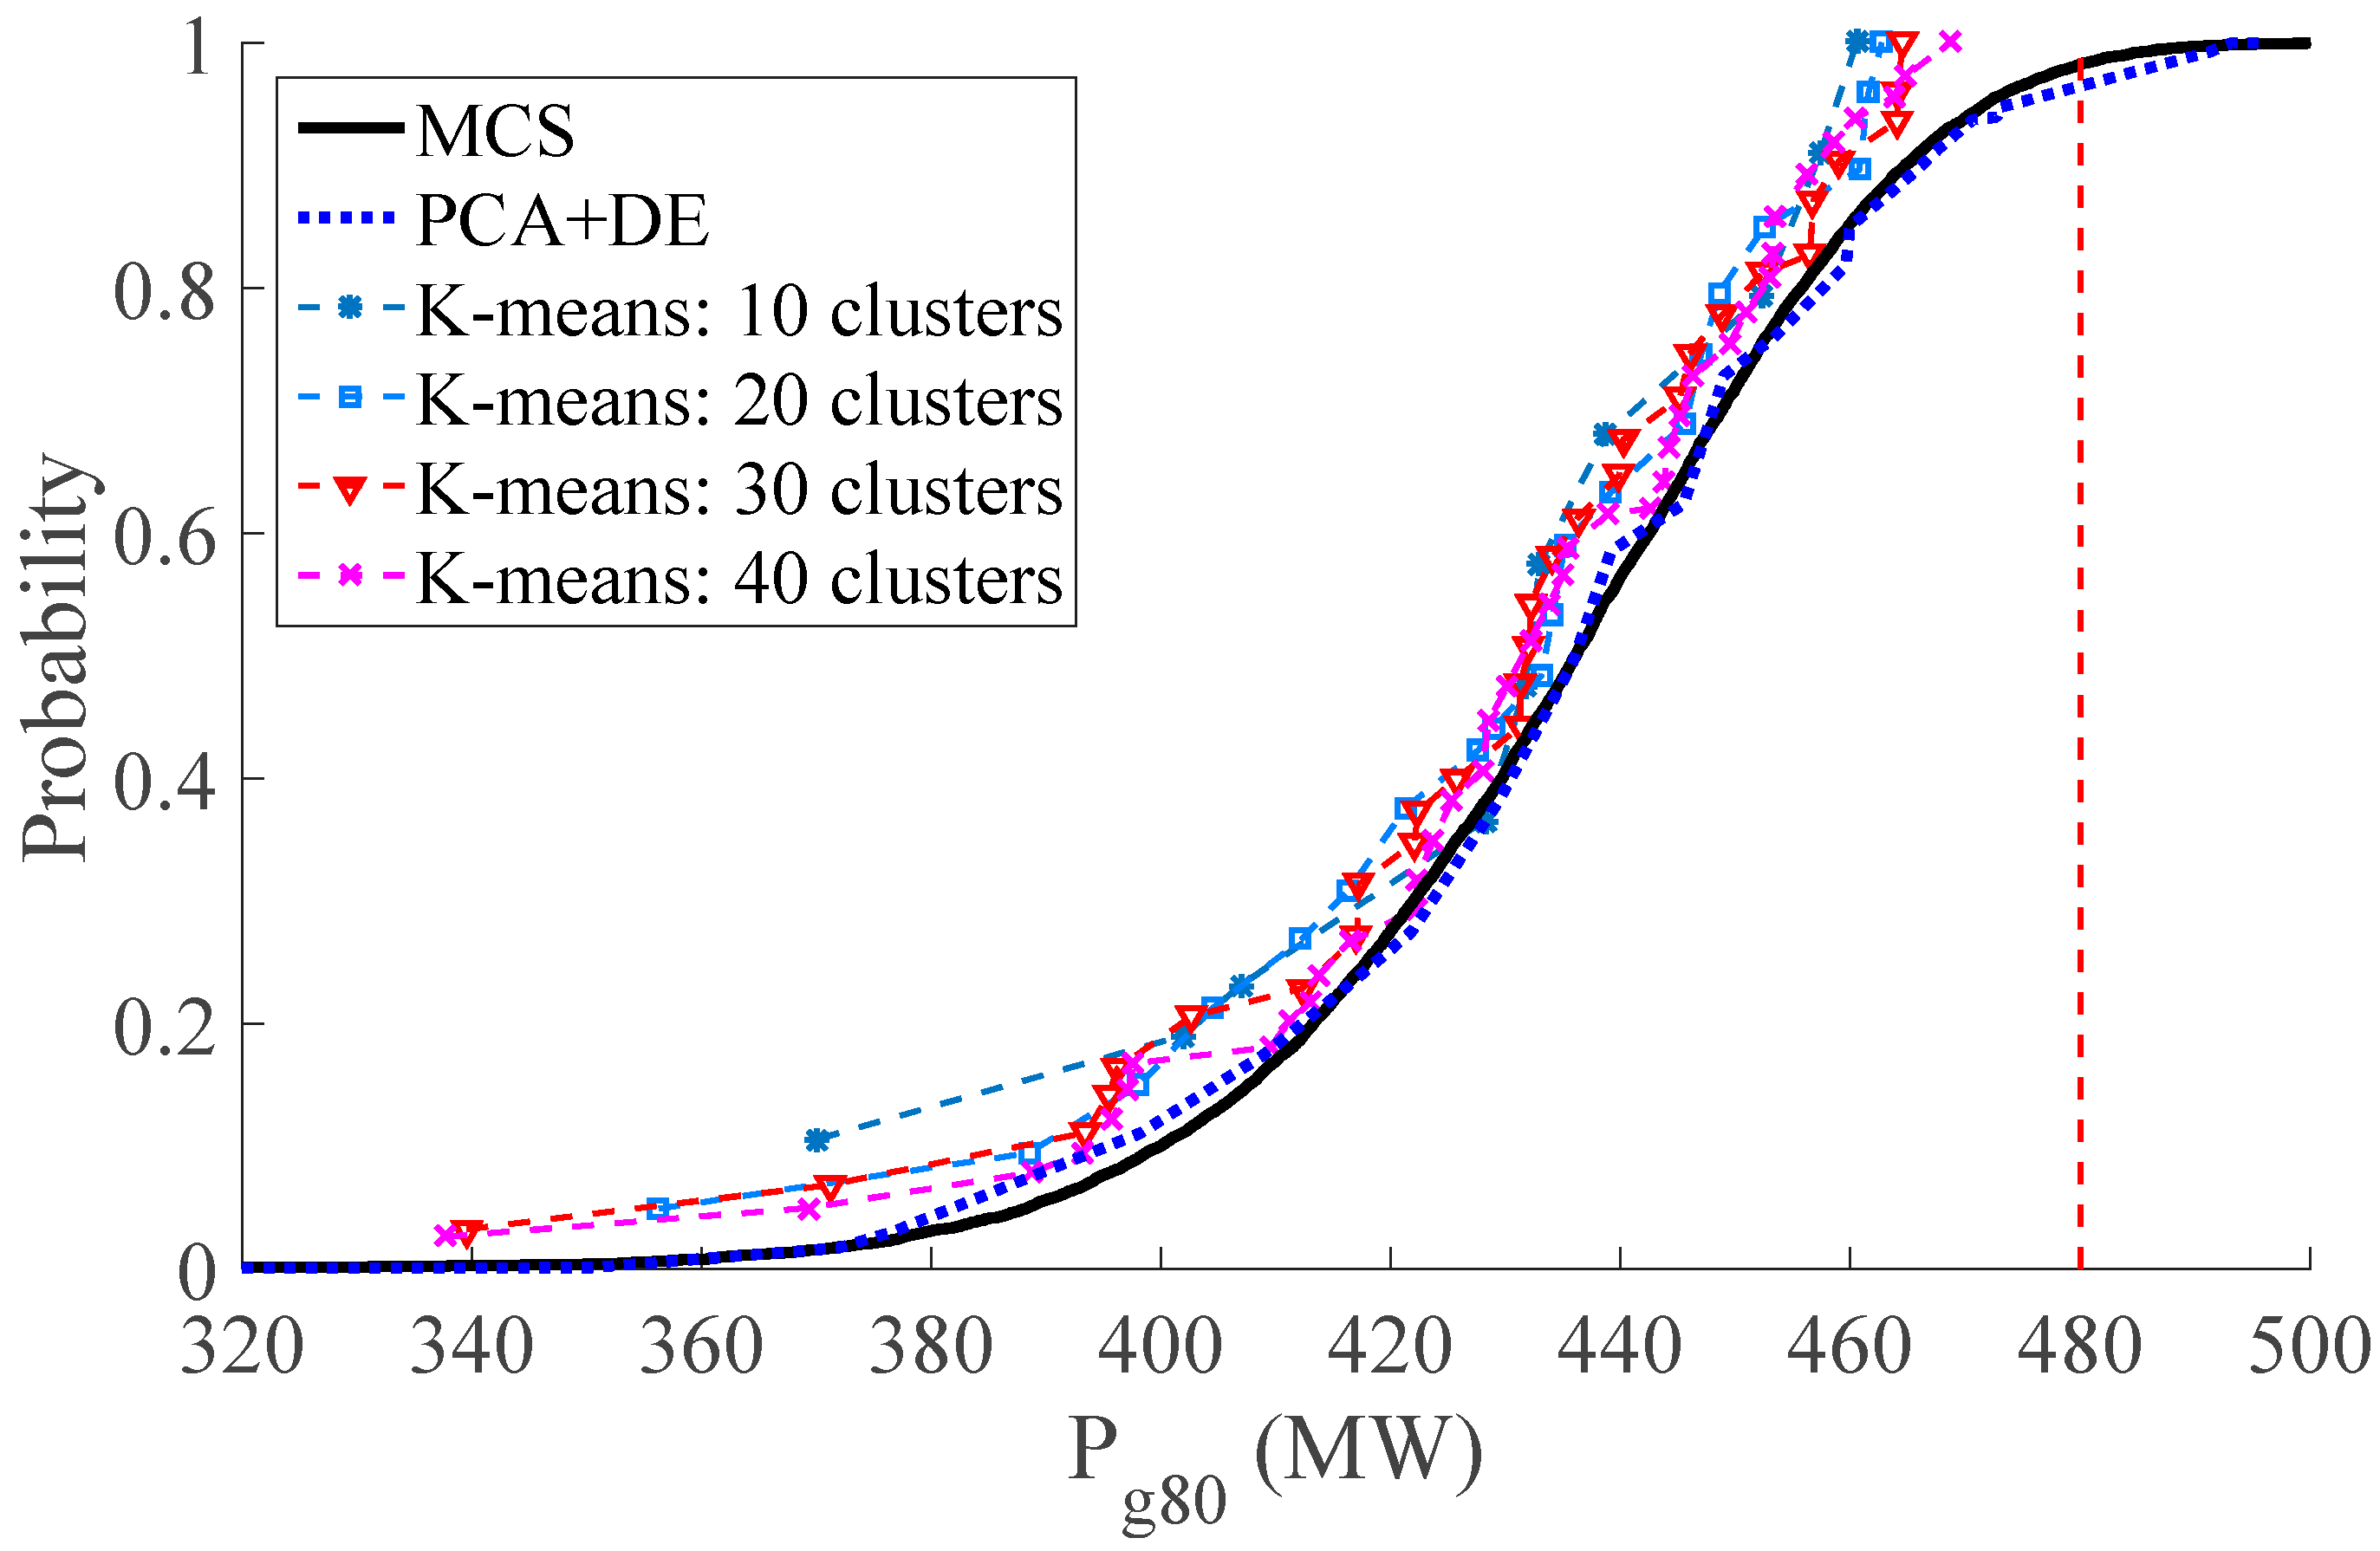
In the system, generators at buses 69 (the slack bus in single slack bus model), 80 and 89 are slack distributed so that power mismatch is shared among them according to their participation factors as mentioned in Section 4. Figure 4, for example, illustrates CDFs of power output of generator at bus 80. They account for both the share of the losses (deterministic amount) and the uncertainties on both loads and wind generation in the system [5].
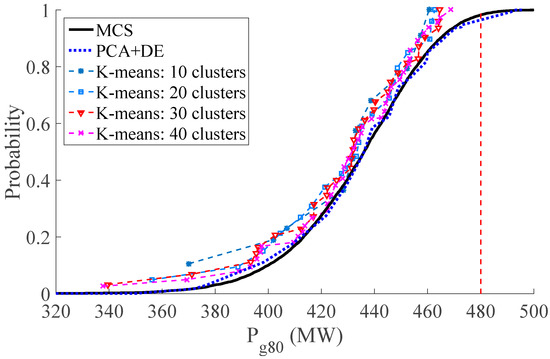
Figure 4.
CDFs of power output of generator at bus 80.
For demonstrating the good performance of the proposed method in reducing the computation time, Table 5 is shown. It is clearly shown that the proposed method just needs a few seconds for computation, compared to a hundred of seconds required by MCS.
Table 5.
Comparison of computation time of different methods.
As discussed in Section 1, conventional DPF uses constant values of inputs (e.g., loads, generations, etc.) to compute for a specific operating point of the system. Hence, uncertainties in the system are not considered. It gives a fixed value for each output variable (bus voltage, line flow, etc.) corresponding to specified input data. Different from DPF, PPF can provide a complete range of all possible values and statistical information for desired output variables that is very useful for assessing security of the system under uncertainty.
From the results obtained by the proposed PPF approach, probabilistic security assessment can be carried out to evaluate the probability of line overloading, over-/under-voltage, etc. In Figure 1, suppose that the upper limit of the real power flow of line 30–38 is 230 MW (the vertical line in Figure 1), the probability being greater than the limit is 1.27%. On the contrary, voltages at all buses in the system (for example, V16 in Figure 3) are within the range (operating range of voltage is [0.9, 1.1] p.u.) in this test.
Also, thanks to the employment of distributed slack bus model, the steady-state behavior of regulation of conventional generation is included in the proposed PPF model. For example, probability distribution of power output of generator at bus 80 (Pg80) is obtained as in Figure 4 and then the risk of over/under-regulation limits of the generator can be assessed. Assume that the upper regulation limit of generator at bus 80 is 480 MW (the vertical line in Figure 4), we can calculate the probability that Pg80 is higher than its upper limit is 1.75%. Similarly, we can assess security for any output variable of interest in the system.
6. Discussion
In this section, we discuss some main features and some aspects of applications of the proposed approach.
Firstly, the proposed PPF method can quickly obtain results, compared to the traditional MCS, thanks to the enhancement of data clustering technique. After using data clustering algorithm to partition the input dataset into distinct clusters, the process of MCS is run for a small number of cluster agents instead of implementing a large number of simulations for all samples. Secondly, it can give highly accurate results compared to results from the traditional MCS as well as MCS based on clustering techniques previously developed such as the most popular K-means algorithm. In particular, different from K-means that has a number of disadvantages such as the difficulty in predicting the number of clusters, strong impact of initial seeds on the final results, convergence to a local optimum, the PCA + DE method is simple to implement and provides globally optimal solution. Moreover, in the proposed clustering technique, PCA helps to reduce the size of the input data, so the following clustering technique, i.e., DE, can work more efficiently in the small resulting space. It avoids employment of complexity of mathematical theories and decrease of accuracy due to application of approximation techniques such as in analytical and approximate methods.
Toward applications, the proposed PPF methodology is comprehensive and realistic, so that it is applicable to real power systems, especially large-scale ones incorporating renewable energy sources because of the following reasons. First, as discussed above, the proposed clustering technique helps the PPF method developed to achieve fast and accurate results even for a large-scale power system. Second, keeping the advantage of MCS, different types of probability distributions of input random variables can be easily to be modeled and managed in the proposed PPF method. The information of renewable power production, load, and their uncertainties in a real system can be estimated based on historical data or for a considered look-ahead horizon they can be provided by forecast techniques. Nevertheless, they are beyond the scope of this paper. In the paper, they are assumed to be known. Lastly, by making use of distributed slack bus model, any power mismatch (either due to uncertainty or to losses in the system) can be assigned to a set of generating units participating in a real power allocation process, thus reflecting the actual operation in power system. It explicitly includes the steady-state behavior of the regulation in the system. The proposed PPF method allows to evaluate not only probability of line overloading and of over-/under-voltage as it is possible to do with existing methods, it also allows to assess the risk of violation of over-/under-regulation limits of conventional generators.
7. Conclusions
Probabilistic power flow can provide a complete range of all possible values of desired variables and other useful statistical information for power system security analysis under uncertainty. The goal of this paper is to develop a fast and accurate probabilistic power flow methodology based on MCS for large-scale power systems interconnected with renewable energy sources.
In order to achieve the goal, we propose a data clustering technique based on the combination of PCA and DE that is integrated into a MCS based PPF method. PCA can significantly reduce dimension of the input data, while DE is simple to implement and provides globally optimal solution in solving clustering problem. Hence, the data clustering PCA + DE proposed is an effective method for reducing computation time associated with MCS and makes it overcome the difficulty in practical application especially for a large power system. Also, in this study, distributed slack bus model is employed so that any power mismatch in the system can be charged to a set of dispatchable generators, so reflecting the actual power system operation. The probabilistic power flow results provide valuable information for power system analysis and security assessment to evaluate the probability of, such as, line overloading, over-/under-voltage as well as the risk of over/under-regulation limits of generators in power systems with integration of renewable energy sources.
The proposed method is tested on the modified IEEE-118 bus test system and the result is compared with the results obtained by the traditional MCS. Extensive testing indicates good performance of the proposed probabilistic power flow methodology. A comparison of the results indicates that the proposed approach retains a similar level of accuracy with a lower computational time than the traditional MCS.
The main attractive features of the proposed approach can be highlighted as follows: (1) it does not use complex mathematical theories; (2) it can give highly accurate results; (3) it is simple and easy to implement for practical large power systems; (4) it can very quickly provide results; (5) its result reflects the actual operation of the system thanks to making use of distributed slack bus model.
In this paper, we mostly focus on development of the technique for clustering as well as the proposed probabilistic power flow methodology and considering effect of only load and wind power uncertainty. In a real power system, there exist many stochastic factors following different types of probability distribution. In future work, we will further study stochastic behaviors and appropriate probabilistic models for their factors to be included in probabilistic power flow computation.
Author Contributions
Methodology, V.K.H., V.D.N., D.D.L. and N.T.A.N.; Writing—original draft, V.K.H. and D.D.L.; Writing—review and editing, V.K.H., V.D.N., D.D.L. and N.T.A.N.
Funding
This research is funded by Funds for Science and Technology Development of the University of Danang under grant number B2017-DN01-05.
Conflicts of Interest
The authors declare no conflict of interest.
References
- Borkowska, B. Probabilistic load flow. IEEE Trans. Power Appl. Syst. 1974, PAS-93, 752–759. [Google Scholar] [CrossRef]
- Allan, R.N.; Al-Shakarchi, M.R.G. Probabilistic techniques in A.C. load-flow analysis. Proc. Inst. Elect. Eng. 1977, 124, 154–160. [Google Scholar] [CrossRef]
- Zhang, P.; Lee, S.T. Probabilistic load flow computation using the method of combined cumulants and Gram-Charlier expansion. IEEE Trans. Power Syst. 2004, 19, 676–682. [Google Scholar] [CrossRef]
- Fan, M.; Vittal, V.; Heydt, G.T.; Ayyanar, R. Probabilistic Power Flow Studies for Transmission Systems with Photovoltaic Generation Using Cumulants. IEEE Trans. Power Syst. 2012, 27, 2251–2261. [Google Scholar] [CrossRef]
- Le, D.D.; Berizzi, A.; Bovo, C.; Ciapessoni, E.; Cirio, D.; Pitto, A.; Gross, G. A probabilistic approach to power system security assessment under uncertainty. In Proceedings of the Bulk Power System Dynamics and Control—IX Optimization, Security and Control of the Emerging Power Grid (2013 IREP Symposium), Crete, Greece, 25–30 August 2013. [Google Scholar]
- Zheng, J.; Wen, F.; Ledwich, G.; Huang, J. Risk control in transmission system expansion planning with wind generators. Int. Trans. Electr. Energy 2014, 24, 227–245. [Google Scholar] [CrossRef]
- Su, C.L. Probabilistic load-flow computation using point estimate method. IEEE Trans. Power Syst. 2005, 20, 1843–1851. [Google Scholar] [CrossRef]
- Mohammadi, M.; Shayegani, A.; Adaminejad, H. A new approach of point estimate method for probabilistic load flow. Int. J. Electr. Power 2013, 51, 54–60. [Google Scholar] [CrossRef]
- Aien, M.; Khajeh, M.G.; Rashidinejad, M.; Fotuhi-Firuzabad, M. Probabilistic power flow of correlated hybrid wind-photovoltaic power systems. IET Renew. Power Gen. 2014, 8, 649–658. [Google Scholar] [CrossRef]
- Hajian, M.; Rosehart, W.D.; Zareipour, H. Probabilistic power flow by Monte Carlo simulation with Latin Supercube sampling. IEEE Trans. Power Syst. 2013, 28, 1550–1559. [Google Scholar] [CrossRef]
- Ren, Z.; Yan, W.; Zhao, X.; Li, Y.; Yu, J. Probabilistic power flow for distribution networks with photovoltaic generators. In Proceedings of the Power and Energy Society General Meeting, Vancouver, BC, Canada, 21–25 July 2013. [Google Scholar]
- Carpinelli, G.; Caramia, P.; Varilone, P. Multi-linear Monte Carlo simulation method for probabilistic load flow of distribution systems with wind and photovoltaic generation systems. Renew. Energy 2015, 76, 283–295. [Google Scholar] [CrossRef]
- Yu, H.; Chung, C.Y.; Wong, K.P.; Lee, H.W.; Zhang, J.H. Probabilistic Load Flow Evaluation with Hybrid Latin Hypercube Sampling and Cholesky Decomposition. IEEE Trans. Power Syst. 2009, 24, 661–667. [Google Scholar] [CrossRef]
- Liu, Y.; Gao, S.; Cui, H.; Yu, L. Probabilistic load flow considering correlations of input variables following arbitrary distributions. Electr. Power Syst. Res. 2016, 140, 354–362. [Google Scholar] [CrossRef]
- Huang, J.; Xue, Y.; Dong, Z.Y.; Wong, K.P. An adaptive importance sampling method for probabilistic optimal power flow. In Proceedings of the 2011 IEEE Power and Energy Society General Meeting, Detroit, MI, USA, 24–29 July 2011; pp. 1–6. [Google Scholar]
- Rubinstein, R.Y.; Kroese, D.P. Simulation and the Monte Carlo Method, 2nd ed.; John Wiley & Sons, Inc.: Hoboken, NJ, USA, 2007. [Google Scholar]
- Tao, C.; Franchetti, F. A Quasi-Monte Carlo approach for radial distribution system probabilistic load flow. In Proceedings of the IEEE PES Innovative Smart Grid Technologies (ISGT), Washington, DC, USA, 24–27 February 2013; pp. 1–6. [Google Scholar]
- Xu, X.; Yan, Z. Probabilistic load flow evaluation with hybrid Latin Hypercube Sampling and multiple linear regression. In Proceedings of the Power & Energy Society General Meeting, Denver, CO, USA, 26–30 July 2015; pp. 1–12. [Google Scholar]
- Xie, Z.Q.; Ji, T.Y.; Li, M.S.; Wu, Q.H. Quasi-Monte Carlo Based Probabilistic Optimal Power Flow Considering the Correlation of Wind Speeds Using Copula Function. IEEE Trans. Power Syst. 2018, 33, 2239–2247. [Google Scholar] [CrossRef]
- Zou, B.; Xiao, Q. Solving Probabilistic Optimal Power Flow Problem Using Quasi Monte Carlo Method and Ninth-Order Polynomial Normal Transformation. IEEE Trans. Power Syst. 2014, 29, 300–306. [Google Scholar] [CrossRef]
- Singhee, A.; Rutenbar, R.A. Why quasi-Monte Carlo is better than Monte Carlo or Latin hypercube sampling for statistical circuit analysis. IEEE Trans. Comput. Des. Integr. Circuits Syst. 2010, 29, 1763–1776. [Google Scholar] [CrossRef]
- Leite da Silva, A.M.; Milhorance de Castro, A. Risk Assessment in Probabilistic Load Flow via Monte Carlo Simulation and Cross-Entropy Method. IEEE Trans. Power Syst. 2018. [Google Scholar] [CrossRef]
- Ramezani, M.; Singh, C.; Haghifam, M.R. Role of Clustering in the Probabilistic Evaluation of TTC in Power Systems Including Wind Power Generation. IEEE Trans. Power Syst. 2009, 24, 849–858. [Google Scholar] [CrossRef]
- Oshnoei, A.; Khezri, R.; Hagh, M.T.; Techato, K.; Muyeen, S.M.; Sadeghian, O. Direct Probabilistic Load Flow in Radial Distribution Systems Including Wind Farms: An Approach Based on Data Clustering. Energies 2018, 11, 310. [Google Scholar] [CrossRef]
- Jolliffe, I.T. Principal Component Analysis; Springer: New York, NY, USA, 2002. [Google Scholar]
- Jackson, J.E. A Users Guide to Principal Component Analysis; Wiley: Hoboken, NJ, USA, 1991. [Google Scholar]
- Le, D.D.; Gross, G.; Berizzi, A. Probabilistic modeling of multisite wind farm production for scenario-based applications. IEEE Trans. Sustain. Energy 2015, 6, 748–758. [Google Scholar] [CrossRef]
- Gan, G.; Ma, C.; Wu, J. Data Clustering: Theory, Algorithms, and Applications; SIAM: Philadelphia, PA, USA, 2007. [Google Scholar]
- Falkenauer, E. Genetic Algorithms and Grouping Problems; John Wiley & Sons, Inc.: New York, NY, USA, 1998. [Google Scholar]
- Bandyopadhyay, S.; Maulik, U. Genetic clustering for automatic evolution of clusters and application to image classification. Pattern Recognit. 2002, 35, 1197–1208. [Google Scholar] [CrossRef]
- Nguyen, N.T.A.; Le, D.D.; Moshi, G.G.; Bovo, C.; Berizzi, A. Sensitivity analysis on locations of Energy Storage in power systems with wind integration. IEEE Trans. Ind. Appl. 2016, 52, 5185–5193. [Google Scholar] [CrossRef]
- Xiao, X.; Dow, E.; Eberhart, R.; Ben Miled, Z.; Oppelt, R.J. Gene Clustering using Self-Organizing Maps and Particle Swarm Optimization. In Proceedings of the Second IEEE International Workshop on High Performance Computational Biology, Nice, France, 22 April 2003. [Google Scholar]
- Vander Merwe, D.W.; Engelbrecht, A.P. Data clustering using particle swarm optimization. In Proceedings of the 2003 Congress on Evolutionary Computation, Canberra, Australia, 8–12 December 2003; Volume 1, pp. 215–220. [Google Scholar]
- Kuo, R.; Zulvia, F. Automatic clustering using an improved particle swarm optimization. J. Ind. Intell. Inf. 2013, 1, 46–51. [Google Scholar] [CrossRef]
- Pratyay, K.; Gupta, S.K.; Jana, P.K. A novel evolutionary approach for load balanced clustering problem for wireless sensor networks. Swarm Evol. Comput. 2013, 12, 48–56. [Google Scholar]
- Das, S.; Suganthan, P.N. Differential evolution: A survey of the state-of-the-art. IEEE Trans. Evol. Comput. 2011, 15, 4–31. [Google Scholar] [CrossRef]
- Cai, Z.; Gong, W.; Ling, C.X.; Zhang, H. A clustering-based differential evolution for global optimization. Appl. Soft Comput. 2011, 11, 1363–1379. [Google Scholar] [CrossRef]
- Kuila, P.; Jana, P.K. A novel differential evolution based clustering algorithm for wireless sensor networks. Appl. Soft Comput. 2014, 25, 414–425. [Google Scholar] [CrossRef]
- Dimitrovski, A.; Tomsovic, K. Slack Bus Treatment in Load Flow Solutions with Uncertain Nodal Powers. In Proceedings of the 8th International Conference on Probabilistic Methods Applied to Power Systems, Iowa State University, Ames, IA, USA, 12–16 September 2004. [Google Scholar]
- Zobian, A.; Ilic, M.D. Unbundling of Transmission and Ancillary Services. I. Technical Issues. IEEE Trans. Power Syst. 1997, 12, 539–548. [Google Scholar] [CrossRef]
- Power System Test Case Archive. Available online: https://www2.ee.washington.edu/research/pstca/pf118/pg_tca118bus.htm (accessed on 6 June 2018).

© 2018 by the authors. Licensee MDPI, Basel, Switzerland. This article is an open access article distributed under the terms and conditions of the Creative Commons Attribution (CC BY) license (http://creativecommons.org/licenses/by/4.0/).