1. Introduction
Flow control devices are gaining ground in the wind energy field since they are used for solving existing problems of operational damage to wind turbines and challenging upcoming designs. Both passive flow control devices, such as microtabs, spoilers, and vortex generators, and active flow control devices, such as trailing-edge flaps and synthetic jets, are widely explained by Aramendia-Iradi et al. [
1].
Vortex generators (VGs) are passive flow control devices usually placed in pairs with an array configuration on the blade surface of interest, with the aim of modifying the airfoil pressure distribution and delaying the flow separation on it. These devices were first introduced by Taylor [
2] and they have been investigated deeply since then. An exhaustive review of different VG application for heat transfer augmentation can be found in the study by Chai and Tassou [
3]. The local boundary layer is modified by these vanes and an exchange of momentum is generated between the energized upper part of the boundary layer and the unenergized lower part, as highlighted in the study by Lin [
4]. This modification of the boundary layer is possible due to the incidence angle marked by the vane with the flow. Therefore, vortex generators are dimensioned with respect to the local boundary layer thickness. As a result, a friction increment is produced making the boundary layer become turbulent and less prone to separation. Generally, vortex generators can be set as a counter-rotating array or co-rotating array. The study by Godard and Stanislas [
5] provided experimental data of the skin friction increment
downstream of the array, demonstrating that the counter-rotating array appeared more effective with a ratio of two in skin friction increase compared with the co-rotating actuators.
Nowadays, most of onshore wind turbines are already installed. Owners of these machines are more worried about increasing the levelized cost of energy (LCOE) and the lifetime of the installed wind turbine than replacing them. With this purpose, vortex generators could be installed on the blade zones in which a flow separation region exists, since this region can be reduced, thus improving the fatigue lifetime of the blade due to a reduction of load fluctuations provoked by the unsteady effects of the stall region. Vortex generators are easily installed and they can be used as an add-on for wind turbines that do not perform as expected, for instance due to blade surface imperfections in the manufacturing process. In fact, some studies such as Øye [
6] showed that at normal operating conditions, the power production of an onshore 1MW wind turbine can be increased by 15–25% due to vortex generators implementation. The experiment on a 2.5 MW wind turbine made by Sullivan [
7] for testing the effects of VGs on the power conversion performance presented an increase of 11% in the annual energy production (AEP).
On the other hand, the increase of the offshore market is making wind turbine rotors larger because a lower number of wind turbines is desired for the same total power capacity as onshore wind farms. The offshore wind turbine of the INNWIND (Innovative Wind Conversion Systems for offshore applications) European project is defined as a reference with a rated power around 10 MW, with a blade length of 87 m. The DTU 10MW wind turbine model, used in the INNWIND project, was taken as a reference for CFD (Computational Fluid Dynamics) computations by Troldborg et al. [
8] with the aim of investigating the radial dependency of a vortex generator array implementation. The stalled zone at the blade root was noted to be avoided for a suitable function of the array, moving the vortex generators upwards to 20% of the section chord length. A reduction of lift enhancement for high angles of attack (AOA) was observed. Fernandez et al. [
9] made an important contribution throughout a Blade Element Momentum (BEM) computation of the produced power increment using vortex generators, along with microtabs in the reference NREL 5MW wind turbine. The best case showed increments on the average power output of 10.4% and 3.5% for two different wind speed realizations.
Another danger to wind turbine lifetime is the increment in blade roughness due to factors such as erosion, and insect impacts which drives to a power output decrease. In the work carried out by Skrzypiński et al. [
10], BEM computations of the DTU 10MW wind turbine were done to research a good radial configuration of the VG array for mitigating blade roughness effects. Successful results were obtained with the use of vortex generators according to the output power recovery for different roughness levels. Furthermore, the correct array position depends on the blade condition for avoiding possible AEP losses.
The design of a vortex generator is a hard task because of the variety of design parameters to take into account, such as the device height, length, and shape. The distances between the VGs and the location of them on the blade chord-wise direction are important factors as well. Therefore, computations based on Computational Fluid Dynamics (CFD) method are a less costively way to design them.
In the work of Martinez-Filgueira et al. [
11], the device height influencing the primary vortex behavior was analyzed using five device heights of a rectangular vortex generator from a relationship h/
of 1 to 0.2 with a ratio of 0.2. The aspect ratio (AR) defined by the relationship between the height and device length (H/L) was kept constant. It was concluded throughout CFD computations on a negligible adverse pressure gradient flat plate that the lower the device height is, the lower vortex strength level is reached, but the lower the drag penalty appears. Therefore, an influence of the VG height on the vortex formation is demonstrated. Recently, Fernandez-Gamiz et al. [
12] provided a flat plate CFD parametric study of the VG height maintaining the device length constant so the AR was not constant. Similar conclusions were drawn compared with [
11] since the highest device was noted to be the most appropriate in terms of delaying flow separation. The streamwise vortices in a concave surface were also investigated by Méndez et al. [
13] by means of direct numerical simulations (DNS).
The importance of the angle marked by a Rectangular VG and the flow direction was studied by Urkiola [
14] using Reynolds Averaged Navier-Stokes (RANS)-based computations with a negligible adverse pressure gradient flat plate. The primary vortex size increased with the device angle in a nonlinear way. The result also agreed with the results obtained by Yao et al. [
15] and Fernandez-Gamiz et al. [
16]. The work of Mendez and Gutierrez-Amo [
17] provided a CFD study of two non-conventional VGs geometries based on a constant airfoil cross-section on a flat plate compared with a Rectangular VG. A reduction of the local drag penalty using VGs with a cross-section based on airfoils was shown on a negligible pressure gradient flat plate.
The present work is focused on the influence of the VG shape after validating CFD computations of conventional shapes (Rectangular VG and Triangular VG) against experimental data from [
18]. Once the additional drag added by the VG to the blade cross-section is desired to be reduced, the shape of the vortex generator is considered an important design factor, but has an influence in the vortex behavior too. Heyes et al. [
19] showed a comparison between six VG geometries for an aeronautical application, four of them based on conventional geometries (Rectangular and Triangular VGs) and the rest are based on cross-sectional airfoil shapes (NACA0012 airfoil) which are not far from conventional ones according to the results obtained. A promising VG design based on CLARK-Y airfoil cross-sectional shape was studied by Hansen et al. [
20] with a variation of the device length (L) with its height (H) for optimizing the aerodynamic efficiency (Cl/Cd) of the blade cross-section up to 4% compared with the use of conventional geometries.
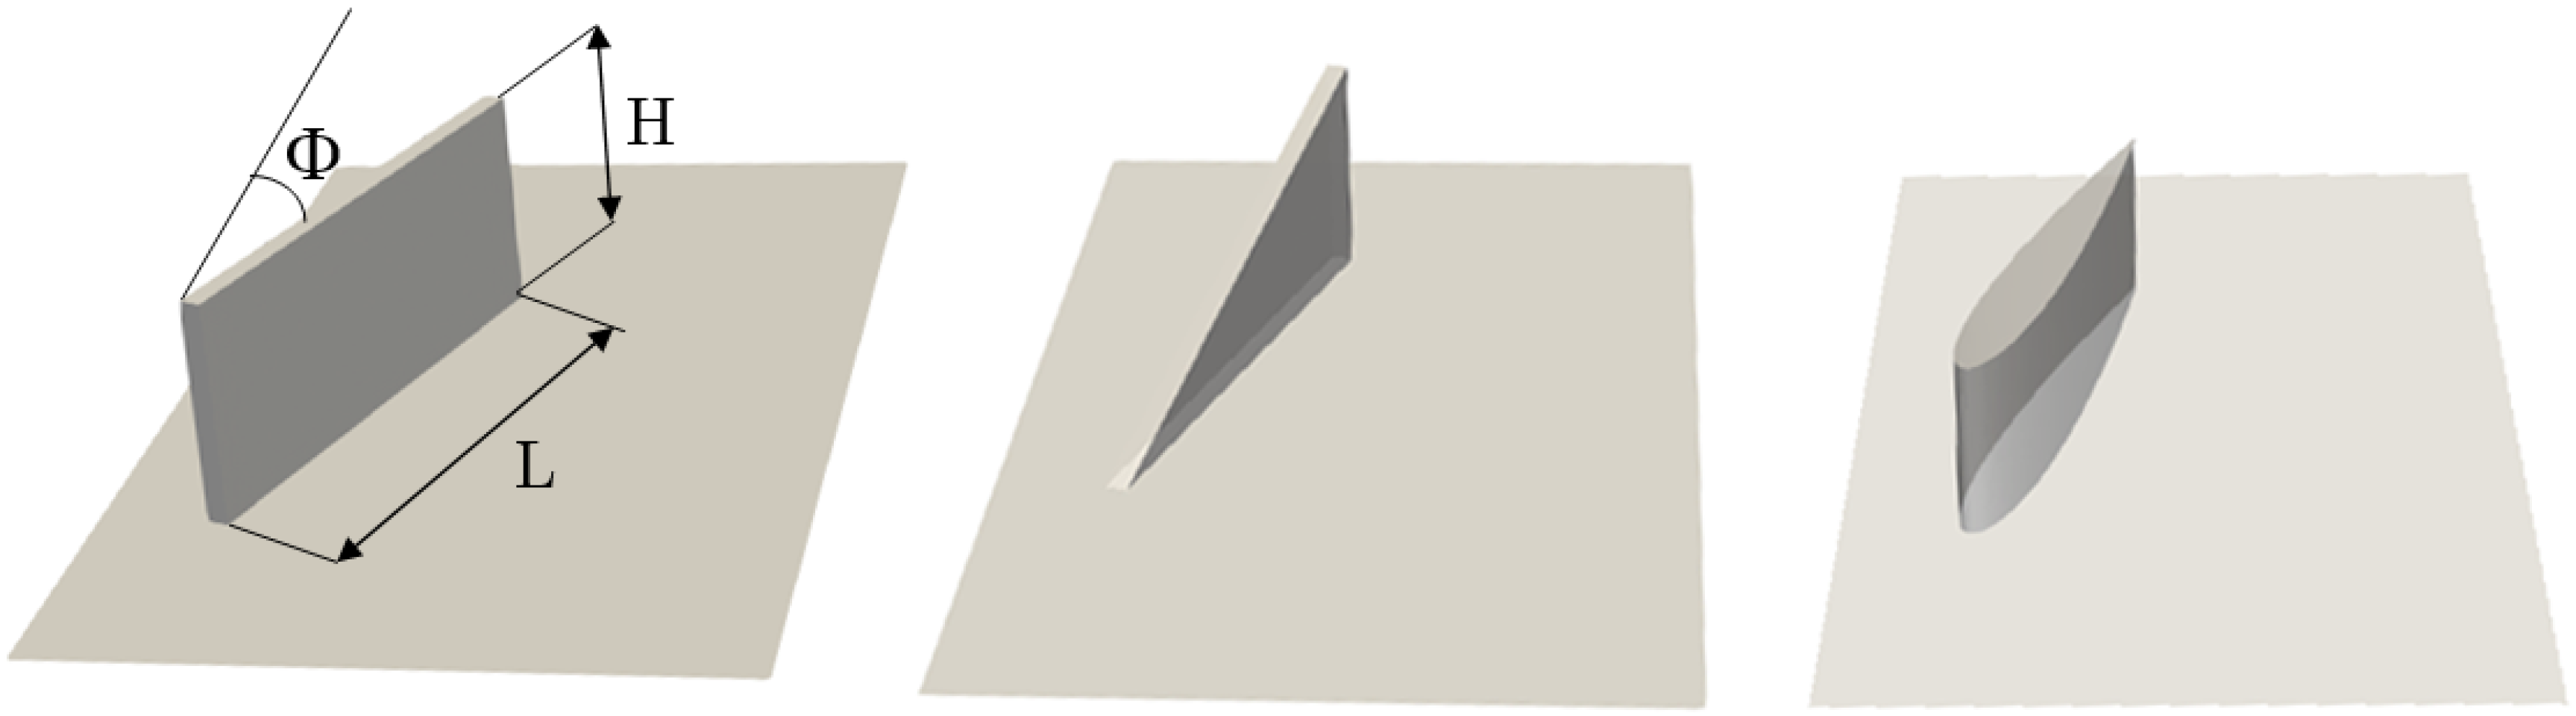
Three different shapes sketched in
Figure 1—Rectangular VG, Triangular VG, and Symmetrical VG NACA0012—have been computed in the current study using the open-source CFD code OpenFOAM v 2.4.0 for the same height (H = 5 mm), length (L = 12.5 mm) and inflow angle (
= 18°). RANS-based computations have been carried out for a negligible adverse pressure gradient flat plate. The primary vortex produced under the VG shape influence has been characterized in the current work. Consequently, a single VG has been computed under a symmetrical flow assumption for a
based on the local boundary layer (BL) momentum thickness
= 2.4 mm.
2. Baseline Experimental Data
The Symmetrical NACA0012 VG is not as experimentally investigated as the conventional geometries. Hence, a computational code validation has been done using experimental data based on a Rectangular VG geometry to gain a suitable precision with the domain dimension and meshing strategy for the rest of the VG geometries.
The experimental data of this study comes from the European project AVATAR (Advanced Aerodynamic Tools of Large Rotors). Inside of this project, the experiment of vortex generators on a flat plate section has been chosen (task 3.1 [
18]), in particular the Rectangular VG case with a negligible pressure gradient. Thus, numerical results are compared with the experiments carried out in Task 3.1 [
18], and Task 3.2 [
21] to validate the numerical model.
The experiments carried out in the Boundary Layer Wind Tunnel of the TU Delft has been used for this study. The tunnel can attain a maximum speed of 38 m/s in the wide-walled test section of 1.5 × 0.25 m
2. The large separation of the side walls (1.5 m) minimizes end effects on the flow region of interest along the centerline zone. An adjustable back wall allows adjustment of the pressure gradient, ensuring a truly null pressure gradient when desired. Turbulence level at maximum free-stream velocity was determined as 0.5%. Vortex generator dimensions were designed according to the previous research made by Baldacchino et al. [
22], where the rectangular vortex generators were designed according to the study by Godard et al. [
5] and are summarized in
Table 1.
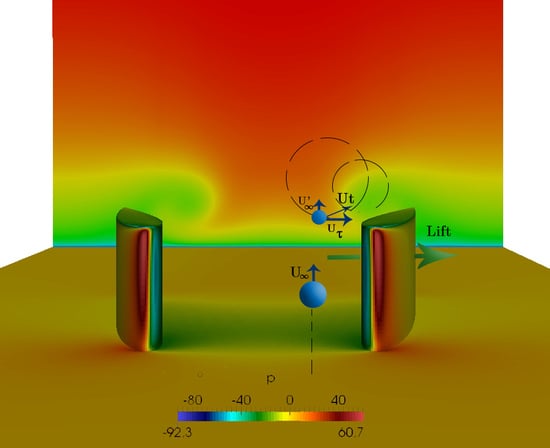
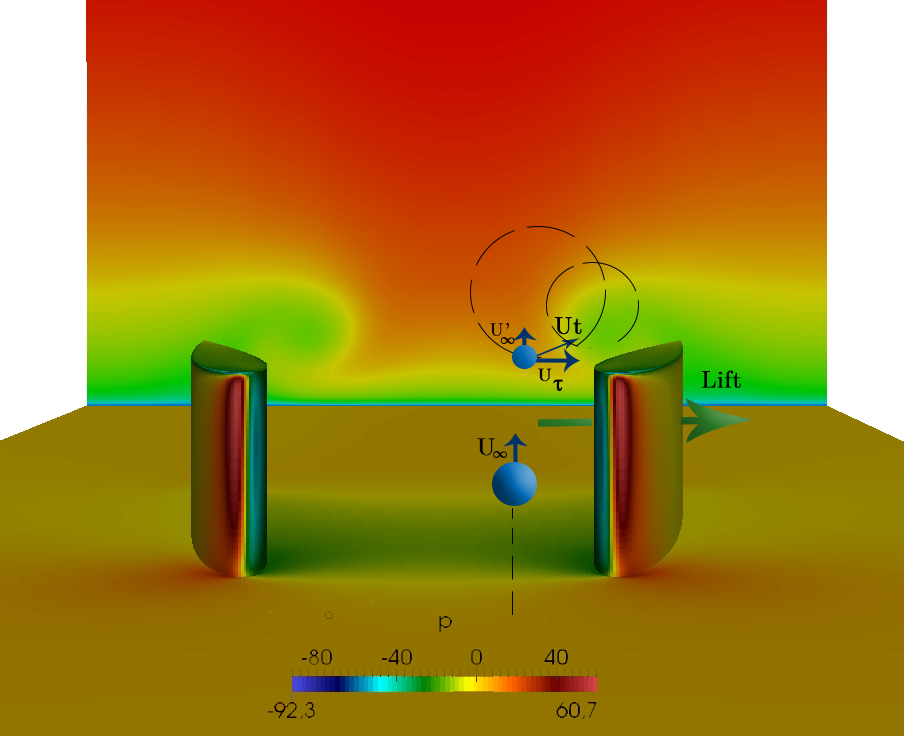
A counter-rotating array was set for producing down-flow embedded vortices, as sketched in
Figure 2. This array was formed of 25 pairs of Rectangular VGs for a spanwise distance of 0.75 m and it was centered in the wind tunnel centerline. Therefore, end effects from the array were minimized.
Some characteristics of the flow set at the experiment are of interest in terms of reproducing them via CFD as closely as possible. The test was carried out for a free-stream velocity
m/s which produced a
= 2600 based on local BL momentum thickness
mm. Both
and
have been calculated by the following equations:
where
is the streamwise velocity component,
the free-stream velocity,
the air density with a value of 1.225 kg/m
3,
the air dynamic viscosity with a value of
and
y the vertical coordinate normal to the wall.
Once the computation was set, the following parameters are used for validating the computational results:
Streamwise velocity profiles at different locations for the Rectangular VG (AVATAR Task 3.1 [
18])
Streamwise velocity profiles at different locations for the Triangular VG (AVATAR Task 3.2 [
21])
Velocity fields at streamwise planes 10H, 25H and 50H (AVATAR Task 3.1 [
18])
After gaining the correct accuracy in experimental data reproduction, the primary vortex generated was characterized by the following proposed parameters:
Primary vortex vertical and lateral positions to define the vortex trajectory.
Peak vorticity development.
Half-life Surface .
Mean positive Circulation .
Streamwise Wall Shear stress (WSSX) .
Readers should note that the parameters and have arisen for the first time due to the present work, and they are considered to characterize the primary vortex in a better way. They will be explained later.
3. Computational Set-Up
Three geometries are investigated in the current study and all of them have a vane height H of 5 mm and a length L of 12.5 mm. The AR is defined as the relationship between the height and the VG length (H/L), so the AR is 2.5 for the analyzed VGs. The geometries are geometrically distinguished by their cross-sectional shape and variation in the normal direction to the flat plate.
Meshing and computational time are desired to be reduced to optimize the available computational resources. Hence, the wake has been analyzed and a wake symmetry assumption behind the VGs is assumed in the current simulations. Thus, the computational domain includes only one vane inclined to the oncoming flow instead of a VG pair. In that way, meshing and computational time can be considerably reduced.
Figure 2 illustrates in dashed lines the spanwise regions of the domain consisting of only one vane. The symmetry assumption used in the present computations can be justified by the previous studies of Sorensen et al. [
23] and Velte et al. [
24].
The computational domain dimensions normalized by the vane height H are shown in
Figure 3.
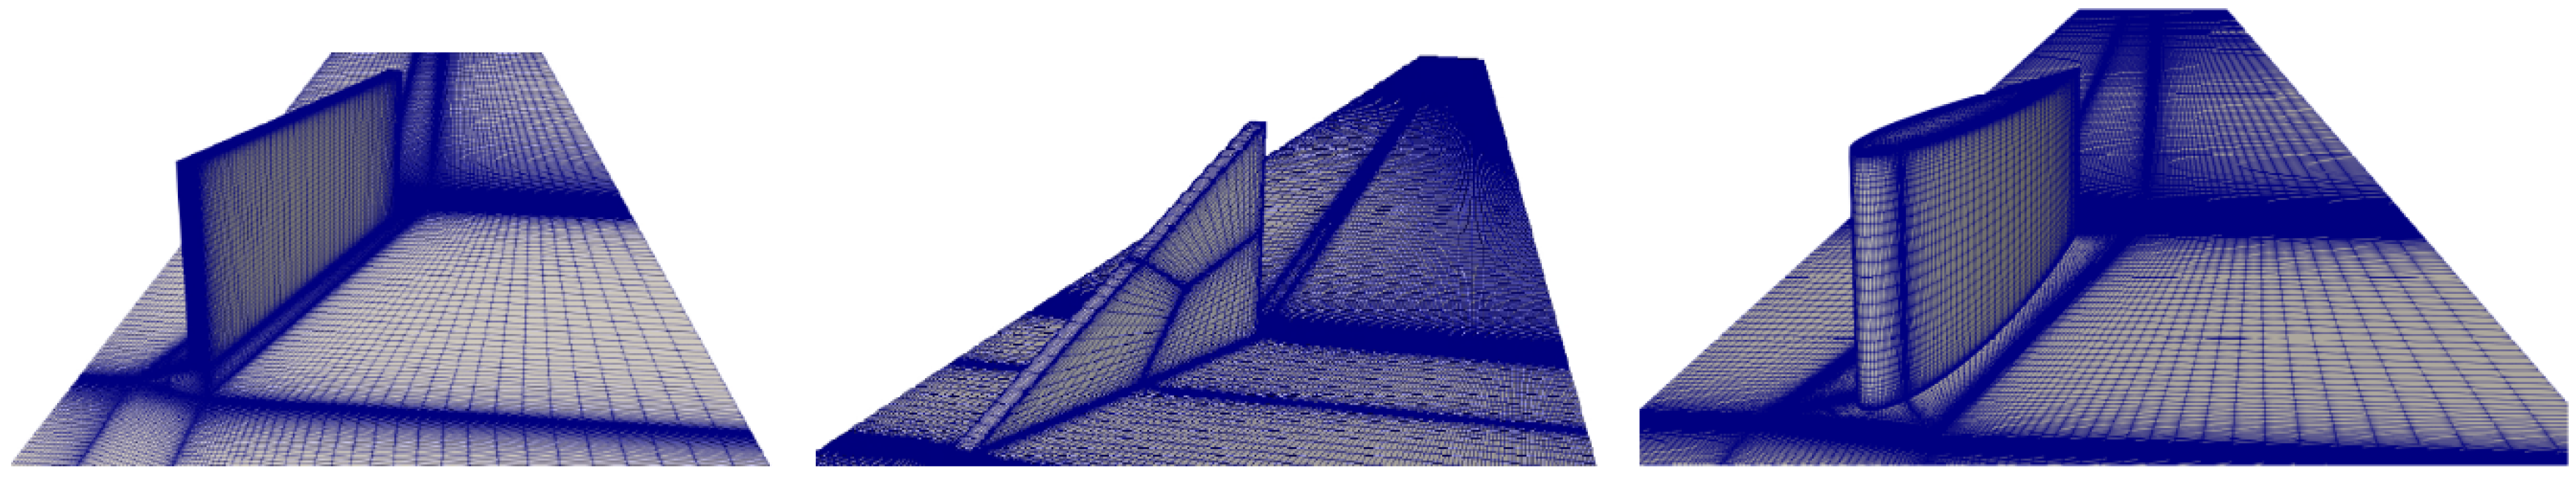
To establish a coherence between cases as much as possible, the computational domain has been designed for being distinguished by a VG box defined by the VG surrounded blocks, as illustrated for each case in
Figure 4. The Triangular VG case makes the domain slightly different because of its shape; two blocks of the VG box reach the domain far field. For the rectangular shape, a similar block strategy as Urkiola et al. [
14] has been followed. From this VG box, meshing blocks are extruded until conforming to the computational domain dimensions. A specific region has been created downstream from the VG with a length of 5 times the device height (25 mm). This region is considered the near wake in which the vortex begins to be spread, so is used with refinement purpose with 120 nodes in the streamwise direction. A total number of 6 blocks are located downstream of the vane, reaching a distance from the VG trailing edge of 50 times the device height (250 mm) based on AVATAR experiments [
18].
3.1. Physic Models and Solver Set-Up
For the current work, the open-source code OpenFOAM (version 2.4.0) [
25] has been used for simulating the three different geometries of vortex generators on a flat plate with negligible pressure gradient. This CFD code is an object-oriented library written in C++ to solve computational continuum mechanics problems, as the code used by the ForWind research group [
26].
In the present study, a fully turbulent modelling is used in all computations using the k-
SST (Shear Stress Transport) turbulence model developed by Menter [
27]. This turbulence model comes from the joining of two models: Wilcox’s k-
model for the near wall region, and k-
for the outer region in free shear flows. The chosen turbulence model is considered suitable for boundary layer modelling. An initial solution for the flow fields was first generated with the potentialFoam solver which assumes an incompressible, steady and irrotational flow. This initialization is considered suitable for speeding up the computation convergence reached by more advanced solvers such as the one used in this research, namely simpleFoam. The simpleFoam solver is used for steady-state, incompressible and turbulent flows using the RANS equations. Second-order discretization schemes were employed in CFD simulations. The convergence criteria were set for a residual control of
.
Boundary conditions have been set at the domain limits and wall surfaces as the vane and the flat plate. The roof of the domain and the two lateral surfaces were set as slip surfaces taking into account the symmetrical hypothesis. The domain roof is considered far enough from the flat plate for setting this condition as well. Non-slip conditions are set for the vane and flat plate surfaces. In addition, there is a requirement for setting boundary conditions for the turbulent viscosity
, kinematic energy
k and dissipation rate
w, since the turbulence has been modelled by the k-
SST model of Menter [
27]. Consequently, it implies that close to the plate and device surfaces, wall functions are used for the computations. Incompressible flow is assumed in all the computations.
3.2. Mesh
The Rectangular VG case is assumed to be a baseline case because the computational code validation against the experimental data is done using it. Then, the mesh strategy for the Triangular VG and the Symmetrical VG NACA0012 is based as much as possible on the Rectangular VG case (see
Figure 5).
For each mesh, a total number of 8 million cells is set. This number of cells is influenced by the turbulence model requirements, in which a value of the dimensionless distance of the first wall layer is required to be lower than y+ < 1, driving to a cell clustering close to the wall for solving properly the boundary layer. This requirement is the reason a first cell height equal to Δy/H = 3.23
. The first cell size is quite small compared to the device height and that is the reason in
Figure 5 the edges with boundary layer interactions are refined. For ensuring a correct computation of the downstream vorticial structures, 2.4 million cells are located behind the vane and 1.7 million cells are around the vane.
The quality of the mesh has been measured using five main indicators; see
Table 2. This set of parameters is a mix of industry standards, solver manuals, and academia standards. Equiangular skewness is an indicator of how optimal the cell shape is related to the corner angles. For hexahedral cells, skewness should not exceed 0.85 to obtain a fairly accurate solution. The cell aspect ratio of a cell is typically the ratio between the width and height. For critical flow areas, except those close to the wall, the cell aspect ratio should not exceed an average of 10. All the quality meshing parameters of the three different VG shapes are in the range of the indicators.
Apart from the engineering point of view, the number of cells is justified via a quantitative mesh dependency study of the Rectangular VG baseline case. This study is based on the Richardson Extrapolation method [
28]. The ratio between cell sizes of the study meshes is 2, the fine mesh being the one with 8 million cells. The dependency variable chosen for the study is the normalized peak vorticity
/(
/H) at a normal plane to the streamwise direction for a position 10H from the trailing-edge line of the vane.
As shown in
Table 3, a monotonic convergence is achieved for several of the 8 million cells. The boundary layer is the main flow feature that is modified by the vane, so its shape is considered crucial. Then, a qualitative mesh dependency study of the boundary layer shape has been made for a position 10H from the trailing-edge line of the vane (see
Figure 6a). A convergence in the BL shape as the boundary layer thickness approaches to the value
mm when the number of cells is increased can be observed.
Apart from reaching a numerical convergence with 8 million cells, as shown in
Table 3, the most approached boundary layer shape is achieved for this mesh size in
Figure 6b compared with the experimental curve.
Computations were performed on a personal server-clustered parallel machine with Intel® Core i7-6700 CPU 3.40 GHz × 8 cores and 32 GB RAM on 64-bit Linux. The domain was divided into eight sub-domains with the scotch method for a parallel computation and for reducing the simulation time. The computational cost was 12 days per each computation.
4. Results
CFD simulations have been used for modelling the aerodynamic behavior of three different geometries of vortex generators explained previously. All of them have a height of 5 mm and an incident angle to the oncoming flow of . After reaching a certain convergence, the results have been compared with the available experimental analyzed parameters of the conventional geometries, Rectangular VG and Triangular VG. As a final step, other parameters have been studied with numerical results to characterize the generated primary vortex in a deeper way, so that the innovative VG shape can be compared.
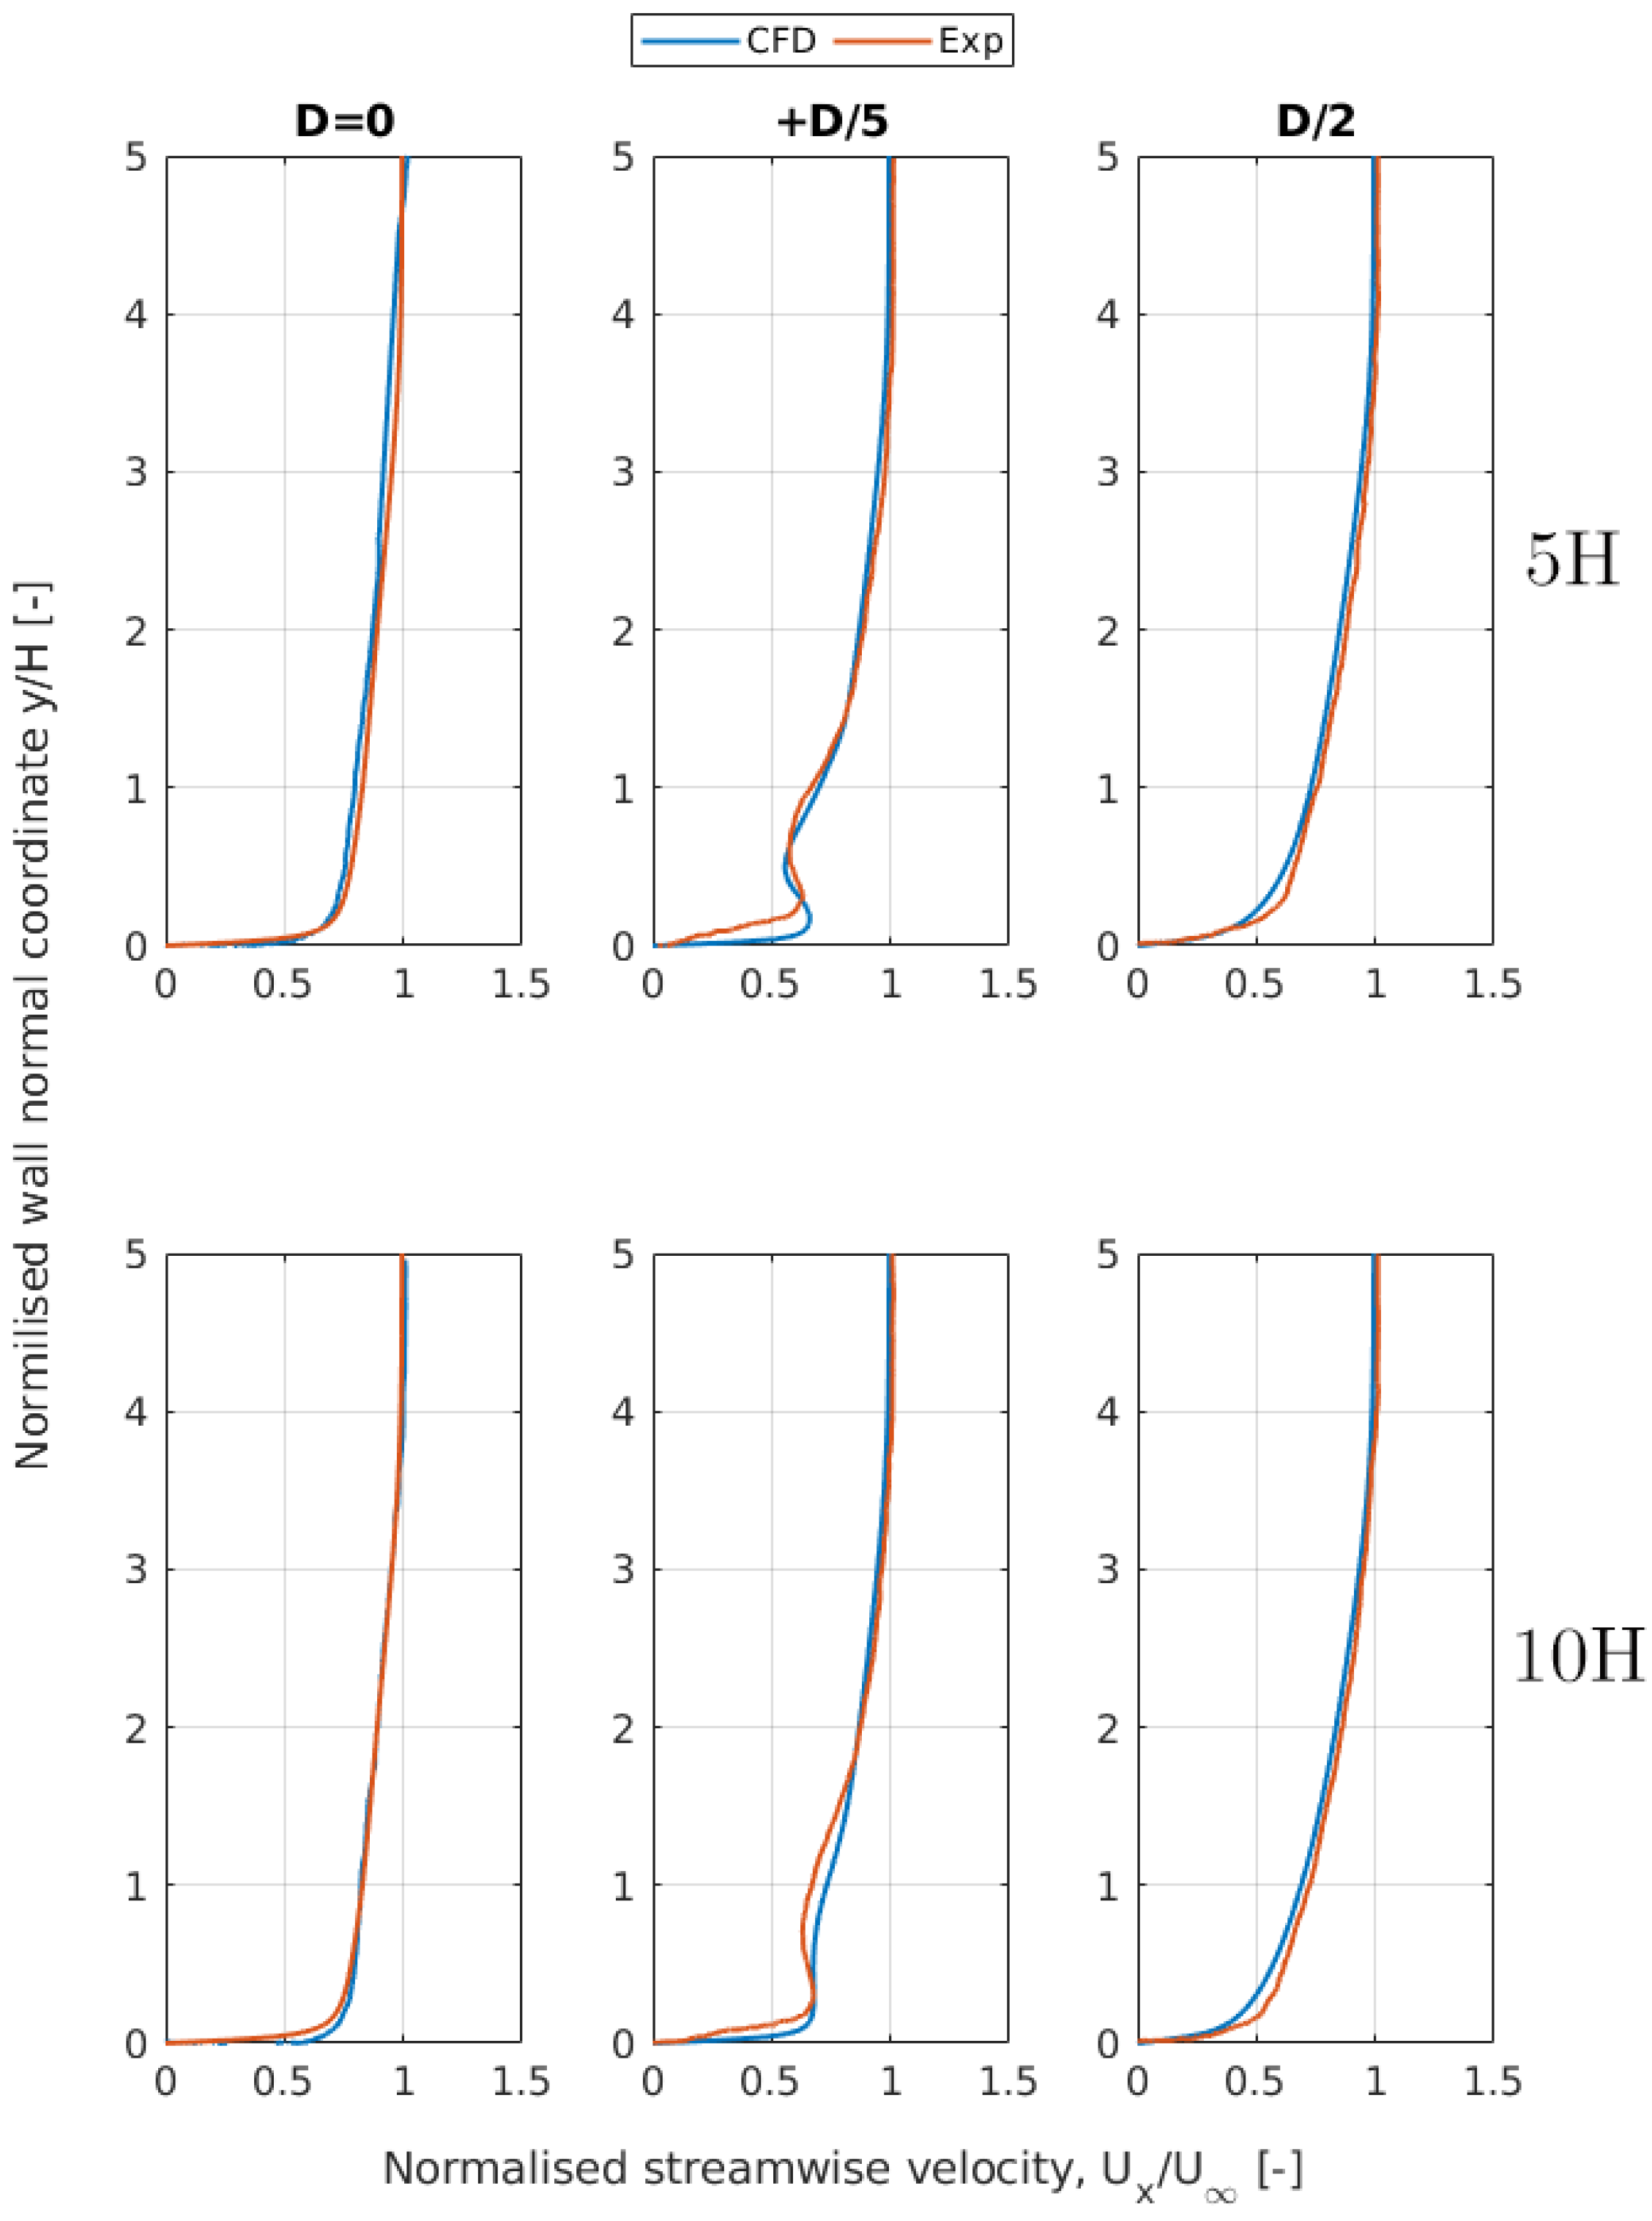
The boundary layer is modified by the vortex generator vane, so it must be well modelled in numerical simulations. Experimental measurements of normalized streamwise velocity profiles
/
are provided by [
18] (orange lines in
Figure 7) for different spanwise and streamwise locations. For the Rectangular VG computation, velocity sampling is shown in blue lines in
Figure 7 using lines normal to the flat plate with 3000 sampling points geometrically interpolated with the mesh, so a clustering of them is obtained near the wall. The numerical results show a good agreement with the experimental curves of the baseline case from [
18] and [
21]. This correlation is slightly lost in spanwise locations near the domain lateral sides (z = D/3 and z = D/2) because of the boundary condition influence and cell size at that zone.
Figure 8 represents a comparison carried out between the experimental velocity profile results from [
21] (orange line in
Figure 8) and the numerical ones for the Triangular VG case of this study (blue line in
Figure 8). The same methodology for extracting the velocity profiles is used. The precision is quite similar than the one obtained in the Rectangular VG case with some differences in the spanwise location z = +D/5 in which the boundary layer is highly influenced by the vane and both curves differ by up to 1.5 times the vane height H when the discrepancy is reduced.
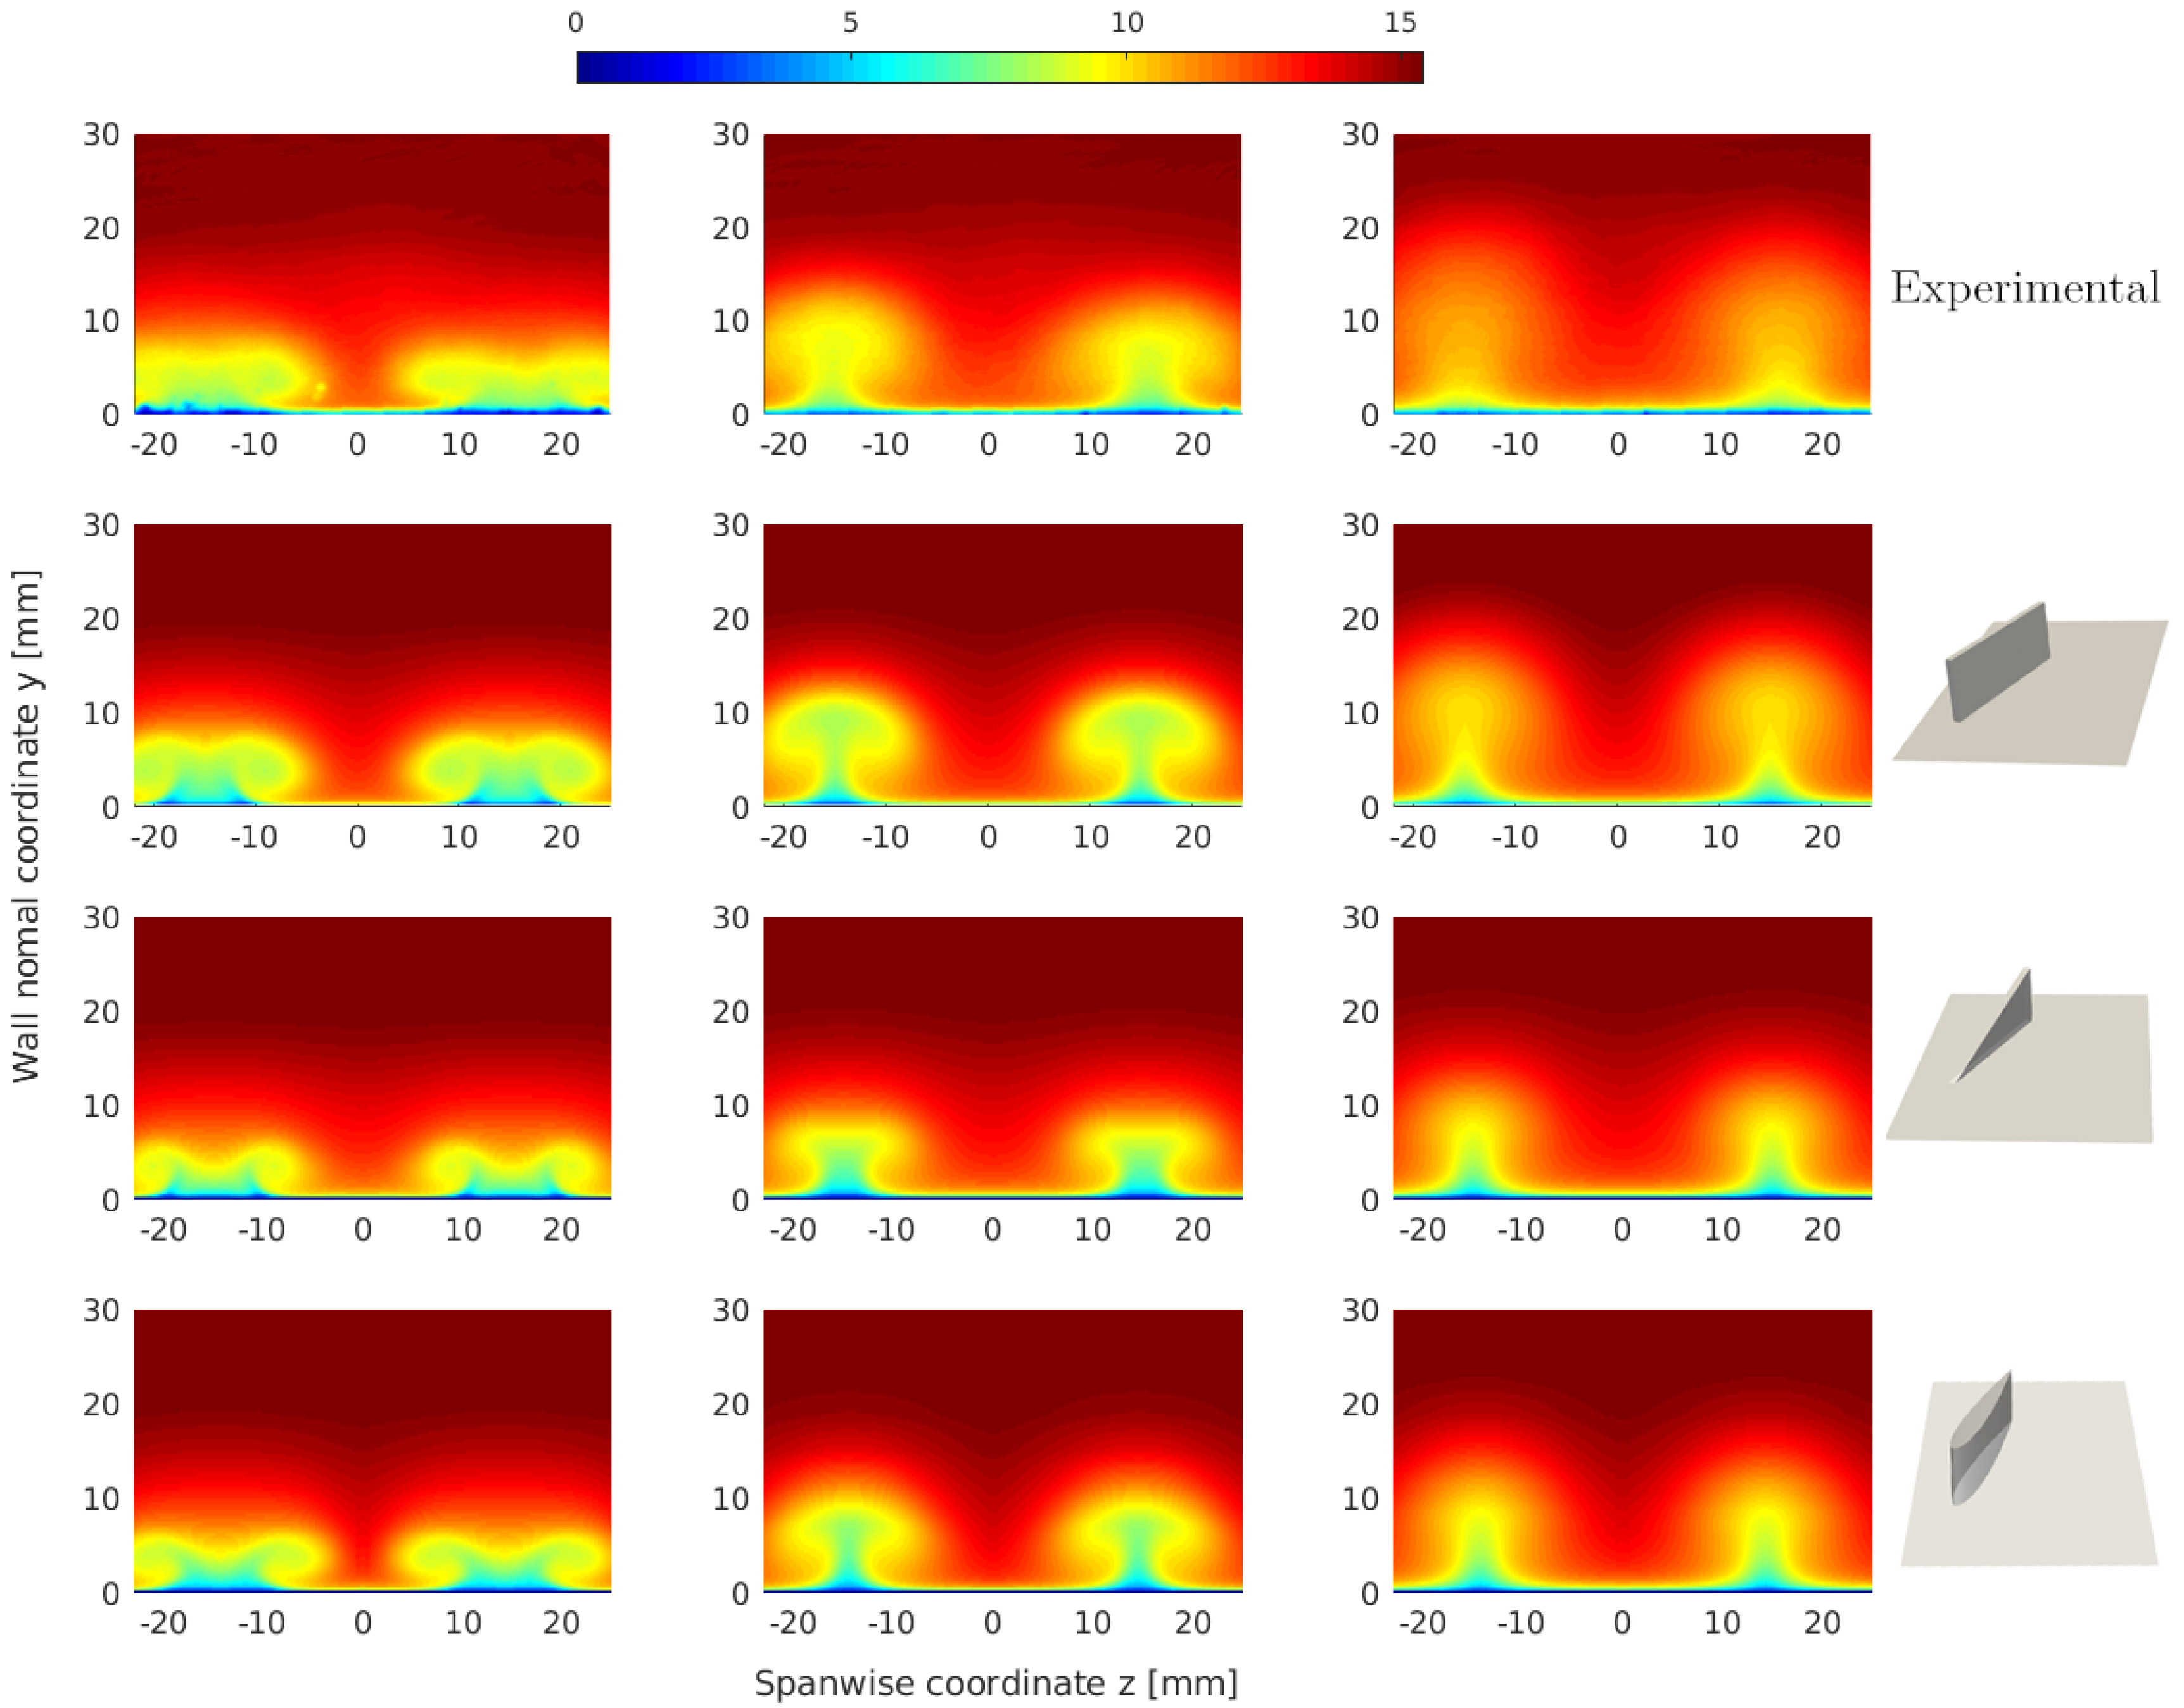
A qualitative comparison of the out-of-plane streamwise velocity fields
in normal planes to the stream direction for different streamwise locations 10H, 25H and 50H is shown in
Figure 9. For the correct comparison with the available AVATAR project results, a mirror effect has been applied in the computed velocity fields for representing the corresponding number of vortices shown in the experimental results. For all studied VGs, a deficit in velocity in zones near the vortex core is observed as a normal behavior. The vortex size is increased downstream of the vane in the same way as it was found for a sub-boundary layer VG (SBVG) in Yao et al. [
15]. For a spanwise location of z = 0 mm (symmetrical axis of the VG pair), the boundary layer is thinned. However, for z = 10 mm the low-momentum fluid is swept upward by the vortex, thickening the BL and making it less prone to separation, as highlighted by Yao et al. [
15]. This fact is in agreement with
Figure 7 and
Figure 8 and with the results of integral boundary layer parameters obtained by Baldacchino et al. [
22], in which a high displacement thickness
is obtained near the vortex core.
The Symmetrical VG NACA 0012 (bottom planes of
Figure 9) shows similar velocity fields compared with the Triangular VG ones because Rectangular VG vortices seem to be fully developed and more elevated from the wall.
4.1. Vortex Trajectory
Vortex generators have been researched from Taylor [
2] onwards. Some studies, such as Ashill et al. [
29], Yao et al. [
15] and Westphal et al. [
30], have proposed engineering techniques for analyzing the vortex performance such as the vortex core location, vortex decay and vortex strength. In those studies, an idea was given about the interaction of the vortex with the boundary layer profile by the vortex core location. Then, it can be seen which part of the boundary layer, the inner or the outer, is more influenced by the vortex and if the vortex development is affected by the wall when the vortex is located near the wall with a low vertical trajectory. It is important to note that in the experiments presented in AVATAR [
18], geometries of sub-boundary layer vortex generators (SBVGS) on a flat plate are used, and, consequently, the vortex generator height H is under the boundary layer thickness
. Therefore, the vortex core trajectory is useful to know if the vortex is out of the BL.
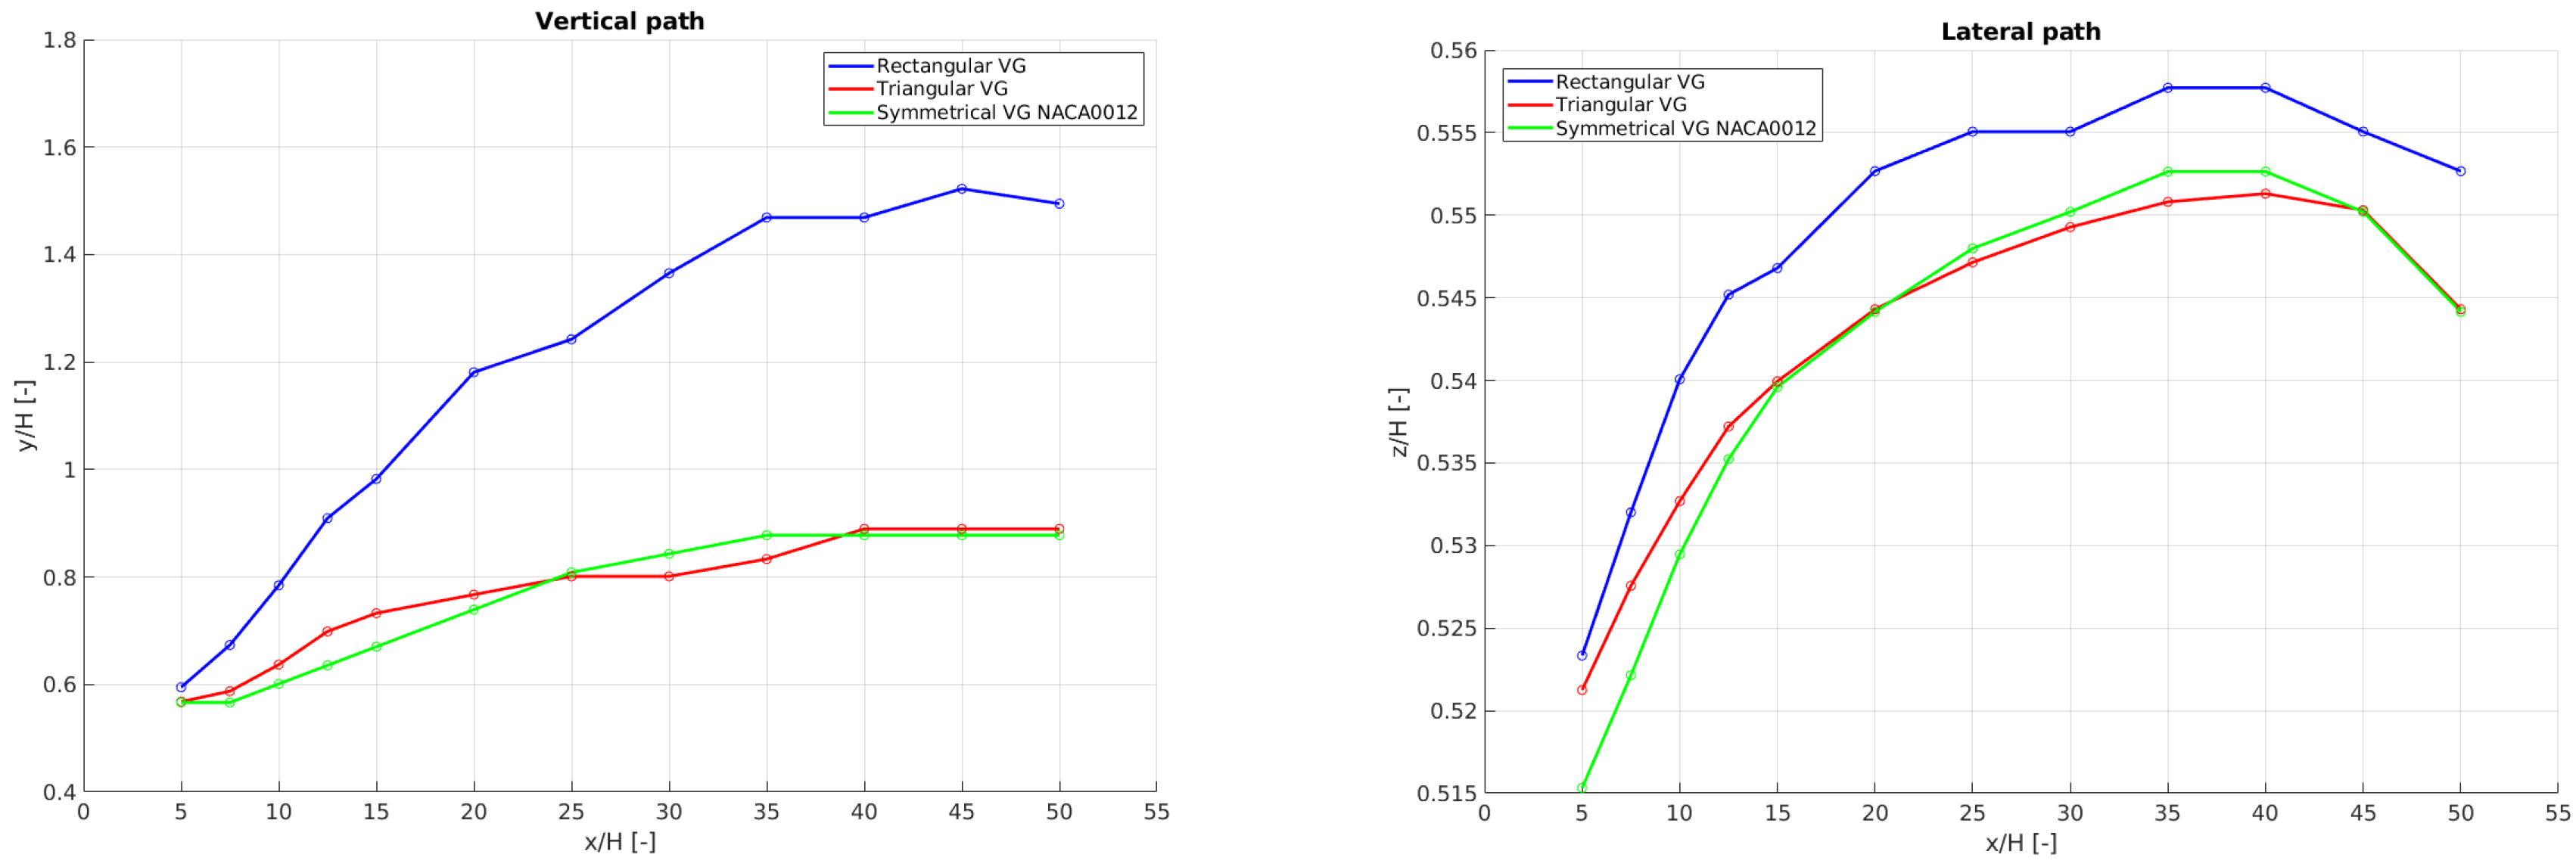
The vertical path and lateral path of the primary vortex core downstream the vane is presented in
Figure 10. This vortex core is extracted in each streamwise normal plane as the point with the value of maximum vorticity
as performed in [
15]. The vertical and lateral tendencies follow a similar pattern as found in other comparable studies such as Fernandez-Gamiz et al. [
31], Martinez-Filgueira et al. [
11]. The vortex core of the Rectangular VG has the largest deviation in both paths while the vortex core of the Triangular VG and the Symmetrical VG NACA0012 are at the same vane size. These deviations can also be observed in the previous velocity fields of
Figure 9. For all studied VGs, the vortex core is below the boundary layer thickness (
4H). According to Ashill et al. [
29] this fact is desirable in view of the need to transport high-energy air to the flow deep within the boundary layer, instead of having the vortex core in the outside BL part.
4.2. Vortex Decay
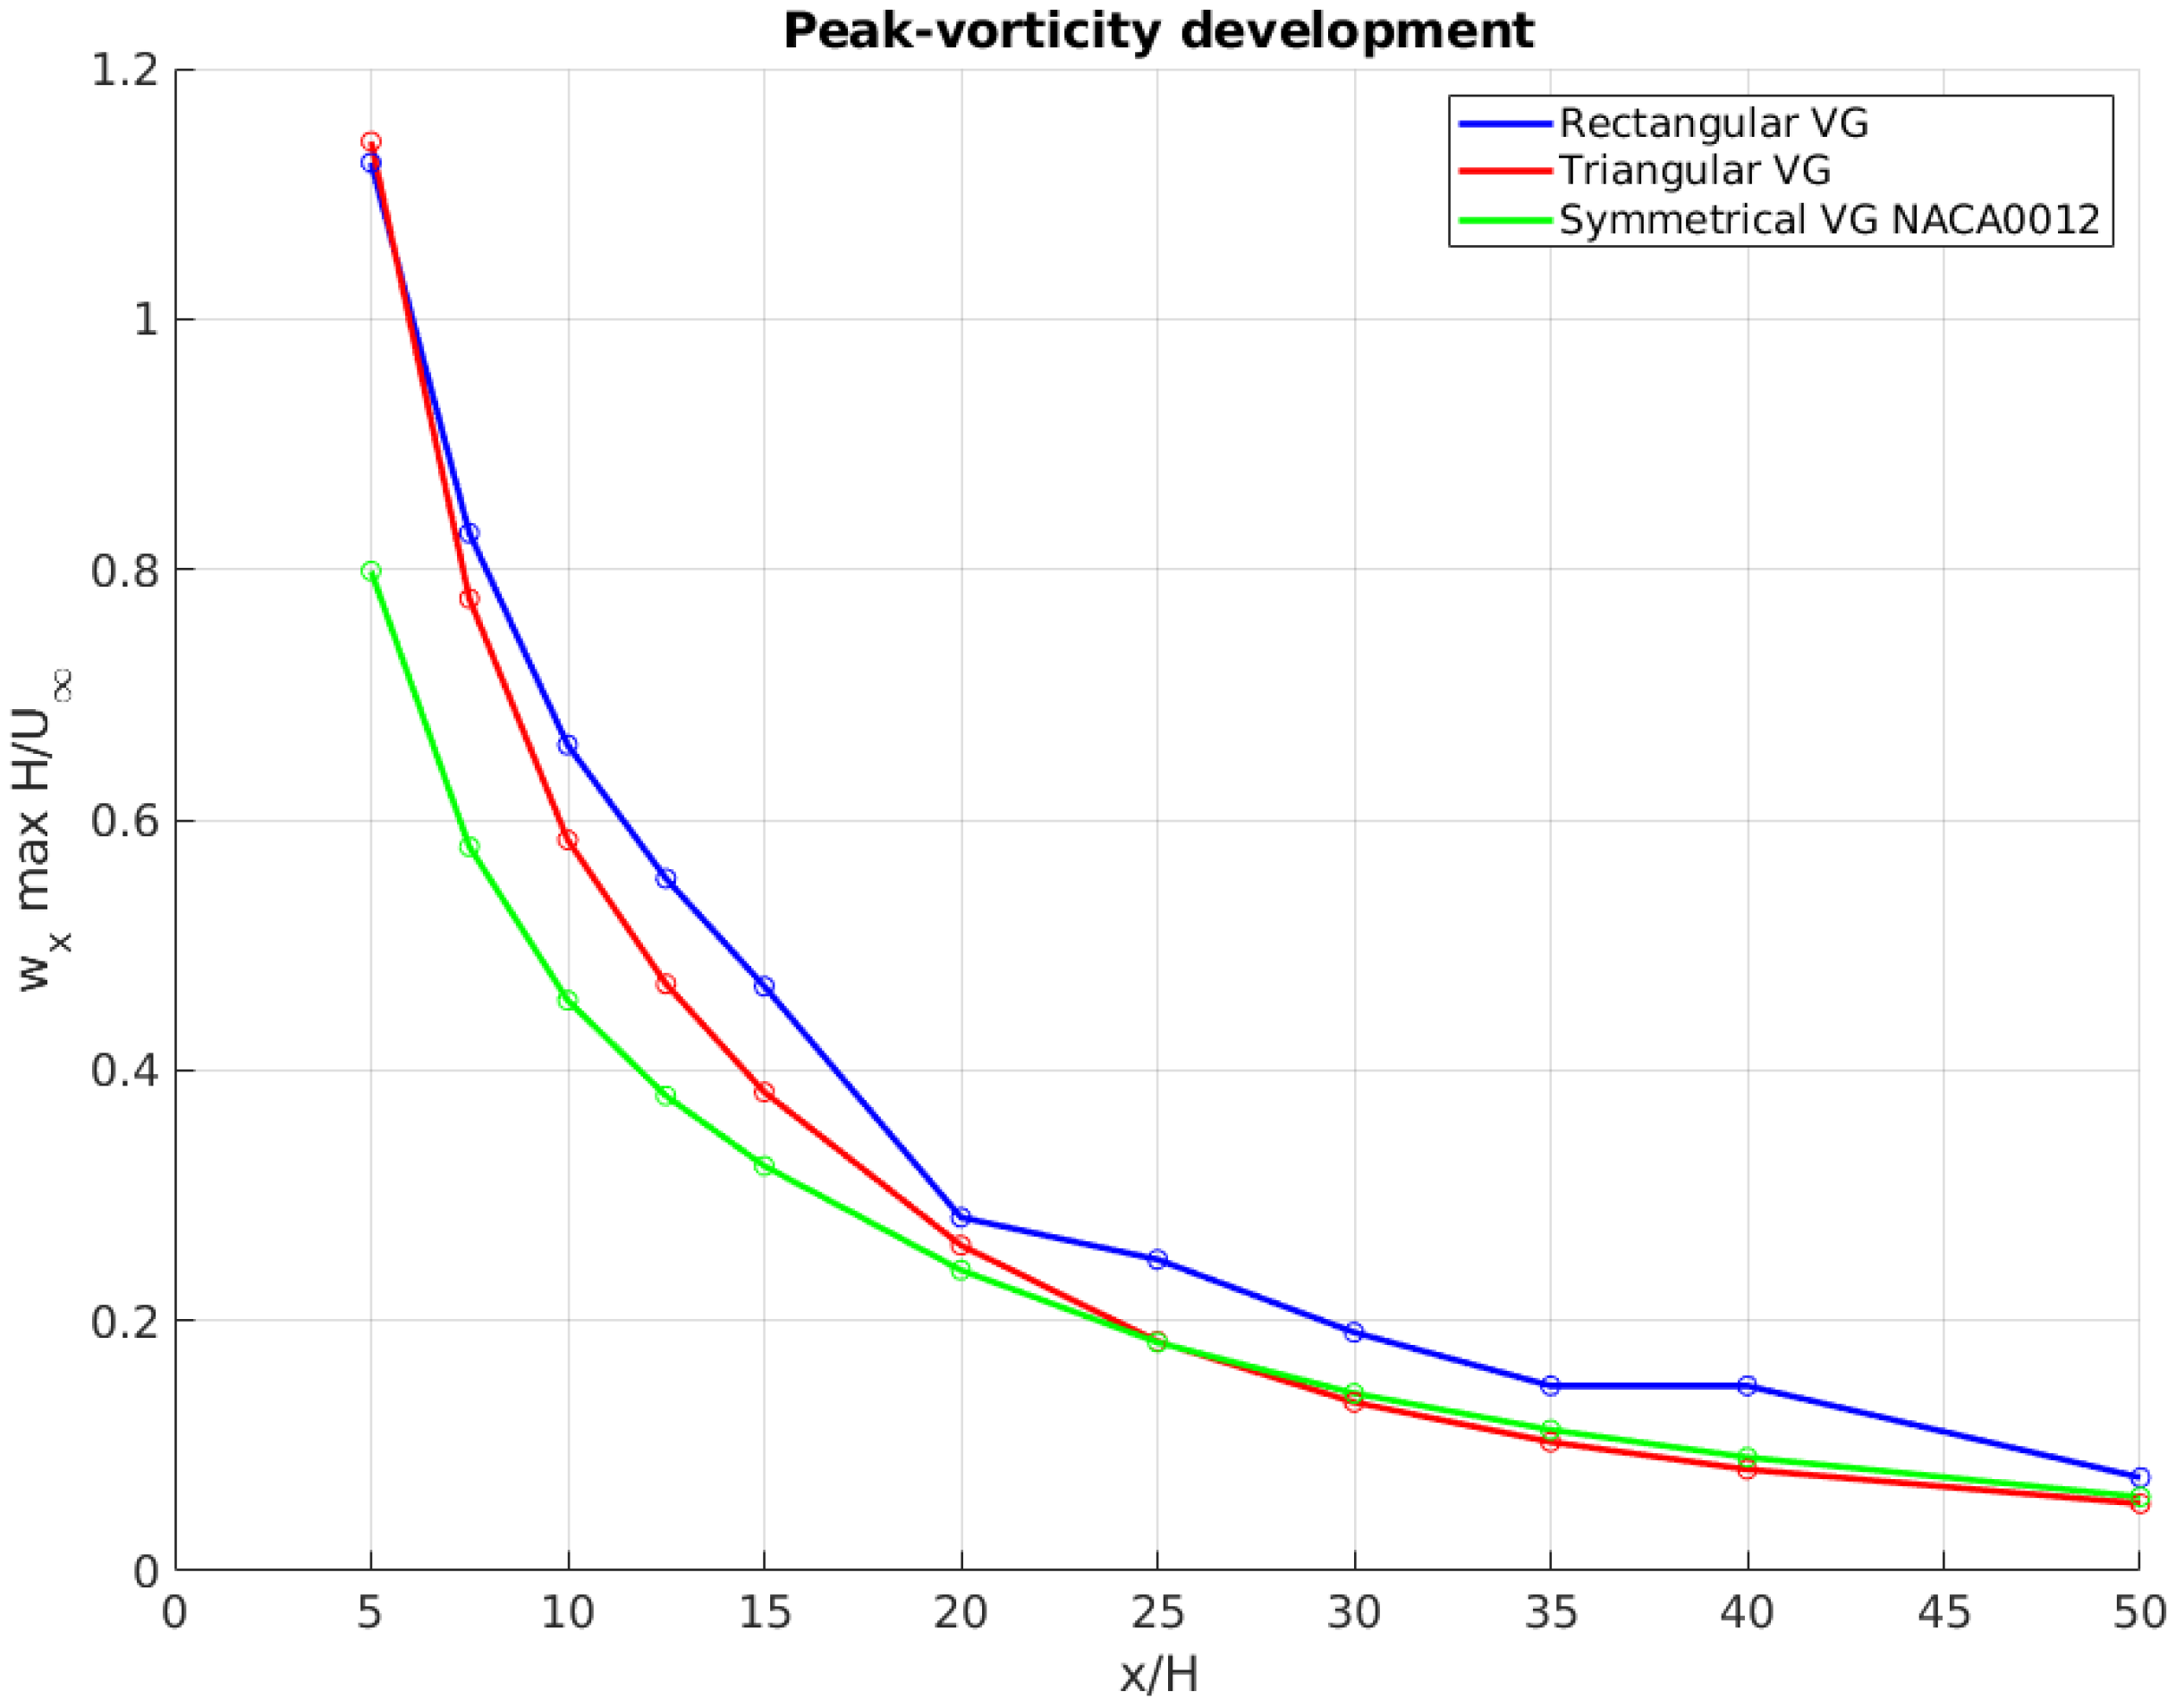
Once the vortex is in the zone of interest, it is important to quantify its rotation of it through the vorticity magnitude. For all analyzed planes in
Figure 11 the normalized peak vorticity development is presented in the streamwise directions. As expected, the decay tendency seems to follow an exponential law. The Rectangular VG is the one with the higher value in peak vorticity. The Symmetrical NACA0012 is at the same level as the Triangular VG for locations up to 25H. As observed in [
31] with the lowest VG, lower vertical trajectories drive to a lower value of vorticity due to the higher interaction of the vortex with the wall.
4.3. Vortex Size
The vortex size is a complementary parameter along with the vortex core trajectory to define the influence zone of the boundary layer since the vortex could be located far away from the wall even with a small vortex size.
In some studies, such as in Velte [
24,
32] and Fernandez-Gamiz et al. [
33], the vortex size has been analyzed with a radial distance defined from the vortex center to the point where the azimuthal velocity reaches its maximum value. On the contrary, in other studies the size is measured from the vortex center to the point in which the streamwise vorticity decays to zero. For this second method, the streamwise vorticity distribution supposes a Gaussian one at the points contained in a normal plane to the flow with the same vertical coordinates as the vortex center
=
. However, this statement is inconsistent at all points of the plane due to the interaction of the vortex with the surroundings, as in the case of a flat plate.
Therefore, a more accurate parameter, such as the Half-Life Radius
developed by Bray [
34], is desired to determine to vortex size. This parameter is defined as the distance from the vortex center to the spanwise points where the streamwise vorticity
is half of the peak vorticity, since the Gaussian distribution is undisturbed by the surroundings from this level of vorticity to the peak. This parameter, Half-Life Radius
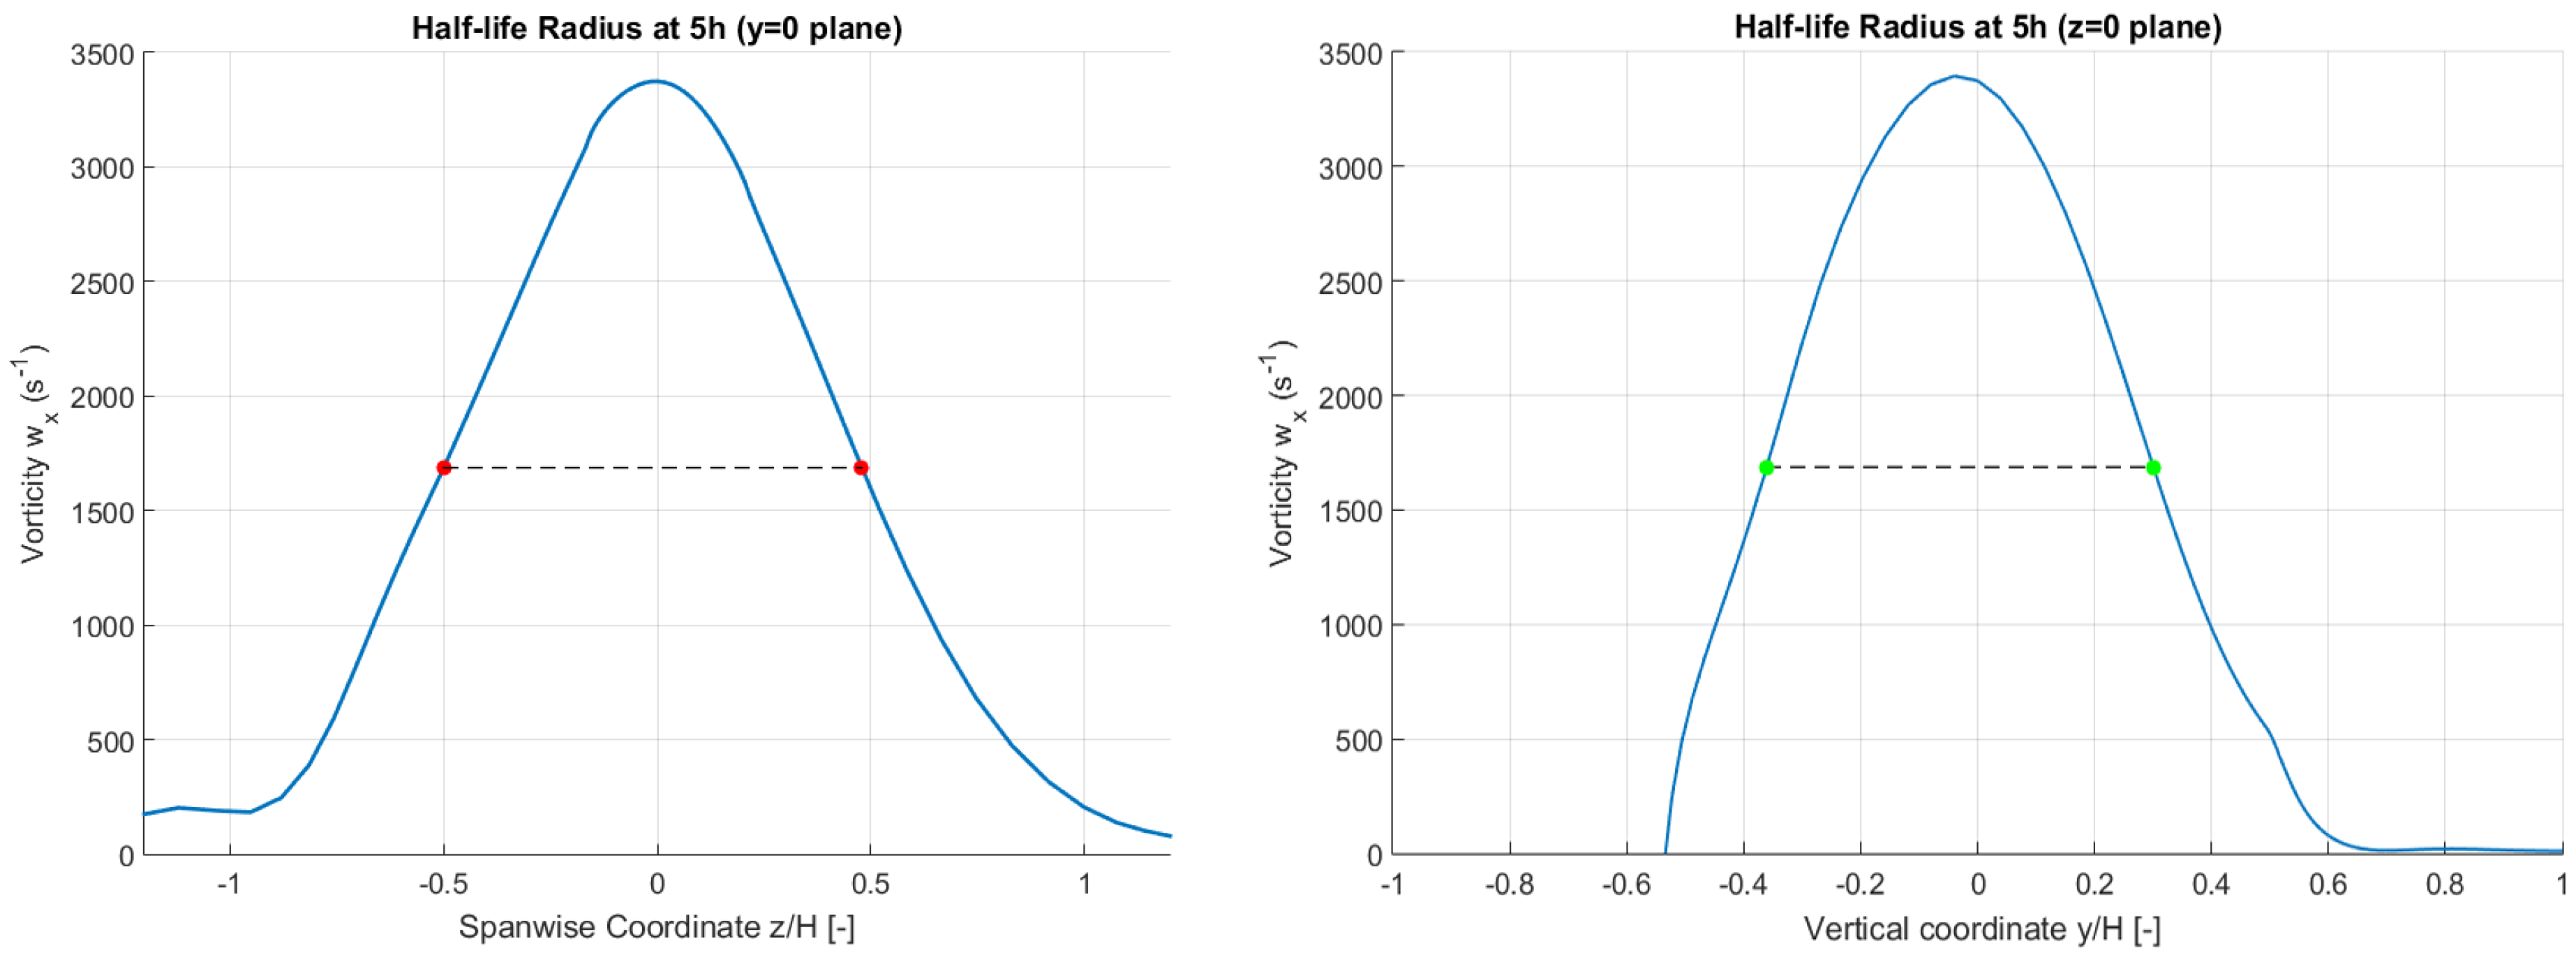
, is an approach of the primary vortex size and only includes the primary vortex characterization. However, other flow effects such as secondary’s vortices are neglected.
has been used in previous research such as in Martinez-Filgueira et al. [
11], which demonstrated that this parameter can contribute to the vortex size analysis in a suitable way. Nevertheless, for the computations carried out in this research,
turned out to be not so accurate. After plotting the vorticity of the points in which the vertical coordinate matches the vortex center one, a symmetrical Gaussian distribution for the vorticity at the half of the peak vorticity height was not obtained. The spanwise distance from the vortex center to the points, in which the vorticity is
/2, is not equal, since symmetry was left in the vorticity distribution, (see
Figure 12). Please note that the vorticity distribution is not symmetrical. This disturbance in the vortex shape was also experimentally detected by Yao et al. [
15].
As a result, an innovative methodology has been developed in the current study. The vorticity distribution from points with the same spanwise coordinate as the vortex center was extracted to obtain the vorticity distribution normal to the one used in the Half-Life Radius method. Then, four points have been determined with a vorticity equal to
/2, two points in the vorticity distribution used for
(red points in
Figure 12), and two points more in the normal vorticity distribution (green points in
Figure 12).
These four points were fitted to an elliptical shape. As the Half-Life Radius
parameter measures the size of the vortex by a radial distance, this size could be also measured with a section area, as it would be a cut of the three-dimensional vorticity distribution having a more representative measure. Thus, this new parameter could be used for the cases where a non-Gaussian distribution of vorticity were obtained. An elliptical fitting of the four points was carried out following the procedure of Fitzgibbon [
35]. The general quadratic curve of the fitting is expressed in Equation (
3).
The coefficients of Equation (
3) have been calculated and an accurate fitting of the points has been obtained. An elliptical fitting of the four selected points is shown in
Figure 13 for a streamwise plane of 5H downstream the vane. A three-dimensional explanation of the vorticity distribution with a cutting plane is also sketched in a detailed view of
Figure 13.
The z/H axis origin in
Figure 13 is fixed at the spanwise position of the vortex center since these two points came from the normal vorticity distribution. The others have been obtained from the distribution used in the
method. That ellipse obtained is supposed to be an approached section to the shape of the vortex, so that an approximated measure of the primary vortex size can be computed. To know the area of the ellipse, the vertical semi-axis b’, and the horizontal one a’ have been calculated for each plane fitting by using Equations (
4) and (
5).
Finally, the new parameter could be calculated. This new parameter has been called half-life surface area
since its calculation is based on the Half-Life Radius
methodology. This parameter
is equal to the ellipse area which has been fitted to the extracted points. Hence, the
parameter follows Equation (
6).
This procedure has been applied for each plane downstream of the VG and for each analyzed geometry.
Table 4 shows the values of the ellipse fitting coefficients for the studied downstream plane positions 5H, 25H and 50H.
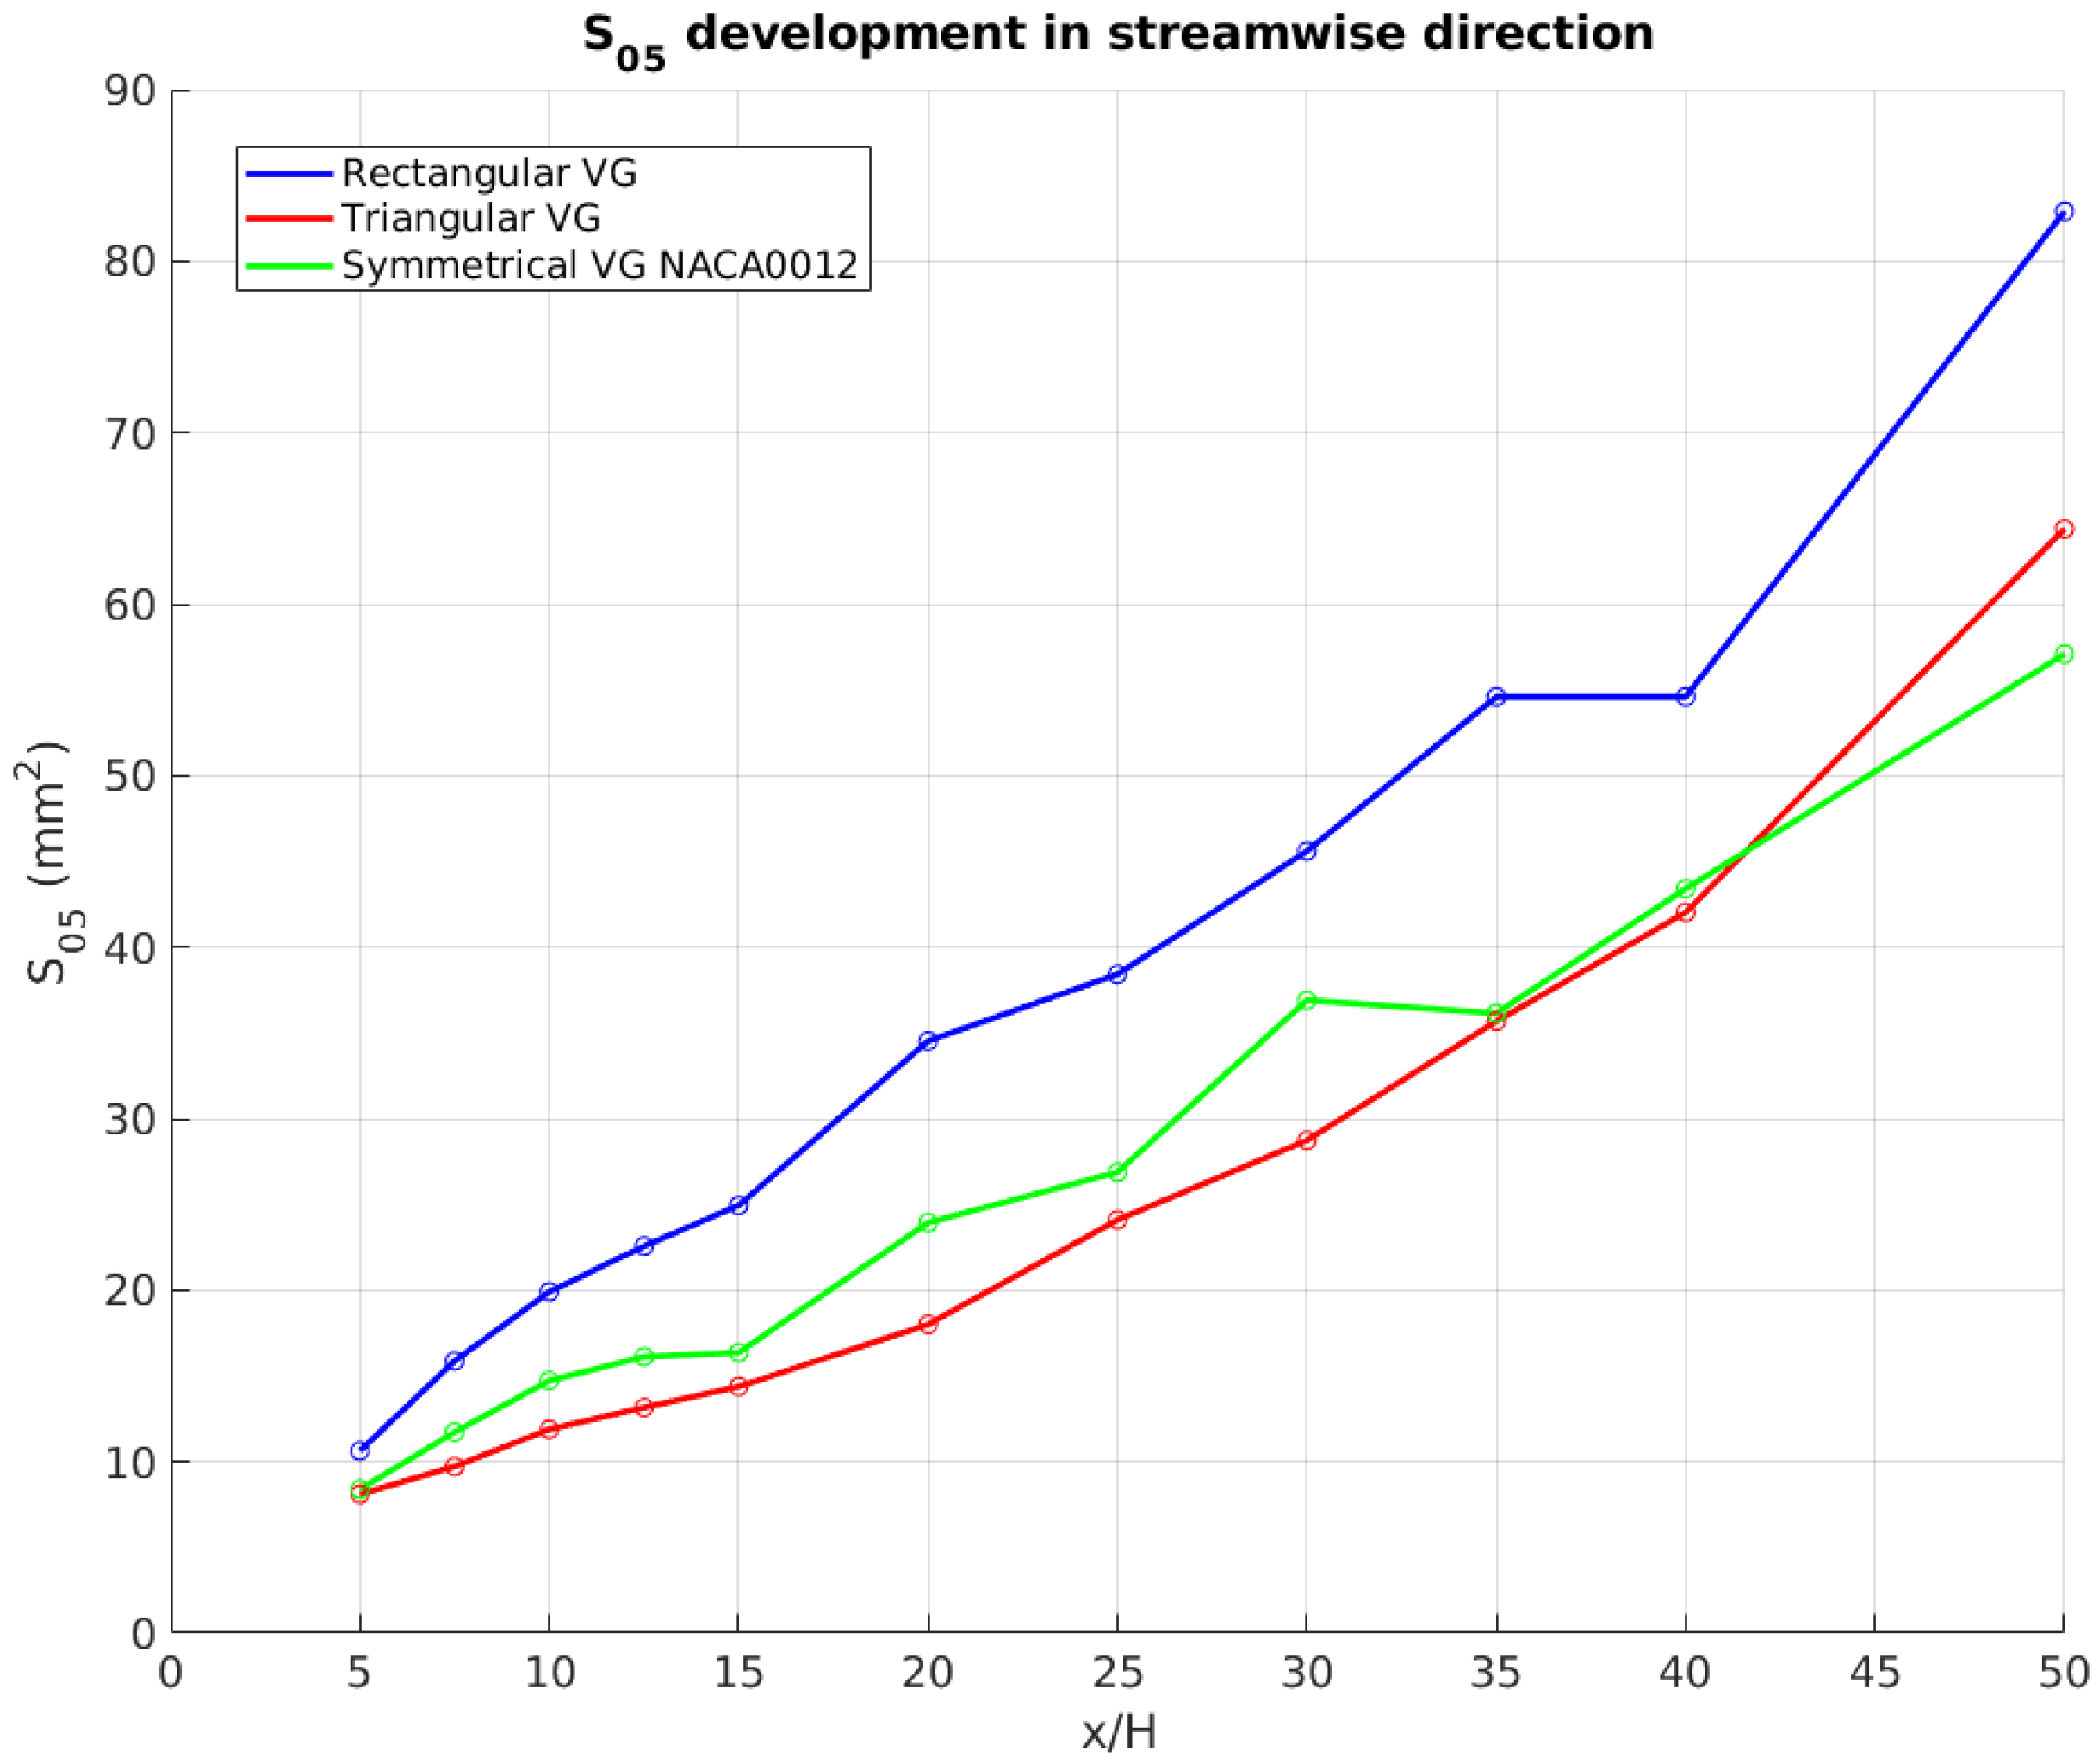
The primary vortex size evolution of each VG geometry downstream of the vane is shown in
Figure 14. The vortex size development is characterized in the same manner as previous studies of [
11] and [
15]. The Rectangular VG presents the larger vortex in contrast with the Triangular VG and the Symmetrical VG NACA0012. However, the Symmetrical NACA0012 produce a vortex core near the wall (see
Figure 10) with a larger size than the Triangular VG in some locations, thus a larger energy transfer may occur.
4.4. Vortex Strength
The capacity of spinning that the vortex acquires is evaluated with the positive circulation
according to Equation (
7):
However, in the present study, an alternative has been followed for the positive circulation
. All points of the ellipse fitted in each plane has been calculated with the vorticity equal to
, thus the parameter
is the area in which all points have the same value of vorticity. Then, a new parameter called the mean positive circulation
is introduced in this research which has been defined according to Equation (
8).
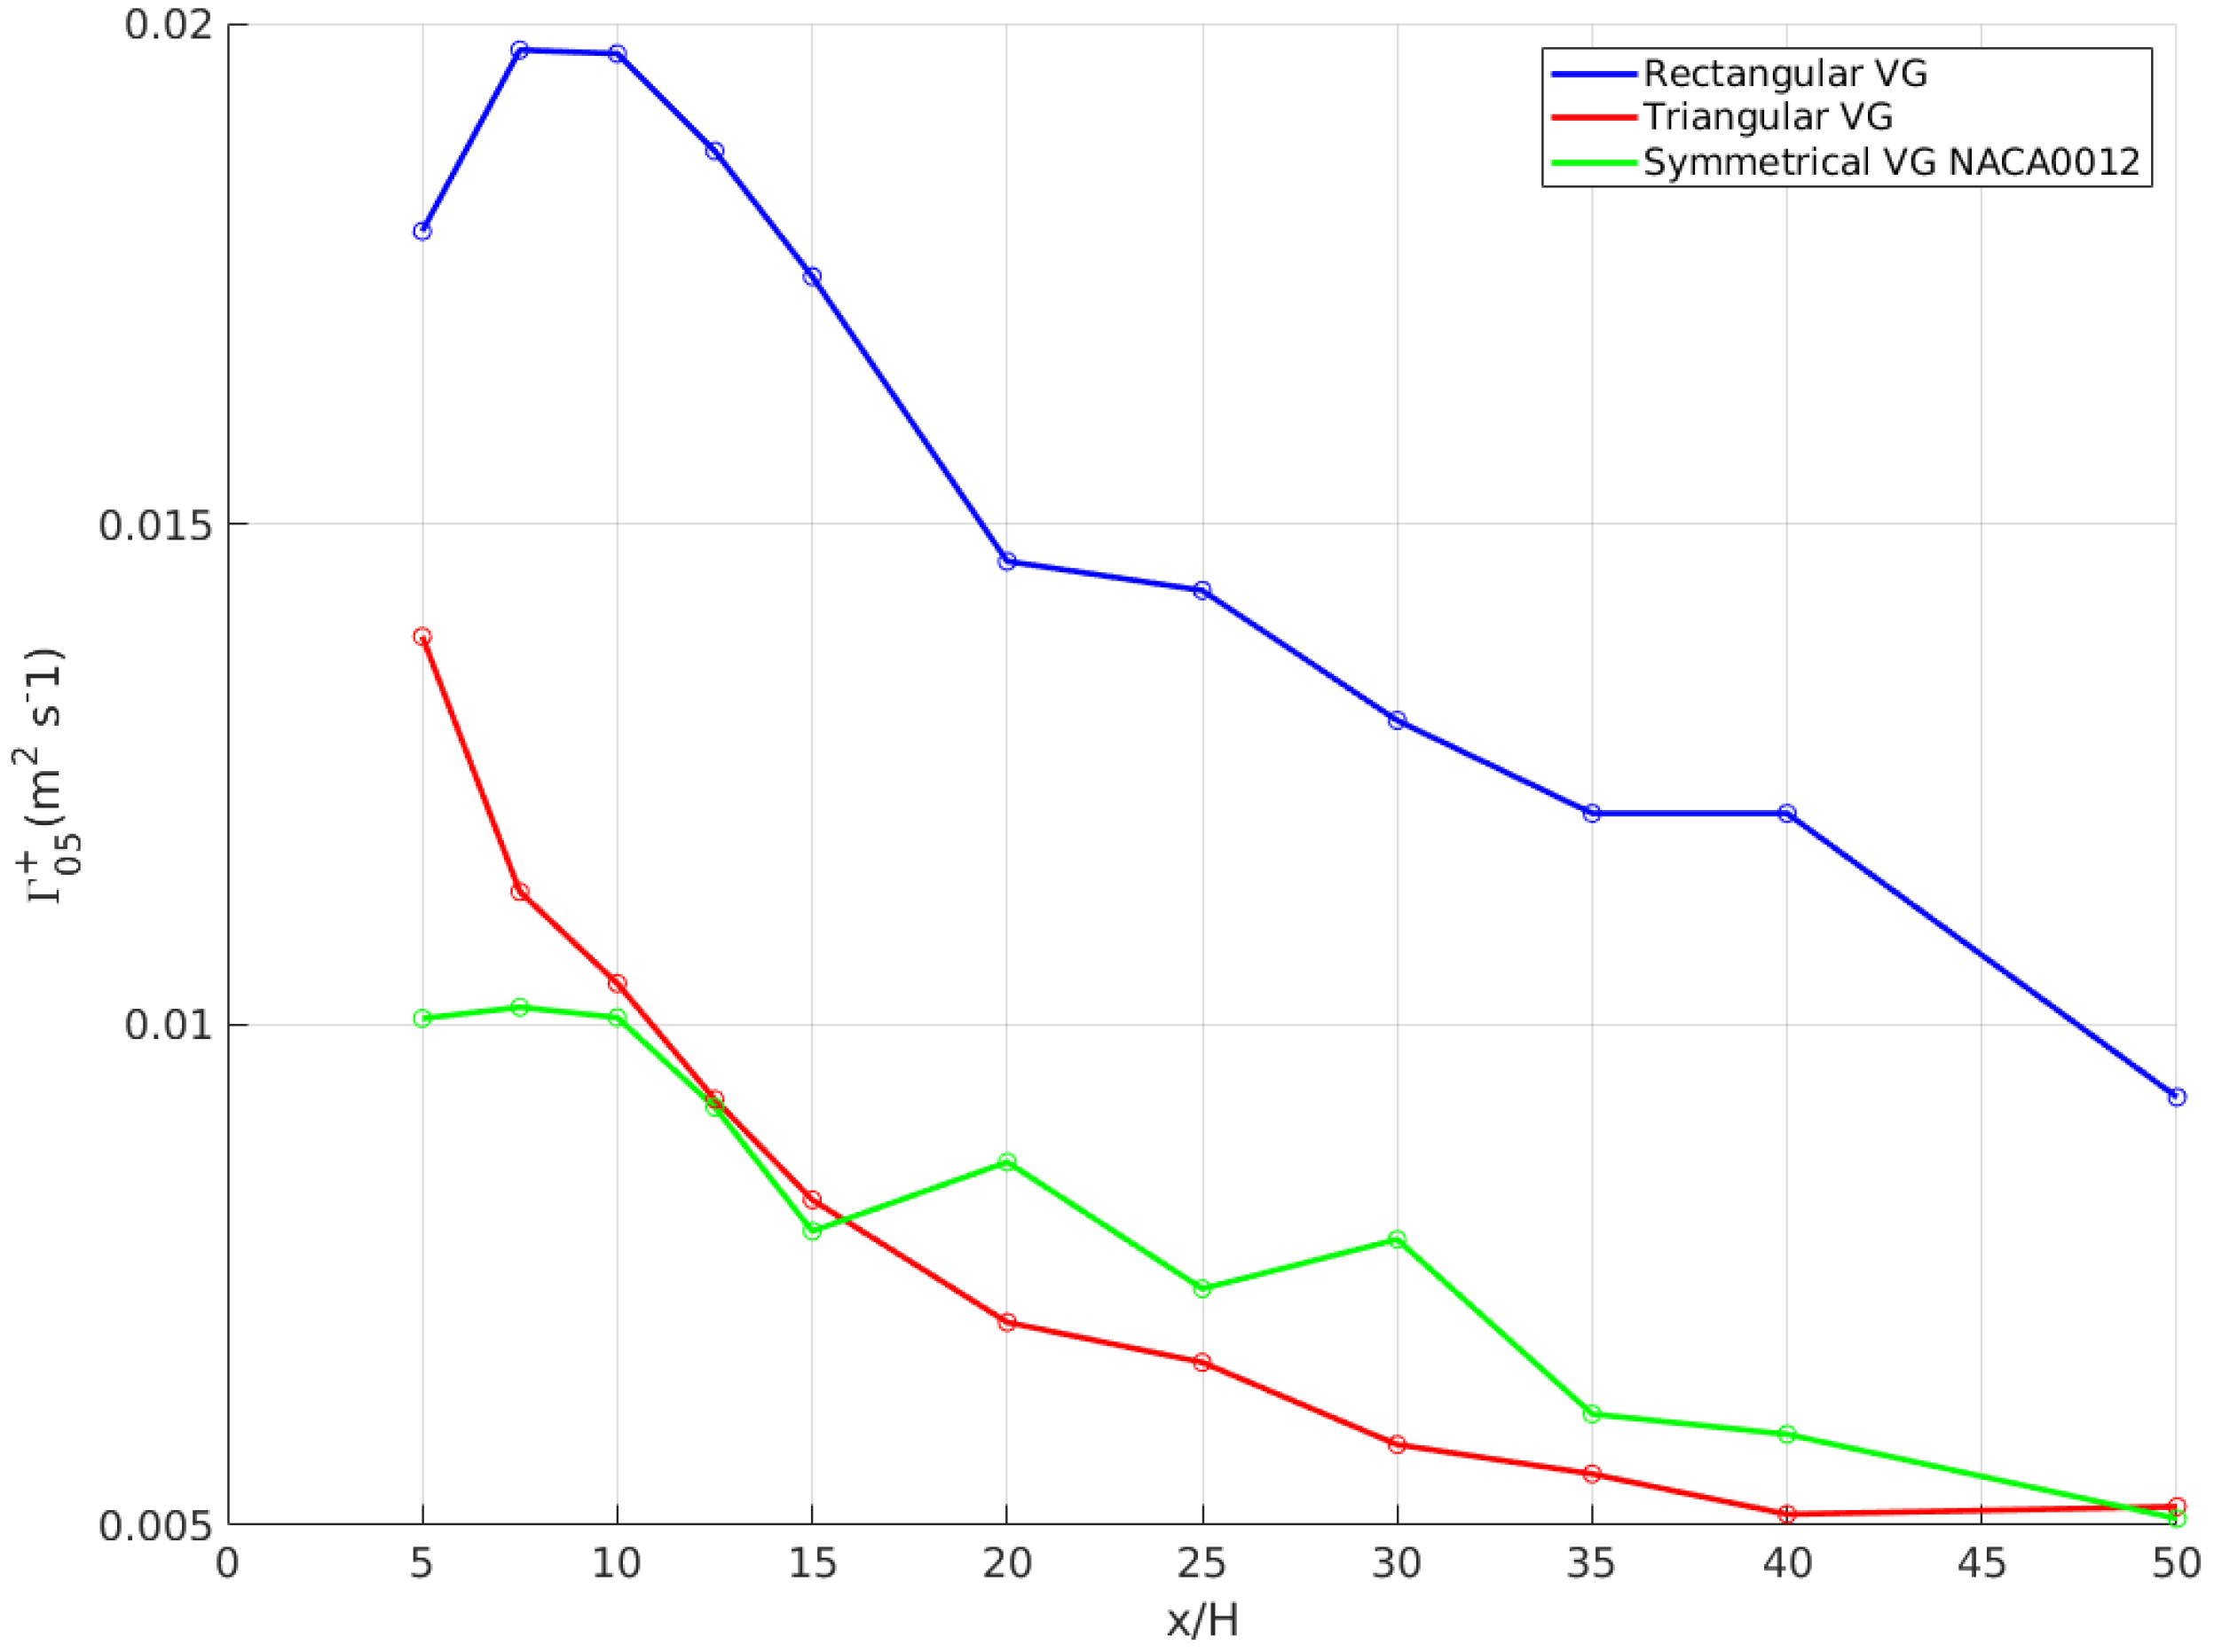
In
Figure 15 the computed values of the mean positive circulation are represented. The Rectangular VG is featured with a high vortex strength compared with the others VG geometries. As there was not a remarkable difference in peak vorticity development between geometries, the difference in
is attributed to the difference in vortex size. For all geometries, a decay of vortex strength is found as expected. According to [
15], the peak vorticity and vortex strength decay could come from the lateral friction of the vortex with the wall which induced a lateral shear reducing the vortex amount of rotation.
4.5. Wall Shear Stress
The wall shear stress (WSS) is the result of friction within the fluid and between the fluid and the walls and is related to fluid viscosity. The magnitude of WSS is dependent on how fast the velocity increases when moving away from the wall. The streamwise Wall shear stress WSSX is determined by Equation (
9).
Godard et al. [
5] analyzed the efficiency of stall delaying provided by the vane throughout the skin friction increment using the WSS as
. Since the boundary layer stall in an adverse pressure gradient is produced by a decrease of the skin friction Schlichting [
36], the WSS increment quantifies the capacity of the flow to be attached due to its friction.
From the trailing edge of the VG up to the end of the domain, a sampling line located in the symmetrical axis of the pair of the VGs is determined with 3000 sampling points.
Figure 16 shows the value of
for each geometry. At plane positions close to the trailing edge of the vane, the Rectangular VG seems to begin with the maximum value of WSS in the near wake in comparison with the other geometries. However, the Symmetrical VG NACA0012 has a comparable value for streamwise locations up to 15H. As a reference, the value of WSS from a flat plate case without VG is presented, in which no variation of the value is observed due to the lack of vortices. As a result, there is an increment in
due to the presence of VGs.
5. Conclusions
A CFD evaluation of the vortices produced by three different geometries of passive VGs on a flat plate has been done under zero pressure gradient conditions. Numerical simulations at a Reynolds number of = 2600 based on the local BL momentum thickness = 2.4 mm and free-stream velocity = 15 m/s have been carried out using the RANS method.
The techniques used in this study can reproduce with good reliability the physics of the primary vortex generated by three different geometries as well as the correct modelling of the boundary layer. This study complements the traditional vortex characterization by the introduction of two new parameters, namely the half-life surface and the mean positive circulation which have been useful for a suitable reproduction of the vortex size and strength development, respectively. This study provides information about the multi-parametric design of vortex generators for wind turbine purposes in which the influence of the cross-sectional shape of the device has been analyzed as a first step in a test case under a certain flow condition. Thus, the vortices have been modelled and compared in an isolated way without the influence of an adverse pressure gradient or the position of them on an airfoil.
The vertical and lateral paths of the primary vortex center have determined the vortex location. The vortex energy transfer efficiency inside the boundary layer has also been assessed and, as expected, the vortices have been found inside the inner part of the boundary layer. The Rectangular VG (y/H = 1.5 while /H = 4) has generated a primary vortex with the highest trajectory. The computation of the peak vorticity () has allowed estimation of the vortex rotation and the differences in peak vorticity between the three geometries analyzed can be considered small compared with the differences in vortex size () in which the vortex generated by the Rectangular VG has the largest size. The computation of the mean positive-circulation () has measured the capacity of spinning of the vortex parameter, which seems to be primarilyy influenced by the difference in vortex size according to this study.
In this study, it has been demonstrated that a non-typical VG geometry such as the Symmetrical VG NACA0012 can perform at the same level as conventional geometries. In fact, the NACA0012 Symmetrical VG provides a good capacity of flow attachment improvement due to a comparable streamwise wall shear stress WSSX increment such as the Rectangular VG for a lower primary vortex trajectory and for a similar vorticity level, thus the energy transfer in the boundary layer is optimized by this geometry. This novel geometry is a good candidate for further analysis on the boundary layer development on an airfoil, which can provide information about the influence of drag penalty and the efficiency in stall delaying.


