Abstract
Nowadays, automated appliances are exponentially increasing. Therefore, there is a need for a scheme to accomplish the electricity demand of automated appliances. Recently, many Demand Side Management (DSM) schemes have been explored to alleviate Electricity Cost (EC) and Peak to Average Ratio (PAR). In this paper, energy consumption problem in a residential area is considered. To solve this problem, a heuristic based DSM technique is proposed to minimize EC and PAR with affordable user’s Waiting Time (WT). In heuristic techniques: Bacterial Foraging Optimization Algorithm (BFOA) and Flower Pollination Algorithm (FPA) are implemented. Furthermore, a novel heuristic algorithm has been proposed by merging the best features of the aforementioned existing algorithms. We test the proposed scheme on single homes and on smart community (involving multiple households). Different Operational Time Intervals (OTIs) are also considered for implementation. We have performed simulations for validating the our scheme. Results clearly demonstrate that the proposed Hybrid Bacterial Flower Pollination Algorithm (HBFPA) shows efficacy for EC and for reduction of PAR with reasonable user WT.
1. Introduction
Human life has been made easy in many aspects due to the progress in various fields of science. Electricity is one field of science that has made human life easier in various ways. It is generated from different aspects of nature, i.e., from wind stations, nuclear power plants, hydro-power plants and water turbines. Electricity providers are not able to resist load requirements of customers because of the huge increase in the human population, buildings and industries and other infrastructure. The demand for electricity has been increased due to the automation in various sectors. For handling this intense condition, utilities propose to their customers to balance their electricity usage during the day and try to avoid maximum usage in the peak hours by keeping their eye on the highly demanding hours and their extra wastage. The energy that is required by the residential sector is thirty to forty five percent of total energy usage around the globe [1]. It is evidently stated that Energy Demand (ED) is growing endlessly, and it is expected that it will reach up to 56% of the current usage in 2040. Using some intelligent systems and techniques, the user can control this high Load Demand (LD). This demand can be achieved by giving some incentives to the customers, i.e., reduction in Electricity Cost (EC) in low demanding hours. Energy consumption minimization using Demand Side Management (DSM) can also be attained by planning the usage of electricity and by adopting the deployment methods which directly impact the customer’s LD. There are different pricing tariffs that are being used by the utility. These pricing tariffs are Critical Peak Pricing (CPP) tariff, Real-Time Pricing (RTP) tariff, Day Ahead pricing (DAP) tariff and the Time of Use (TOU) tariff. Many of these have been implemented to get incentives. The domestic customers consume 18% of this electricity 2011 [2] and it is continuously increasing. Many algorithms are being proposed to optimize the energy demand and many of them are inspired from biology, artificial intelligence and nature.
In our model, we have considered 14 appliances which are categorized by consumer’s actions. The Length of Operational Time (LOT) is dissimilar for the different appliances [3]. The considered Parameters are: reduction of EC, PAR and load consumption with affordable Waiting Time (WT). We are optimizing the problem using a novel hybrid approach for single homes as well as multiple homes, i.e., ten, thirty and fifty homes with power consumption patterns and dynamic Power Rating (PR). Some steps we mentioned here are:
- Load shifting strategy from high power demanding hours to low power demanding hours.
- Planning constraints in which different incentives are given to the customers by utility for flexible load shifting because of variation in quality of services provided by them.
This work is an extension of [4]. Motivated from meta-heuristic algorithms, this paper considers the Flower Pollination Algorithm (FPA), Bacterial Foraging Optimization Algorithm (BFOA) and their hybrid algorithm for optimizing the energy consumption in single as well as multiple homes. Our current work presents CPP and RTP pricing tariffs in Home Energy Management (HEM) to decrease the consumer’s EC and Peak to Average Ratio (PAR). The PAR is considered to minimize the rebound peaks in off-peak hours.
The rest of the paper is planned as following: the literature review is described in Section 2. Section 3 covers the problem statement and our planned solution with detailed description is explained in Section 4. Our achieved results and the discussions based on them are proved via simulations in Section 5 and what has been learned through this research is summarized and concluded in Section 6 with its future work.
2. Literature Review
Recently, many optimization methods have been proposed to accomplish various objective functions, i.e., lessening the EC and PAR. Various struggles are made for the cost-effective consumption of electricity. In the current section, the previous research explored and described by other researchers on various optimization methods are discussed.
The meta-heuristic methods named: FPA and Harmony Search Algorithm (HSA), which are applied by other researchers to assess the performance in HEM [5]. Tariq et al. have considered one home with various appliances working both automatically and manually. The CPP tariff is used with the proposed scheme to shift the load from on-peak to off-peak hours for EC minimization and User Comfort (UC) maximization. Nonetheless, no consideration has been given to the dynamic PRs of the various appliances.
In [6], the researchers explored an effective DSM model for the residential users. The DSM model uses the Binary Particle Swarm Optimization Algorithm (BPSO), Genetic Algorithm (GA) and Ant Colony Optimization (ACO) Algorithm. All of these algorithms are heuristic algorithms that reduce the EC, PAR and maximize UC. Main objectives of this research are deduced using three basic methods: GA, BPSO and ACO using TOU and Inclined Block Rate (IBR) pricing tariffs. However, computational complexity is not considered by Rahim et al.
HEM controller is designed by applying heuristic techniques as: GA, BFOA, Wind Driven Optimization Algorithm (WDO), BPSO and Genetic Binary Particle Swarm Optimization (GBPSO) in [7] using RTP pricing tariff. In this paper, main emphasis is on reduction in cost and PAR. The GA accomplishes well in the reduction of PAR and BPSO outperforms in cost minimization. However, a trade-off between EC and delay is existing in the proposed techniques. The simulations showed that the method achieved better results in the specified circumstances. Table 1 shows the brief summarized related work.

Table 1.
Summarized literature review.
In [8], the HEM system is explored which integrate Renewable Energy Resources (RES) using different energy supplements and performs with DSM instantaneously. Therefore, the recommended HEM supports the users in curtailing the consumption and scheduling of appliances in the home to a specific level. When the boundary exceeds a specific level, the appliances will get-off by the utility itself. In this paper, DAP signals and heuristic algorithms are applied to acquire optimum solutions.
For the optimization of optimization problem, Power Scheduling Technique (PST) is explored, where the user can flow the initial and finish times of the appliances and can decrease the power usage. EC in the current exploration is publicized by electric suppliers beforehand [9]. The results validate that the scheduling technique outperformed in terms of low EC highly proficiently.
With the consideration of supplier’s services, to stabilize the load for avoiding huge electricity usage is necessary. In addition, the supplier has to generate excess electricity to achieve the load demand. To annihilate the aforementioned issue, a crucial requirement to rise the power consumption agreement with low rates [10] is presented here. The results based on simulations proved that there is a specific limit beyond which the algorithm schedular keep working and pause some appliances for some duration. It supports to continue the LD for low EC and pause the appliances for use at a later time. The TOU tariff is applied for balancing the load appropriately.
By shifting the load, the customer can delimit the high LD. A critical situation for the checker creates, when the shareholder’s capacity of increasing energy incomes get inadequate [11]. Generally, peaks can be decreased and valleys can be occupied which helps in balancing the LD.
In the paper [12], the deliberation of the Smart Meter (SM) model is presented, this model comprises Demand Side (DS) production to improve the cost. The cost is used to control the correction variables to improve the solution. This work halts a new pricing tariff for optimum procedures of the Smart Grid (SG), which uses PSO scheme to find the optimum results to loss limits and Demand Response (DR) stability.
The BFOA is hybrid with GA and is applied in [13]. In their work, they used RTP pricing scheme is taken into account to improve the load of the customer, UC and EC. Nevertheless, the dynamic PR for a smart community with varying appliances is not considered.
In this paper [14], DR patterns and procedures are implemented and reviewed by classifying different schemes to decrease power consumption for DR variables which reduce the total power usage by effectively applying DR method, depend on the contribution of customer and contribute to power decrease in the highly demanding hours by consuming Dynamic Pricing Patterns (DPP). The proposed method produce the DPP for predicting methods that reflects the probabilistic performance of the appliances. In [15], the researchers categorized the appliances into three categories, which are base load appliances, non-deferrable and deferrable. The key objectives attained are WT minimization, PAR reduction and cost reduction.
The DSM approach is applied to attain the objective of load balancing for residential, commercial and industrial zone [16]. It reduces the demand of load in peak hours with signification decrease in the bill. The results based on simulations shows an obvious reduction in cost by applying the PSO method.
The researcher in [17] proposed an effective HSA method that is implemented to schedule the DSM. The pricing tariff used by Geem et al. is TOU. Therefore, many simulations are performed and their results show that HSA performs better compared GA.
The hybrid of a fuzzy technique with FPA is applied to accept possibility that uses various methods for accommodating variation in mutually local and global pollination [18]. The FPA outperforms than its hybridized fuzzy version. Results are compared with different mathematical models. However, time computation is ignored in this paper.
The altered FPA is explored in [19], which uses scaling factor for controlling local pollination. The efficiency is intended from various mathematical equations, simulations and four diverse power systems.
In [20], storage devices, i.e., batteries have a limit for charging and discharging to avoid any type of loss, and controllers are installed on them. In the residential area, controller’s load is shifted into the slot of low-cost, which means that charge the battery when EC is low and consumes that electricity when the demand is high in order to meet the load demand. At the end, it is concluded that higher battery capacity results in optimal usage of power and EC minimization. The EC and PAR are minimized by the proposed scheme in [21]. However, renewable energy resources and installation cost is completely ignored.
In [22], the cost is reduced by using GA. However, the UC is ignored and PAR is also neglected in this paper. The EC is minimized with the reduction in PAR in [23]. However, UC is neglected completely. A famous approach with its hybrid version is proposed in [24] using a hybrid algorithm of FPA and Tabo Search Algorithm (TSA) to solve the optimization for unconstrained problems. However, UC is ignored. In [25], the authors used FPA to optimize linear antenna arrays. The FPA outperforms other nature-inspired algorithms, including PSO, ACO and cat swarm optimization.
In [26], the authors proposed distributed energy resource aggregator as a new player to manage the energy along with the financial interactions in the day-ahead market. Graditi et al. in [27] propose a novel algorithm based on glowworm swarm particles optimization for optimal management of shiftable load in micro-grids (MGs). The authors also propose an optimal bidding strategy in an MG environment for selling and buying of energy by prosumers [28]. An analog ensemble method is applied for uncertainty caused by the intermittent nature of the renewable energy sources (RESs). The results revealed that the proposed methodology is effective during the hours when electricity price is high and the prosumer is willing to take risks. In [29], the authors use MG, which connects wind turbine and photovoltaic in a grid-connected mode to supply the energy in a smart home. Meta-heuristic algorithms and their hybrids are proposed to reduce the consumer’s EC, PAR and WT. The results show that the hybrid schemes outperform the existing algorithms.
SGs have emerged in order to overcome the challenges of energy i.e., aging infrastructure, electricity losses, environmental problems, etc., caused by traditional grids [30]. In [31], the authors use metaheuristic algorithms along with optimal stopping rule to reduce the EC, PAR and WT of appliances. The rebound peak created in the off-peak hours are mitigated through multiple knapsack capacity limits. The authors in [32] define the user comfort by employing time and device based appliances’ priorities. An evolutionary accretive comfort algorithm based on GA is considered to achieve the maximum user comfort in three different user budget scenarios. The results reveal that an increase in the budget value increases the user comfort along with cost per unit comfort index value. However, the OTI considered in [31,32] is composed of one hour. In reality, some appliances may take less time to complete their operations.
3. Problem Statement, Objectives and Mathematical Formulation
In this section, the problem statement of this paper and mathematical formulation are discussed.
3.1. Problem Statement
In the aforementioned literature, complete benefits have not been taken from a smart grid. EC and PAR are minimized by many researchers and some researchers focus on UC and load shifting to off-peak hours from on-peak hours as in [13,33]. However, aforementioned parameters are not catered by any related work simultaneously. OTI of one hour is taken into consideration in aforementioned papers, which is not feasible, i.e., if the OTI is of one hour and the operational time interval of any appliance is 40 min, then the remaining slots will be unused. To tackle this problem, 1, 20, 30 and 60 min Operational Time Intervals (OTIs) are taken into account and their comparative analysis is also done in this paper. Towards efficient energy management positive features of both BFOA and FPA are exploited and a novel proficient heuristic hybrid algorithm is proposed in real time and the CPP tariff to tackle EC and PAR minimization problems with an affordable user’s WT simultaneously.
3.2. Objectives
The main objectives of this paper include:
- Scheduling of home appliances,
- EC and PAR reduction,
- Balancing the load,
- Maximizing the UC,
- Trade-off between EC and UC exploited,
- Comparative analysis is also presented.
3.3. Mathematical Modeling
For solving the problem, mathematical equations has been modled. The Total Cost (TC) is determined for four different OTIs using Equations (1)–(4) with CPP and RTP tariffs in cents and power usage of various appliances in kilowatt hours (kWh). The various terms in equations and their symbolizations are provided in Table 2. The fitness function is determined using Equations (5) and (6).
Table 2.
Terms used in equations and their notations.
The total load usage of a complete day for four OTIs is determined using Equations (7)–(10) while Equation (11) calculates the load per slot. shows the ‘ON/OFF’ status of an appliance that is shown in Equation (12). The main emphasis is on objective functions as stated before. We have to decrease the total EC as in Equation (13) and diminish the PAR achieved using Equation (14) with affordable WT. One of our key objectives is load shifting as assessed in Equation (15). We have used some functions in these equations, which are: mean to find mean value, minimum as ‘min’ to find minimum value and ‘std’ is used to find standard deviation.
A day is divided into two scenarios: the first one is on-peak hours representing high electricity cost and the other one is off-peak hours representing a low electricity cost while seeing the ‘mean’ of given pricing tariff. The proposed Algorithm needs to fulfil our objective functions, and the algorithm will move the load to off-peak hours from the on-peak hours. It helps in reducing the PAR and EC. PAR is calculated using Equation (16), which is a ratio between maximum scheduled load and average unscheduled load. The list of appliances and their PRs are given in Table 3:
Table 3.
Power rating and length of operational time for operational time interval 20 min.
4. Proposed Methodology
In proposed methodology for HEM, appliances are categorized into three types, which are explained in detail below.
4.1. System Model
In this section, the architecture of the proposed model is discussed in detail as shown in Figure 1. It elaborates both single home and a smart community with multiple homes.
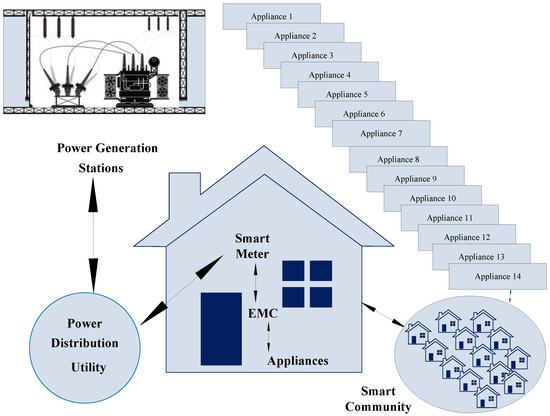
Figure 1.
Proposed system model.
In our scenario, single and multiple homes: 10, 30 and 50 homes with four different time slots (1, 20, 30 and 60 min) are considered with dynamic PR appliances. RTP and CPP tariffs are used to calculate the EC. Meanwhile, selection of proper time slots help to achieve aforementioned objective functions and improve the efficacy of proposed model.
4.2. Appliance Classification
In a specific time slot appliances are presented with ’ON/OFF’ status using [0, 1] and categories into two types; by determining their behavior, which are given as follows;
- Shiftable Appliances,
- Controllable Appliances,
- Non-Shiftable Appliances.
4.2.1. Shiftable Appliances
Deferrable appliances are named as shiftable appliances because these appliances can be moved to another slot but without interruption during the working slot. It cannot be halted until its time slot terminates. In our scenario, washing machine and dishwasher are shiftable appliances.
4.2.2. Controllable Appliances
Interruptible appliances are termed as controllable appliances. Operational time of such appliances cannot be altered, i.e., fan.
4.2.3. Non-Shiftable Appliances
Uninterruptible appliances are schedulable but non-shiftable. These appliances cannot be interrupted and their energy feeding configurations and OTI cannot be altered, i.e., dishwasher. All appliances with their PRs are listed in Table 3.
4.3. Pricing Tariff
The price is determined agreeing to utility defined tariffs. Various pricing tariffs are applied to decrease the EC and PAR, which inspires the customers to move the load to off-peak hours from on-peak hours. Different tariffs such as DAP, TOU, CPP, IBR and RTP are available in literature. Among all aforementioned pricing tariffs, CPP and RTP pricing tariffs are considered to conduct simulations. A brief introduction is explained below.
4.3.1. CPP
CPP is an electric service price with respect to time which is implemented on people having usage of electricity cost more than 20 kW and they are equipped with a meter that records its usage after every fifteen minutes. The main purpose of CPP is to provide people with more information so that they can decide when and how they have to use electricity. CPP rates are applied only if your usage is more than 20 kW. If you are not following a CPP tariff, then you have to pay alternative rates. The CPP pricing scheme is shown in Figure 2. In CPP, a communication device is needed that has to communicate in both ways:
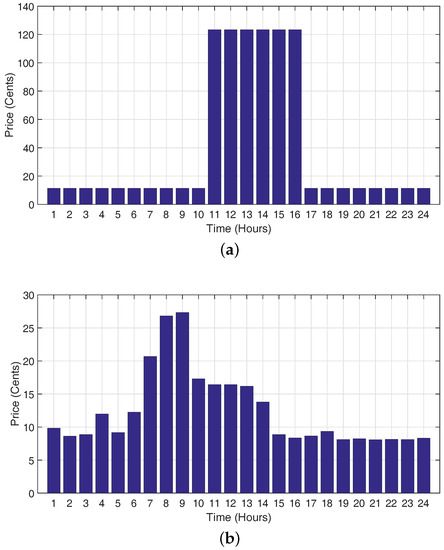
Figure 2.
Pricing tariff. (a) Critical peak pricing.; (b) Real time pricing.
- to send how much consumption has taken place from customers to utilities,
- and to send information to customers from utilities
4.3.2. RTP
In the RTP scheme, price depends on hours and it varies hourly. Normally, prices are fixed in RTP, which influence the customer’s usage in peak hours. It reflects marginal cost like Wholesale EC, atmospheric conditions and generator faults. Different pricing schemes from utilities impose different retail prices for different hours. RTP is implemented in the interval metering technologies that measure its consumption. It also records separate consumptions for every hour. The RTP scheme is shown in Figure 2.
4.4. Implemented Techniques
In this section, implemented techniques (BFOA, FPA, and Hybrid Bacterial Flower Pollination Algorithm (HBFPA)) are explained in detail.
4.4.1. BFOA
A beautiful aspect of nature is that it eliminates the animals that have less foraging behavior. The nature helps those species which possess the good searching behaviors and methods. After few generations, the weak ones are substituted by the healthy ones. Initially, the BFOA method has been proposed by ‘Passsino’ and ‘Kevin’ [34] in 2002. The approach in BFOA is that, initially, it allows the cells to group arbitrarily. Three successive phases are of the BFOA are explained below and algorithm for BFOA is discussed in [4].
BFOA Steps
BFOA steps are explained as follows:
- Chemotaxis: the period of a bacteria’s life is measured by the number of these steps, where the fitness J (i) of the bacteria is measured by contiguity to another bacteria’s new position O (i), then a tumble besides the measured price surfaces one at a time by adding a unit step scope C (i) and it lies between [−1, 1] in the direction of tumble. We generate a vector A (i) for representation of this random direction called as ‘Tumble’.
- Reproduction: where bacteria performed well to move on their generation and the only cells that can perform are those that have done well in their life time.
- Elimination and Dispersal: where cells are discarded and new random cells are inserted having low probability.
The algorithm for BFOA is explained in [4].
4.4.2. FPA
The FPA is a nature inspired method that is stimulated by the pollination procedure of plants [35].
It is predictable that more than one million different classes of plants exist in the world and most of them are from flowering classification. The basic tenacity of flower is to reproduce their offspring via pollination process. The types of pollination are as follows.
Types of Pollination
There are two kinds of flower pollination, namely;
- Biotic pollination,
- Abiotic pollination.
Most of the plants go through biotic pollination (also called as ‘local pollination’), which involves transfer of pollens within flowers of the same plant. A few of them perform abiotic pollination. Wind and many other natural processes help the flowers to perform pollination either locally or globally.
Pollinators are basically the pollen vectors that are huge in number. It is estimated that more than twenty thousand types of pollen vector exist in the world. Honeybee is the best example of a pollinator. These pollinators visit certain flowers simultaneously and maintain the consistency of flowers. This consistency involves the advantage of evolutionary purposes, which maximizes the reproduction steps of flowers. This consistency helps the pollinator in different ways, as they require minimum cost investment and more guarantee to intake the pollens.
Types of Different Processes in Pollination
The pollination can be achieved by two processes explained as follows:
- Self-pollination,
- Cross-pollination.
Cross-pollination is done from pollen vectors of different species of flowers while self-pollination occurs in the same flower. Cross pollination occurs at longer distances, which is why it is also called global pollination. One of the most important steps of this procedure is flower consistency, which can be achieved as an incremental stepping process using the difference or similarity between flowers. According to biological evolution, the survival of the best plant is the main objective of flower pollination, which is considered as a plant optimization process of different species.
From the biological evolution point of view, the objective of flower pollination is the survival of the plant and the optimal reproduction of plants in terms of number as well as the fitness. This can be considered as a plant species optimization process. All of the above factors and processes of flower pollination interact with each other to achieve the optimal reproduction. Therefore, this motivates us to design new optimization algorithms.
FPA Steps
In 2012, the FPA algorithm was developed by ‘Xin-She’ Yang and named as ’FPA for Global Optimization’ [36]. For easiness, the following four steps are used.
- Biotic cross-pollination is calculated as a process of global-pollination in which pollen vectors transport pollinators by means of Levy flights.
- Abiotic and self-pollination are used for local-pollination.
- Pollinators sustain flower’s uniformity by reproduction probability.
- The transferring of local and global pollination is calculated by a switch probability p, belongs to [0, 1].
The FPA Algorithm is shown in [4].
4.5. Hybridization
The method of hybridization basically contains a combination of two or more meta-heuristic techniques. If a technique maintains its identity while coupling with others, it will be a ‘strong coupling’ and, if other techniques take charge of its inner work, it will be a ‘weak coupling’. During this hybridization, these techniques follow the steps of other techniques and control the strategy of newly proposed hybrid algorithms.
4.5.1. HBFPA
The steps of our explored HBFPA are explained in Algorithm 1. Terms used in HBFPA are explained in Table 4 and probability value is taken as (0.5) in HBFPA. Fitness in HBFPA is calculated using Equations (17) and (18):
where ‘D’ is
Table 4.
Terms used in hybrid bacterial flower pollination algorithm and their notations.
Here, ‘u’ is the appliance’s cost.
In order to have a better understanding of HBFPA, a numerical example is illustrated in Figure 3. In Figure 3, a solution represents the status of 14 appliances. The one value states that the appliance is ON in the given time-slot while the 0 value shows the device OFF status. The HBFPA fitness function evaluates each solution in terms of EC and given constraints. Finally, a solution based on minimum EC is selected for that time-slot and the population is updated for the next generation.
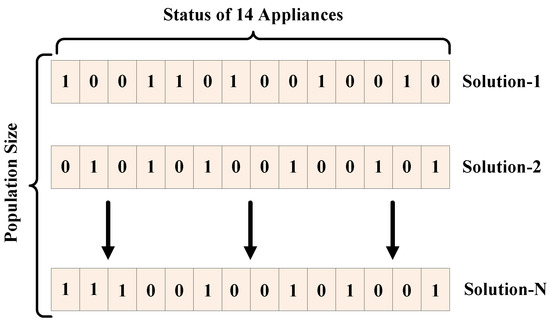
Figure 3.
Hybrid bacterial flower pollination algorithm numerical example.
| Algorithm 1 Algorithm for HBFPA |
 |
5. Simulation Results and Discussion
In this section, simulations and results with proper justification are described in order to specify the performance of the proposed hybrid algorithm using RTP and CPP price tariffs. Therefore, to judge the productivity of proposed technique and to describe its optimality for single home and a smart community, we have done different simulations for variable time horizon using different OTIs (24, 48, 72 and 1440) for a complete day, starting from 1:00 a.m. to the following 1:00 a.m.
5.1. For Single Homes
In this portion, a single home is considered with 14 appliances and EMC is installed in the home for scheduling of appliances according to price tariff defined by the utility side. Plots for load, EC, PAR and affordable WT using OTI of 20 min are given below:
5.1.1. Load Consumption
Load consumption for single homes using both pricing tariffs are explained as follows.
Load Consumption using CPP
The performance of the proposed hybrid algorithm is evaluated using a CPP price tariff. Our proposed hybrid algorithm outperformed as compared to benchmark schemes. Algorithm is envisioned to evade peak formation in any obvious slots of working hours. Therefore, price reduction happens. Our proposed and implemented technique performed fabulously in the case of different power consumption patterns. Figure 4 shows the behavior of load using CPP with four different OTIs. However, total load should be equal before and after scheduling.

Figure 4.
Load for single home using critical peak pricing. (a) load using operational time interval of 1 min; (b) load using operational time interval of 20 min; (c) load using operational time interval of 30 min; (d) load using operational time interval of 60 min.
Load Consumption Using RTP
Load consumption patterns using RTP are shown in Figure 5 for four different OTIs. In RTP pricing tariff, the scheduler efficiently manages the load and shifts from high rated hours to low rated hours. This load shifting is performed to reduce the EC. BFOA and FPA reduce the EC to some extent; however, the proposed algorithm outperforms. However, this load shifting affects UC.
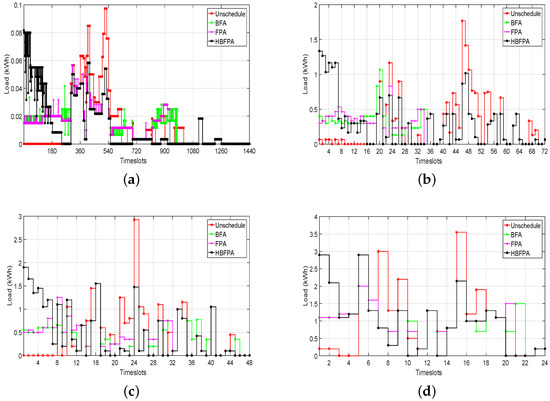
Figure 5.
Load for single home using real time pricing. (a) load using operational time interval of 1 min; (b) load using operational time interval of 20 min; (c) load using operational time interval of 30 min; (d) load using operational time interval of 60 min.
5.1.2. Electricity Cost
EC for a single home using both pricing tariffs are explained as follows.
Cost Using CPP
The appliance performance in terms of cost are calculated using heuristic optimization techniques and, as a result of this work, the hourly cost is reduced. The proposed technique performed well as compared to FPA and BFOA. CPP remains the same throughout the year except critical peak periods where the price is high. Therefore, the cost pattern is almost similar for all OTIs because, in CPP, peak generation time is the same for all OTIs. Simulation results reveal that the proposed optimization technique reduces the total EC as shown in Figure 6a using CPP. EC values for a single home using CPP are shown in Table 5.
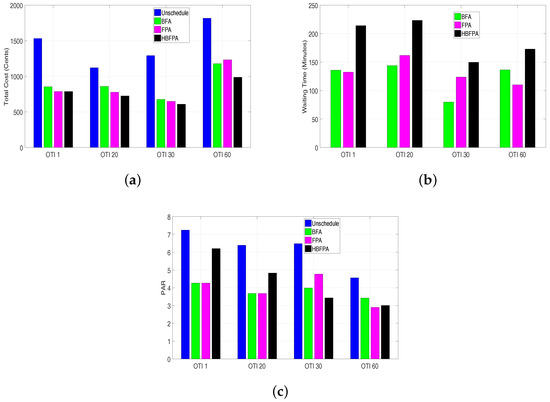
Figure 6.
Total cost, waiting time and peak to average ratio for a single home using critical peak pricing. (a) Electricity cost using operational time interval of 1, 20, 30, 60 min; (b) Waiting time using operational time interval of 1, 20, 30, 60 min; (c) Peak to average ratio using operational time interval of 1, 20, 30, 60 min.
Table 5.
Electricity cost for 24 h (for single home).
Cost Using RTP
Cost minimization is the main objective for which the hybrid heuristic technique is designed to optimize the DSM using the RTP tariff. Figure 7a elucidates EC of all OTIs. The figures clearly demonstrate that benchmark schemes outperformed in terms of EC; however, the proposed hybrid algorithm outperformed by sacrificing UC with affordable WT. EC values for single homes using RTP are shown in Table 6.
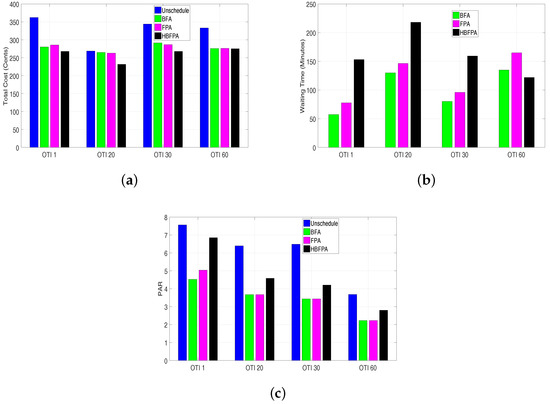
Figure 7.
Total cost, waiting time and peak to average ratio for single home using real time pricing. (a) Electricity cost using operational time interval of 1, 20, 30, 60 min; (b) Waiting time using operational time interval of 1, 20, 30, 60 min; (c) Peak to average ratio using operational time interval of 1, 20, 30, 60 min.
Table 6.
Electricity cost for 24 h (For single home).
5.1.3. Peak-to-Average Ratio
PAR is the value of maximum peak created to the average of total load which a user consumes in a day. The objective is to reduce PAR, which guarantees that created peaks are minimal. PAR for single homes using both pricing tariffs are explained as follows.
PAR Using CPP
When the proposed hybrid algorithm is applied to compute PAR using CPP, the proposed technique outperforms then state of the art schemes. The PAR reduction helps the utility to maintain its constancy and finally the price reduces. The HBFPA schedules the appliances efficiently and turns the appliances ‘ON’ in off-peak hours to avoid generating extra peaks in on-peak hours as shown in Figure 6c for four different OTIs using CPP tariffs. PAR values for a single home using CPP are shown in Table 7.
Table 7.
Peak to average ratio for 24 h (for single homes).
PAR Using RTP
Figure 7c shows PAR using RTP tariffs for different OTIs (1, 20, 30 and 60 min). PAR is calculated by a proposed algorithm that gives good results with maximum PAR reduction. Hence, it can be clearly observed that our hybrid algorithm performs efficiently in the variable OTIs and improves the efficacy of scheduler. PAR values for single homes using RTP are shown in Table 8.
Table 8.
Peak to average ratio for 24 h (for single homes).
5.1.4. Waiting Time
EC is the important parameter in HEM. There exists a trade-off between EC and UC. Here, UC is basically the WT of appliances to turn them ‘ON’ (how much a user waits to turn the appliances ‘ON’).
Waiting Time Using CPP
Figure 6b shows a WT comparison for four different OTIs using CPP price tariffs. If the user turns appliance an ‘ON’ without considering peak hours, then there will be no WT in that case. By applying the proposed algorithm, consumer have to wait for off-peak hours. The selection of variable OTI affects the WT. It can be easily evaluated that the proposed hybrid algorithm has maximum affordable WT than aforementioned algorithms. WTs for single homes using CPP are shown in Table 9.
Table 9.
Waiting time for 24 h (for single homes).
Waiting Time Using RTP
HBFPA successfully achieves the PAR and cost reduction using RTP tariff. However, there exists a trade-off between EC and UC. Therefore, users are unable to attain much UC. WT of four scenarios using RTP are shown in Figure 7b. It is concluded that affordable WT (delay) with maximum UC is attained. However, for EC reduction, the user’s comfort is compromised. WTs for a single home using RTP are shown in Table 10.
Table 10.
Waiting time for 24 h (for single homes).
5.2. For Multiple Homes
We optimize the appliances using BFOA, FPA and the proposed hybrid heuristic algorithm for multiple homes (10, 30 and 50 homes). Different homes may have different PRs. Therefore, the proposed algorithm has selected PRs dynamically. Random PRs are mentioned in Table 11.
Table 11.
Random power ratings in (kWh).
5.2.1. OTI 1 min
Load consumption, EC, PAR and WT for multiple homes using both pricing tariffs with OTI of 1 min are explained as follows.
Load Using CPP
Figure 8 clearly illustrates the load scheduling for multiple homes (10, 30 and 50 homes) using real-time scenarios with random power ratings and power consumption patterns. The notable thing in figures is that BFOA and FPA performed well while shifting load from on-peak to off-peak hours; however, the proposed hybrid algorithm outperformed.
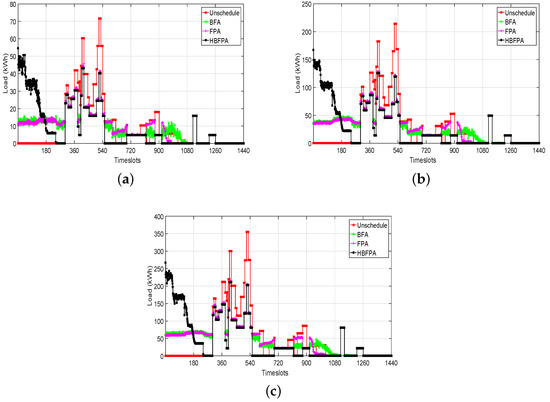
Figure 8.
Load for multiple homes: (10, 30 and 50) using critical peak pricing. (a) load using operational time interval of 1 min for 10 homes; (b) load using operational time interval of 1 min for 30 homes; (c) load using operational time interval of 1 min for 50 homes.
EC, PAR and WT Using CPP
We implemented HBFPA for multiple homes to reduce overall cost, reduction in PAR with affordable WT and, as a result of this work, EC per slot is minimized as shown in Figure 9a. Affordable WT is shown in Figure 9b with reduction in PAR as shown in Figure 9c. EC, WT and PAR values for multiple homes are shown in Table 12, Table 13 and Table 14, respectively.
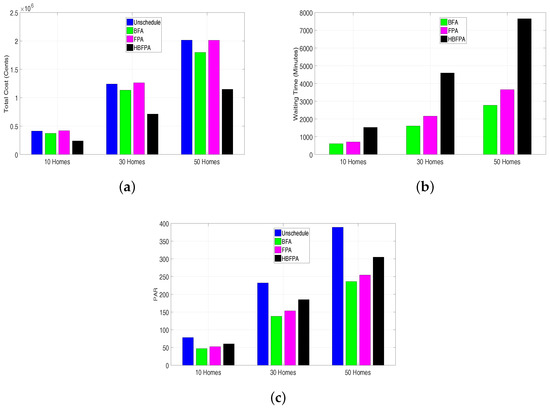
Figure 9.
Electricity cost, waiting time and peak to average ratio for multiple homes: (10, 30 and 50) using critical peak pricing. (a) Electricity cost using operational time interval of 1 min; (b) Waiting time using operational time interval of 1 min; (c) Peak to average ratio using operational time interval of 1 min.
Table 12.
Electricity cost for 24 h (for multiple homes).
Table 13.
Waiting time for 24 h (for multiple homes).
Table 14.
Peak to average ratio for 24 h (for multiple homes).
Load Using RTP
Figure 10 shows load shifting for 10, 30 and 50 homes using OTI of 1 min. It is clearly shown in figures that proposed HBFPA outperformed and beat BFOA and FPA very well.
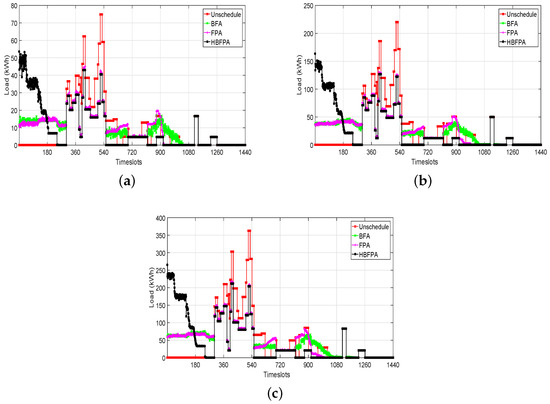
Figure 10.
Load for multiple homes: (10, 30 and 50) using Real time pricing. (a) load using operational time interval of 1 min for 10 homes; (b) load using operational time interval of 1 min for 30 homes; (c) load using operational time interval of 1 min for 50 homes.
EC, WT and PAR Using RTP
The proposed algorithm is implemented on multiple homes using the RTP price tariff. The scheduler schedules the appliances for multiple homes and reduces EC by sacrificing UC. Overall cost reduction is shown in Figure 11a while affordable WT is demonstrated in Figure 11b and minimized PAR is shown in Figure 11c. EC, WT and PAR values for multiple homes are shown in Table 15, Table 16 and Table 17.
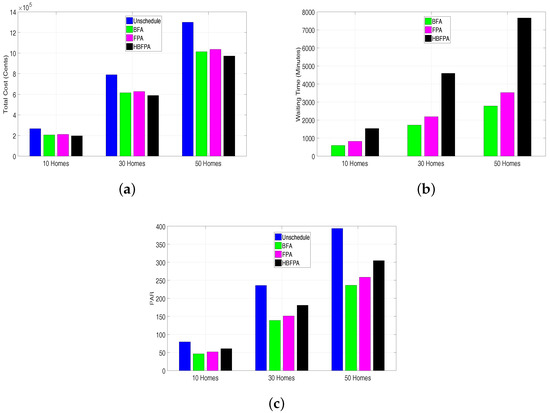
Figure 11.
Electricity cost, waiting time and peak to average ratio for multiple homes: (10, 30 and 50) using real time pricing. (a) Electricity cost using operational time interval of 1 min; (b) Waiting time using operational time interval of 1 min; (c) Peak to average ratio using operational time interval of 1 min.
Table 15.
Electricity cost for 24 h (for multiple homes).
Table 16.
Waiting time for 24 h (for multiple homes).
Table 17.
Peak to average ratio for 24 h (for multiple homes).
5.2.2. OTI 60 min
Load consumption, EC, PAR and WT for multiple homes using both pricing tariffs with OTI of 60 min are explained as follows:
Load Using CPP
We have done simulations with OTI of 60 min using CPP tariffs to reduce the creation of peaks in on-peak hours and proposed HBFPA. HBFPA successfully shifts the load from on-peak hours to off-peak hours. Figure 12 clearly elaborates that the proposed scheme is projected to evade peak formations in any obvious slot of occupied hours.
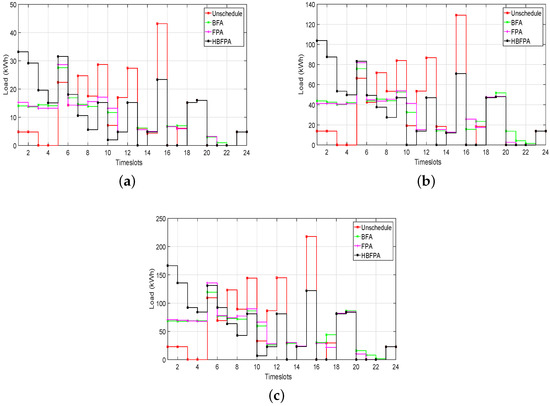
Figure 12.
Load for multiple homes: (10, 30 and 50) using critical peak pricing. (a) load using operational time interval of 60 min for 10 homes; (b) load using operational time interval of 60 min for 30 homes; (c) load using operational time interval of 60 min for 50 homes.
EC, WT and PAR Using CPP
The proposed hybrid algorithm optimizes the problem by reducing cost and PAR with affordable WT using a real-time scenario. Thus, overall cost reduction is shown in Figure 13a and UC or WT is demonstrated in Figure 13b and PAR minimization is illustrated in Figure 13c. EC, affordable WT and minimized PAR values are shown in Table 18, Table 19 and Table 20.
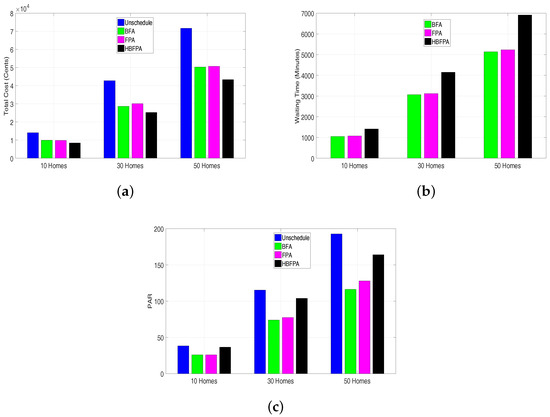
Figure 13.
Electricity cost, waiting time and peak to average ratio for multiple homes: (10, 30 and 50) using critical peak pricing. (a) Electricity cost using operational time interval of 60 min; (b) Waiting time using operational time interval of 60 min; (c) Peak to average ratio using operational time interval of 60 min.
Table 18.
Electricity cost for 24 h (for multiple homes).
Table 19.
Waiting time for 24 h (for multiple homes).
Table 20.
Peak to average ratio for 24 h (for multiple homes).
Load Using RTP
Load plots for multiple homes (10, 30 and 50 homes) using OTI 60 with RTP tariffs are given in Figure 14 for four different OTIs with random PRs and power consumption patterns. HBFPA outperformed in shifting load from on-peak to off-peak hours efficiently for multiple homes (10, 30 and 50 homes) than FPA and BFOA, respectively.
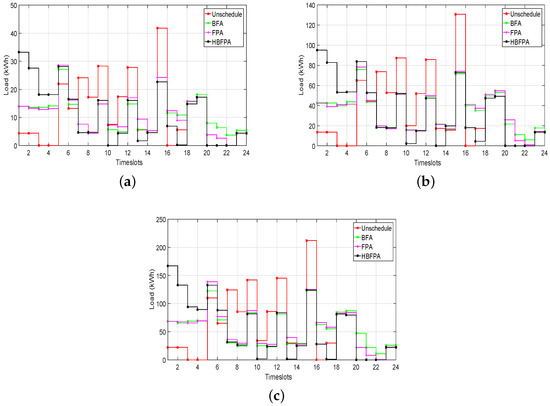
Figure 14.
Load for multiple homes: (10, 30 and 50) using real time pricing. (a) load using operational time interval of 60 min for 10 homes; (b) load using operational time interval of 60 min for 30 homes; (c) load using operational time interval of 60 min for 50 homes.
EC, WT and PAR Using RTP
Scheduling using RTP tariffs is discussed in this section. BFA and FPA outperformed in EC minimization for smart community; however, a implemented hybrid algorithm outperformed the aforementioned algorithms. EC minimization is shown in Figure 15a, UC with affordable WT is shown in Figure 15b and PAR reduction is shown in Figure 15c. EC, affordable WT and PAR reduction values are shown in Table 21, Table 22 and Table 23.
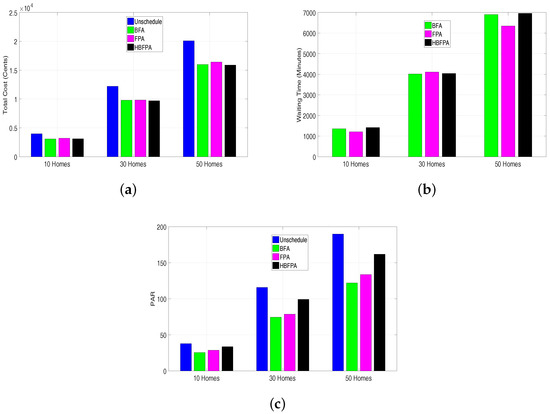
Figure 15.
Electricity cost, waiting time and peak to average ratio for multiple homes: (10, 30 and 50) using real time pricing. (a) Electricity cost using operational time interval of 60 min; (b) Waiting time using operational time interval of 60 min; (c) Peak to average ratio using operational time interval of 60 min.
Table 21.
Electricity cost for 24 h (for multiple homes).
Table 22.
Waiting time for 24 h (for multiple homes).
Table 23.
Peak to average ratio for 24 h (for multiple homes).
Here, an inclination is made that explains that the more a consumer sacrifices his luxury, low price rates will be given to him by utility. Our proposed technique outperforms in the case of different power consumption patterns and random PRs.
5.3. Feasible Regions
In mathematical optimization, a feasible region is the unique set of nominee solutions for the suggested scheme. Four constraints should be preserved while computing feasible regions:
- Min cost, Min Load,
- Min cost, Max Load,
- Max cost, Min Load,
- Max cost, Max Load.
Point ‘P5’ is cutting the overall area at point ‘P2’ in Figure 16 and in Figure 17, which shows the maximum cost in scheduled cases. Therefore, point ‘P5’ shows feasible regions for our objective functions.
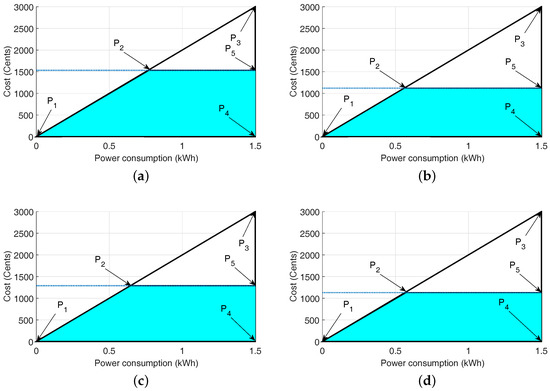
Figure 16.
Feasible regions for a single home using critical peak pricing. (a) Operational time interval of 1 min; (b) Operational time interval of 20 min; (c) Operational time interval of 30 min; (d) Operational time interval of 60 min.
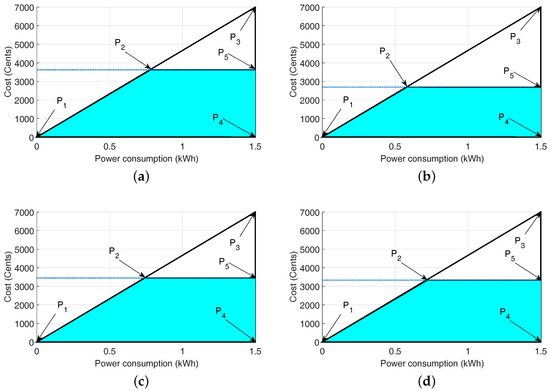
Figure 17.
Feasible regions for a single home using real time pricing. (a) Operational time interval of 1 min; (b) Operational time interval of 20 min; (c) Operational time interval of 30 min; (d) Operational time interval of 60 min.
Feasible Region Using CPP
In this paper, feasible regions are formulated using CPP price tariffs. The pointers (P1, P2, P3, P4, P5) have shown the possible feasible regions against different OTIs. The area of feasible regions is shaded with a cyan color. For details, follow Figure 16.
Feasible Region Using RTP
In this section, feasible regions are formulated using an RTP price tariff. The Pointers (P1, P2, P3, P4, P5) have shown the possible feasible regions against different OTIs using RTP. The area of feasible regions using RTP are shaded with a cyan color. For depth details, follow Figure 17.
5.4. Performance Trade-Off
In this section, the trade-off between two parameters is discussed. Simulation results show the existing trade-off between EC and affordable WT. EC diminishes as the user sacrifices his luxury by deferring his activity. Therefore, to get the benefit in one context, the user has to compromise on some other parameters. The trade-off between EC and UC is demonstrated in the figures above.
6. Conclusions and Future Work
In this research work, DR and DSM are the main factors to maintain a balance between supply and demand of electricity. In this paper, to minimize EC and PAR with an affordable user’s WT, a novel heuristic algorithm has been proposed. Our novel algorithm is proposed using two pricing schemes: CPP and RTP and four performance parameters (EC, PAR, load balancing and UC) are considered to evaluate our proposed algorithm with dynamic PR. Results show the efficacy of a novel heuristic hybrid algorithm HBFPA for a single home and smart community with multiple homes. When CPP is used, the HBFPA has achieved an EC value of 762.3100 cents for a single home as compared to unscheduled load EC value 1131.9 cents at 60 min OTI. The BFOA and FPA have achieved EC values of 952.71 cents and 1042.3 cents, respectively. When RTP is used at 60 min of OTI, the ECs achieved for the unscheduled case, BFOA, FPA and HBFPA are 333.1345, 275.6915, 276.2255 and 275.1495 cents, respectively. The HBFPA has achieved the PAR value 3.2657 as compared to unscheduled case 3.3784 for 60 min OTI using CPP. At 60 min OTI, the average WT of HBFPA, BFOA and FPA are 135, 139.2857 and 147.8571 min, respectively. Similarly, EC and PAR are minimized with an affordable user’s WT by helping the scheduler to schedule the load from on-peak hours to off-peak hours for multiple home scenarios. From the results, it has been cleared that the implemented scheme outperformed the aforementioned existing algorithms. However, there exists a trade-off between the cost and user’s comfort.
In the future, multiple optimization techniques will be integrated with renewable energy resources, dynamic programming and the cloud concept to schedule the home appliances to reduce cost and PAR despite using electricity management controllers. There will be a scenario when some homes may consist of a few number of appliances and there may exist some homes with a greater number of appliances.
Author Contributions
M.A., N.J., and K.A. proposed and implemented the novel schemes; S.I.H., Z.A.K., and D.M. completed the mathematical modeling. All authors together refined the manuscript. Finally, M.A., N.J., responded to the queries of the reviewers.
Funding
The authors extend their appreciation to the Deanship of Scientific Research at King Saud University for funding this work through research group NO (RG-1438-034).
Conflicts of Interest
The authors declare no conflict of interest.
References
- Mehreen, G.; Patidar, S. Understanding the energy consumption and occupancy of a multi-purpose academic building. Energy Build. 2015, 87, 155–165. [Google Scholar]
- Today in Energy—U.S. Energy Information Administration (EIA). Available online: https://www.eia.gov/todayinenergy/detail.php?id=12251 (accessed on 3 August 2018).
- Logenthiran, T.; Srinivasan, D.; Shun, T.Z. Demand side management in smart grid using heuristic optimization. IEEE Trans. Smart Grid 2012, 3, 1244–1252. [Google Scholar] [CrossRef]
- Awais, M.; Javaid, N.; Mateen, A.; Khan, N.; Mohiuddin, A.; Rehman, M.H.A. Meta Heuristic and Nature Inspired Hybrid Approach for Home Energy Management Using Flower Pollination Algorithm and Bacterial Foraging Optimization Technique. In Proceedings of the 2018 IEEE 32nd International Conference on Advanced Information Networking and Applications (AINA), Krakow, Poland, 16–18 May 2018; pp. 882–891. [Google Scholar] [CrossRef]
- Tariq, M.; Khalid, A.; Ahmad, I.; Khan, M.; Zaheer, B.; Javaid, N. Load Scheduling in Home Energy Management System Using Meta-Heuristic Techniques and Critical Peak Pricing Tariff. In Proceedings of the International Conference on P2P, Parallel, Grid, Cloud and Internet Computing, Barcelona, Spain, 8–10 November 2017; Springer: Cham, Switzerland, 2017; pp. 50–62. [Google Scholar]
- Rahim, S.; Javaid, N.; Ahmad, A.; Khan, S.A.; Khan, Z.A.; Alrajeh, N.; Qasim, U. Exploiting heuristic algorithms to efficiently utilize energy management controllers with renewable energy sources. Energy Build. 2016, 129, 452–470. [Google Scholar] [CrossRef]
- Mahmood, D.; Javaid, N.; Alrajeh, N.; Khan, Z.A.; Qasim, U.; Ahmed, I.; Ilahi, M. Realistic scheduling mechanism for smart homes. Energies 2016, 9, 202. [Google Scholar] [CrossRef]
- Ahmad, A.; Khan, A.; Javaid, N.; Hussain, H.M.; Abdul, W.; Almogren, A.; Alamri, A.; Niaz, I.A. An Optimized Home Energy Management System with Integrated Renewable Energy and Storage Resources. Energies 2017, 10, 549. [Google Scholar] [CrossRef]
- Ma, K.; Yao, T.; Yang, J.; Guan, X. Residential power scheduling for demand response in smart grid. Int. J. Electr. Power Energy Syst. 2016, 78, 320–325. [Google Scholar] [CrossRef]
- Muralitharan, R.S.; Shi, Y. Multiobjective optimization technique for demand side management with load balancing approach in smart grid. Neurocomputing 2016, 177, 110–119. [Google Scholar] [CrossRef]
- López, M.A.; Torre, S.; Martín, S.; Aguado, J.A. Demand-side management in smart grid operation considering electric vehicles load shifting and vehicle-to-grid support. Int. J. Electr. Power Energy Syst. 2015, 64, 689–698. [Google Scholar] [CrossRef]
- Chanda, S.; De, A. A multi-objective solution algorithm for optimum utilization of smart grid infrastructure towards social welfare. Int. J. Electr. Power Energy Syst. 2014, 58, 307–318. [Google Scholar] [CrossRef]
- Khalid, A.; Javaid, N.; Mateen, A.; Khalid, B.; Khan, Z.A.; Qasim, U. Demand side management using hybrid bacterial foraging and genetic algorithm optimization techniques. In Proceedings of the 2016 10th International Conference on Complex, Intelligent, and Software Intensive Systems (CISIS), Fukuoka, Japan, 6–8 July 2016; IEEE: Piscataway, NJ, USA, 2016; pp. 494–502. [Google Scholar]
- Vardakas, J.; Zorba, N.; Verikoukis, C.V. A survey on demand response programs in smart grids: Pricing methods and optimization algorithms. IEEE Commun. Surv. Tutor. 2015, 17, 152–178. [Google Scholar] [CrossRef]
- Aslam, S.; Iqbal, Z.; Javaid, N.; Khan, Z.A.; Aurangzeb, K.; Haider, S.I. Towards efficient energy management of smart buildings exploiting heuristic optimization with real-time and critical peak pricing schemes. Energies 2017, 10, 2065. [Google Scholar] [CrossRef]
- Gupta, I.; Anandini, G.N.; Gupta, M. An hour wise device scheduling approach for demand side management in smart grid using particle swarm optimization. In Proceedings of the 2016 National Power Systems Conference (NPSC), Bhubaneswar, India, 19–21 December 2016; IEEE: Piscataway, NJ, USA, 2016. [Google Scholar]
- Geem, Z.W.; Yoon, Y. Harmony search optimization of renewable energy charging with energy storage system. Int. J. Electr. Power Energy Syst. 2017, 86, 120–126. [Google Scholar] [CrossRef]
- Valenzuela, L.; Valdez, F.; Melin, P. Flower pollination algorithm with fuzzy approach for solving optimization problems. In Nature-Inspired Design of Hybrid Intelligent Systems; Springer: Cham, Switzerland, 2017; pp. 357–369. [Google Scholar]
- Dubey, H.M.; Pandit, M.; Panigrahi, B.K. A biologically inspired modified flower pollination algorithm for solving economic dispatch problems in modern power systems. Cognit. Comput. 2015, 7, 594–608. [Google Scholar] [CrossRef]
- Kakran, S.; Chanana, S. Smart operations of smart grids integrated with distributed generation: A review. Renew. Sustain. Energy Rev. 2018, 81, 524–535. [Google Scholar] [CrossRef]
- Mary, G.A.; Rajarajeswari, R. Smart grid cost optimization using genetic algorithm. Int. J. Res. Eng. Technol. 2015, 3, 282–287. [Google Scholar]
- Bharathi, C.; Rekha, D.; Vijayakumar, V. Genetic Algorithm Based Demand Side Management for Smart Grid. Wirel. Pers. Commun. 2017, 93, 481–502. [Google Scholar] [CrossRef]
- Whitley, D. A genetic algorithm tutorial. Stat. Comput. 1994, 4, 65–85. [Google Scholar] [CrossRef]
- Hezam, I.; Abdel-Baset, M.; Hassan, B. A hybrid flower pollination algorithm with tabu search for unconstrained optimization problems. Inf. Sci. Lett. 2016, 5, 29–34. [Google Scholar] [CrossRef]
- Prerna, S.; Kothari, A. Linear antenna array optimization using flower pollination algorithm. SpringerPlus 2016, 5, 306. [Google Scholar]
- Graditi, G.; di Somma, M.; Siano, P. Optimal Bidding Strategy for a DER aggregator in the Day-Ahead Market in the presence of demand flexibility. IEEE Trans. Ind. Electron. 2018, 66, 1509–1519. [Google Scholar]
- Graditi, G.; di Silvestre, M.L.; Gallea, R.; Sanseverino, E.R. Heuristic-based shiftable loads optimal management in smart micro-grids. IEEE Trans. Ind. Inf. 2015, 11, 271–280. [Google Scholar] [CrossRef]
- Ferruzzi, G.; Cervone, G.; Monache, L.D.; Graditi, G.; Jacobone, F. Optimal bidding in a Day-Ahead energy market for Micro Grid under uncertainty in renewable energy production. Energy 2016, 106, 194–202. [Google Scholar] [CrossRef]
- Iqbal, Z.; Javaid, N.; Iqbal, S.; Aslam, S.; Khan, Z.A.; Abdul, W.; Almogren, A.; Alamri, A. A Domestic Microgrid with Optimized Home Energy Management System. Energies 2018, 11, 1002. [Google Scholar] [CrossRef]
- El-Hawary, M.E. The smart grid-state-of-the-art and future trends. Electr. Power Compon. Syst. 2014, 42, 239–250. [Google Scholar] [CrossRef]
- Khan, A.; Javaid, N.; Ahmad, A.; Akbar, M.; Khan, Z.A.; Ilahi, M. A priority-induced demand side management system to mitigate rebound peaks using multiple knapsack. J. Ambient Intell. Hum. Comput. 2018, 1–24. [Google Scholar] [CrossRef]
- Khan, A.; Javaid, N.; Khan, M.I. Time and device based priority induced comfort management in smart home within the consumer budget limitation. Sustain. Cities Soc. 2018, 41, 538–555. [Google Scholar] [CrossRef]
- Yang, X.-S. Flower pollination algorithm for global optimization. In Proceedings of the International Conference on Unconventional Computing and Natural Computation, Orléans, France, 3–7 September 2012; Springer: Berlin/Heidelberg, Germany, 2012; pp. 240–249. [Google Scholar]
- Passino, K. Biomimicry of bacterial foraging for distributed optimization and control. IEEE Control Syst. 2002, 22, 52–67. [Google Scholar]
- Balasubramani, K.; Marcus, K. A study on flower pollination algorithm and its applications. Int. J. Appl. Innov. Eng. Manag. 2015, 3, 230–235. [Google Scholar]
- Rodrigues, D.; Yang, X.-S.; de Souza, A.N.; Papa, J.P. Binary flower pollination algorithm and its application to feature selection. In Recent Advances in Swarm Intelligence and Evolutionary Computation; Springer: Cham, The Netherlands, 2015; pp. 85–100. [Google Scholar]


© 2018 by the authors. Licensee MDPI, Basel, Switzerland. This article is an open access article distributed under the terms and conditions of the Creative Commons Attribution (CC BY) license (http://creativecommons.org/licenses/by/4.0/).