Article

Wave Velocity and Power Spectral Density of Hole-Containing Specimens with Different Moisture Content under Uniaxial Compression

1
College of Science, Xi’an University of Science and Technology, Xi’an 710054, China
2
School of Safety Engineering, Xi’an University of Science and Technology, Xi’an 710054, China
3
China Gezhouba Group No.5 Engineering Co., Ltd., Yichang 443002, China
*
Author to whom correspondence should be addressed.
Energies 2018, 11(11), 3166; https://doi.org/10.3390/en11113166
Submission received: 13 October 2018 / Revised: 6 November 2018 / Accepted: 13 November 2018 / Published: 15 November 2018

Abstract

:
The gas drainage borehole is a typical hole-containing structure, and its failure is similar to the hole-containing specimen. To study the characteristics of wave velocity and power spectral density of the hole-containing specimens with different moisture content, an ultrasonic test of the hole-containing specimens during destruction was carried out. A waveform with different moisture contents was recorded by the RSM-SY7 system. The wave velocity and power spectral density was calculated to analyze its relationship with moisture content and degree of damage. The results show that the wave velocity of the hole-containing specimens gradually decreases during the destruction. There were 3 stages of attenuation of wave velocity during the destruction, which were stable, slightly reduced, and rapidly decreasing stages. Changes in moisture content would cause changes of duration of the three stages. The power spectral density gradually decreases during the destruction. The moisture content affected the attenuation mode of the power spectral density and the amount of attenuation. In the detecting of the gas borehole, the wave velocity and the power spectral density can be used to locate the damage area. This research provides a theoretical basis for detection engineering.

1. Introduction

The gas drainage borehole is a typical hole-containing structure, and the failure of a gas drainage hole is similar to the hole-containing specimen. By studying the failure process of the hole-containing specimens, the damage area around the hole can be obtained, and the failure mechanism of the hole-containing specimens can be revealed, which provides theoretical guidance for underground gas drainage drilling engineering. During the destruction of the hole-containing specimens, many cracks form around the hole [1].
As an ultrasonic wave has strong sensitivity to the crack, multiple reflections and refractions will be generated at the edge of crack, and a strain phase difference is formed at the edge. That leads to friction at the interface of air and solid, and converting mechanical energy into heat energy. Therefore, the energy carried by the ultrasonic wave is consumed [2,3]. That eventually leads to the wave velocity reducing and amplitude attenuating. All these changes of parameters can be attributed to the problem of ultrasonic waves propagating in fractured rock. In response to this problem, scholars have carried out a lot of research.
To reveal the damage characteristics of rock, scholars have carried out a lot of acoustic research from the perspective of time domain and frequency domain. First, through the method of time domain analysis, scholars have systematically studied the anisotropy of wave velocity in rock, including the relationship of wave velocity and internal crack [4,5], the anisotropy of wave velocity in rock from the perspective of joint systems (or joint structures which are consisted of two parts of rock and one interface at least) [6], and the failure process of rock [7]. They found that the wave velocity of incident wave parallel to the interface is faster than perpendicular to the interface.
At the same time, as the quality factor (defined by Equation (1)) is a dimensionless parameter that describes how damped a rock is when the sound wave passing through, scholars also try to use it to study the internal features of the rock [8,9], for instance the pore inside the rock [8], the angiography of the borehole wall [10], model of quality factor for argillaceous sandstone [11]. In addition, scholars have combined rock ultrasonic research with rock cracking [12], microstructure [13,14], clay content [15,16], permeability [17], and moisture content [18]. Then, finding that the wave velocity and power spectral density can be applied to rock motion identification [19], surface detection [20], fault detection [21], rock classifying [22], and interface detection [23], some scholars have gradually introduced the acoustic method into the field of rock damage. They analyzed the waveforms to find more valuable information, such as the relationship of phase velocity and the integrity of rock [24], the connection of limestone quality and longitudinal wave velocity [25], and the affiliation of rock strength and wave velocity [26].
Q ( ω ) = ω 2 α ( ω ) C r ( ω )
where α(ω) is the attenuation coefficient, Cr(ω) is the velocity of specimen, ω is angular frequency.
Although great progress has been made in the ultrasonic research of rock, the damage of hole-containing specimens is mainly based on traditional experimental methods. A compression test of hole-containing gypsum specimens was carried out by Lajtai [27] and Carter [28]. In their experiments, the fractured area of specimens was divided into far-field cracks, main cracks, and damaged area. Later, some scholars studied the crack evolution of a rock in different conditions by RFPA2D [29,30], statistical methods [31], digital speckle correlation measurement [32] and PFC [33]. The failure process of the perforated specimens was analyzed, and the relationship between the dip angle and the failure type at the macroscopic level was obtained. The existence of three types of failure modes was verified.
However, the wave velocity and power spectral density of the failure process of a hole-containing specimen rarely appear. Therefore, this paper focuses on the wave velocity and power spectral density of a hole-containing specimen during the progressive destruction. The waveform of a hole-containing specimen during the failure was obtained. Then, the wave velocity and power spectral density was calculated to find the relationship of wave velocity, power spectral density and the damage of specimens.

2. Method and Theory

2.1. Calculation of Velocity

Vp measurements were carried out according to the ISO1920-7:2004 (International) standard. According to the standard, the device includes a transmitter and a receiver that generate the ultrasonic waves. The transmitter and the receiver should be applied on the two parallel faces of a rock specimen having a determined length (L) and trigger a series of ultrasound pulses. The device calculates the time interval (t) between the start and the reception of the pulses. The Vp in the specimen is calculated as Equation (2):
V p = L t

2.2. Power Spectral Density Estimation Method

The power spectral density was calculated by autocorrelation (or autocovariance) function method. For the waveform data x(t), find the correlation function Cx(τ) of the waveform [34,35]:
C x ( τ ) = lim T 1 T T 2 T 2 x ( t ) x ( t + τ ) d t
Then according to the Wiener-Khinchin theorem, the Fourier transform was performed on the correlation function to obtain the power spectral density [36,37]:
C x ( τ ) F lim T | F T ( ω ) | 2 T = S x ( ω )
where Sx(ω) is power spectral density, T is signal period.

3. Experiments Details

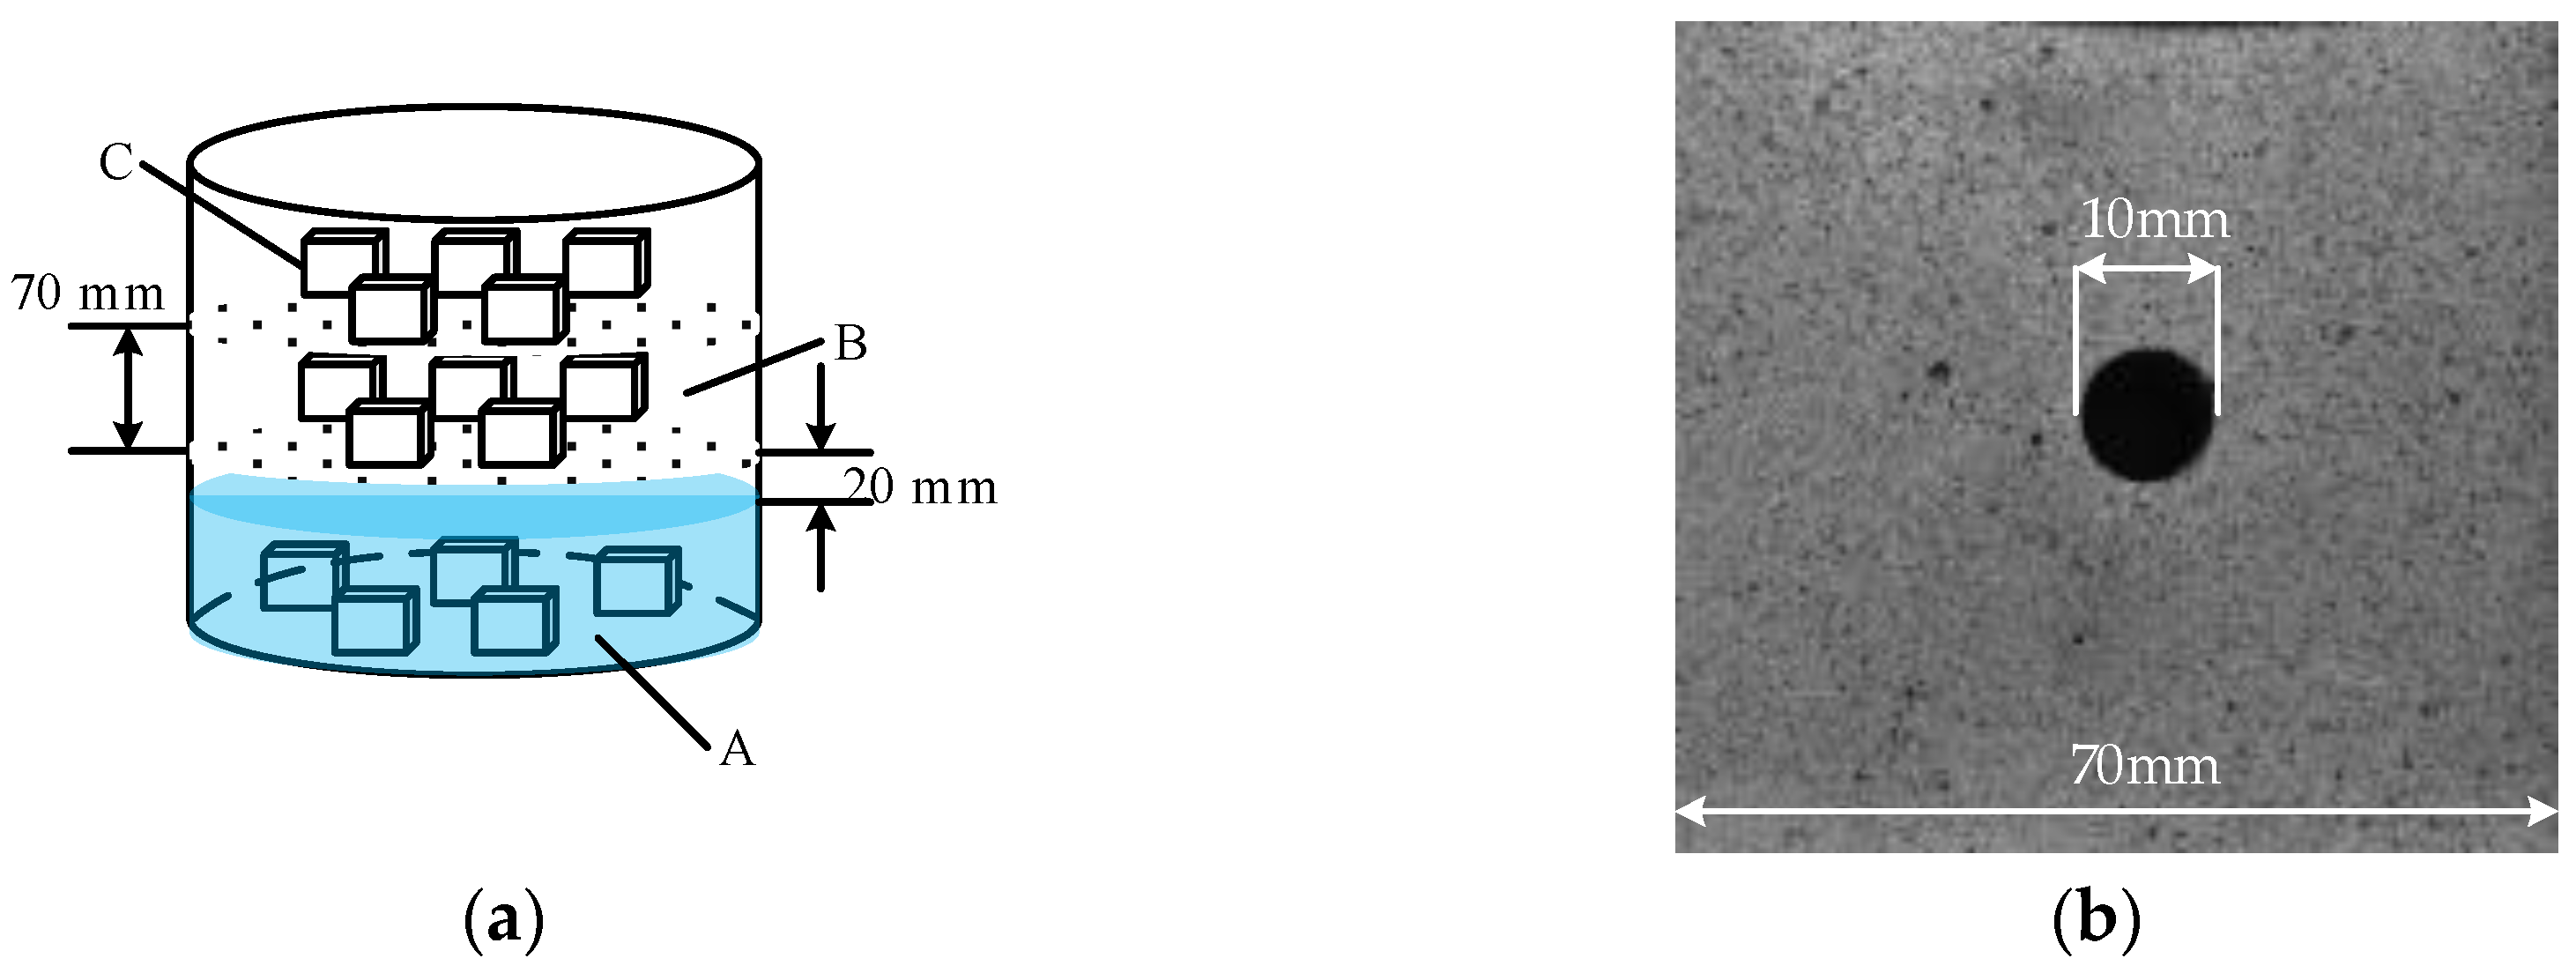
3.1. Preparation of Hole-Containing Specimens with Different Moisture Contents

Our experiment simulates the damage process of a gas extraction borehole, which is arranged on the side of the roadway, as shown in Figure 1 [38]. Such a borehole is a typical cavity structure. The process of a gas extraction borehole destroyed by the ground stress can be regarded as the damage process of the hole-containing specimen. Usually, the borehole is arranged in the coal seam, and the physical and mechanical properties of coal in different places will be significantly different. This paper focuses on the destruction process of brittle coal, so the specimen prepared requires high brittleness. Compared with cement-based materials, the destruction process of gypsum is closer to brittle fracture. Therefore, gypsum materials are selected in this paper.
First, gypsum was mixed with water at a mass ratio of 7:3 and poured into a 70 mm × 70 mm × 70 mm square box. A prefabricated drilling device is placed in the center of the box. All specimens were air-dried and placed in a cool, ventilated place for 30 days. Then all specimens were taken out, and the surface of the specimens was polished by a JKSHM-200S (Jieke Machinery Factory, Jiangyan, Jiangsu, China) programmable grinding machine. If a lot of pores existed in the surface, the pores should be filled with gypsum powder to keep the surface flat.
All specimens were divided into 4 groups, which are A, B, C, and D. Group A was saturated aqueous group, group B and C were controlled moisture content, and group D was dry control group. Each group had 5 Specimens. Among them, the specimens were placed in an airtight container in the saturated aqueous group, and the liquid level in the container must be 20 mm above the top surface of the specimens. Then group B was placed in the top of group A. The bottom of group B to the top the liquid level must be 20 mm. Last, group C was placed in the top of group B. The bottom of group C to the bottom of group B must be 70 mm, as shown in Figure 2. After that, weighed once every 24 h and recorded the mass of specimens, as shown in Table 1.

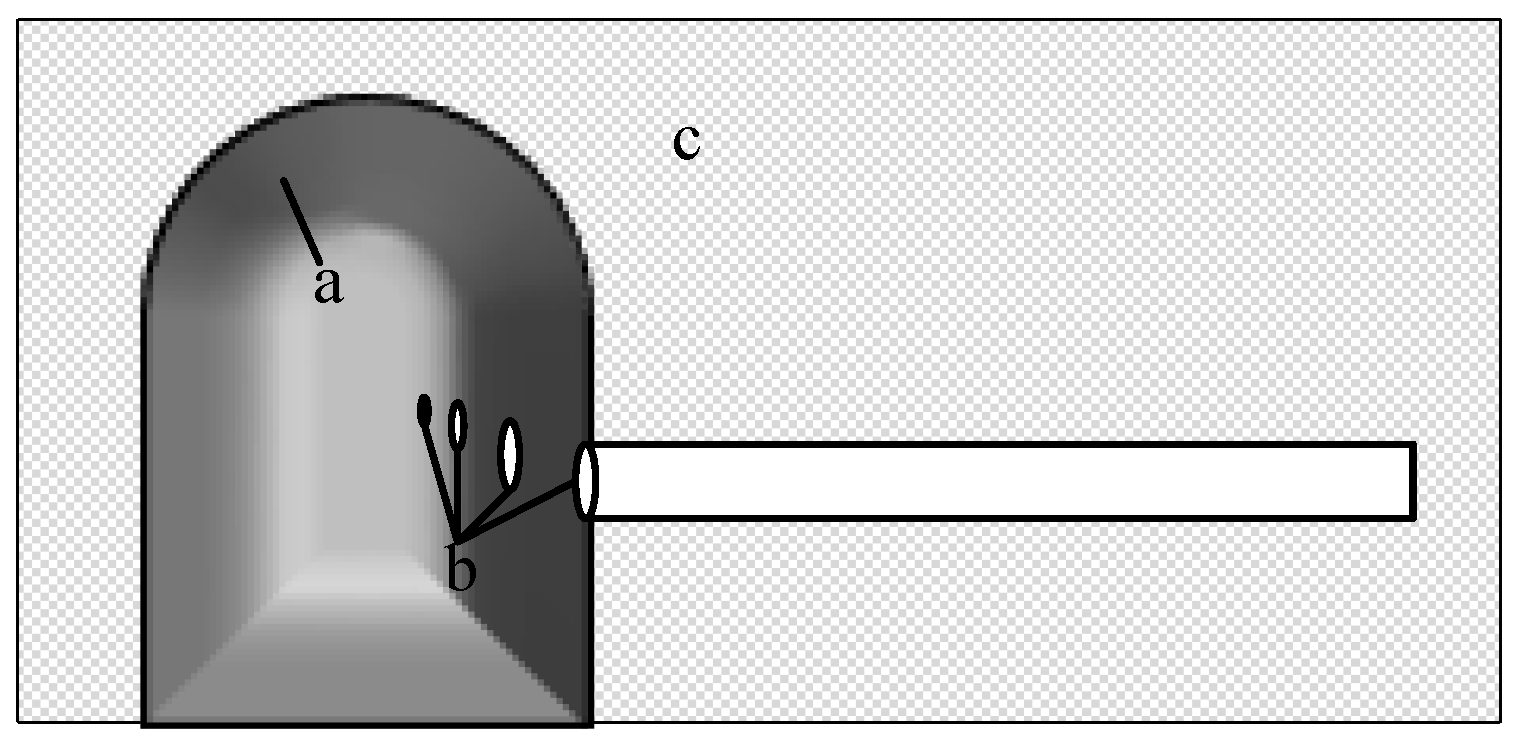
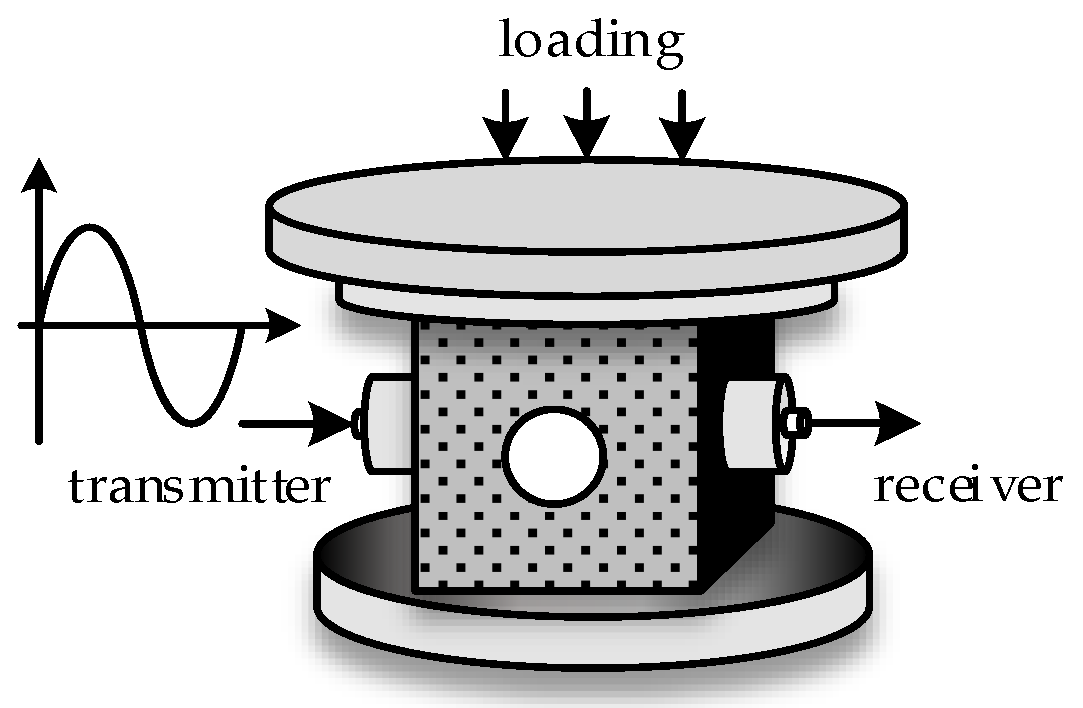
3.2. Wave Velocity Measurement Test Process

After the specimens are placed on the base of the test machine, the coupling agent is applied to the left and right sides of the specimens, and the transmitter and the receiver of the RSM-SY7 (Mechanics Institute of Chinese Academy of Sciences, Wuhan, Hubei, China) are attached, as shown in Figure 3. The test loading mode is displacement control, the loading rate is 0.05 mm/min, and the acquisition frequency of press is 1 Hz. The waver’s transmission mode was set to continuous transmission with 512 µs sampling length. Before the test machine starts to press down, the measurement is performed to obtain the initial ultrasonic waveform of the specimen. The initial state parameter of the specimens is calculated. Then the waveform data is measured with every 1 kN rising of the axial pressure until the specimen is destroyed.

4. Results and Discussion

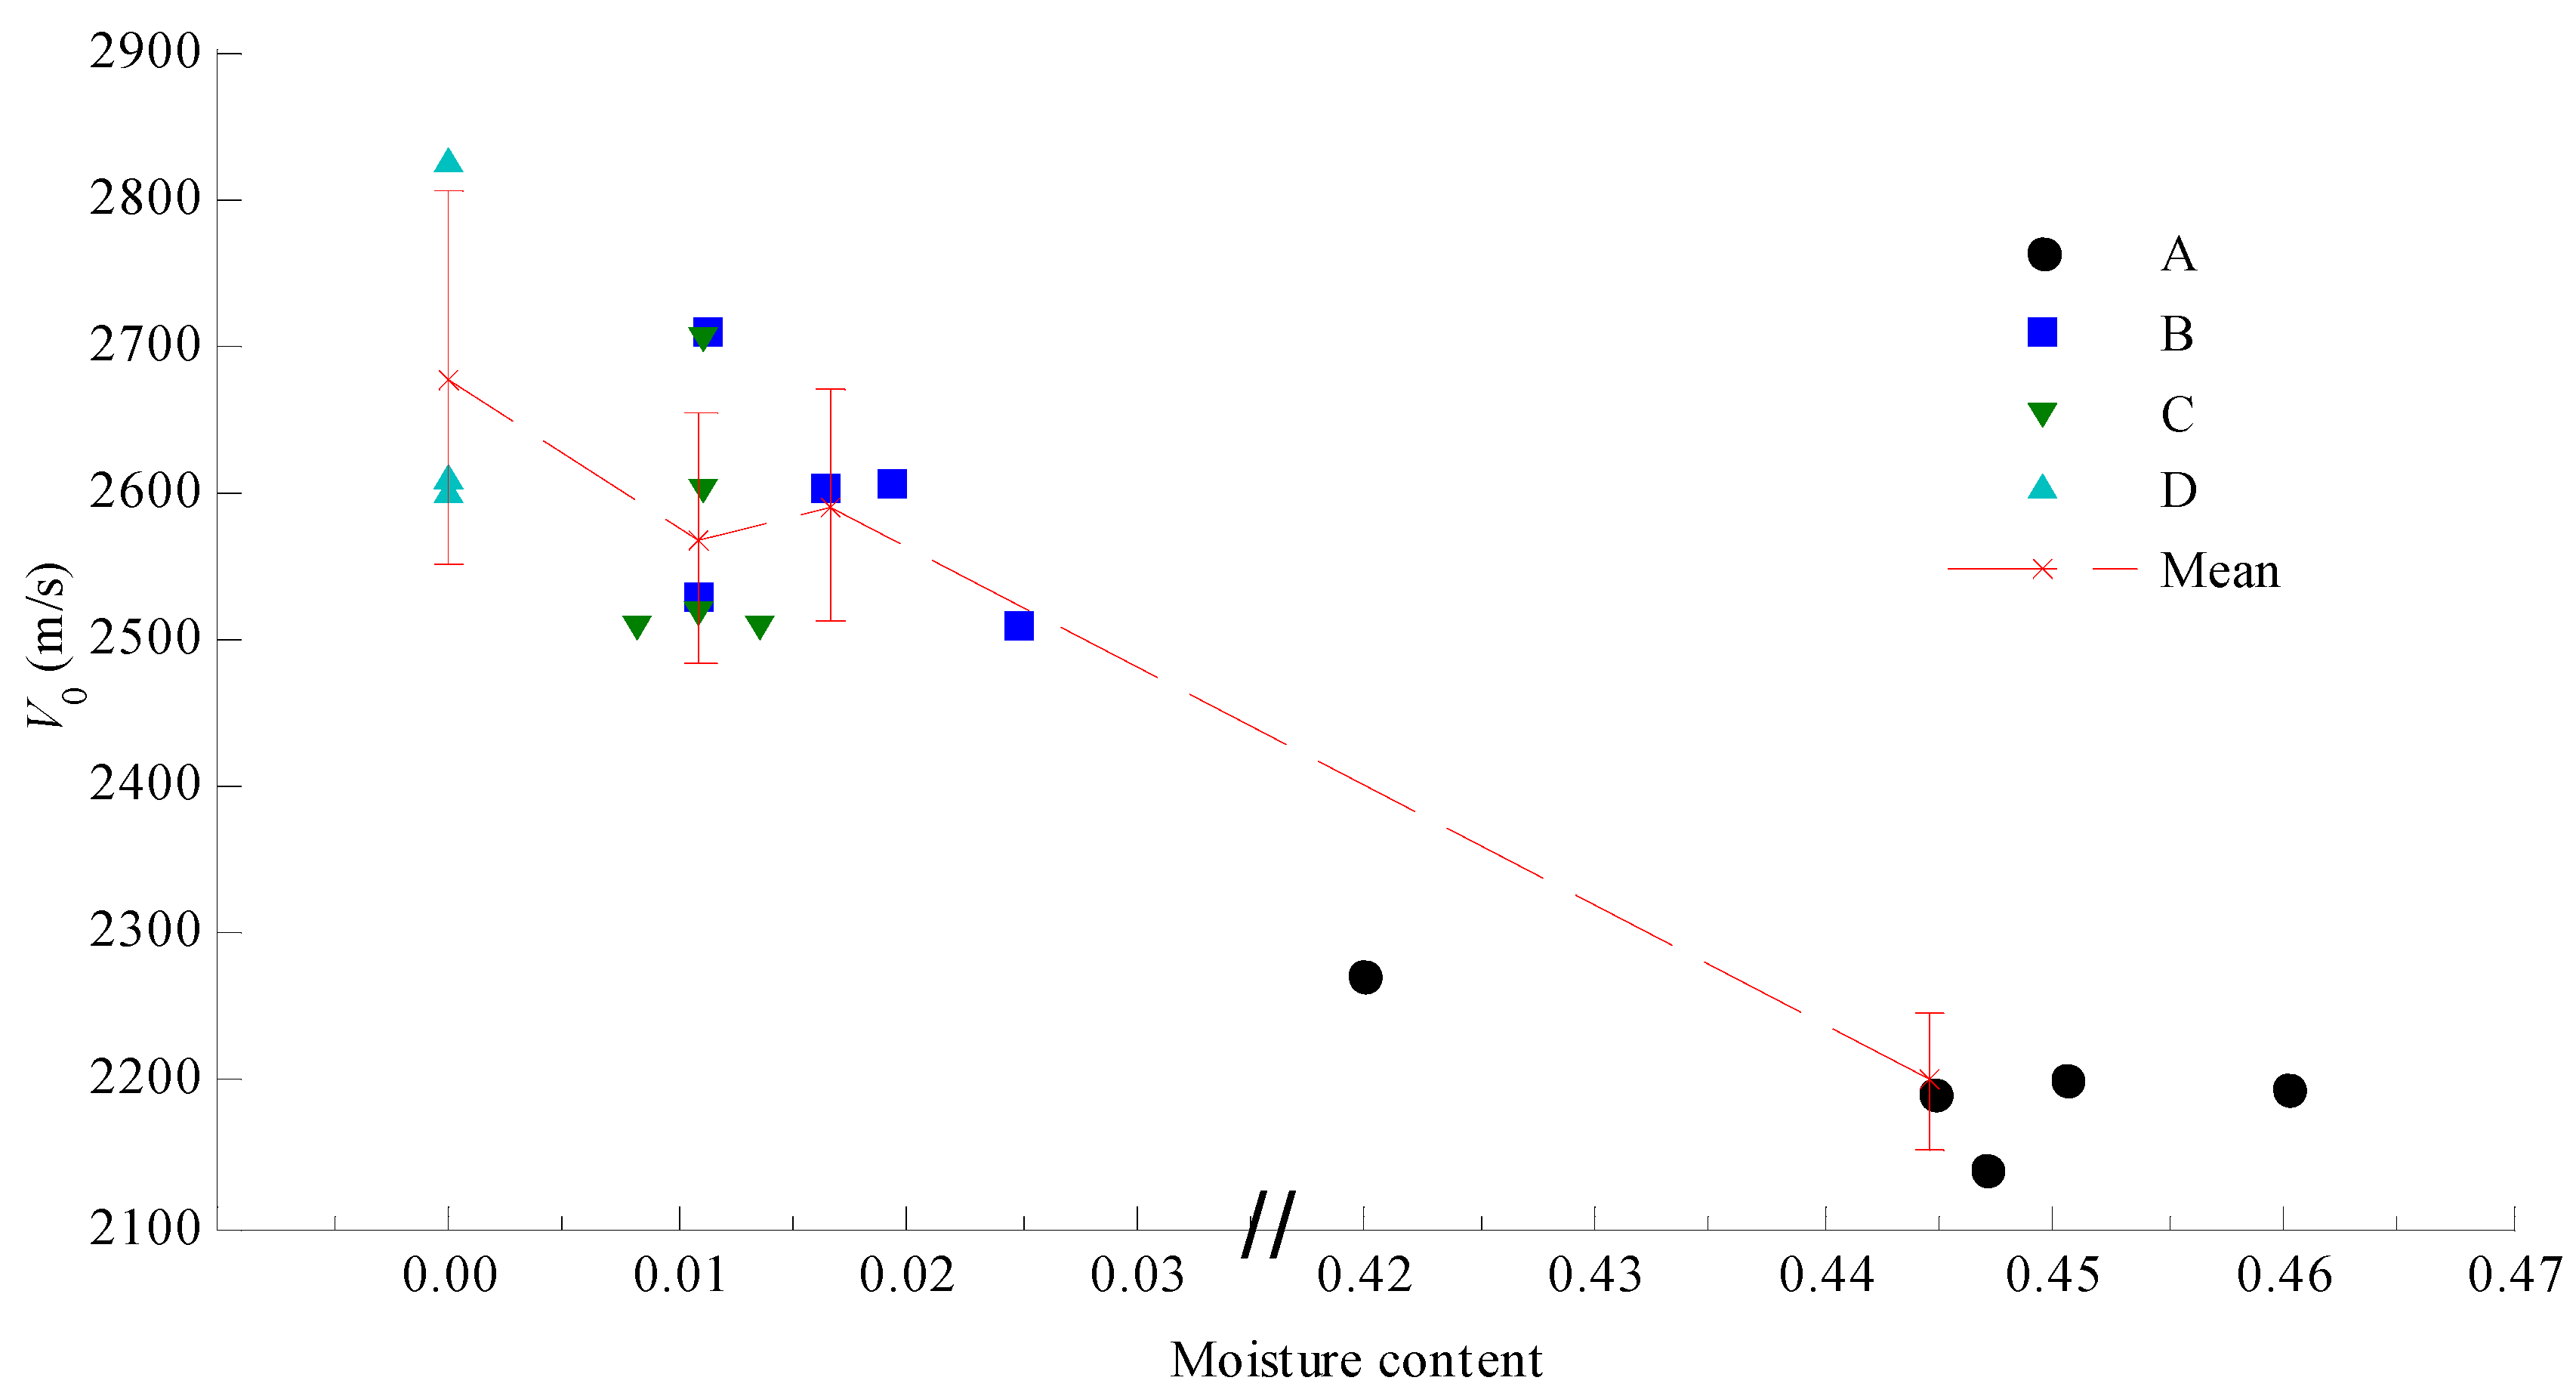
4.1. Initial Wave Velocity of Specimens

Figure 4 shows the initial wave velocity of specimens with different moisture contents. The initial wave velocity of the specimens of group A is among 2140.61 and 2272.58 m/s, and the average wave velocity is 2200.20 m/s. The initial wave velocity of the specimens of group B is among 2483.21~2670.00 m/s, and the average wave velocity is 2566.43 m/s. The wave velocity of the specimens of group C is among 2481.79 and 2579.63 m/s, and the average wave velocity is 2529.01 m/s. The wave velocity of the dried specimens is among 2532.80 and 2474.41 m/s, and the average wave velocity is 2574.02 m/s. Although there is a small fluctuation in the initial wave velocity of the specimens with the same moisture content, the data show a tendency that the initial wave velocity gradually decreases as the moisture content increases. This is quite different from the study by Amalokwu [39]. The main reason is that the specimens used in this experiment are gypsum. The combination of gypsum and water produces a chemical reaction. The reaction process is as follows:
CaSO 4 2 H 2 O ( s ) Ca 2 + ( aq ) + SO 4 2 ( aq ) + 2 H 2 O ( l )
That is, the gypsum will dissolve after being in contact with water, forming Ca2+ ions, SO42− ions and water. As the moisture content increases, the process accelerates due to the continued dissolution of Ca2+ ions and SO42− ions and producing a large amount of water. Due to the dissolution, a large number of pores filled with water are generated inside the specimens.
Therefore, the path of the ultrasonic wave passing through the specimens can be considered to be a path which combines water, porosities and solid. When the specimen contains no water, it can be approximately regard as that the wave enters the solid from the transmitter on the left side, and directly goes through the specimen. Then, the wave goes out of specimen from the right side captured by receiver. This process is shown in Figure 3. However, when the specimen contains water, there are more or fewer dissolutions. That makes the specimen more porous. Thus, after entering the solid, the wave could go into the porosities. Then the wave is attenuated, going out of the porosities. This process that the wave goes into and goes out of the porosities could repeat several times. That leads to the path of ultrasonic wave with water containing more void or air than the path without water. As the wave velocity in air is obviously lower than in solid, the wave velocity of the dry specimens will be faster than of the saturated aqueous specimens.
There are 3 types of scatter, as shown in Figure 4. The first is scatter of moisture content in the same group, such as group A. This is caused by the process of water absorption which is uncontrolled. This process would cause a different mass of each specimen, which leads to the scatter of moisture content. The second is scatter of velocity in group D. During the preparation of specimens, it is hard to remove air bubbles in the box, which would cause the anisotropy of velocity. At the same time, as group D contains no water, this will intensify the anisotropy of velocity. The third is scatter of moisture content between group A and the other groups. This is caused by the different method of water absorption. As shown in Figure 2, group A is flooded. However, group B and C is placed above the water. The absorption process can be regarded as that the specimen absorbs the moisture evaporated in the air. Thus, the moisture content of group B and C is significantly lower than group A.

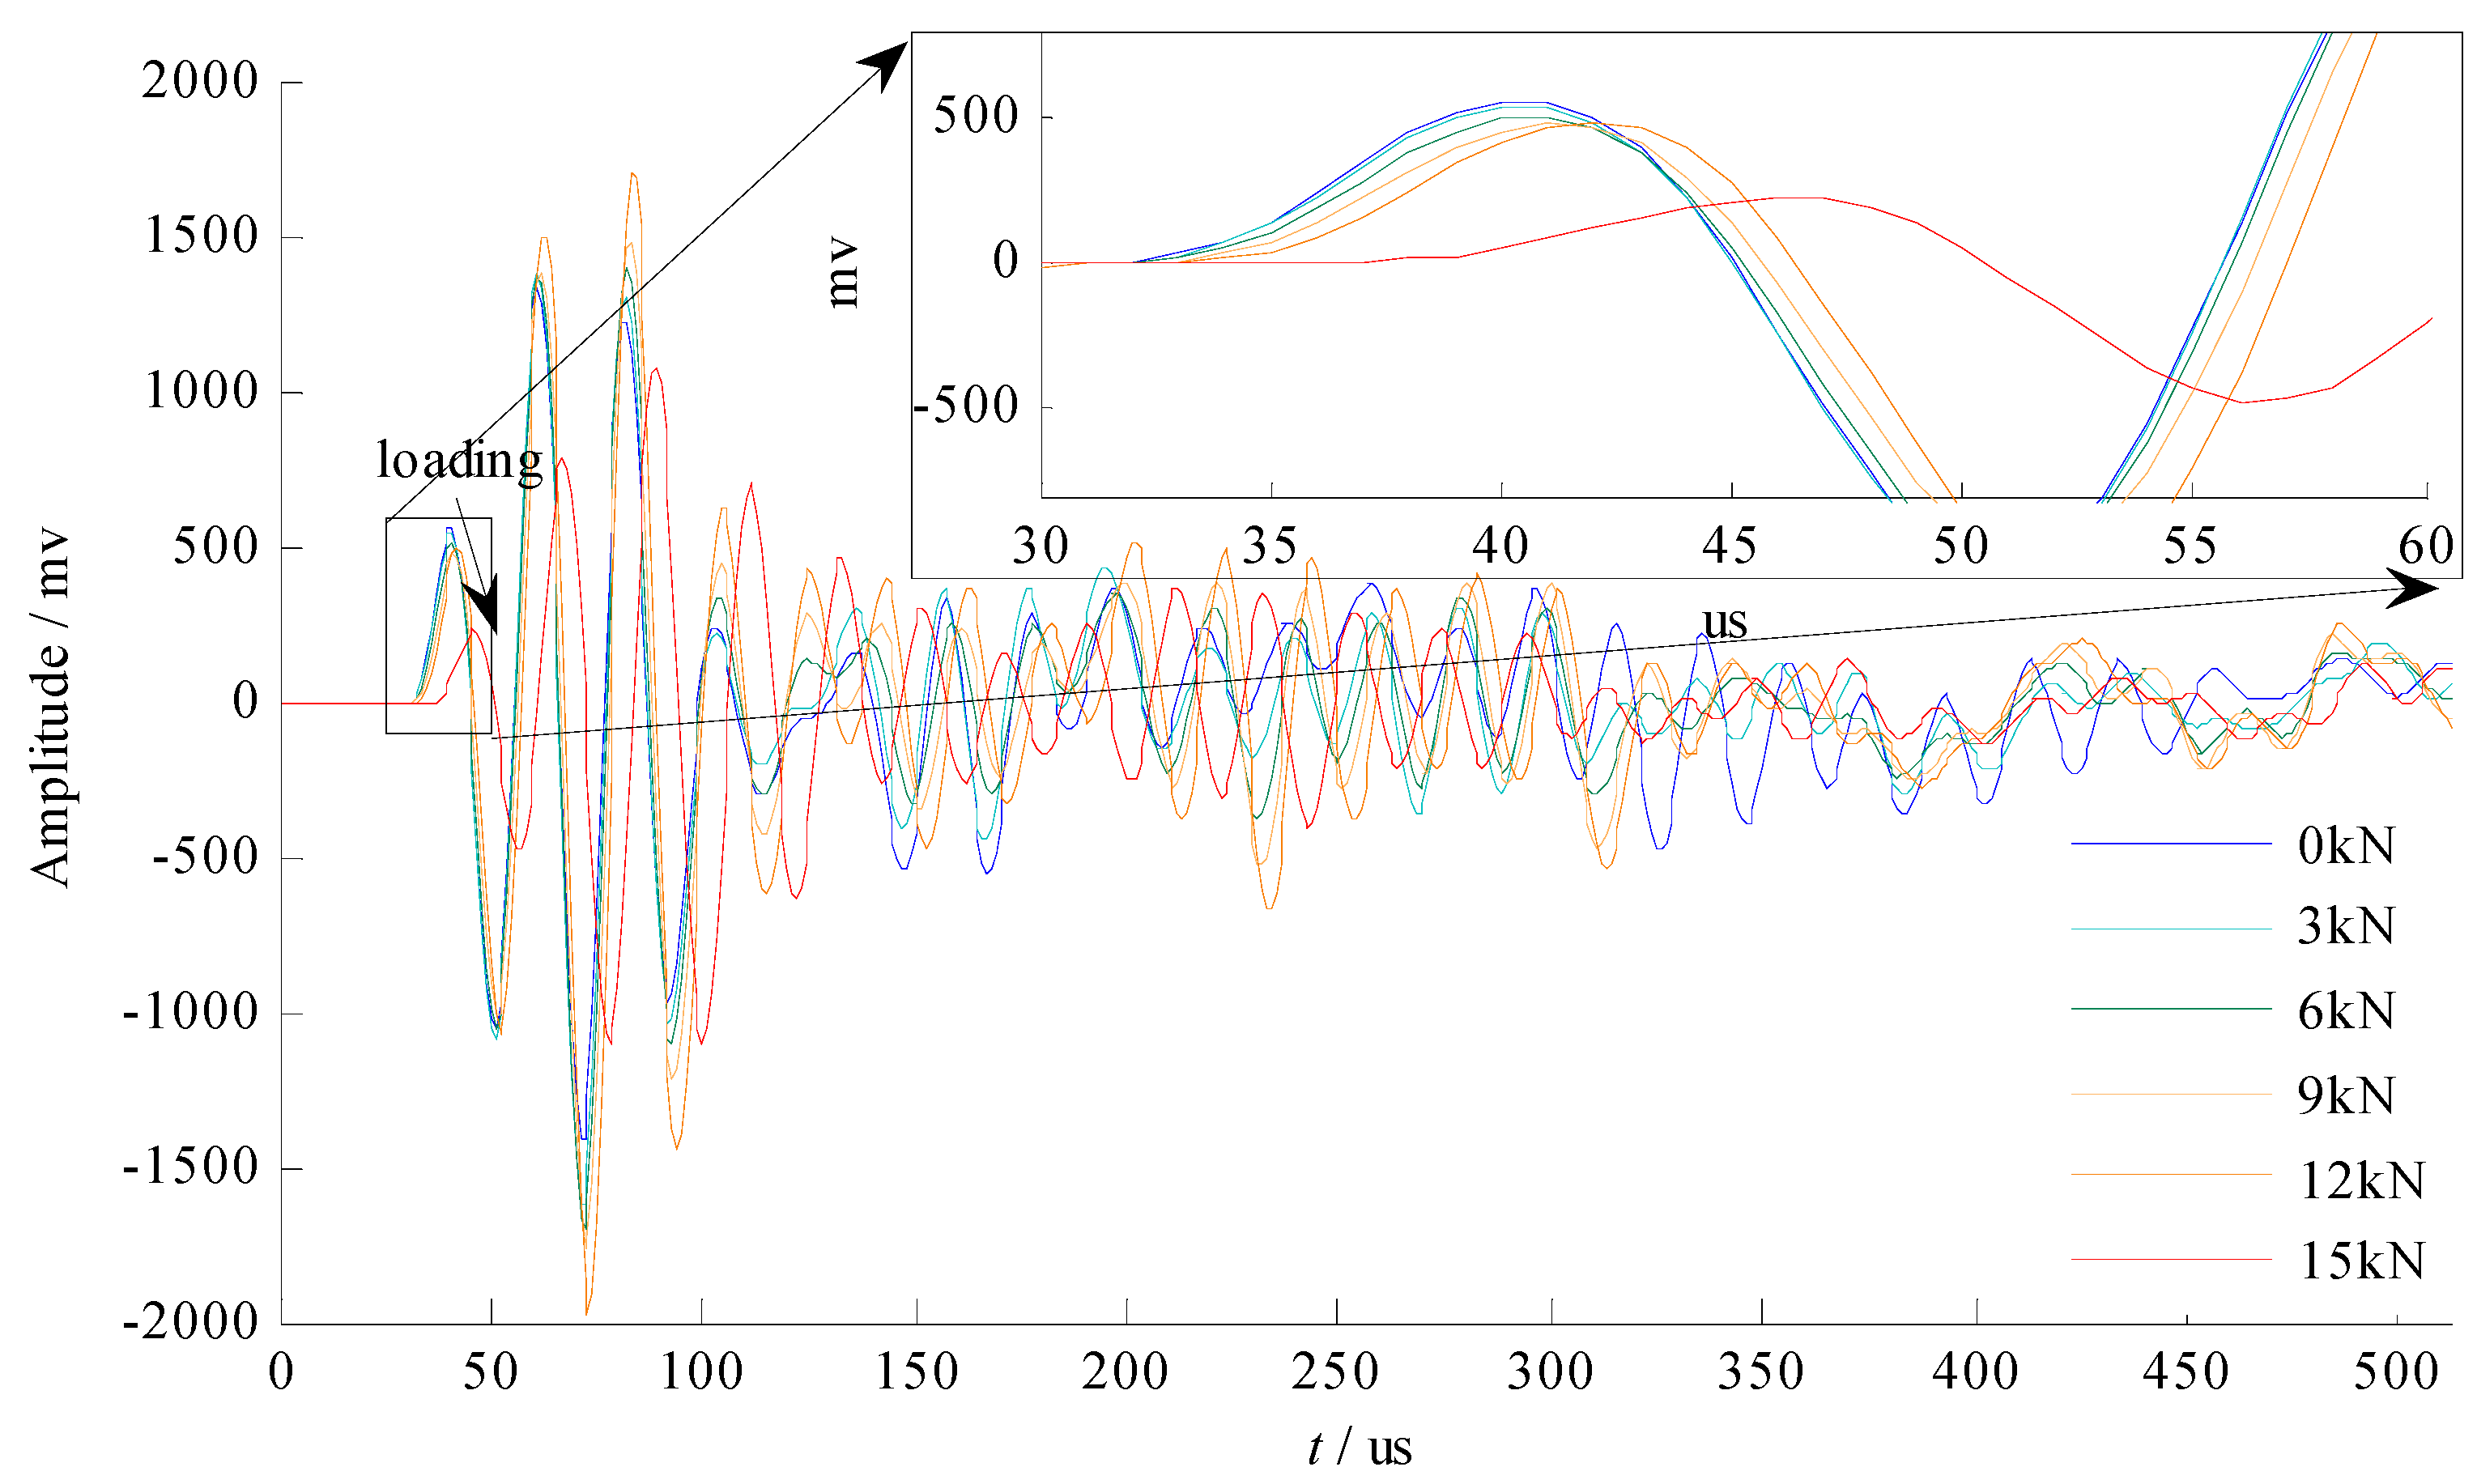
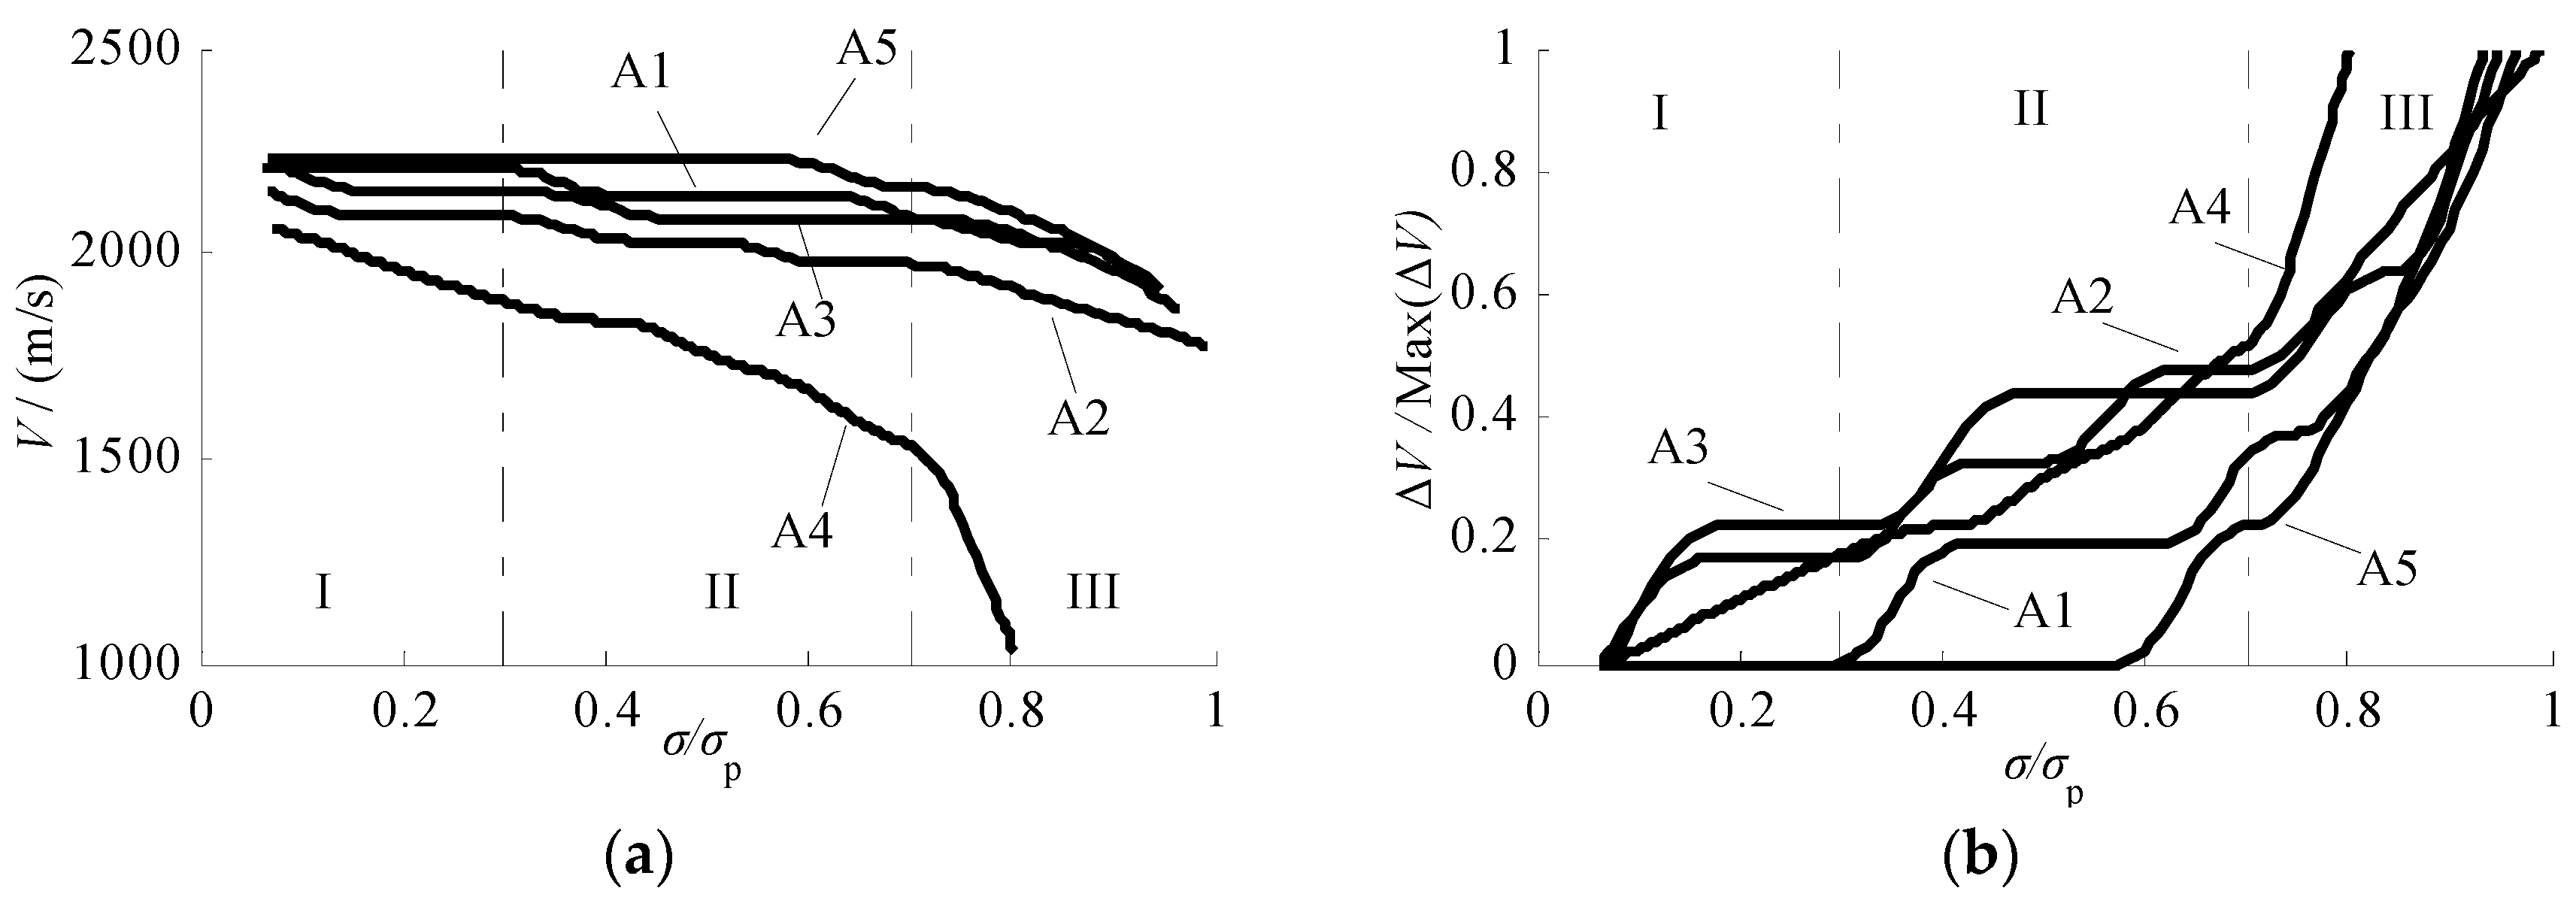
4.2. Wave Velocity During Specimens Failure

Typical transmission waveform data during loading is shown in Figure 5. The curve of 0 kN represents the waveform before the test, and the curves of 3~15 kN correspond to the waveform data collected by the test machine loading from 3 kN to 15 kN.
As shown in Figure 5, the shapes of the waveform from 0 to 12 kN are same, and there is only a delay of 1 to 2 µs, indicating that the waveform collects well, and the damage of the specimens at this stage is little, and the influence on the ultrasonic propagation is slight. While the transmitted wave passing through specimens, multiple reflections and diffractions generate. The accompanying vibrations are superimposed with the motion caused by the emitter to form a resonance, which is expressed as the second and third peak amplitudes significantly rising. Therefore, the highest point of waveform is over 1500 mV.
The wave velocity change has three stages during loading, which are stability (I), slight decrease (II), and rapid decrease (III), as shown in Figure 6. This result is in good agreement with stages of surface deformation by Zhang [1]. The surface deformation was divided into 4 stages during the failure of specimens, which are elasticity, crack initiation, crack penetration and specimen failure. Generally, when 0.3 σp < σ < 0.4 σp, a specimen gets into crack initiation stage. When 0.7 σp < σ < 0.8 σp, a specimen gets into crack penetration stage.
When 0 < σ < 0.3 σp, the wave velocity is in a stable stage. The specimen is in the stage of encryption and elasticity. The inner part of the specimens is closed, and some new cracks are developed. The path of the ultrasonic wave passing through the specimens almost remains constant. Therefore, the wave speed at this stage is relatively stable, and the wave speed in this stage is the fastest. The maximum decline is about 20% of the total decrease, as shown in the I area of Figure 6b.
When 0.3 < σ < 0.7 σp, the wave velocity is in a slight decrease stage, and the specimens are in the crack initiation stage, and the velocity decrease in this stage accounts for 20–30% of the total decrease. At this time, many cracks in the specimens start to expand, and the size of the initiating crack gradually approached the wavelength, resulting in acoustic diffraction. During the ultrasonic transmission process, the crack is bypassed multiple times, which will cause a partial delay, that eventually leads to a decrease of the wave velocity.
When 0.7 < σ < 1.0 σp, the wave velocity is in a stage of rapid decrease, and the specimens is in the stage of crack failure, and the speed drop generated in this stage accounts for more than 50% of the total decrease. At this time, many cracks are penetrated inside the specimens, and the specimens are destroyed. It makes that the ultrasonic wave transmission process needs to pass through the crack surface several times, with a large amount of energy consumed. The combination of delay and energy consumption caused by the crack eventually leads to a rapid decrease of the wave velocity.

4.3. Wave Velocity of Specimens With Different Moisture Content

Figure 7 shows the wave velocity reduction of the specimens with different moisture contents during the destruction. The wave velocity of the specimens with different moisture content show a gradual decrease during the failure. This is caused by all the specimens producing cracks during the loading process. Then, multiple reflections and refractions will be generated at the edge of the crack. As the two sides of the edge are solid and gas, the vibration is different. That leads to a strain phase difference being formed at the edge. Finally, this leads to friction at the edge of crack, and converting mechanical energy into heat energy. Therefore, the energy carried by the ultrasonic wave is consumed. Moreover, the diffraction effect and energy absorption exacerbate the attenuation of wave velocity.
However, the attenuation of the wave velocity during the destruction of the specimens with different moisture contents is different, as shown in Figure 7. In the process that starts with the attenuation at 20% and ends with the wave velocity rapidly drops, the stress required for the A2 is 35%σp, the stress required for the B2 is 16%σp, the stress required for the C2 is 6%σp, and the stress required for the D2 is 5%σp.
This might be due to the microcracks filled by the moisture. Since the moisture content is increased, the microcracks are formed and filled by the moisture at the same time. The wave velocity, which should be lowered at this stage, is increased due to the action of moisture. Therefore, the process of reducing the wave velocity at a macroscopic level is extremely slow.
However, in the case of drying specimen, things are different. At the stability and slight decrease stages, the radius of the microcrack is very small, and the sound wave bypasses the crack due to the diffraction effect. That makes little influence on the wave velocity. So that the wave velocity is near constant in the early stage. When the microcracks expand, the sound waves cannot bypass the cracks. As they pass through the crack, the wave velocity has a significant drop.
Therefore, the duration of the specimens in stability stage (I) increases with the decrease of moisture content; the duration of the slight decrease stage (II) decreases with the decrease of moisture content; the attenuation of the wave velocity in the rapid decrease stage (III) increases with the decrease of moisture content.

4.4. Initial Power Spectral Density of Specimens

The initial waveform of the specimens with different moisture contents was measured before the start of the test, and the initial power spectral densities of the specimens with different moisture contents were shown in Figure 8.
The power spectral densities of the specimens with different moisture contents all reached a peak between 4.88 × 10⁴~5.17 × 10⁴ Hz. Among them, the peak of A5 at 48,830 Hz is 11.87 dB/Hz; the peak of B5 formed at 50,780 Hz is 9.25 dB/Hz; the peak of C4 formed at 50,780 Hz is 16.96 dB/Hz; the peak of D4 formed at 50,780 Hz was 17.19 dB/Hz. All specimens are maintained in the range of −45~−50 dB/Hz in the frequency at 3 × 10⁵~5 × 10⁵ Hz.
The initial power spectral densities of the different specimens have similar characteristics. At frequencies >105 Hz, the specimens all show a tendency of decay, eventually maintaining around −50 dB/Hz. All specimens reach the peaks at the range of 4.5 × 10⁴ to 5.2 × 10⁴ Hz, which means the energy carried by the waveform in the range of 4.5 × 10⁴~5.2 × 10⁴ Hz is the largest and the waveform penetrating power is the strongest. This is consistent with the research of Fast Fourier Transformation (FFT) of the sound wave of rock [40]. In their research, the energy of wave is concentrated around 5.0 × 10⁴ Hz.
The vibration of sound waves exhibits an exponential decay with increasing distance. The propagation distance of sound waves at various frequencies is significantly different. According to Song et al. [41], the propagation distance of sound waves at 1 × 10⁵ Hz under osmosis in porous medium was shorter than 0.2 m. In practice, as the propagation mechanism is much more complicated than the theoretical case, the distance is far less than 0.2 m. as Also, the nonlinear filtering characteristics of rock-like materials that the high-frequency part of the waveform is absorbed would keep the part of which is lower than 1 × 10⁵ Hz. This can be proved by the study of acoustic wave propagation characteristics [42]. Therefore, the peak of power spectral densities at 4.88 × 10⁴~5.17 × 10⁴ may be due to the interaction of filtering characteristics of rock-like materials and propagation characteristics of sound waves.

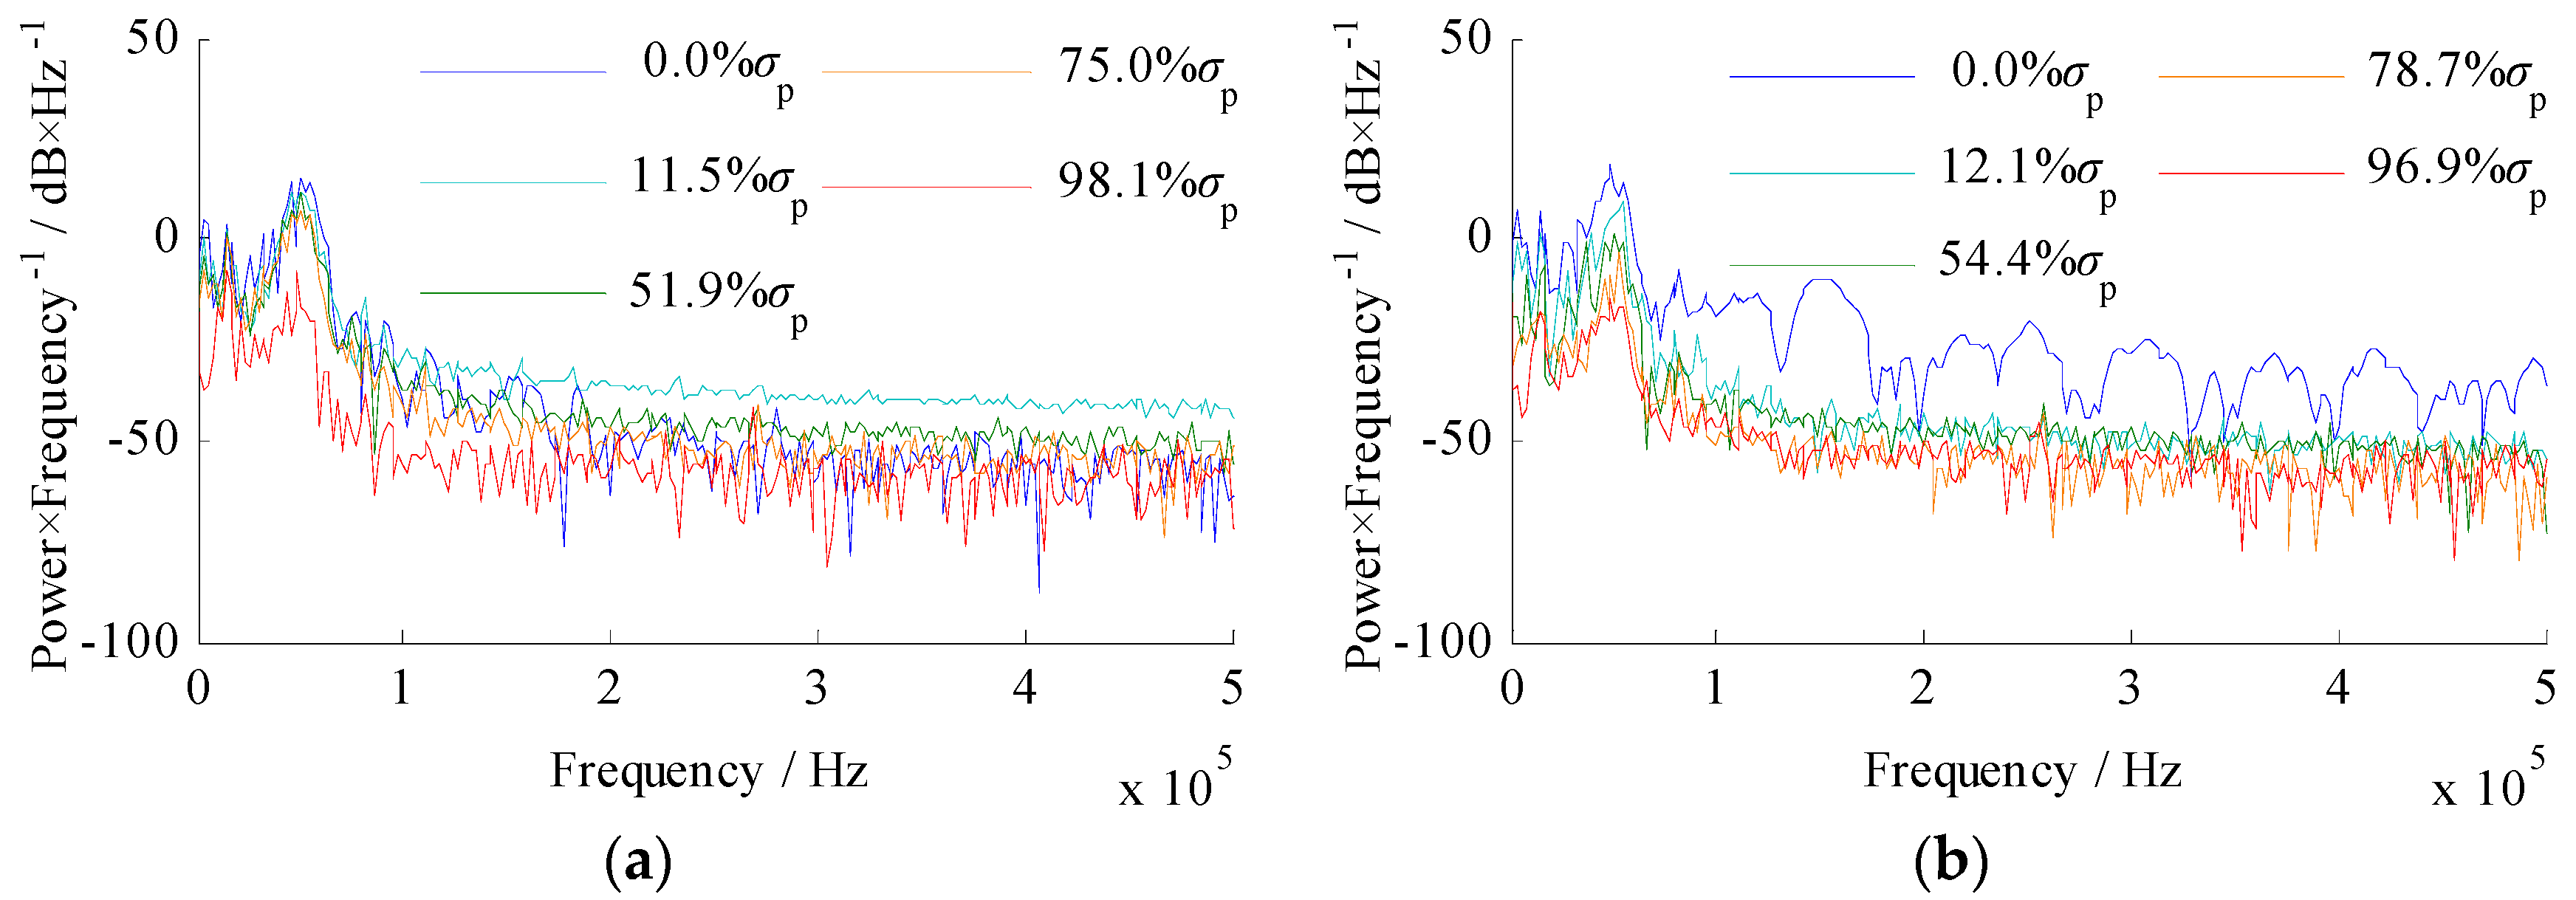
4.5. Power Spectral Density During Destruction

Figure 9 shows the power spectral density of the specimens at different times during destruction. The main characteristics of the power spectral density of the specimens are as follows:
The power spectral density shifts downward, which means the ultrasonic waves are absorbed inside the specimens. At this time, the specimen is below 80%σp, which corresponds to the elastic phase and the crack initiation stages described in Zhang [1]. In these two stages, the tiny crack inside of specimen is emerging. This is consistent with the conclusion that the number of pores increases, and the attenuation of elastic wave absorption increases in the literature [3].
Classical acoustics believe that the absorption coefficient of the medium is proportional to the square of the frequency [3]. According to this, if there is absorption attenuation taking place, the attenuation at high frequency must be larger than in low frequency in the same medium. However, the attenuation of the 1 × 10³ Hz~2 × 10⁵ Hz of the experiment is much larger than that of 2 × 10⁵~5 × 10⁵. It completely against the classical theory, which means that attenuation at this time is not completely caused by absorption attenuation. Since it is above the 96%σp, corresponding to the crack failure stage described in the Zhang [1], the crack starts to go through the specimens, and scattering attenuation of the ultrasonic wave in the crack of the specimens increases, so that the peak of the spectrum begins to decay. This also proves the conclusion that the pore size increases and scattering attenuation of the wave increases [3].

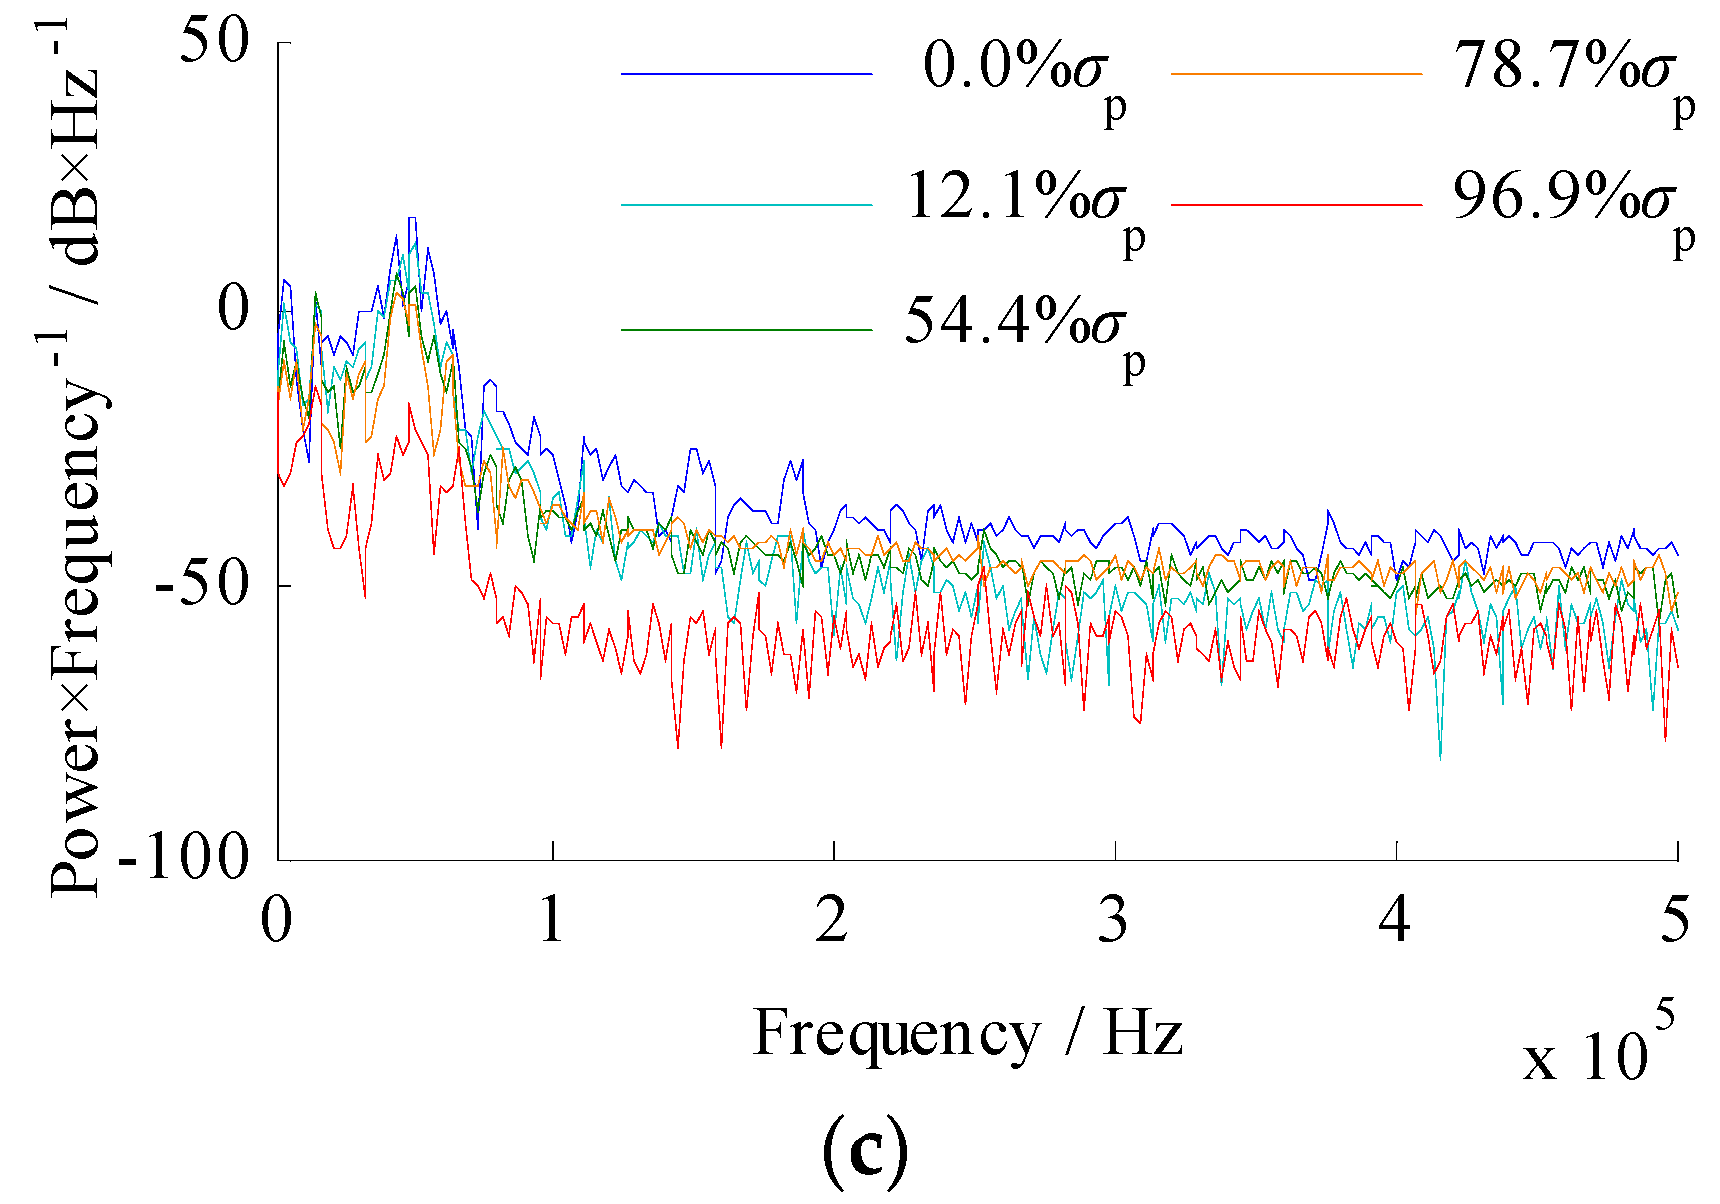
4.6. Power Spectral Density of Specimens with Different Moisture Content

The power spectral density of the specimens during destruction will produce the aforementioned attenuation. To clearly show the change, the filtered attenuation of the specimens with different moisture content are shown in Figure 10.
The power spectral density attenuation of high moisture content specimens is more uniform within 0~5 × 10⁵ Hz, and the maximum attenuation is −31.41 dB/Hz at 1.99 × 10⁵ Hz, as shown in Figure 10a. While the low moisture content specimens are mainly concentrated among 1 × 10³ Hz and 2 × 10⁵ Hz, the maximum attenuation is −52.96 dB/Hz at 3.12 × 10⁴ Hz, as shown in Figure 10d. It is indicated that the absorption attenuation took place in high moisture content specimens, while scattering attenuation took place in low moisture content specimens. The specimens with high moisture content are shown in Figure 10a. In different stress stages, such as 13.4%σp, 53.5%σp, 80.2%σp, 93.6%σp, all of them have different degrees of attenuation, and the curves fluctuate greatly. As the stress rises, the attenuation gradually increases. While the low moisture content specimen is shown in Figure 10d, in the low stress, such as 11.6%σp, 52.4%σp, the curves are coincident. That means the power spectral density attenuation is little. However, when it is close to the peak stress, such as 99.0%σp, the red line in the figure decreases significantly, which means that the power spectral density attenuation is sharply increased.
The peaks of the specimens are among 4.88 × 10⁴~5.17 × 10⁴ Hz, and the peak attenuation of the specimens with different moisture content have a great difference, compared with Figure 10a–d. The peak of the high moisture content specimens has small attenuation amplitude, and the attenuation at 48,830 Hz is −12.25 dB/Hz. The peak of the low moisture content specimens has large attenuation, and the attenuation at 50,780 Hz reaches −38.36 dB/Hz.
This phenomenon is unified with the wave speed. Under the high moisture content condition, the wave velocity changes more smoothly during the whole loading process due to the action of moisture, which makes that the energy loss is uniform. In terms of power spectral density, the power will slowly decrease at each frequency, which is also in accordance with Figure 10a.
However, under the low moisture content condition, the influence of the initial wave velocity is small, meaning that the energy loss is small, and the power spectral density at each frequency is shifted less. When loading into rapid decrease stage, the wave velocity drops significantly, which means the energy loss is very large. The power spectral density at each frequency will decrease significantly. The power spectral density peaks are concentrated at 4.88 × 10⁴~5.17 × 10⁴ Hz, which means that the energy carried by these frequencies is large. When the energy in the waveform is lost, the energy at these frequencies will decrease significantly, which is reflected by the power spectral density shifting down, as shown in Figure 10d.

5. Conclusions

Wave velocity and power spectral density are extremely important ultrasonic parameters that reflect the damage of rock. Ultrasonic waveforms with different degrees of damage were obtained by performing uniaxial compression tests on hole-containing specimens with different moisture contents. The wave velocity of the hole-containing specimens gradually decreases during destruction. There are three stages of attenuation of wave velocity, which are stable, slightly reduced, and rapidly decreasing. The moisture content has great effect on the attenuation of wave velocity. As the moisture content decreases, the duration of the stable stage increases, and the duration of the slight decrease stage decreases. The lower the moisture content, the larger the amount of attenuation of wave velocity in the rapidly decreasing stage. The power spectral density gradually decreases during the destruction of the hole-containing specimens, and the peak of power spectral density is among 4.5 × 10⁴~5.2 × 10⁴ Hz. The moisture content influences the attenuation of power spectral density. The higher the moisture content, the smoother the attenuation during the destruction. The lower the moisture content, the more severe the attenuation of peak near the peak strength. This can provide an effective method for detection engineering of a gas extraction borehole. In the detection, the influence of the gas flow inside the borehole on the ultrasonic wave needs to be considered, which will be carried out in subsequent research.

Author Contributions

Conceptualization, T.-j.Z., S.-g.L. and L.Z.; Methodology, L.Z.; Software, L.Z.; Validation, T.-j.Z., J.-l.L. and X.J.; Formal Analysis, L.Z.; Investigation, L.Z., J.-l.L. and X.J.; Resources, L.Z. and J.-l.L.; Data Curation, J.-l.L. and X.J.; Writing-Original Draft Preparation, L.Z.; Writing-Review and Editing, T.-j.Z., H.-y.P. and L.Z.; Visualization, L.Z.; Supervision, T.-j.Z. and S.-g.L.; Project Administration, T.-j.Z.; Funding Acquisition, T.-j.Z., S.-g.L. and H.-y.P.

Acknowledgments

This work was supported in part by the National Natural Science Foundation of China (NSFC) under grant number 51774234, 51734007, 51874234 and Excellent Doctoral Thesis Development Fund of Xi’an University Science and Technology.

Conflicts of Interest

The authors declare no conflict of interest.

References

  1. Zhang, T.; Zhang, L.; Li, S.; Liu, J.; Pan, H.; Song, S. Stress inversion of coal with a gas drilling borehole and the law of crack propagation. Energies 2017, 10, 1743. [Google Scholar] [CrossRef]
  2. Chen, Q.; Liu, X.J.; Liang, L.X.; Wang, S. Numerical simulation of the fractured model acoustic attenuation coefficient. Chin. J. Geophys. 2012, 55, 2044–2052. [Google Scholar]
  3. Wang, Z.Z.; Wang, R.H.; Tian-Yang, L.I.; Shan, X.; Qiu, H. Numerical-modeling of pore structure effects on acoustic attenuation in dry rocks. Prog. Geophys. 2014, 29, 2766–2773. [Google Scholar]
  4. Thill, R.E.; Bur, T.R.; Steckley, R.C. Velocity anisotropy in dry and saturated rock spheres and its relation to rock fabric. Int. J. Rock Mech. Min. Sci. Geomech. Abstr. 1973, 10, 535–557. [Google Scholar] [CrossRef]
  5. Oda, M.; Yamabe, T.; Kamemura, K. A crack tensor and its relation to wave velocity anisotropy in jointed rock masses. Int. J. Rock Mech. Min. Sci. Geomech. Abstr. 1986, 23, 387–397. [Google Scholar] [CrossRef]
  6. Kano, S.; Tsuchiya, N. Parallelepiped cooling joint and anisotropy of p-wave velocity in the takidani granitoid, japan alps. J. Volcanol. Geotherm. Res. 2002, 114, 465–477. [Google Scholar] [CrossRef]
  7. Takemura, T. Changes in crack density and wave velocity in association with crack growth in triaxial tests of inada granite. J. Geophys. Res. 2005, 110. [Google Scholar] [CrossRef]
  8. Best, A.I.; McCann, C.; Sothcott, J. The relationships between the velocities, attenuations and petrophysical properties of reservoir sedimentary rocks. Geophys. Prospect. 1994, 42, 151–178. [Google Scholar] [CrossRef]
  9. Tary, J.B.; van der Baan, M.; Herrera, R.H. Applications of high-resolution time-frequency transforms to attenuation estimation. Geophysics 2017, 82, 7–20. [Google Scholar] [CrossRef]
  10. Liao, Q.; McMechan, G.A. Tomographic imaging of velocity and q, with application to crosswell seismic data from the gypsy pilot site, oklahoma. Geophysics 1997, 62, 1804–1811. [Google Scholar] [CrossRef]
  11. Pham, N.H.; Carcione, J.M.; Helle, H.B.; Ursin, B. Wave velocities and attenuation of shaley sandstones as a function of pore pressure and partial saturation. Geophys. Prospect. 2002, 50, 615–627. [Google Scholar] [CrossRef]
  12. Benson, P.; Schubnel, A.; Vinciguerra, S.; Trovato, C.; Meredith, P.G.; Young, P.R. Physical and transport properties of isotropic and anisotropic cracked rocks under hydrostatic pressure. J. Geophys. Res. 2006, 111, B04202. [Google Scholar]
  13. Lokajicek, T.; Svitek, T. Laboratory measurement of elastic anisotropy on spherical rock samples by longitudinal and transverse sounding under confining pressure. Ultrasonics 2015, 56, 294–302. [Google Scholar] [CrossRef] [PubMed]
  14. Vajdová, V.; Přikryl, R.; Pros, Z.; Klíma, K. The effect of rock fabric on p-wave velocity distribution in amphibolites. Phys. Earth Planet. Inter. 1999, 114, 39–47. [Google Scholar] [CrossRef]
  15. Han, D.; Nur, A.; Morgan, D. Effects of porosity and clay content on wave velocities in sandstones. Geophysics 1986, 51, 2093. [Google Scholar] [CrossRef]
  16. Ayres, A.; Theilen, F. Relationship between p- and s-wave velocities and geological properties of near-surface sediments of the continental slope of the barents sea. Geophys. Prospect. 1999, 47, 431–441. [Google Scholar] [CrossRef]
  17. Shatilo, A.P.; Sondergeld, C.; Rai, C.S. Ultrasonic attenuation in glenn pool rocks, northeastern oklahoma. Geophysics 1998, 63, 465–478. [Google Scholar] [CrossRef]
  18. King, M.S.; Marsden, J.R.; Dennis, J.W. Biot dispersion for p- and s-wave velocities in partially and fully saturated sandstones. Geophys. Prospect. 2000, 48, 1075–1089. [Google Scholar] [CrossRef]
  19. Elghadamsi, F.E.; Mohraz, B.; Lee, C.T.; Moayyad, P. Time-dependent power spectral density of earthquake ground motion. Soil Dyn. Earthq. Eng. 1988, 7, 15–21. [Google Scholar] [CrossRef]
  20. Elson, J.M.; Bennett, J.M. Calculation of the power spectral density from surface profile data. Appl. Opt. 1995, 34, 201. [Google Scholar] [CrossRef] [PubMed]
  21. Cusidócusido, J.; Romeral, L.; Ortega, J.A.; Rosero, J.A.; Espinosa, A.G. Fault detection in induction machines using power spectral density in wavelet decomposition. IEEE Trans. Ind. Electron. 2008, 55, 633–643. [Google Scholar] [CrossRef]
  22. Chen, X.; Xu, Z. The ultrasonic p-wave velocity-stress relationship of rocks and its application. Bull. Eng. Geol. Environ. 2016, 76, 661–669. [Google Scholar] [CrossRef]
  23. Fathollahy, M.; UroMeiehy, A.; Riahi, M.A. Evaluation of p-wave velocity in different joint spacing. Boll. Geofis. Teor. Appl. 2017, 58, 157–168. [Google Scholar]
  24. Lee, I.-M.; Han, S.-I.; Kim, H.-J.; Yu, J.-D.; Min, B.-K.; Lee, J.-S. Evaluation of rock bolt integrity using fourier and wavelet transforms. Tunn. Undergr. Space Technol. 2012, 28, 304–314. [Google Scholar] [CrossRef]
  25. Kilic, O. Application of ultrasonic velocity measurement and thermal analysis for determination of limestone quality. Physicochem. Probl. Miner. Process. 2014, 50, 525–534. [Google Scholar]
  26. Madhubabu, N.; Singh, P.K.; Kainthola, A.; Mahanta, B.; Tripathy, A.; Singh, T.N. Prediction of compressive strength and elastic modulus of carbonate rocks. Measurement 2016, 88, 202–213. [Google Scholar] [CrossRef]
  27. Lajtai, E.Z.; Lajtai, V.N. The collapse of cavities. Int. J. Rock Mech. Min. Sci. Geo. Abs. 1975, 12, 81–86. [Google Scholar] [CrossRef]
  28. Carter, B.J.; Lajtai, E.Z.; Petukhov, A. Primary and remote fracture around underground cavities. Int. J. Numer. Anal. Methods Geomechan. 1991, 15, 21–40. [Google Scholar] [CrossRef]
  29. Zhu, W.C.; Bruhns, O.T. Simulating excavation damaged zone around a circular opening under hydromechanical conditions. Int. J. Rock Mech. Min. Sci. 2008, 45, 815–830. [Google Scholar] [CrossRef]
  30. Wang, S.Y.; Sloan, S.W.; Sheng, D.C.; Tang, C.A. Numerical analysis of the failure process around a circular opening in rock. Comput. Geotech. 2012, 39, 8–16. [Google Scholar] [CrossRef]
  31. Yang, H.Q.; Zeng, Y.Y.; Lan, Y.F.; Zhou, X.P. Analysis of the excavation damaged zone around a tunnel accounting for geostress and unloading. Int. J. Rock Mech. Min. Sci. 2014, 69, 59–66. [Google Scholar] [CrossRef]
  32. Li, D.; Zhu, Q.; Zhou, Z.; Li, X.; Ranjith, P.G. Fracture analysis of marble specimens with a hole under uniaxial compression by digital image correlation. Eng. Fract. Mech. 2017, 183, 109–124. [Google Scholar] [CrossRef]
  33. Yang, X.-X.; Jing, H.-W.; Chen, K.-F.; Yang, S.-Q. Failure behavior around a circular opening in a rock mass with non-persistent joints: A parallel-bond stress corrosion approach. J. Cent. South Univ. 2017, 24, 2406–2420. [Google Scholar] [CrossRef]
  34. Cohen, L. Generalization of the wiener-khinchin theorem. IEEE Signal Process. Lett. 1998, 5, 292–294. [Google Scholar] [CrossRef]
  35. Strube, H.W. A generalization of correlation functions and the wiener-khinchin theorem. Signal Process. 1985, 8, 63–74. [Google Scholar] [CrossRef]
  36. Ricker, D.W. Echo Signal Processing; Kluwer Academic Publishers: New York, NY, USA, 2003; pp. 1–484. [Google Scholar]
  37. Zbilut, J.P.; Marwan, N. The wiener–khinchin theorem and recurrence quantification. Phys. Lett. A 2008, 372, 6622–6626. [Google Scholar] [CrossRef]
  38. Zhang, T.; Zhang, L.; Li, S.; Zhang, C.; Song, S.; Bao, R. Characteristics of the surface deformation of specimens with a hole during the progressive failure. Meitan Xuebao/J. China Coal Soc. 2017, 42, 2623–2630. [Google Scholar]
  39. Amalokwu, K.; Chapman, M.; Best, A.I.; Minshull, T.A.; Li, X.-Y. Water saturation effects onp-wave anisotropy in synthetic sandstone with aligned fractures. Geophys. J. Int. 2015, 202, 1088–1095. [Google Scholar] [CrossRef]
  40. Chen, X.; Yu, J.; Li, H.; Cai, Y.-Y.; Zhang, Y.-Z.; Mu, K. Experimental study of propagation characteristics of acoustic wave in rocks with different lithologies and water contents. Rock Soil Mech. 2013, 9, 2527–2533. [Google Scholar]
  41. Song, S.; Zhang, J.G.; Ji-Ye, M.A.; Hao, A.G.; Wang, H.W. Theoretical research of acoustic wave propagation in reservoir. Oil Field Equip. 2009, 38, 1–7. [Google Scholar]
  42. Liu, X.; Hong, L.; Xiaolei, X.U.; Lin, H.; Liang, L. Experimental reasearch on acoustic wave propagation characteristic of low porosity and permeability sandstone under loading conditions. Chin. J. Rock Mech. Eng. 2009, 28, 560–567. [Google Scholar]
Figure 1. Schematic of gas extraction borehole (a) roadway; (b) gas extraction borehole; (c) coal seam.
Energies 11 03166 g001
Figure 2. Preparation and image of specimens (a) specimen preparation diagram; (b) image of hole-containing specimens.
Energies 11 03166 g002
Figure 3. Specimens and sensor distribution.
Energies 11 03166 g003
Figure 4. Initial wave speed of specimens.
Energies 11 03166 g004
Figure 5. Transmission waveform during the destruction.
Energies 11 03166 g005
Figure 6. Change of wave velocity during the destruction of specimens with different moisture contents (a) wave velocity; (b) attenuation of wave velocity.
Energies 11 03166 g006
Figure 7. Change of wave velocity during the destruction of specimens with different moisture contents.
Energies 11 03166 g007
Figure 8. Initial power spectral density of specimens with different moisture contents.
Energies 11 03166 g008
Figure 9. Power spectral density during the destruction (a) D2; (b) D3; (c) D4.
Energies 11 03166 g009aEnergies 11 03166 g009b
Figure 10. Power spectral density attenuation of different moisture content (a) A5; (b) B5; (c) C4; (d) D4.
Energies 11 03166 g010
Table 1. Size and parameters of specimens.
IndexInitial Mass/gSize/(mm × mm × mm)Mass After Absorption/(g)
24 h48 h72 h96 h120 h
A136470.45 × 70.64 × 70.46525527528528-
A236970.64 × 71.04 × 70.48531533534534-
A336570.27 × 70.87 × 70.52530532533533-
A435070.45 × 66.05 × 70.45495497497497-
A537170.09 × 71.26 × 71.19533535536536-
B136570.80 × 70.23 × 70.23366368369369370
B236170.36 × 69.15 × 70.31362367366368369
B335670.42 × 69.42 × 70.24357359360360361
B436170.27 × 69.53 × 70.60363368370370369
B536770.29 × 70.46 × 70.67369371372373373
C136370.27 × 69.49 × 70.55364366366366367
C235970.33 × 66.45 × 70.01362363363363364
C336970.26 × 70.89 × 70.31371372374374374
C436370.24 × 69.65 × 70.37364366367367367
C536770.53 × 69.89 × 70.37368369371371371
D134670.41 × 66.89 × 70.13-----
D236070.44 × 68.63 × 70.34-----
D334670.62 × 63.32 × 70.05-----
D437470.18 × 71.48 × 70.36-----
D534970.00 × 69.25 × 70.35-----

