Abstract
Solar energy is the most clean renewable energy source and has good prospects for future sustainable development. Installation of solar photovoltaic (PV) systems on building rooftops has been the most widely applied method for using solar energy resources. In this study, we developed an approach to simulate the monthly and annual solar radiation on rooftops at an hourly time step to estimate the solar PV potential, based on rooftop feature retrieval from remote sensing images. The rooftop features included 2D rooftop outlines and 3D rooftop parameters retrieved from high-resolution remote sensing image data (obtained from Google Maps) and digital surface model (DSM, generated from the Pleiades satellite), respectively. We developed the building features calculation method for five rooftop types: flat rooftops, shed rooftops, hipped rooftops, gable rooftops and mansard rooftops. The parameters of the PV modules derived from the building features were then combined with solar radiation data to evaluate solar photovoltaic potential. The proposed method was applied in the Chao Yang District of Beijing, China. The results were that the number of rooftops available for PV systems was 743, the available rooftop area was 678,805 m2, and the annual PV electricity potential was 63.78 GWh/year in the study area, which has great solar PV potential. The method to perform precise calculation of specific rooftop solar PV potential developed in this study will guide the formulation of energy policy for solar PV in the future.
1. Introduction
Rapid economic development has brought about resource over-consumption, environmental pollution and ecological damage [1]. One of the most efficient solutions to these problems is to shift from fossil fuel power generation to renewable energy [2]. In 2016, the share of PV electricity production represented 1.5% of all electricity produced globally, the global solar PV capacity was 303 GW and China’s 77.4 GW [3]. Rooftop solar PV, which directly converts sunlight into electricity, has good prospects for solving energy and environmental problems in the future, especially in China [4] (Figure 1 and Figure 2). In order to promote the development of photovoltaics, many scholars have done lots of related studies on solar urban plans, energy production simulation, energy efficiency, storage solution and economic benefit [3,5,6,7,8]. However, PV potential map is the precondition and foundation of large-scale development of PV. China has a vast territory and abundant solar resources, making it an appropriate country to develop and utilize solar energy resources [9]. The China National Energy Administration announced that the government aimed to reach the capacity of 100 GW of solar photovoltaic by 2020 in its 13th Five-Year Plan. However, the speed of development of the rooftop PV in China was far less than expected. Achieving the goal involves relying on the high-precision planning of large-scale PV deployment, therefore, there is a need to estimate and quantify the potential for rooftop solar photovoltaics [10].
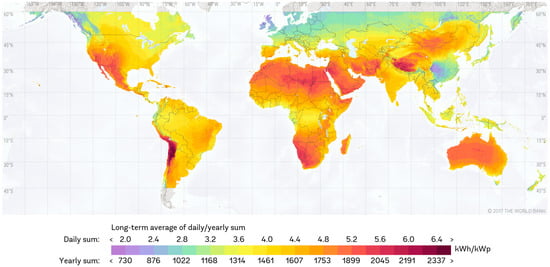
Figure 1.
Photovoltaic Electricity Potential Map of World published by The World Bank Group [11].
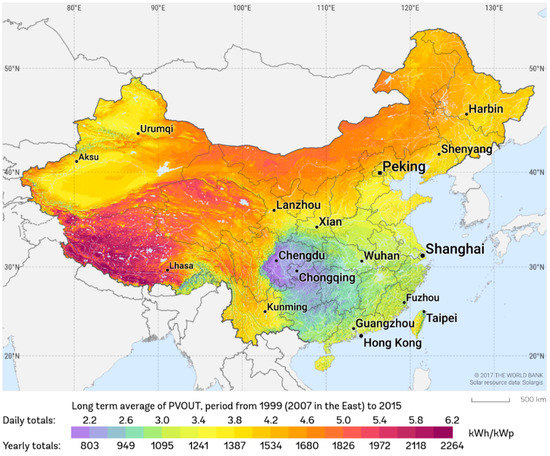
Figure 2.
Photovoltaic Electricity Potential Map of China published by The World Bank Group [12].
To accurately simulate the energy production of renewable energy sources, PVGIS developed by the European Commission and PVWatts developed by National Renewable Energy Laboratory (NREL) are two popular PV models, which are free and relatively simple to operate [13]. The basis of PVGIS are a large database and country maps available for Europe and Africa, which present solar irradiation from ground stations or satellites [14]. The big weakness of PVGIS is that it is not applicable for countries outside of Europe and Africa. PVWatts uses the data from the NREL National Solar Radiation Database (NSRDB), which covered the Americas including Hawaii between about 21 degrees South latitude to about 60 degrees North, and the Indian subcontinent and parts of Central Asia. This model also allows the user to import his own or a different database. PVWatts estimates annual and monthly electricity production with location, basic design parameters, and an average annual retail electricity rate [15]. PVGIS and PVWatts are Large-scale photovoltaic potential assessment models, and their data do not cover China.
Solar PV potential estimation methods which are suitable for China can be classified into generalized estimation and detailed modeling [16]. Generalized estimation calculates the PV distribution by analyzing the influence of the factors (local environmental, economic, social variables and buildings distribution, etc.) on the spatial distribution of photovoltaic applications [17]. Rooftop suitable for PV plays an important role in the estimation of rooftop solar PV potential [18]. This method includes the correlation coefficient method and the constant-value method. Some studies have selected typical regions as samples to calculate the correlation coefficient between population density or building density and the photovoltaic roof available area, then, the correlation coefficient is used to calculate the photovoltaic roof available area in the entire region, which (as the only PV installation parameter) is then used to estimate the solar PV potential [19]. L. K. Wiginton used ten of the 109 census subdivisions as samples to extrapolate the relationship between population and roof area and estimated the potential power and energy output from the deployment of rooftop PV [20]. The constant-value method is an even more general approach used to estimate solar PV potential. The method assumes a constant value for the entire building stock of different building types, regardless of slope or orientation. The different building types are classified according to different standards and perspectives, such as residential, commercial, and industrial buildings based on building function and flat and pitched roofs based on rooftop form [21,22]. This method is suitable for a large range of research, although its accuracy is lower. Additionally, this method is more applicable to areas that have more perfect building statistical data and similar architecture.
The detailed modeling method based on Geographic Information System (GIS), which is more objective and more accurate than previous methods, is a mainstream approach to estimate the solar PV potential by assigning ideal values for rooftop characteristics to rooftop models [19,23,24].
The study of the detailed modeling method has focused on both the rooftop projection area method and the rooftop architectural morphology method. The rooftop projection area method refers to the area of each rooftop through building spatial distributions extracted from remote sensing images, and the area of each rooftop, the only PV installation parameter, is used to estimate the solar PV potential [25,26]. However, in this method, the accuracy is low because of the neglect of rooftop shapes. The rooftop architectural morphology method can model 3D rooftops, which can determine solar resources or shadow effects on buildings and more precise PV installation parameters [27,28,29]. The 3D models are most often generated from orthophotography or light detection and ranging (LiDAR) data [16,30]. This method is difficult and complicated and is not suitable for large regions, although it is relatively accurate. Additionally, the estimation of solar PV potential does not require all rooftop parameters, just some parameters. Therefore, some simple methods are needed for large-scale estimation of solar PV potential.
In this study, we propose a methodology that aims at assessment of the PV solar potential through the retrieval of rooftop features using high-resolution remote sensing images combined with digital surface models (DSM) that can be easily obtained by oblique photography. Rooftop features consist of the 2D rooftop outline and 3D rooftop parameters. The process has three steps: 2D rooftop outline extraction, 3D rooftop parameters recognition and solar module parameter calculation. The 2D rooftop outlines were extracted and simplified using an object-oriented classification method based on high-resolution remote sensing images. The 3D rooftop parameters, which consist of rooftop type, slope and aspect, were recognized using the DSM. The module parameters area, slope and aspect were then calculated by combining the 2D rooftop outlines and the 3D rooftop parameters. The proposed method was used to calculate solar PV use in the Chao Yang District, Beijing, China based on satellite images obtained from Google Maps [31] and the DSM.
2. Results and Validation
2.1. Study Area and Data Sources
The data sources of this study included the Pleiades DSM and satellite images obtained from Google Maps of the Chao Yang District, Beijing. The Chao Yang District, which is located on the eastern side of Beijing, is a densely populated and economically developed central area that contains many unique industrial zones. It is a planned and regularly-developed district that contains various types of buildings with different shapes and usages.
For the satellite data, the resolution of the image from Goggle Maps was approximately 0.2 m. The DSM was generated from the Pleiades images with an approximately 0.9 m ground sampling distance. Figure 3 illustrates the location, the google image and the DSM of the study area. The area covered by the scenes was 2 km × 2.5 km. The western part of the scene contains some larger shading structures including the Birds Nest Stadium and the National Stadium. It is worth mentioning that in our work these structures were excluded. The northeastern and eastern parts consist of mostly residential areas that have small houses with an even spatial distribution and generally complex and compact building shapes.
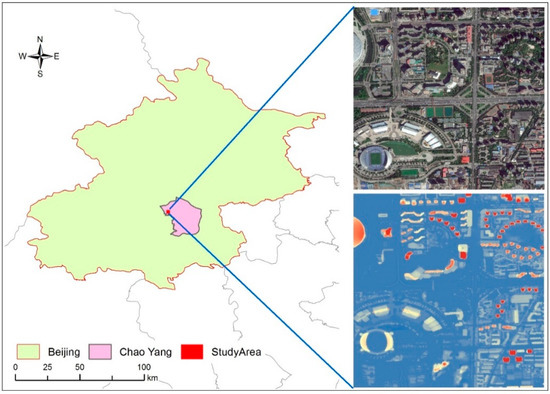
Figure 3.
Original data of the study area.
2.2. Building Extraction Results
Based on the Google image and DSM, the buildings were extracted using the object-oriented classification method. Based on the comparative analysis of many experiments, we used a value of 1 for the parameter “weight of each spectrum layer”, 2 for “weight of DSM layer”, 50 for “segmentation scale”, 0.7 for “the weight of spectral heterogeneity” and 0.3 for “the weight of compactness” in Formula (2). After multi-resolution segmentation, we extracted the artificial objects, including buildings, road, overpasses, and so on, using spectral features, shape features and texture features such as NDVI and Brightness. We extracted the buildings from the artificial objects using the DSM. Then, we reconfigured the detected building patches using the Hough transformation and manual modification. The results are shown in Figure 4.
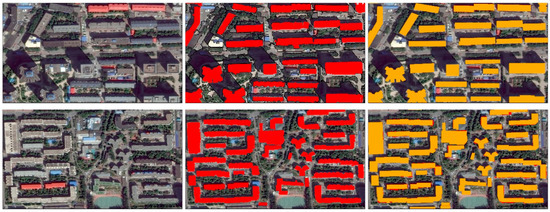
Figure 4.
Extracted building rooftops.
2.3. Rooftop Assessment
The rooftops of the complex buildings usually consisted of several flat rooftops and were thus often generalized as one rooftop. We recognized the rooftop type, and ridge lines of the building rooftops were extracted to determine the rooftop parameters. Then, the sunny hips were extracted based on the ridge lines and the aspect types. Figure 5 presents various examples of rooftops showing different roof types.

Figure 5.
Different types of rooftops (flat rooftops are shown in red and sunny hips and shade hips of pitched roofs are shown in yellow and green, respectively).
The area contained 760 rooftops that included 33 pitched rooftops. A reference dataset was prepared to assess the accuracies of the extracted buildings and the rooftop parameters by manually delineating and labeling the buildings from the image and field measurement of the hip types, the areas, the slopes, and the aspects of the rooftops. We randomly selected 50 points as the samples and conducted ground surveys by GPS. The actual data (rooftop hip type, area, slope, aspect, and other data) were obtained. The field work showed that the interpretation precision of remote sensing was 87%, based on the longitude and latitude of each sample point. Table 1 illustrates the type, area, slope and aspect of 10 samples extracted from ground truth and images.

Table 1.
Accuracy analysis for 10 selected rooftop samples.
2.4. PV Potential Assessment Results
The solar module parameters were calculated based on the rooftop parameters, which included area, slope and aspect. We extracted 760 rooftops from the image, with an area of 809,837 m2 in two dimensions. Based on shadow and slope, we excluded the rooftops that were unsuitable for solar module installation, which left 743 rooftops with an area of 678,805 m2 available for PV. For photovoltaic array structure design and installation on flat rooftops, one should ensure that solar modules are set without shading each other from 9 a.m. to 3 p.m. on the winter solstice because the shadow is longest on the winter solstice. We determined by calculation that the distance at 3 p.m. on the winter solstice is at its maximum when α is 43.58° and h is 19.78°. Based on Formula (1), the area of the PV modules was approximately half of the rooftop area. For pitched rooftops, the area of the PV modules was the cosine of the area of sunny rooftop hips.
We applied the above methodology to the sample area in 2016 to demonstrate the applicability of the method. The monthly and annual solar radiation was calculated at an hourly time step for each rooftop hip. The total annual solar radiation in the study area was 63.78 GWh/year and the average radiation over each square meter was 93.97 kWh/m2/year (Figure 6). The results show that during the summer, this urban area received approximately twice the solar radiation it received in winter. The study area received more solar radiation in the third quarter than in the other quarters. The maximum monthly solar irradiation occurred in July and was 7.16 GWh; the minimum of 2.34 GWh occurred in December.
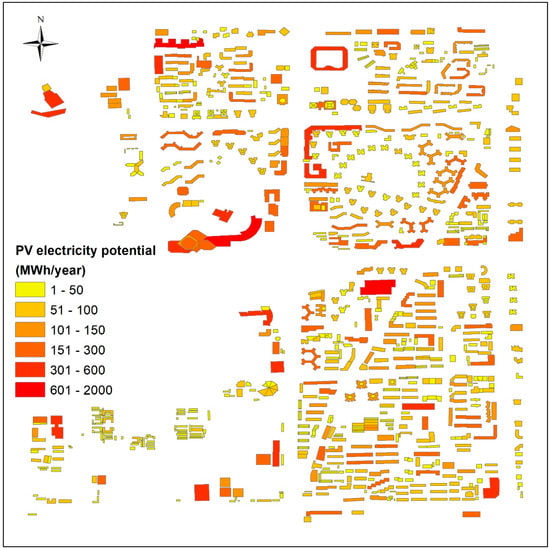
Figure 6.
Annual PV potential map in study area.
In the view of circular economy, the energy conservation and pollution reduction of PV is also significantly. According to the Beijing Statistical Yearbook [32], there are 8473 people per square kilometer in Chaoyang District of Beijing. The per capita household electricity consumption is 899 kWh/year. The study area is 5 km2 with 42,365 people. The total electricity consumption in the study area in 2016 is 38.09 GWh/year. It can be seen that the photovoltaic power generation capacity in the study area can meet the living electricity consumption. The CO2 emission reduction factor of North China Power Grid is 1 tCO2/MWh, which is released by the National Development and Reform Commission. The study area can reduce CO2 emissions by 38,090 t per year.
3. Study Area and Data
In this study, solar PV potential was assessed using several main parameters based on the solar radiation model as Equation (1) [33]:
where Et1,t2 is the in-plane irradiation received by PV modules during the [t1, t2] time period. t1 and t2 are the beginning and ending times of solar energy potential assessment, respectively. St is the area of non-shadow solar photovoltaic modules in time T. ft is the direct normal irradiance (DNI) after atmospheric radiation correction in time T. In this study, the PV energy production was calculated by the in-plane irradiation defined as the sunlight that illuminates tilt plane surface. Rt is the angle modifying factor between solar rays and rays received by PV modules, namely, Conversion factor from DNI to in-plane irradiation. Ep is the PV power generation of rooftop during the [t1, t2] time period. If Ep is annual photovoltaic power generation, the unit is kWh/year. fp is the module conversion efficiency, fo is the performance ratio (PR) of PV system. In this study, the average module efficiency was assumed at a conservative 16% [33], and the average performance ratio was assumed at 75% [34].
Solar altitude (h) and solar azimuth (α) are fixed at a constant longitude and latitude position at certain times, and St and Rt are the key variables for PV potential estimation. To exactly evaluate the relative PV potential based on the two key variables, three parts are needed: (1) rooftop outline detection, (2) rooftop feature acquisition and (3) solar PV modules parameters calculation.
The flowchart of the methodology is presented in Figure 7.
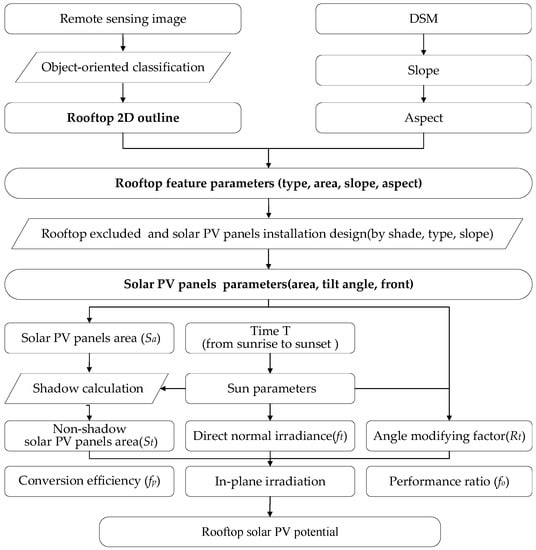
Figure 7.
Flowchart of the proposed method.
3.1. Rooftop Outline Detection
The rooftop outlines of buildings were detected from high-resolution satellite images that combined most information about spectra, shape and texture using an object-oriented classification method [35]. Rooftop outline detection included image segmentation, object recognition and post classification.
In this study, we improved the multi-resolution image segmentation by adding a DSM layer in addition to images, which can be expressed as follows:
The weight of each layer (), the segmentation scale (), the weight of spectral heterogeneity () and the weight of compactness () were set to decide if two objects would merge. The suitable values of the four variables were selected through many experiments based on the geometry of the building (length, width, area, and other measures). In the process of clustering, the difference in DSMs of two objects were added as constraint conditions.
After segmentation, the building was extracted through a set of classification rules that consisted of some spectral features, shape features and texture features. Then, a simplified process was performed to produce the regular edge of a building rooftop. Regular rooftop outlines of rectangular buildings and circular-shaped (circle-, ring-, C- and S-shapes) buildings were delineated by a Gaussian smoothing filter, edge detection and Hough transformation [36].
3.2. Rooftop Feature Parameters Acquisition
Rooftop PV available area is significantly determined by rooftop feature parameters such as area, slope and aspect, which varied for different rooftop types. Therefore, we proposed a method to retrieve these parameters based on rooftop classification.
(1) Rooftop classification
For PV potential evaluation, rooftops can be generally classified into flat rooftops and pitched rooftops. Based on a sample survey in the study area and a literature review [37], we classified the rooftop into five categories: flat rooftops, shed rooftops, hipped rooftops, gable rooftops and mansard rooftops. Sketches of the five categories of rooftops are shown in Figure 8 [37].
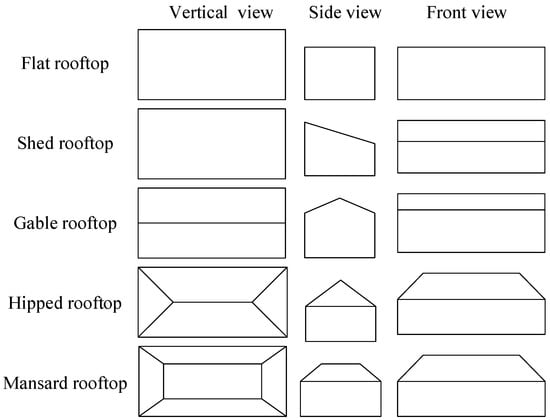
Figure 8.
Sketch of different kinds of rooftops.
Surface aspect was used to recognize the rooftop types. Surface aspect on a point of the surface is the function of the elevation change rate in the east-west (Y axis) and north-south (X axis) direction and is expressed by the Equation (4) [38]:
where is the elevation change rate in the north-south (X axis) direction and is the elevation change rate in the east-west (Y axis) direction. and are calculated by the three-order inverse distance square weight difference in a 3 × 3 moving window over the DSM image.
The rooftop type can be classified based on the dominant aspect and the distribution rule because aspect type is obviously irregular on flat rooftops and the domain aspect type is significant on pitched rooftops. The classification criteria are shown in Table 2.
Table 2.
Different rooftop type recognition criterion based on aspect.
(2) Rooftop feature parameters
The rooftop feature parameter required for flat rooftops was area. However, for pitched rooftops, the sunny hipped type, which is useful for solar PV potential estimation, was first recognized by extracting the ridge lines based on DSM and aspect. The ridge lines were extracted by fitting the lines to the group of local maximum pixels of the DSM with aspect data. The sunny hips of Gable rooftops consist of one longitudinal hip; the sunny hips of hipped rooftops usually consist of the two longitudinal hips and one lateral hip; and the sunny hips of mansard rooftops usually consist of one flat hip, two longitudinal hips and one lateral hip. The required rooftop feature parameters of each rooftop hip for the five kinds of rooftops are shown in Table 3.
Table 3.
Required rooftop feature parameters of each rooftop hip.
3.3. Solar PV Module Moduleparameter Acquisition
Solar PV module parameters include available rooftop, installation tilt angle, installation orientation, and module area. The available rooftops were initially extracted by excluding those covered by shade, which can be calculated at 12 noon on the spring and autumnal equinoxes when the azimuth is 180° and the altitude is approximately 50° [39,40]. Additionally, according to the National Renewable Energy Laboratory (NREL) method [16], installation of photovoltaic modules is not allowed on rooftops whose slopes are greater than 60 degrees and were thus excluded. The remaining building rooftops were used to calculate the area of solar modules.
Install tilt angle is one of the key parameters for solar PV estimation. The optimal tilt angle in Beijing was determined to be 36° by analyzing the change trend of yearly radiation on an inclined plane with the angle of inclination based on the solar calculation model [41] of an inclined plane and the power output model of photovoltaics [42]. Considering the installation of modules on different types of rooftops, we defined the install tilt angle to be 36° for flat rooftops and equal to the rooftop slope for pitched rooftops.
Module area was determined by the rooftop types. For flat rooftops, the solar modules are generally installed in parallel rows and we thus needed to consider the module-to-module shading [33]. For multi-row PV systems, this type of shading is inevitable, although designers can choose a proper array geometry to satisfactorily minimize this type of shading loss. Figure 9 illustrates how module shading affects design geometry for multi-row arrays. α is the azimuth, h is the altitude, l is the length of the array, the tilt angle (θ) is 36°, and d is the distance between the array modules. The distance (d) between the photovoltaic modules was calculated by the Equation (5) [33]:
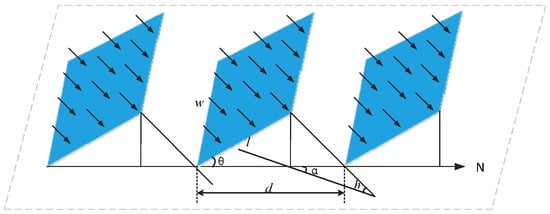
Figure 9.
Schematic diagram of photovoltaic arrays for a flat rooftop [33].
The area of a photovoltaic array (Sa) was calculated based on the area of the rooftop (Sr) by the Formula (6) [33]:
For pitched rooftops, Sa was calculated based on the sunny slope by the following formula:
3.4. Calculation of St and Rt
Based on the area of a photovoltaic array (Sa), the area of non-shadow solar photovoltaic modules (St) can be calculated as follows
where Ss is the area of solar modules shaded by other objects calculated by overlaying the shading for every daylight hour and the rooftop outlines.
The angle correction factor (Rt) should be considered when calculating the direct solar radiation received by the solar photovoltaic modules because of the influence of the angle between the normal vector of the solar photovoltaic modules and the direction vectors of the solar rays. Rt can be expressed as Equation (9) [43,44]:
where θ and γ are the slope and aspect of the solar photovoltaic modules, respectively.
The spatial distribution of solar radiation on rooftops can be simulated by the rooftop 2D outline and 3D parameters. Solar radiation is a highly dynamic phenomenon with strong temporal variation over hours, days and months. The method can be effectively used to identify proper rooftops for installation of solar photovoltaic modules and the areas of solar photovoltaic modules not shaded by the neighboring buildings and trees at each hour.
4. Conclusions
A rapid growth in solar energy applications and interest in the sustainable development of cities have contributed to a growing need for accurate solar resource assessments in urban areas. This study offers a reasonable way to evaluate photovoltaic potential based on remote sensing image and DSM. The method proposed was used to extract the 2D rooftop outlines using the object-oriented classification method based on the spectrum, shape and texture information of remote sensing image data. Then, rooftop types were identified based on the DSM, including flat rooftops, shed rooftops, hipped rooftops, gable rooftops and mansard rooftop types, taking into consideration actual rooftop conditions in the case study area. For different types of rooftops, the rooftop parameters (area, slope, aspect, etc.) were calculated. The rooftops that were suitable for installing solar modules were selected by the two filter conditions that the slope of pitched rooftops was less than 60° and that rooftops were not shaded at 12 noon on the spring and autumnal equinoxes. Based on the rooftop feature parameters, the solar PV module parameters were calculated for different kinds of rooftops. Finally, the area of non-shadowed solar photovoltaic modules (St) and the angle correction factor (Rt) were calculated to assess the solar PV potential.
The proposed method was applied to the sample area, and the monthly and annual PV power generation on rooftops was simulated at an hourly time step. The results showed that the number of rooftops available for PV was 743, and the area was 678,805 m2. The annual PV power generation in the study area was 63.78 GWh/year, and the average PV power generation over each square meter was 93.97 kWh/m2/year. The solar radiation showed strong spatial and temporal variation. The study area received more solar radiation in the third quarter than in other quarters. The maximum monthly PV power generation occurred in July and was 7.16 GWh; the minimum occurred in December and was 2.34 GWh. It was confirmed that the study area has a large potential to implement solar energy use. The application results indicated that the method proposed by this study can effectively estimate PV power generation by specific rooftops and provided an efficient method for solar energy resource potential evaluation and solar energy utilization.
Author Contributions
Conceptualization, X.S. and Y.H.; Formal analysis, C.Z.; Investigation, Y.L. (Yanguo Lu); Methodology, X.S.; Software, C.Z. and J.Y.; Supervision, Y.H.; Validation, Y.L. (Yuxin Liu) and Y.C.; Writing—original draft, X.S.; Writing—review & editing, Y.H.
Funding
This research was funded by the National key Research and Development Plan of China, grant number 2016YFC0401404 and National major scientific instruments and equipment Development Projects of China, grant number 2013YQ12035702.
Conflicts of Interest
The authors declare no conflict of interest.
References
- Rennings, K.; Wiggering, H. Steps towards indicators of sustainable development: Linking economic and ecological concepts. Ecol. Econ. 2016, 20, 25–36. [Google Scholar] [CrossRef]
- He, L.; Li, C.-L.; Nie, Q.-Y.; Men, Y.; Shao, H.; Zhu, J. Core Abilities Evaluation Index System Exploration and Empirical Study on Distributed PV-Generation Projects. Energies 2017, 10, 2083. [Google Scholar] [CrossRef]
- Zsiboracs, H.; Baranyai, N.H.; Vincze, A.; Háber, I.; Pintér, G. Economic and Technical Aspects of Flexible Storage Photovoltaic Systems in Europe. Energies 2018, 11. [Google Scholar] [CrossRef]
- Hong, T.; Lee, M.; Koo, C.; Kim, J.; Jeong, K. Estimation of the Available Rooftop Area for Installing the Rooftop Solar Photovoltaic (PV) System by Analyzing the Building Shadow Using Hillshade Analysis. Energy Procedia 2016, 88, 408–413. [Google Scholar] [CrossRef]
- Bazan, J.; Rieradevall, J.; Gabarrell, X.; Vázquez-Rowe, I. Low-carbon electricity production through the implementation of photovoltaic panels in rooftops in urban environments: A case study for three cities in Peru. Sci. Total Environ. 2018, 622–623, 1448–1462. [Google Scholar] [CrossRef] [PubMed]
- Henrik, Z.; Bai, A.; Popp, J.; Gabnai, Z.; Pályi, B.; Farkas, I.; Baranyai, N.H.; Veszelka, M.; Zentkó, L.; Pintér, G. Change of Real and Simulated Energy Production of Certain Photovoltaic Technologies in Relation to Orientation, Tilt Angle and Dual-Axis Sun-Tracking. A Case Study in Hungary. Sustainability 2018, 10, 1394. [Google Scholar] [CrossRef]
- Pintér, G.; Baranyai, N.H.; Wiliams, A.; Zsiborács, H. Study of Photovoltaics and LED Energy Efficiency: Case Study in Hungary. Energies 2018, 11, 790. [Google Scholar] [CrossRef]
- Cucchiella, F.; Adamo, I.D.; Gastaldi, M. Economic Analysis of a Photovoltaic System: A Resource for Residential Households. Energies 2017, 10, 814. [Google Scholar] [CrossRef]
- Ding, L.; Zhang, F.; Shuai, J. How Do Chinese Residents Expect of Government Subsidies on Solar Photovoltaic Power Generation?—A Case of Wuhan, China. Energies 2018, 11, 228. [Google Scholar] [CrossRef]
- Singh, R.; Banerjee, R. Estimation of rooftop solar photovoltaic potential of a city. Sol. Energy 2015, 115, 589–602. [Google Scholar] [CrossRef]
- SolarGIS. Available online: https://solargis.com/maps-and-gis-data/download/world (accessed on 6 November 2018).
- SolarGIS. Available online: https://solargis.com/maps-and-gis-data/download/China (accessed on 6 November 2018).
- Psomopoulos, C.S.; Ioannidis, G.C.; Kaminaris, S.D.; Mardikis, K.D.; Katsikas, N.G. A Comparative Evaluation of Photovoltaic Electricity Production Assessment Software (PVGIS, PVWatts and RETScreen). Environ. Process. 2015, 2, 175–189. [Google Scholar] [CrossRef]
- Photovoltaic Geographical Information System. Available online: http://re.jrc.ec.europa.eu/pvg_tools/en/tools.html#PVP (accessed on 6 November 2018).
- PVWatts® Calculator. Available online: https://pvwatts.nrel.gov (accessed on 6 November 2018).
- Melius, J. Estimating Rooftop Suitability for PV: A Review of Methods, Patents, and Validation Techniques; National Renewable Energy Laboratory: Golden, CO, USA, 2013. [Google Scholar] [CrossRef]
- Lin, A.; Lu, M.; Sun, P. The Influence of Local Environmental, Economic and Social Variables on the Spatial Distribution of Photovoltaic Applications across China’s Urban Areas. Energies 2018, 11, 1986. [Google Scholar] [CrossRef]
- Zhang, H. Evaluation method and application of photovoltaic potential of urban building roof. Urban Probl. 2017. [Google Scholar] [CrossRef]
- Izquierdo, S.; Rodrigues, M.; Fueyo, N. A method for estimating the geographical distribution of the available roof surface area for large-scale photovoltaic energy-potential evaluations. Sol. Energy 2008, 82, 929–939. [Google Scholar] [CrossRef]
- Wiginton, L.K.; Nguyen, H.T.; Pearce, J.M. Quantifying rooftop solar photovoltaic potential for regional renewable energy policy. Comput. Environ. Urban Syst. 2010, 34, 345–357. [Google Scholar] [CrossRef]
- Ladner-Garcia, H.P.; O’Neill-Carrillo, E. Determining realistic photovoltaic generation targets in an isolated power system. power and energy society general meeting. In Proceedings of the 2009 IEEE Power & Energy Society General Meeting, Calgary, AB, Canada, 26–30 July 2009; pp. 1–5. [Google Scholar] [CrossRef]
- Vardimon, R. Assessment of the potential for distributed photovoltaic electricity production in Israel. Renew. Energy 2011, 36, 591–594. [Google Scholar] [CrossRef]
- Sørensen, B. GIS management of solar resource data. Sol. Energy Mater. Sol. Cells 2001, 67, 503–509. [Google Scholar] [CrossRef]
- Gamal, L.; Effat, H.A. GIS-Based Estimation of Potential Solar Energy on Flat Roofs in Maadi, Cairo, using True Ortho World View Image and Digital Surface Model. Int. J. Adv. Remote Sens. GIS 2015. [Google Scholar] [CrossRef]
- Izquierdo, S.; Montañés, C.; Dopazo, C.; Fueyo, N. Roof-top solar energy potential under performance-based building energy codes: The case of Spain. Sol. Energy 2011, 85, 208–213. [Google Scholar] [CrossRef]
- Jo, J.H.; Otanicar, T.P. A hierarchical methodology for the mesoscale assessment of building integrated roof solar energy systems. Renew. Energy 2011, 36, 2992–3000. [Google Scholar] [CrossRef]
- Jakubiec, J.A.; Reinhart, C.F. A method for predicting city-wide electricity gains from photovoltaic modules based on LiDAR and GIS data combined with hourly Daysim simulations. Sol. Energy 2013, 93, 127–143. [Google Scholar] [CrossRef]
- Jacques, D.A.; James, G.; Jannik, G.; Jacques, D.A.; Gooding, J.; Giesekam, J.J.; Tomlin, A.S.; Crook, R. Methodology for the assessment of PV capacity over a city region using low-resolution LiDAR data and application to the City of Leeds (UK). Appl. Energy 2014, 124, 28–34. [Google Scholar] [CrossRef]
- Schuffert, S.; Voegtle, T.; Tate, N.; Ramirez, A. Quality Assessment of Roof Planes Extracted from Height Data for Solar Energy Systems by the EAGLE Platform. Remote Sens. 2015, 7, 17016–17034. [Google Scholar] [CrossRef]
- Li, Z.; Zhang, Z.; Davey, K. Estimating Geographical PV Potential Using LiDAR Data for Buildings in Downtown San Francisco. Trans. GIS 2016, 19, 930–963. [Google Scholar] [CrossRef]
- Google Maps. Available online: https://maps.google.com (accessed on 6 November 2018).
- National Bureau of Statistics. China Statistical Yearbook; China Statistics Press: Beijing, China, 2017; ISBN 978-7-5037-8253-4.
- Kurdgelashvili, L.; Li, J.; Shih, C.-H.; Attia, B. Estimating technical potential for rooftop photovoltaics in California, Arizona and New Jersey. Renew. Energy 2016, 95, 286–302. [Google Scholar] [CrossRef]
- Sakarapunthip, N.; Chenvidhya, D.; Chuangchote, S.; Kirtikara, K.; Chenvidhya, T.; Onreabroy, W. Effects of dust accumulation and module cleaning on performance ratio of solar rooftop system and solar power plants. Jpn. J. Appl. Phys. 2017, 56. [Google Scholar] [CrossRef]
- Song, X.; Jiang, X.; Jiang, D.; Hunag, Y.; Wan, H.; Wang, C. Object-oriented Classification of High-resolution Remote Sensing Image. Remote Sens. Technol. Appl. 2015, 30, 99–105. [Google Scholar] [CrossRef]
- Turker, M.; Koc-San, D. Building extraction from high-resolution optical spaceborne images using the integration of support vector machine (SVM) classification, Hough transformation and perceptual grouping. Int. J. Appl. Earth Obs. Geoinf. 2015, 34, 58–69. [Google Scholar] [CrossRef]
- Partovi, T.; Huang, H.; Kraus, T.; Mayer, H.; Reinartz, P. Statistical Building Roof Reconstruction from WORLDVIEW-2 Stereo Imagery. Int. Arch. Photogramm. Remote Sens. Spat. Inf. Sci. 2015, XL-3/W2, 161–167. [Google Scholar] [CrossRef]
- Li, F.; Li, J.Z.; Zhang, Q.-X. Algorithm Comparison of Slope and Aspect from DEM. J. Anhui Agric. Sci. 2008, 36, 7355–7357. [Google Scholar] [CrossRef]
- Zhu, D.D.; Yan, D. Calculation of Solar Radiation and Generated Energy on Inclined Plane and Optimal Inclined Angle. Build. Sci. 2012. [Google Scholar] [CrossRef]
- Chen, J.; Liu, H.; Jiang, B. Design of PV Array Spacing on the Roof with Arbitrary Slope Azimuth. Electr. Power Sci. Eng. 2016, 32, 26–30. [Google Scholar] [CrossRef]
- Loutzenhiser, P.G.; Manz, H.; Felsmann, C.; Strachand, P.A.; Franka, T.; Maxwellb, G.M. Empirical validation of models to compute solar irradiance on inclined surfaces for building energy simulation. Sol. Energy 2007, 81, 254–267. [Google Scholar] [CrossRef]
- Wu, Y.-Z.; Zou, L.J. The calculation of spacing between solar cell array in photovoltaic pouler station. Energy Eng. 2011. [Google Scholar] [CrossRef]
- Kacira, M.; Simsek, M.; Babur, Y.; Demirkol, S. Determining optimum tilt angles and orientations of photovoltaic panels in Sanliurfa, Turkey. Renew. Energy 2004, 29, 1265–1275. [Google Scholar] [CrossRef]
- Mehleri, E.D.; Zervas, P.L.; Sarimveis, H.; Palyvos, J.A.; Markatos, N.C. Determination of the optimal tilt angle and orientation for solar photovoltaic arrays. Renew. Energy 2010, 35, 2468–2475. [Google Scholar] [CrossRef]


© 2018 by the authors. Licensee MDPI, Basel, Switzerland. This article is an open access article distributed under the terms and conditions of the Creative Commons Attribution (CC BY) license (http://creativecommons.org/licenses/by/4.0/).