Article

Evaluation of a 1 MW, 250 kW-hr Battery Energy Storage System for Grid Services for the Island of Hawaii

1
Center for Climate Physics, Institute for Basic Science (IBS), Busan 46241, Korea
2
HNU Photonics LLC, Kahului, HI 96732, USA
3
Integrated Dynamics, Inc., Fishers, IN 46037, USA
4
Hawai‘i Natural Energy Institute, SOEST, University of Hawaii at Mānoa, Honolulu, HI 96822, USA
*
Author to whom correspondence should be addressed.
Energies 2018, 11(12), 3367; https://doi.org/10.3390/en11123367
Submission received: 27 October 2018 / Revised: 15 November 2018 / Accepted: 22 November 2018 / Published: 1 December 2018
(This article belongs to the Special Issue Grid-Scale Energy Storage Management)

Abstract

:
Battery energy storage systems (BESSs) are being deployed on electrical grids in significant numbers to provide fast-response services. These systems are normally procured by the end user, such as a utility grid owner or independent power producer. This paper introduces a novel research project in which a research institution has purchased a 1 MW BESS and turned ownership over to a utility company under an agreement that allowed the institution to perform experimentation and data collection on the grid for a multi-year period. This arrangement, along with protocols governing experimentation, has created a unique research opportunity to actively and systematically test the impact of a BESS on a live island grid. The 2012 installation and commissioning of the BESS was facilitated by a partnership between the Hawaii Natural Energy Institute (HNEI) and the utility owner, the Hawaiian Electric and Light Company (HELCO). After the test period ended, HELCO continued to allow data collection (including health testing). In 2018, after 8500 equivalent cycles, the BESS continues to operate within specifications. HNEI continues to provide HELCO with expertise to aid with diagnostics as needed. Details about the BESS design, installation, experimental protocols, initial results, and lessons learned are presented in this paper.

1. Introduction

At high penetration levels, the integration of intermittent renewable energy sources poses several challenges for grid operations, due, in part, to the variability of renewable energy sources, but also due to the reduction of system inertia via the displacement of traditional dispatchable generation. These factors can result in a reduction in grid stability and reliability, manifesting in such ways as increased frequency variability, voltage transients, and power quality reduction [1,2,3]. Such effects are magnified on small island grids such as those on the Hawaiian islands [4]. The geographic isolation of the islands’ electricity grids and the rapid growth of renewable generation make the Hawaiian grids particularly susceptible to the adverse effects of variable renewable energy sources, but also an ideal test-bed for various emerging grid solutions, including energy storage. With already high penetration of wind and solar generation, recently passed legislation set a goal of 100% renewable energy by the year 2045 for the state [5] and recent utility planning ensures that the islands’ grids will see increasing renewable energy penetration in the coming years. Similar challenges and solutions are also being addressed on other island grids [6,7,8,9,10].
Fast-acting battery energy storage systems (BESSs) show promise in mitigating many of the effects of high renewable energy penetration levels [11,12,13,14,15]. Despite substantial numbers of deployments worldwide, few studies have reported results of grid-connected systems [16,17,18,19]. This paper presents a unique field test of a BESS operating on an island electric grid which was made possible by a partnership between the Hawaii Natural Energy Institute (HNEI), at the University of Hawaii at Mānoa, and the utility grid operator, the Hawaii Electric Light Company (HELCO, Hilo, HI, USA). In accordance with the agreement, HNEI purchased the BESS, then relinquished ownership to HELCO, but was allowed to perform experiments with the BESS while it was operating on the electric grid. The experiments involved switching the BESS on and off every 20 min. This switching forms both an independent and dependent variable over a relatively short time (minimizing changes in background conditions). This allowed for much more direct measurements of the effect of the BESS on the island grid than would be possible with data from long-term monitoring of the grid before and after BESS installation. To the best of our knowledge, no other BESS research projects involve a multi-year agreement that allows for robust scientific experimentation.
The work presented here is part of a larger research program at HNEI, which includes assessment of battery performance on the grid, optimization of control algorithms to maximize grid support while minimizing battery cycling [20], and field and laboratory testing of cells to better understand cell aging and degradation [21,22]. This paper focuses on the grid support performance aspect, along with initial testing and methodology. The paper describes Hawaii Island BESS project including project development and installation (Section 2), development of the control algorithms, acceptance test results, and initial performance tests (Section 3) followed by concluding remarks and the plans for future work (Section 4).

2. BESS Development and Installation

The investigation into use of a BESS system for the island of Hawaii was initiated as a result of a 2009 analysis of that electrical grid performed by General Electric (GE, Schenectady, NY, USA) under contract to HNEI. The study utilized the Positive Sequence Load Flow (PSLF) power system analysis software and historical data to model the frequency response of the Hawaii island grid to rapid changes in wind generation and other contingency events. At the time of the study, the electric grid, operated by the Hawaii Electric Light Company (HELCO), had a peak load of approximately 180 MW and a wind capacity of approximately 32 MW. While there has been rapid growth since, there was negligible photovoltaics on the system at that time. The models indicated that as little as 1 MW of short-duration fast-acting energy could significantly reduce the severity and duration of the grid frequency events.
These results prompted HNEI to develop a research project to procure and evaluate a 1 MW grid-connected BESS. HNEI and the grid owner, HELCO, reached a mutually beneficial memorandum of understanding that would facilitate the realization of this research project (and address any liability issue). In accordance with the agreement, HNEI procured the BESS, and transferred ownership over to HELCO immediately after commissioning. The agreement further stipulated that HELCO would provide HNEI with the ability to perform experiments on the grid (provided adherence to protocol that was agreed upon by both parties). A lithium ion titanate battery chemistry was chosen due to the desire for an extended cycling lifetime and faster charge/discharge rates compared to the more common carbon anode electrochemistry [23].
HNEI assembled a public-private partnership (Table 1) for BESS development, installation, and testing. The key tasks included: site preparation, material procurement, electrical design, communications design, and algorithm development. Procurement of balance of plant (BOP) materials (e.g., transformers, meters, and compatible communications devices) was undertaken by HELCO, Altairnano (Anderson, IN, USA), and HNEI. The site preparation was conducted jointly by Altairnano and the installation site land owner, Haw’i Renewable Development (HRD, Upolu Point, HI, USA), which owns a collocated 10.6 MW wind farm. The electrical and communications systems were designed by HELCO and Altairnano. Algorithm development was performed by Integrated Dynamics Inc. (IDI, Fishers, IN, USA) and SCADA Solutions Inc. (Irvine, CA, USA). HNEI provided program management and technical oversight in all areas of the development effort.
The BESS was installed at a transmission level site on the grid, at the point of common coupling (PCC) between the HRD wind farm and the nearby Waimea substation. Site construction started in April of 2012 and the BESS was commissioned in December of 2012. The BESS was designed for interconnection to electrical power systems (as defined by ANSI C84.12006), and to be compliant with applicable standards during discharge (IEEE 15472003) and standby/charging modes (IEEE 519) [24].
The system is housed in two containers, one for the power module (PM, Figure 1a) and a second for the power conversion system (PCS, Figure 1b). The PM contains the battery stack, along with a ground fault detection system, a fire suppression system, HVAC temperature control system, the battery management system (BMS), and the site dispatch controller (SDC). The BMS is responsible for monitoring, controlling, and protecting the battery cells, including monitoring state-of-charge (SOC), preventing over-charge/under-charge, and protecting against thermal damage. The PCS contains a four-quadrant Parker-Hannifin inverter (+/− real and reactive power), cooling system, metering units, processing units, and associated protection.
The control center of the BESS is the site-dispatch controller housed in the power module, which performs the following tasks:
  • Collects and stores all data on the cloud server
  • Utilizes data from the BMS (e.g., SOC and cell temperatures) and the inverter system in the PCS to determine any limits on available power
  • Processes the measured data to develop power commands using real-time control algorithms
  • Executes manual commands inputted by a user
The SDC coordinates the PM and PCS to provide the desired amount of real and/or reactive power at the point of common connection (PCC). It can accept automatic generation control (While the AGC capability exists, it was never connected or utilized.) (AGC) commands or operate in manual or automatic modes. In manual mode, the operator specifies the amount of real/reactive power desired, while in automatic mode the power command is calculated according one of two control algorithms (Section 3). Operators interact with the SDC via a PC-based Human Machine Interface (HMI) over a secure network connection. These interactions typically include: selection of control algorithms, algorithm parameter settings, diagnostics, or inputting of manual commands. Manual commands are often used to execute State-of-Health tests which are performed at regularly scheduled intervals.
Figure 2 shows a simplified diagram of the system, indicating the location of the four meters used for data collection. There are three Schweitzer SEL-735 m which sample current, voltage, and frequency; one each for the BESS (“Battery”), the wind farm (“Wind Farm”), and combined signals (“Totalizer”). There is also a Shark 200 m that can be used to determine the amount of auxiliary power that the BESS consumes. The meters sample at 10 Hz for control purposes. Data is recorded to the cloud server at a rate of 5 Hz for analysis. Within the PM, battery cells are organized as follows: 7 cells to a “cell group”, 2 cell groups to a module, and four modules to a line replaceable unit (LRU, Figure 2, inset). Voltages for each group (7 cells) are sampled at 10 s intervals, and temperatures for groups of 28 cells (2 modules consisting of 2 cell groups each) are recorded every minute. These data, along with diagnostics and environmental data within the container, are stored in a cloud server for later analysis. 7 cells are connected in parallel. 384 of these parallel groups are connected in series.

3. Control Algorithms

Most of the time, the Hawaii Island BESS operates in the automatic mode. In this mode, one of two algorithms can be selected, a wind smoothing algorithm or a frequency response algorithm. The algorithms were developed by SCADA Solutions, LLC and Integrated Dynamics, Inc. (IDI) on behalf of the battery manufacturer, Altairnano. These algorithms were developed in close consultation with the utility (HELCO) and the HRD wind farm. Both algorithms were developed through a similar process required by HNEI (Figure 3) which is described below. Process ensures that the algorithms were meeting the design and performance objectives.
The development process began by defining a set of requirements and specifications for each algorithm. Once these were agreed upon by all stakeholders, Altairnano and IDI designed the algorithms and HMI user interface to meet the specifications. Next, simple modeling studies were performed to optimize control algorithm parameters and to ensure the predicted behavior of the BESS under each algorithm met the design objectives. After the algorithms passed an acceptance test based on the modeling studies, laboratory testing with computational hardware in-the-loop was executed. This step determined whether the algorithms, running on the embedded computers performed as intended. Lastly, a site acceptance test (SAT) plan was developed and executed during BESS commissioning to ensure that the algorithms performed as intended in the field. Descriptions of the two algorithms and the results of site acceptance and initial testing of the algorithms are presented in the following sections.

3.1. Frequency Response: Algorithm Development and Testing

Some of the most important results in this section were made possible by the agreement between HNEI and HELCO. As the section progresses, it will become apparent that quantifying the impact of a frequency response algorithm would be limited without the unique ability of experimentalists to actively engage in control of the BESS, and hence, the response of the grid. Unlike power smoothing (including wind smoothing), it is not possible to directly determine how the grid frequency ‘would have behaved’ if the BESS (running a frequency response algorithm) was not present. This would otherwise complicate the assessment of performance.
The electric grid on the island of Hawaii operates with a relatively high penetration of non-dispatchable renewable resources (70 MW of wind and solar on a 180 MW grid in 2013), which can result in increased frequency fluctuations due to mismatch of load and generation and reduced rotational inertia. The frequency response algorithm was designed to mitigate such frequency deviations by sourcing and sinking real power to/from the grid as needed.
The grid frequency is measured by two meters: (a) Shark 200 m, and (b) SEL-735 m (Figure 2, top left of Figure 4). The Shark meter proved to have a significant lag due to filtering, so the frequency signal is obtained from the SEL-735 m in the field for control purposes. The frequency signal is passed through an outlier rejection filter to prevent overly large ramp rates and a low pass filter to prevent potential oscillations.
The primary component for adjusting the frequency response algorithm is the frequency-Watt (f-W) curve. The curve can be configured with a deadband of various widths and with various proportional gains, i.e., the slope of the f-W curve in MW/Hz (Figure 4, inset). The result of the f-W curve is summed with a real power component to maintain a target state-of-charge (SOC). This sum is then limited by total available power, with a further limitation based on BMS and inverter data before sending a real power command to the inverter.
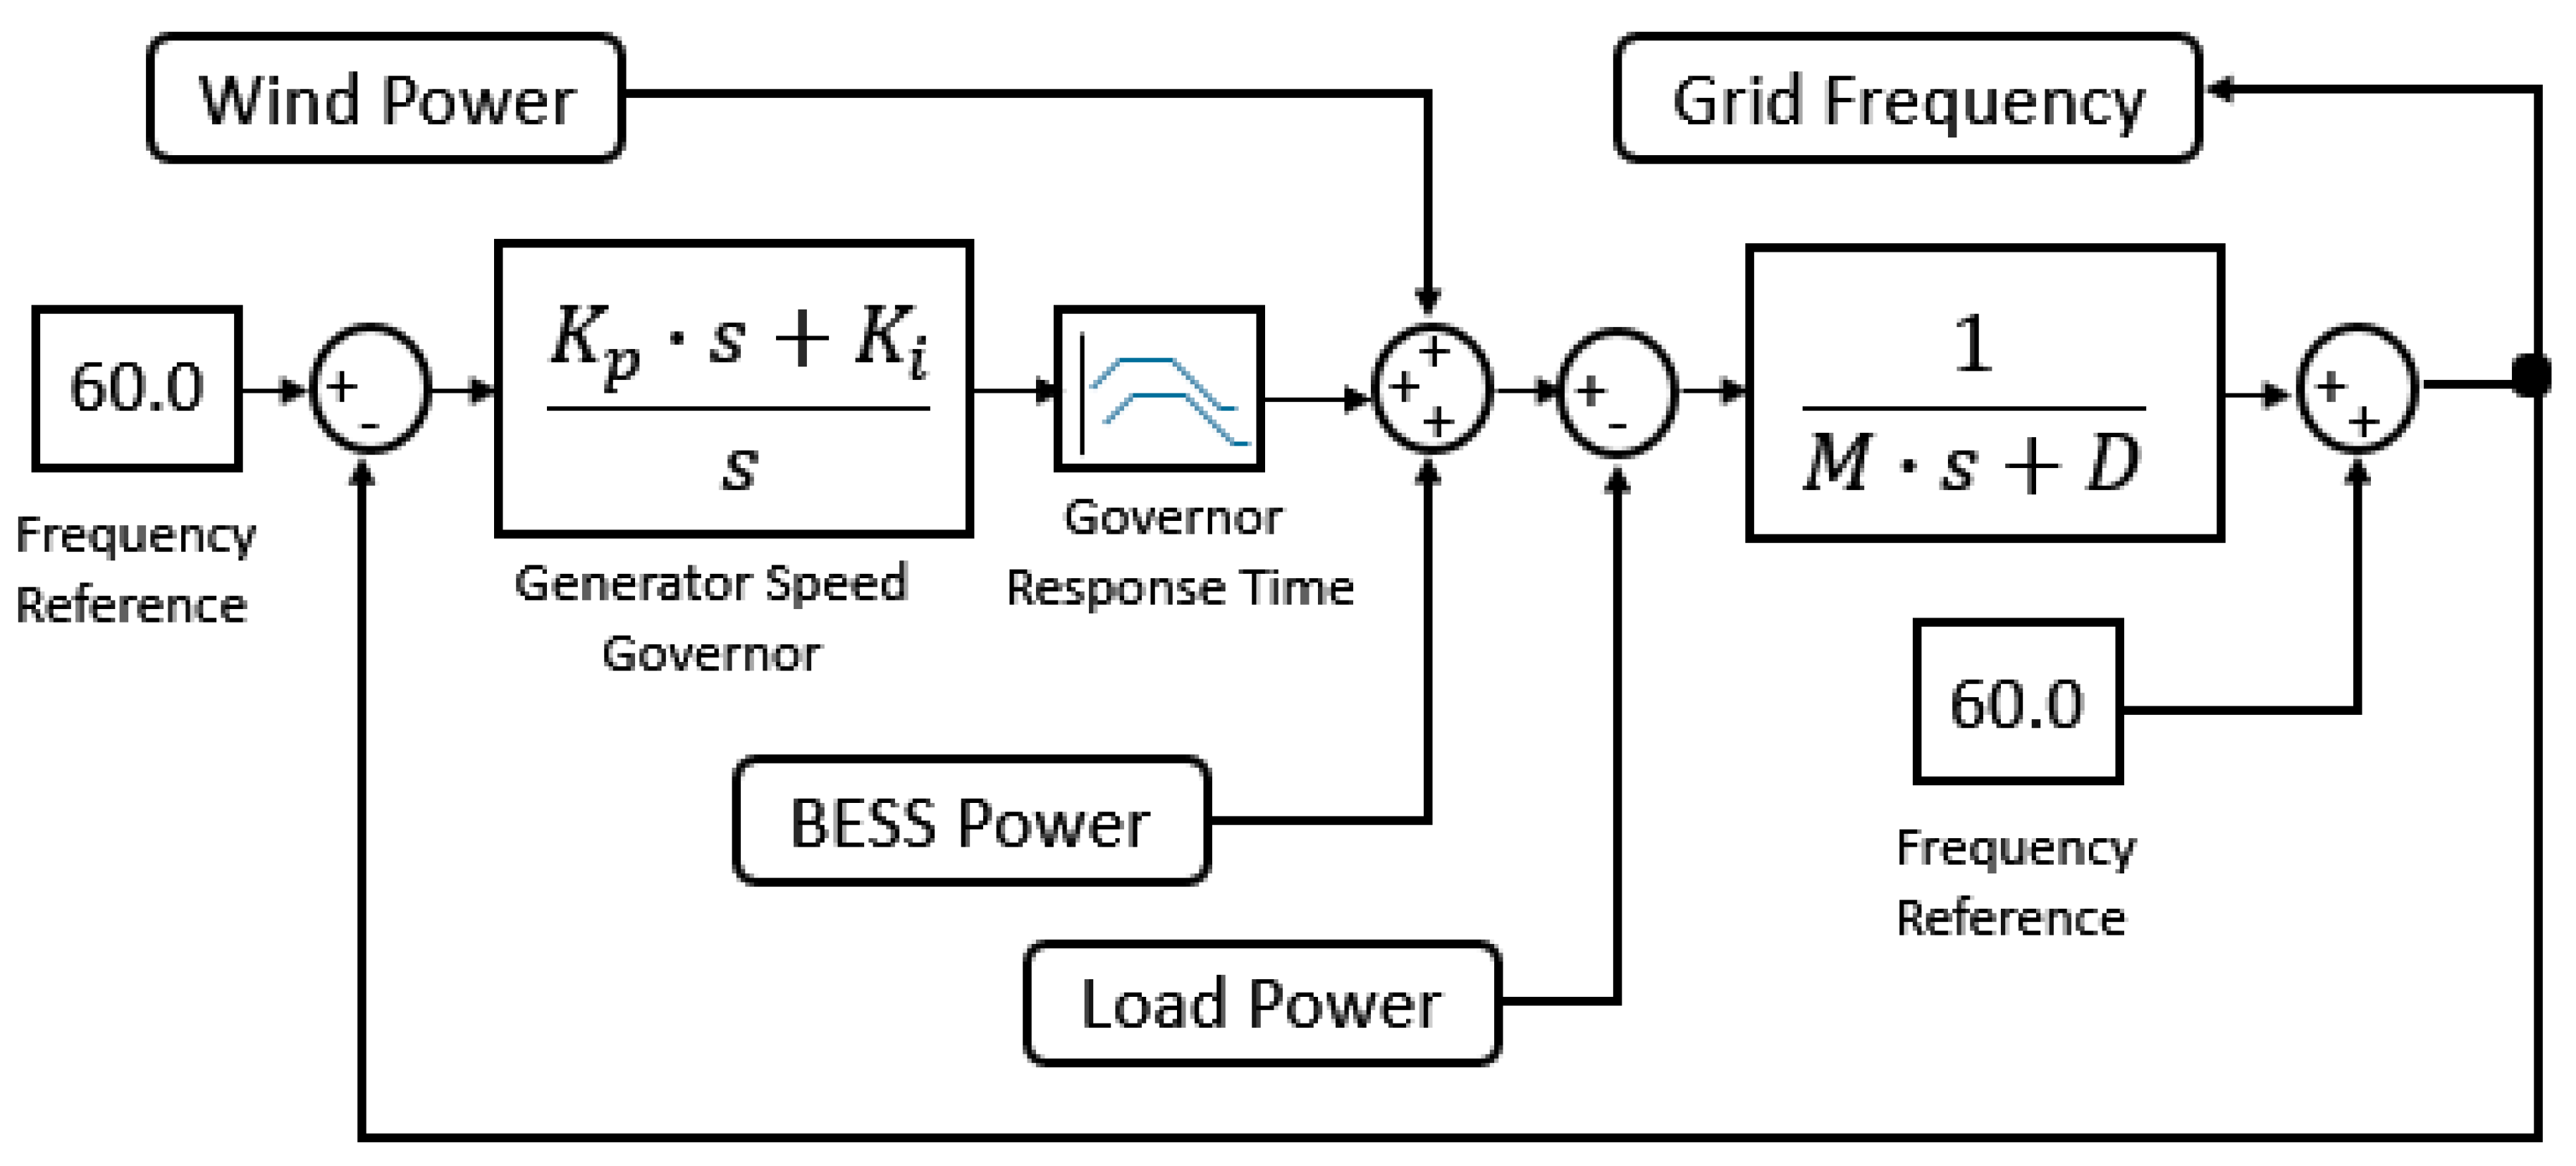
The frequency response algorithm was first tested within a simple grid model developed on the MATLAB/Simulink platform. A model of the BESS was incorporated into a simple model of the grid dynamics [25], in which a single generator model represented the cumulative effect of all the generators on the grid, and which included a wind generation input (Figure 5). The unknown parameters of the grid model were inertia constant (M), damping constant (D), governor gains (Kp and Ki), and generator response time. These were estimated based on historical telemetry provided by HELCO. The consequence of a large number of unknowns is the possibility of parameter trades (i.e., a particular set of parameters causes the model to “fit” the grid frequency data, but this may not be the physically correct set of parameters). For this reason, a variety of reasonable parameter sets were used during testing. This, in turn, provided a variety of possible predicted behaviors. The full range of results indicated that the BESS would not worsen the grid frequency. Model runs using the sets of telemetry-estimated parameters showed that the frequency response algorithm would improve both the transient response of the grid to disturbances and the steady-state variability in grid frequency.
During the site acceptance test, the grid frequency was observed for several 6–8 Hr periods with the BESS off, and several 6–8 Hr periods with the BESS on. The results of the test showed that the BESS did not degrade frequency variability, but there was also no statistically significant evidence that the BESS reduced frequency variability with the proportional gain at 10 MW/Hz. Subsequent testing by HNEI revealed that a statistically significant reduction in grid frequency variability could be achieved by increasing the proportional gain (slope of the f-W curve) to 30 MW/Hz or more. Also, because grid conditions and generator dispatch change over a shorter time frame, it was preferable to make observations over shorter time periods rather than 6–8 Hr windows. A new protocol was therefore developed for testing the BESS under the frequency response control algorithm, as described in the following section.
In order to test the effect of the BESS on grid frequency during field operations, HNEI designed, and HELCO approved a test protocol to mitigate the effects of time varying background grid conditions. The protocol called for switching the BESS ON and OFF every 20 min allowing the frequency variability of consecutive OFF/ON periods to be compared to assess the impact of the BESS. A time period of 20 min was chosen for each OFF and ON period in order to balance sufficient data collection against the changing background grid conditions.
The “switching experiments”, typically 200 min in duration, were initially performed only in the evening hours to isolate the frequency variability due to wind fluctuations. Examples of two evening experiments are shown in Figure 6. One experiment was conducted during an evening with light winds (Figure 6a) and another was conducted during an evening with medium winds (Figure 6b). In both, the red oscillating lines in Figure 6 (top) indicate when the battery was on showing real power output of the BESS. The center plots show wind power output at the 10.6 MW Haw’i wind farm. The bottom plots display the grid frequency during the experiments. Comparing contiguous red and black sections in the bottom plots, it is apparent that there was a reduction in grid frequency variability when the BESS was ON (red) compared to when the BESS was OFF (black).
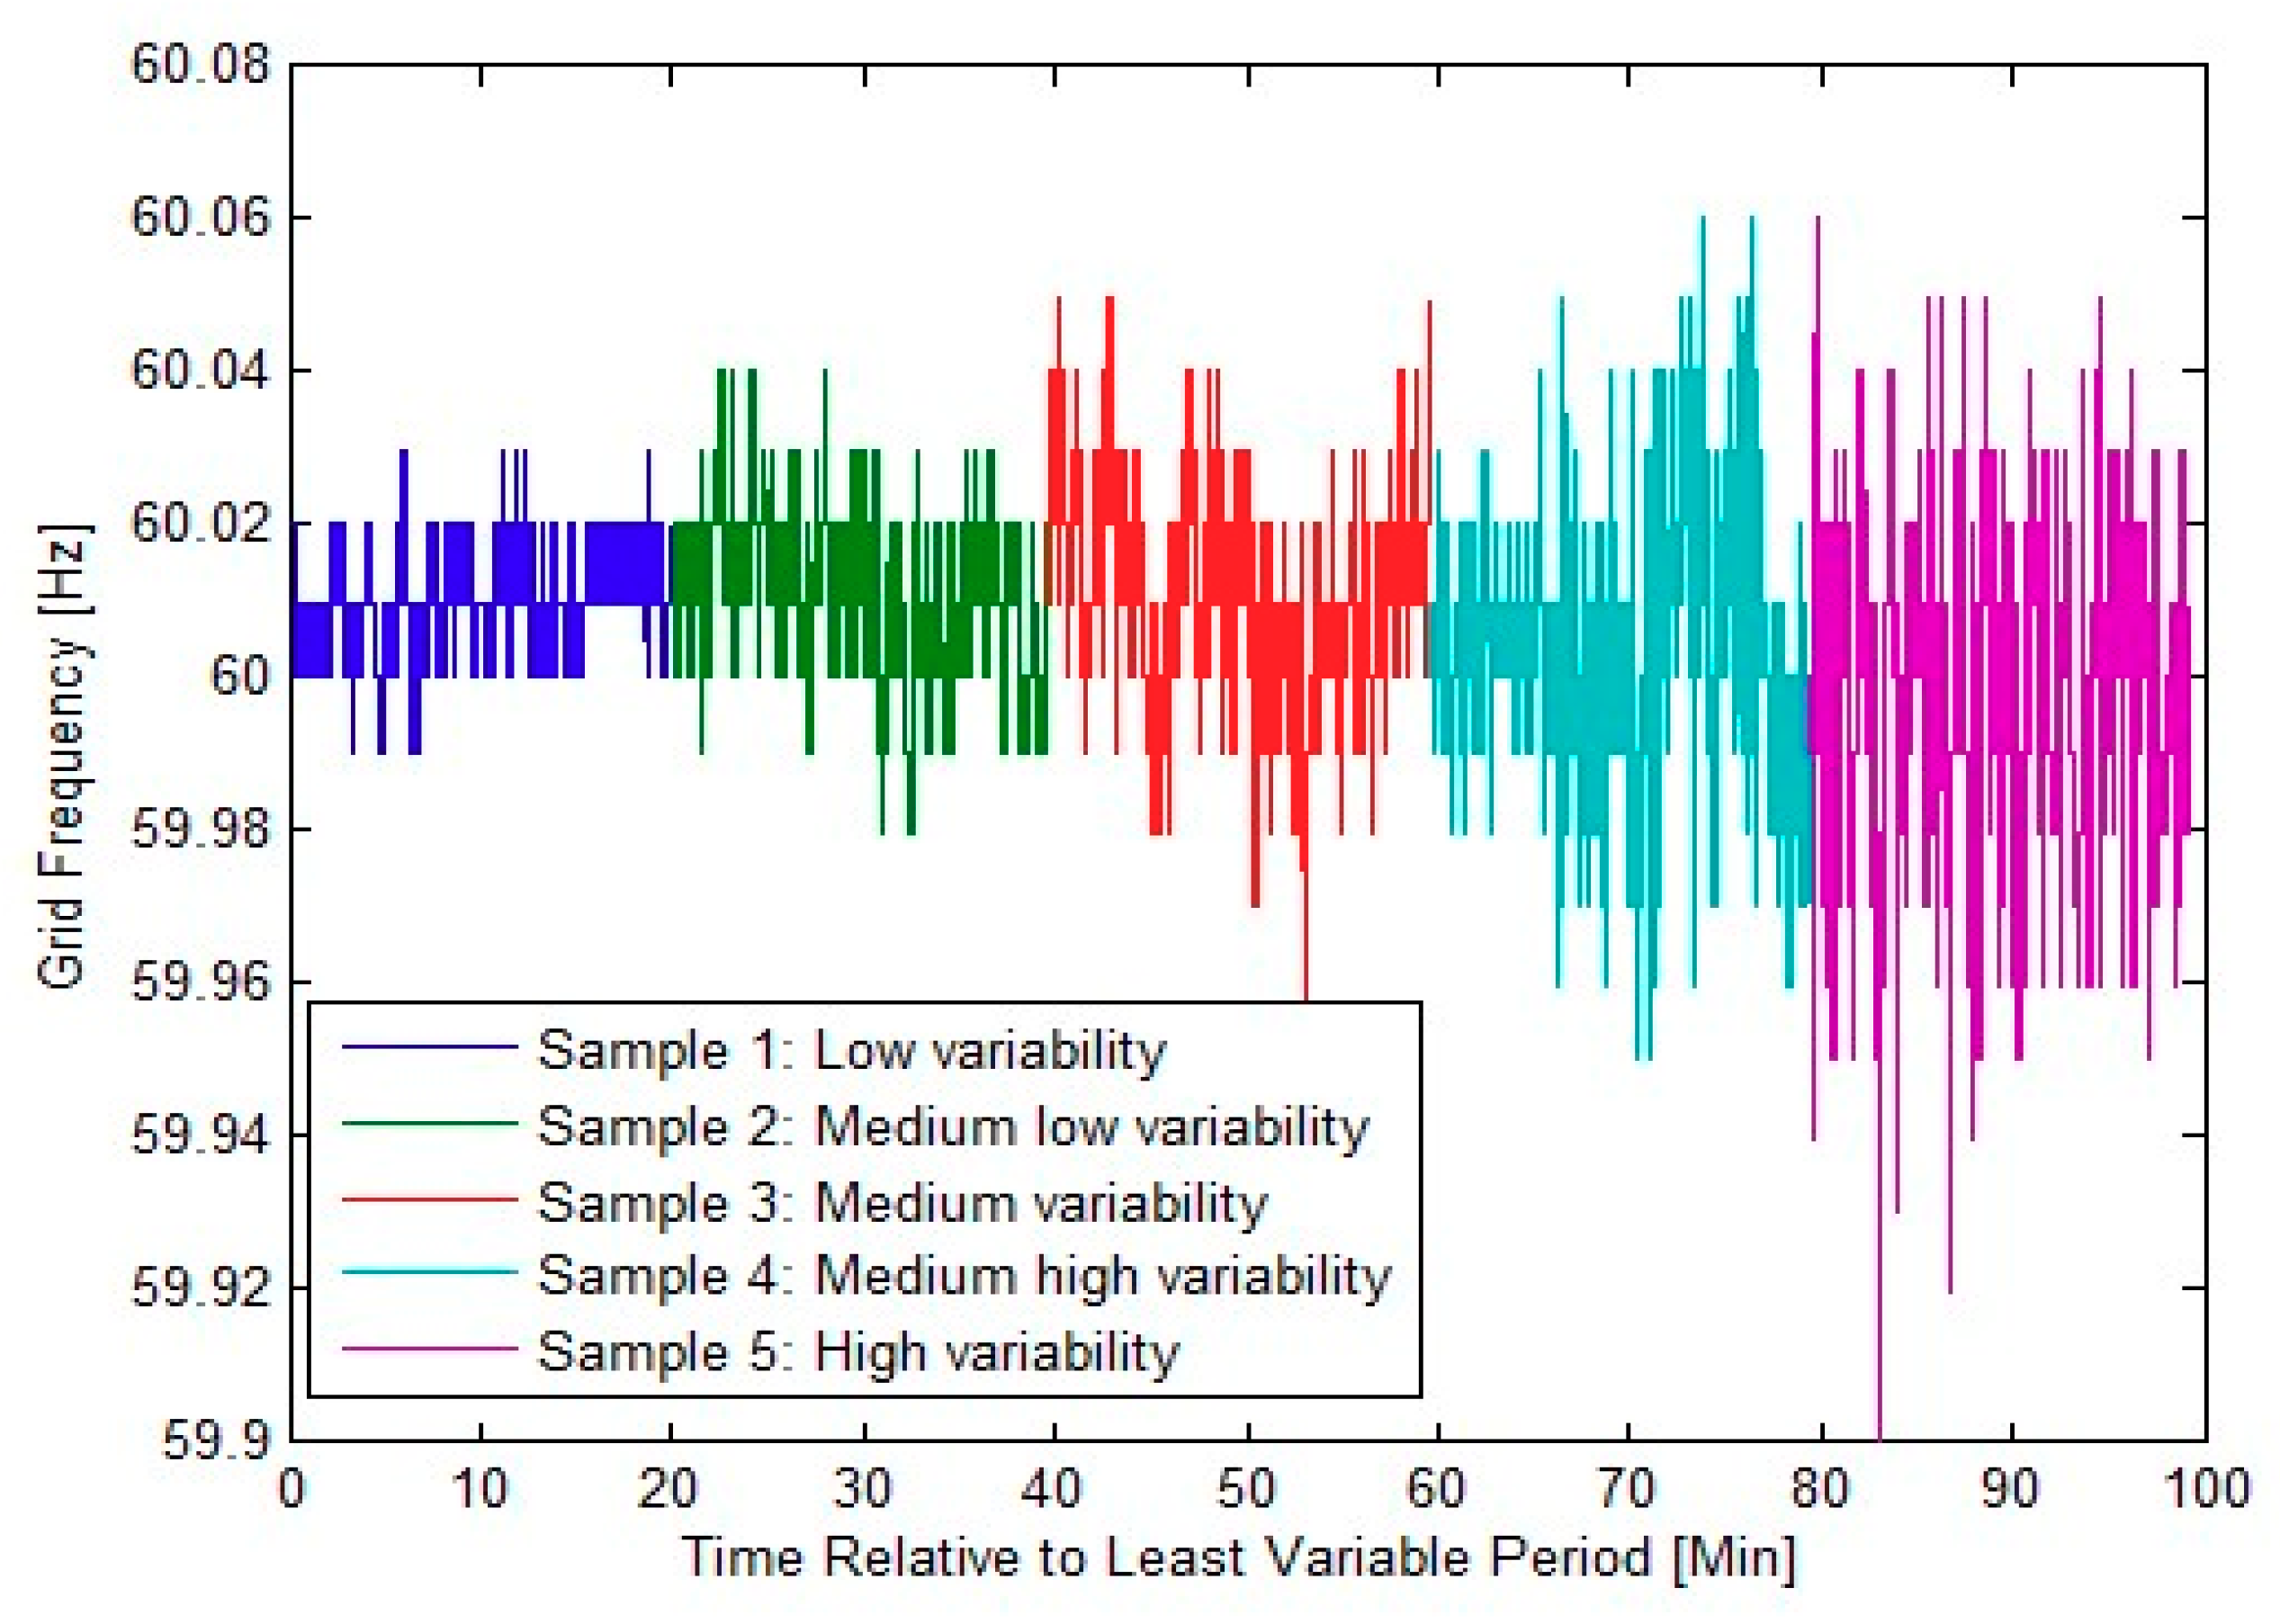
In order to quantify the reduction in grid frequency variability, the standard deviation of grid frequency was calculated for each 20-min period. To verify that this metric captured grid frequency variability in a believable way, 5 sample time series of grid frequency were ordered by eye (left to right) by a few researchers (Figure 7). The ordering was then compared to the values of the metric. The standard deviations (in mHz) were 7.1, 11.2, 14.2, 17.6, and 24.3 respectively from left to right in Figure 7, corresponding to the visual ordering of the frequency variability.
Table 2 shows the standard deviations and percent changes for the data presented in Figure 6. Each OFF/ON pair is referred to as an “interval”. The standard deviations for the 5 intervals for the evening with low wind is shown in the upper part of the table, and the 5 intervals for the evening with medium winds is shown in the bottom. The mean percent change for the light wind case is −15.4%, with the negative indicating a reduction of frequency variability by 15.4% when the BESS is ON. The mean percent change for the medium wind case is −37.1%, indicating that with increasing grid frequency variability, the BESS has a stronger proportional effect.
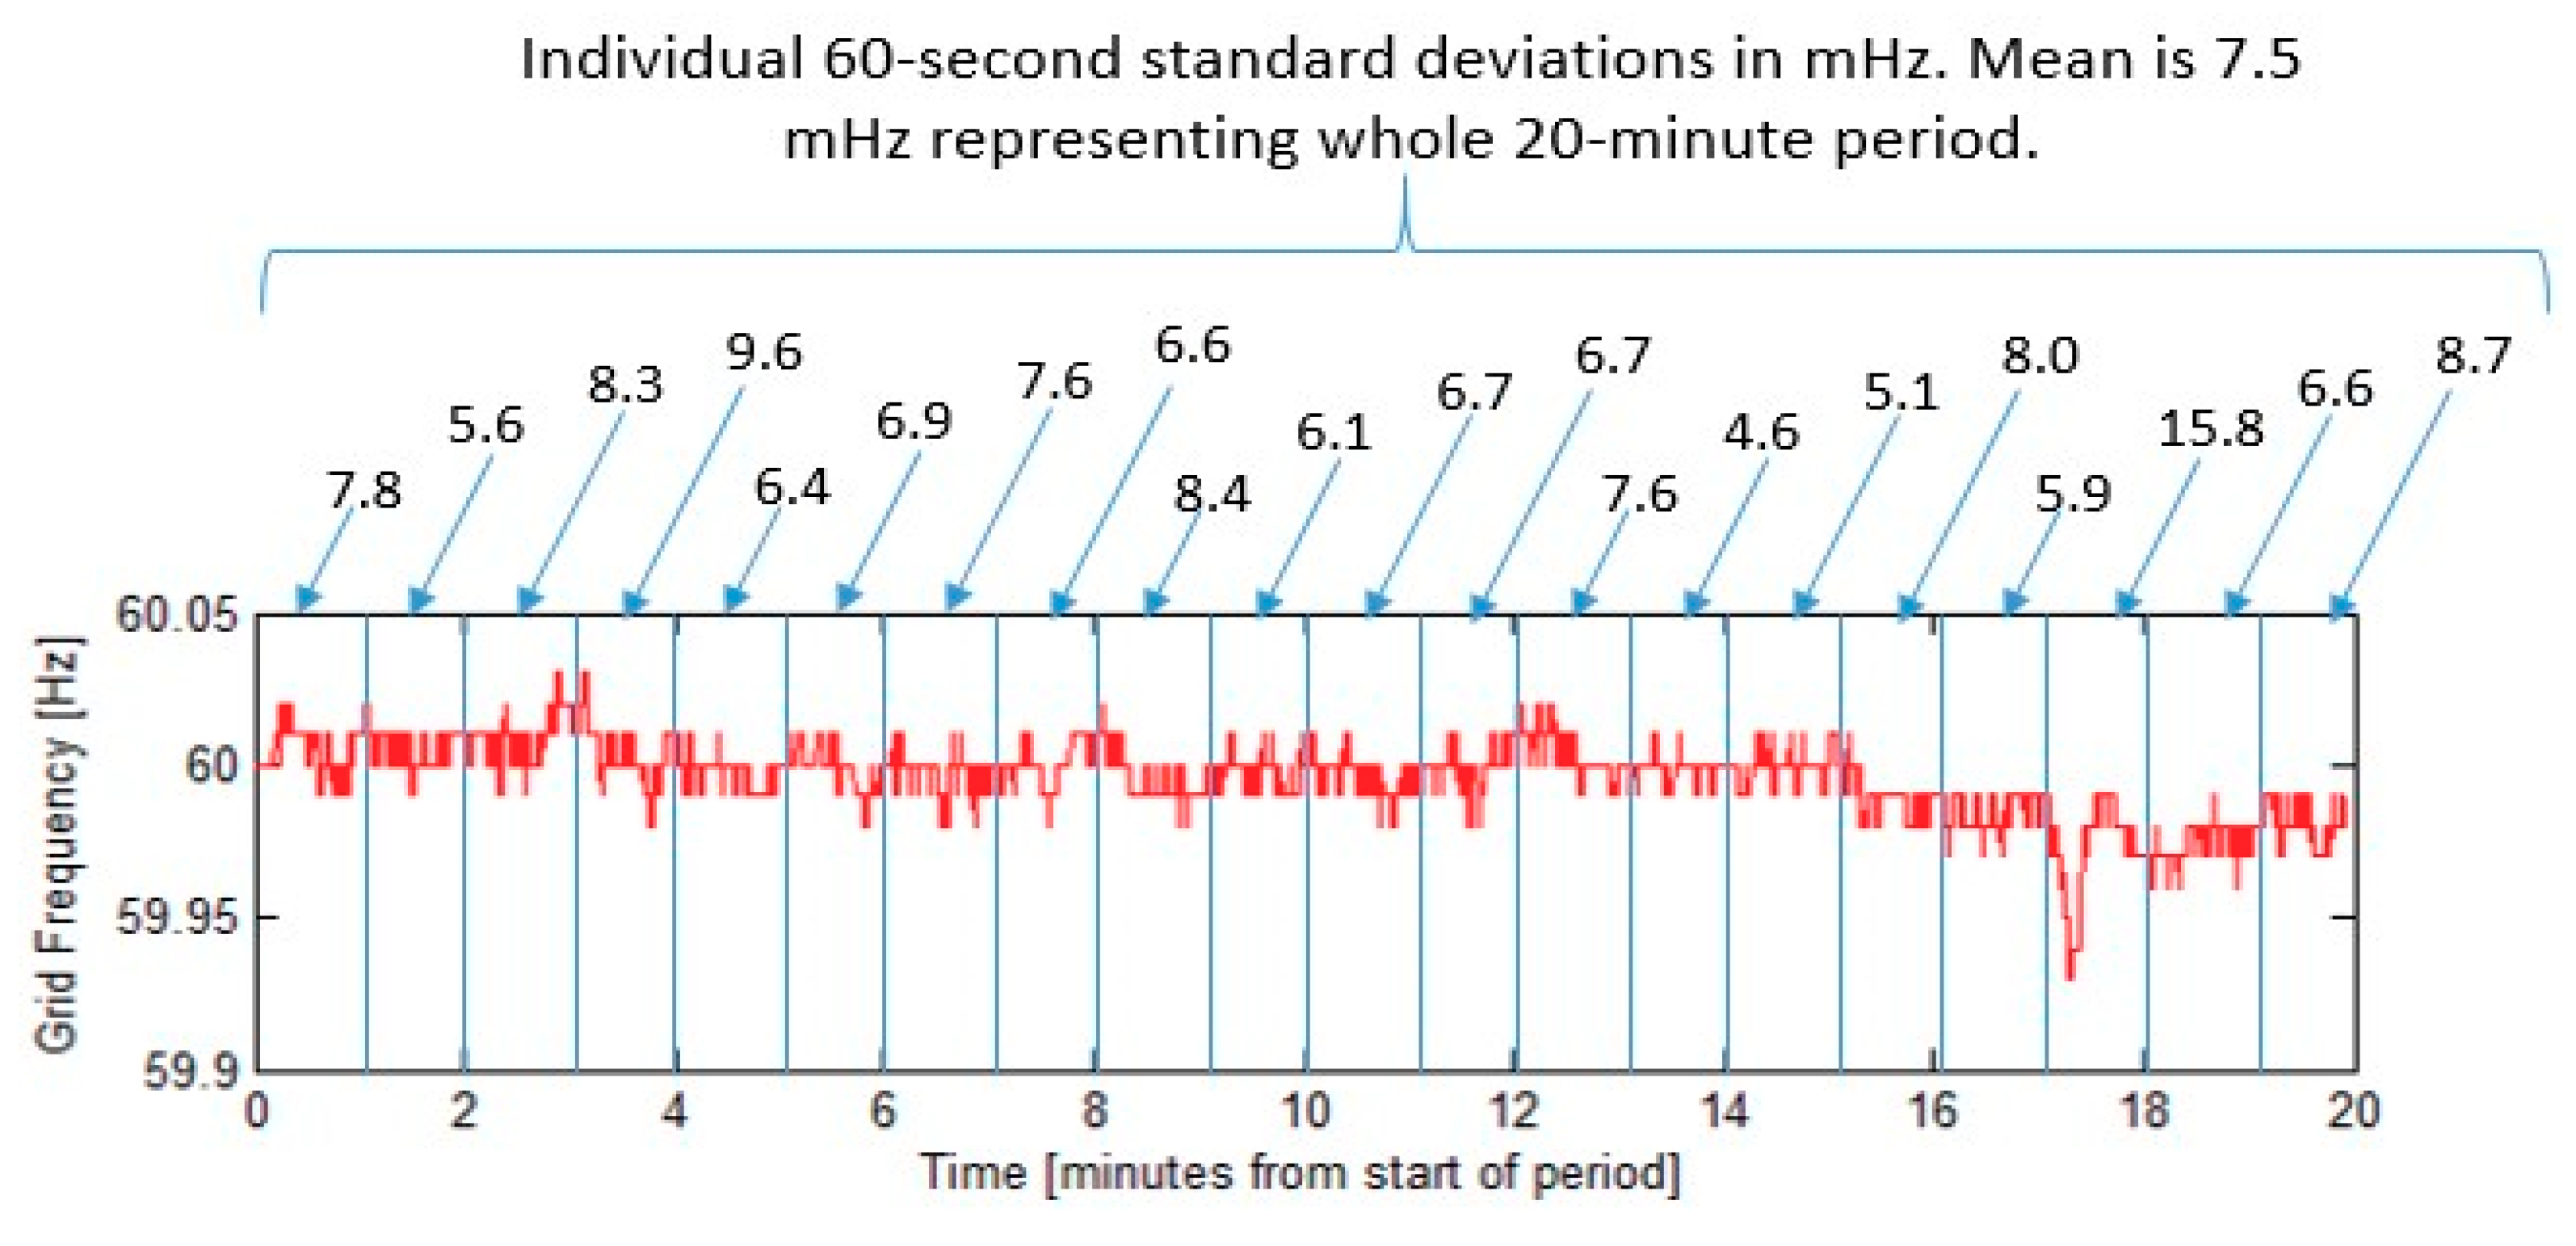
Although the above approach is a useful metric for assessing how the overall frequency variability is reduced, it does not provide any information on how well the frequency variability is reduced on short timescales, and therefore does not optimally measure the effect of using a fast-acting battery. If a timescales of several minutes or longer were chosen, then the grid frequency control would be dominated by generator governors, and one is not measuring the effectiveness of the BESS. For this reason, it was decided that the 20-min periods would be divided into several smaller non-overlapping segments, and the standard deviation of each of the smaller segments taken. The mean of those standard deviations is then determined and used to provide a single metric characterizing the whole 20-min period. The length of the smaller segments is referred to as the timescale. This process is illustrated by example in Figure 8. The grid frequency data is separated into smaller 60 s segments. The standard deviations of those 60 s segments are shown just above the plot. The mean of those values was calculated to be 7.5 mHz and represents the variability for the entire 20-min window.
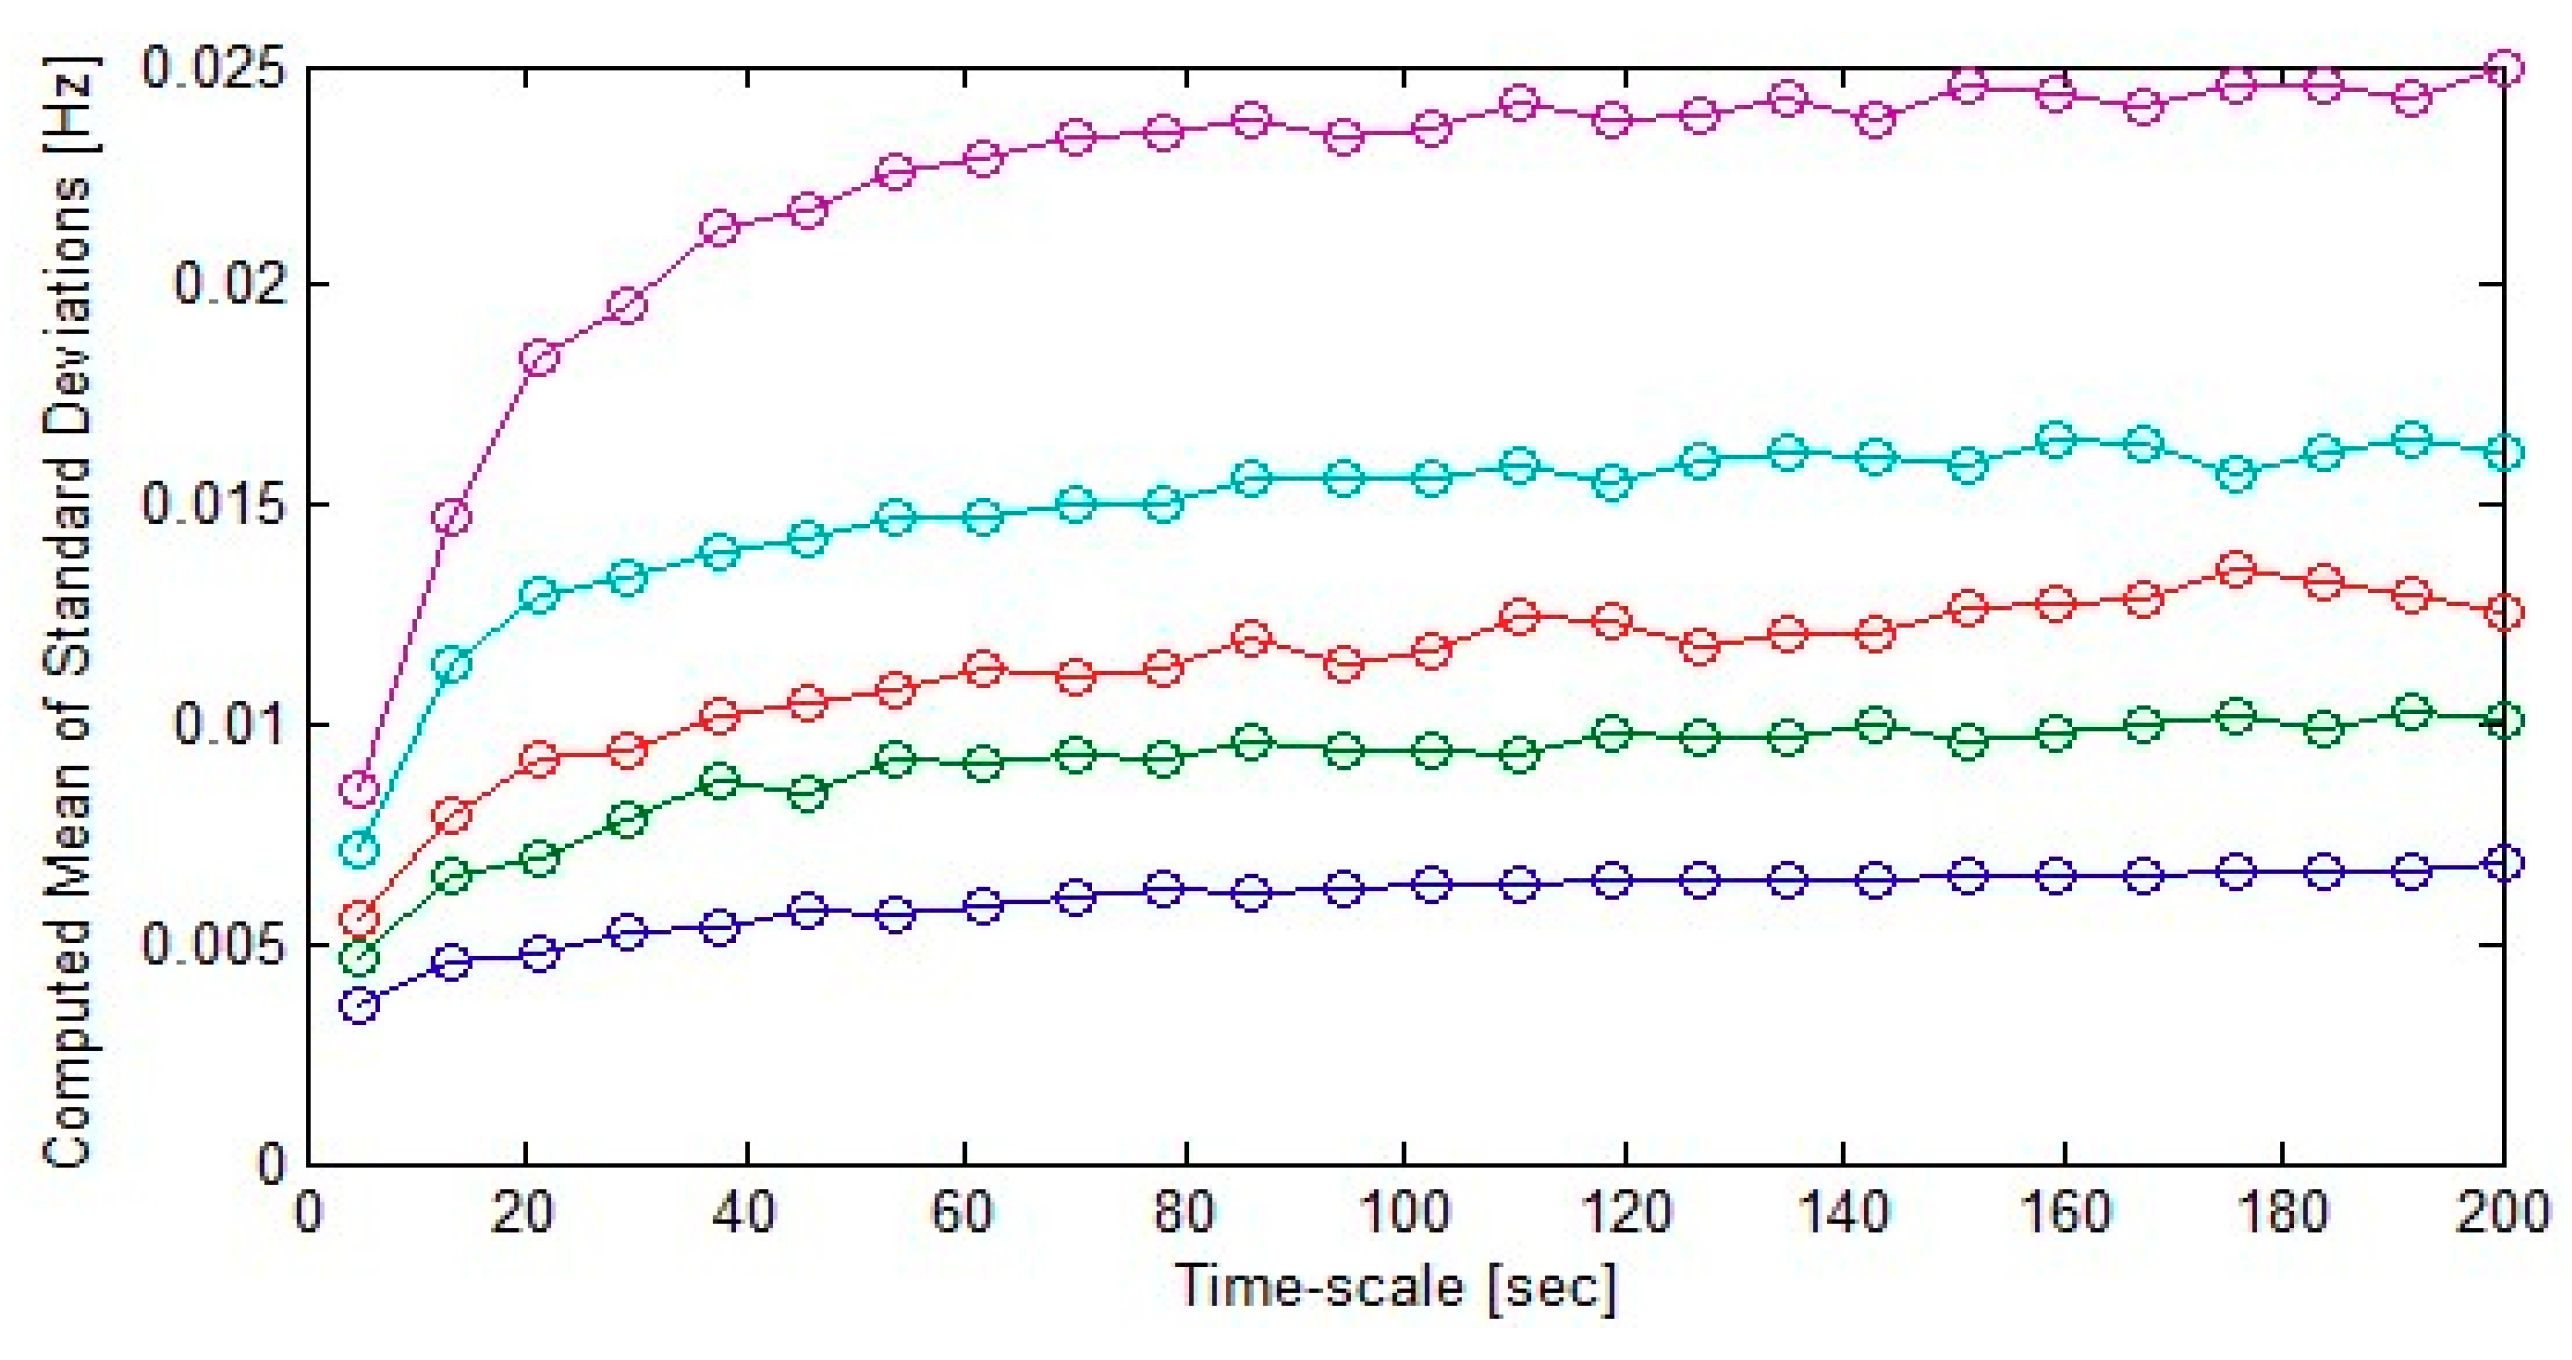
Timescales that are too short present problems as well. Figure 9, shows the mean of the standard deviations over a number of timescales and for the same samples as shown in Figure 7, with the same colors (e.g., Sample 1 is blue in both figures). At timescales from seconds to tens of seconds, the measured standard deviation depends on the chosen time scale, so one does not have a stable metric. Moreover, the shortest timescales do not show good separation between the high and low grid variability periods. At timescales of approximately one minute and longer, the measured standard deviation values level off towards a near-constant value; in other words, the measured values are no longer timescale dependent. Moreover, the separation between more and less variable periods increases up to the one-minute timescale, and then levels off as well. The one-minute timescale was therefore chosen to balance the need to capture the quick BESS response with stable metric that can distinguish high a low variability periods.
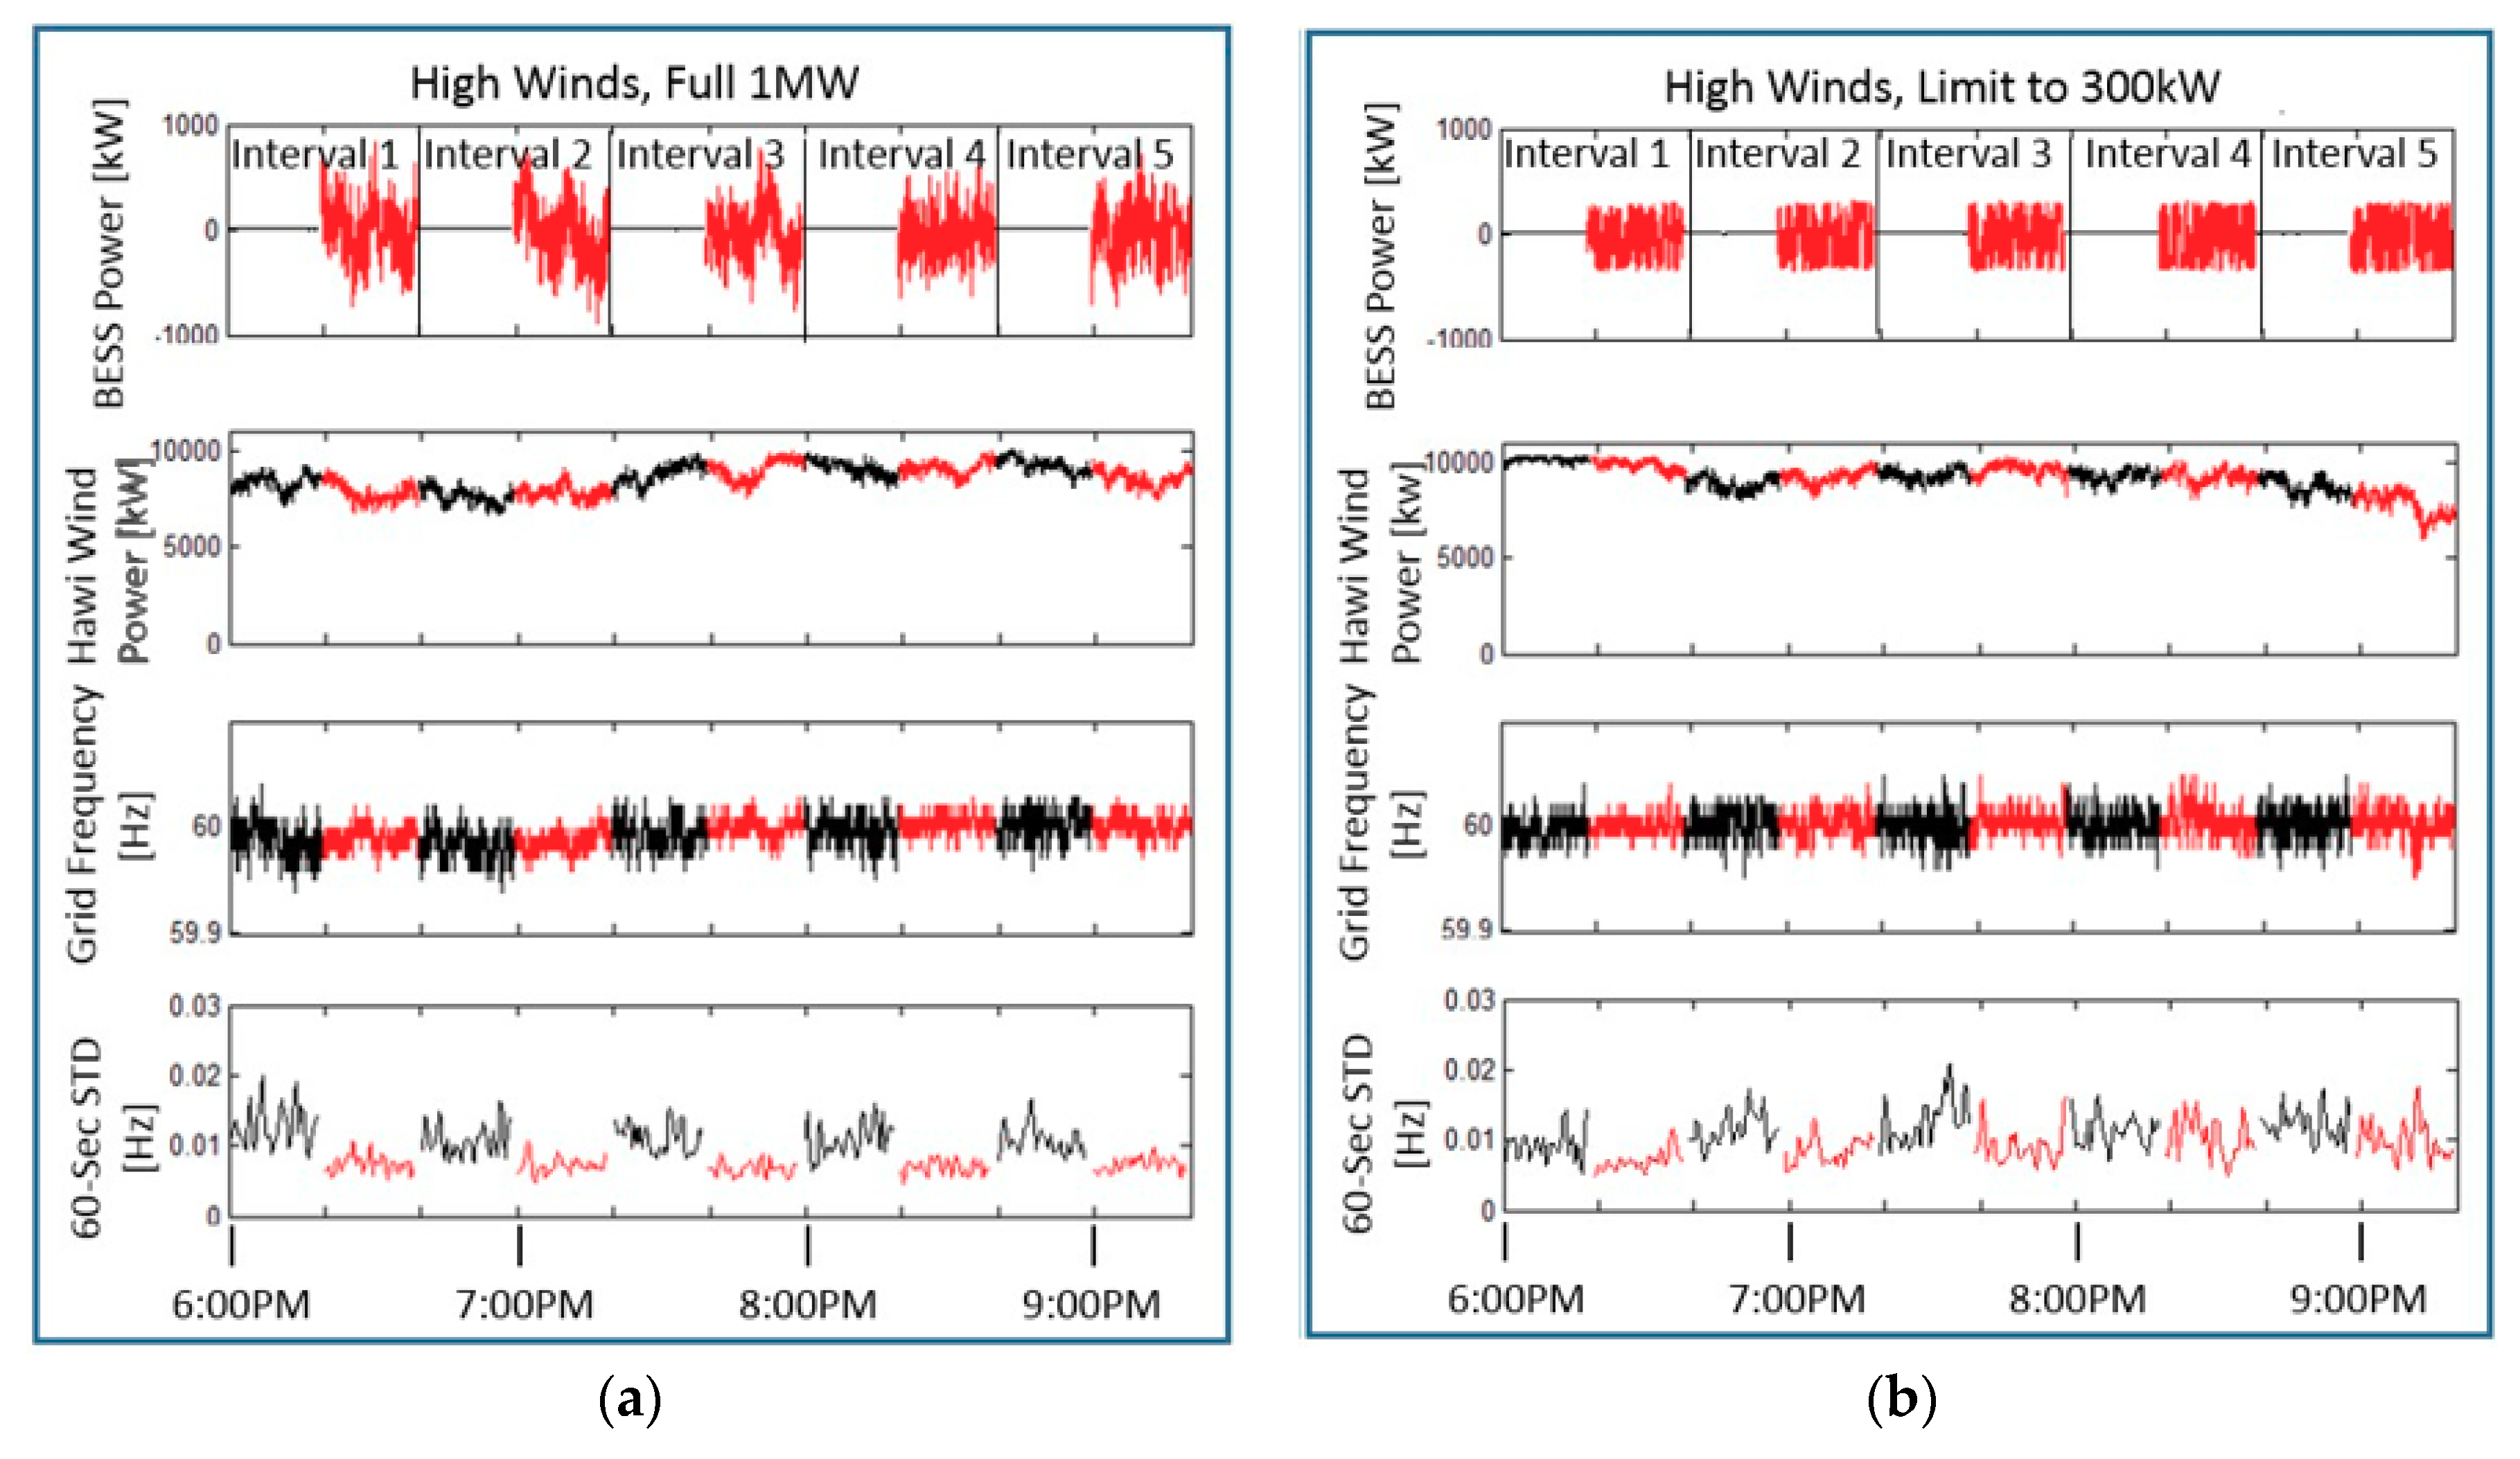
With these results, the chosen metric to characterize grid frequency (whether the BESS was ON or OFF) was the mean of consecutive 60-seconds standard deviations. With this metric, it is possible to study the BESS performance under various grid conditions and control algorithm settings. Initial results of switching experiments are shown in Figure 10, which shows 40-min time intervals of BESS real power output (top), HRD wind power output (2nd from top), grid frequency (2nd from bottom), and the running standard deviation (60-seconds timescale) of grid frequency (bottom), for two switching experiment performed under similar grid conditions, but with different frequency response control algorithm settings. Specifically, the left side of the figure shows an experiment conducted with the full 1 MW BESS power output. The experiment on the right side of the figure was conducted with the power output limited to 300 kW. The winds were similarly high and variable in both cases. The bottom-left plot clearly shows that the BESS OFF periods (black) have larger standard deviations that the BESS ON periods (red). This is less apparent in the plot on the bottom-right because the BESS is being restricted to 300 kW.
Table 3 lists the 60-seconds frequency variability metrics associated with the switching experiments shown in Figure 10. The average percent variability reduction for the 1 MW case (left) is 58.4 ± 15% with a 95% confidence interval, and the average percent reduction for the 300-kW case (right) is 20.9 ± 11% with a 95% confidence interval. The indication is that limiting the BESS output to 30% of rated power yields about a linear 30% reduction in frequency variability for similar wind conditions. The linear relationship was later confirmed through experiments designed to examine of the effect of various frequency response control algorithm parameter settings on BESS frequency regulation and usage [20].

3.2. Wind Smoothing: Algorithm Development and Testing

In contrast with the frequency response algorithm, where switching experiments were imperative, only standard passive observations were required to characterize the performance of the wind smoothing algorithm. This section is not intended to show novelty but was included in this report for completeness.
The HRD wind farm that came online in 2006, consists of 16 Vestas American Wind Technology 660 kW wind turbines, for a total rated capacity of 10.56 MW [26]. This wind plant and purchase power agreement pre-dated the suite of modern wind plant capabilities available today, which include frequency response; primary frequency response would leverage the capabilities of the wind turbine controls to respond naturally to negative system frequency impacts from its volatility. The requirements for the wind power smoothing algorithm were developed based on the Power Purchasing Agreement (PPA) between the utility (HELCO) and the wind farm owner, which includes three limitations on the fluctuations of the wind farm power output. Specifically, the PPA stipulates that:
  • the wind farm’s power output may not change more than 1 MW over any two seconds interval,
  • the wind farm’s power output may not change more than 2 MW over any one-minute interval,
  • the one-minute average of power output changes over any 2 s intervals may not exceed 300 kW.
A simplified block diagram of the wind power smoothing algorithm is shown in Figure 11. The algorithm was designed to minimize PPA agreement violations, as well as minimize the standard deviation of power output over the 2-seconds and one-minute intervals. In the most basic terms, the algorithm calculates a “target” power output from the wind farm based on the filtered values of the “raw” wind farm output over an adjustable period of time. A standard proportional-integral-derivative (PID) controller then calculates the desired BESS power command to offset the difference between the actual wind farm output and that target value. All of the parameters were first tuned to avoid oscillations and then optimized using previous SCADA data of HRD wind farm power output. Additionally, the algorithm was designed to return the BESS to the nominal 50% state of charge by calculating the battery “bias”, which is defined as the amount of power needed to return the BESS to 50% SOC from its current SOC over 15 min. Because the battery bias is continuously updated, the associated bias power commands exponentially approach zero as the battery nears 50% SOC, with the result being that the SOC management could take the battery from a full charge or zero charge to 50% SOC in approximately one hour. The final algorithm was validated against the subset of SCADA data that was not used for algorithm tuning. The algorithm passed laboratory and site acceptance tests to the satisfaction of HNEI technical reviewers.
Figure 12 shows a time series of power output from the HRD wind farm (black) and the BESS-smoothed time series (red), for the morning of April 4th, 2013. The bottom three plots are expanded sections of the time series to show detail. Qualitatively, it is apparent from comparison of the two time series (black and red) that the algorithm is able to smooth output from the wind farm.
Figure 13 shows histograms of metrics related to the three PPA limitations calculated from the BESS dataset spanning 8 a.m. to 6 p.m., April 5th 2013. The three metrics are, from left to right: the maximum change in power output over two seconds, the maximum change in power output over 60 s, and the one-minute averages of the maximum changes over two seconds. Again, the wind farm power output is represented by the black line and the smoothed power by the red line. The histograms show that the wind smoothing algorithm is very effective at reducing power output fluctuations at the one-minute timescale but is significantly less effective at the two seconds timescale. At the fast two seconds timescale, the algorithm reduces the range of the maximum change (left), but the mean value remains virtually unchanged (right). However, at the one-minute timescale (center), the algorithm has a strong impact, with the average maximum change in power output reduced by more than 60%.

3.3. Early Testing and Lessons Learned

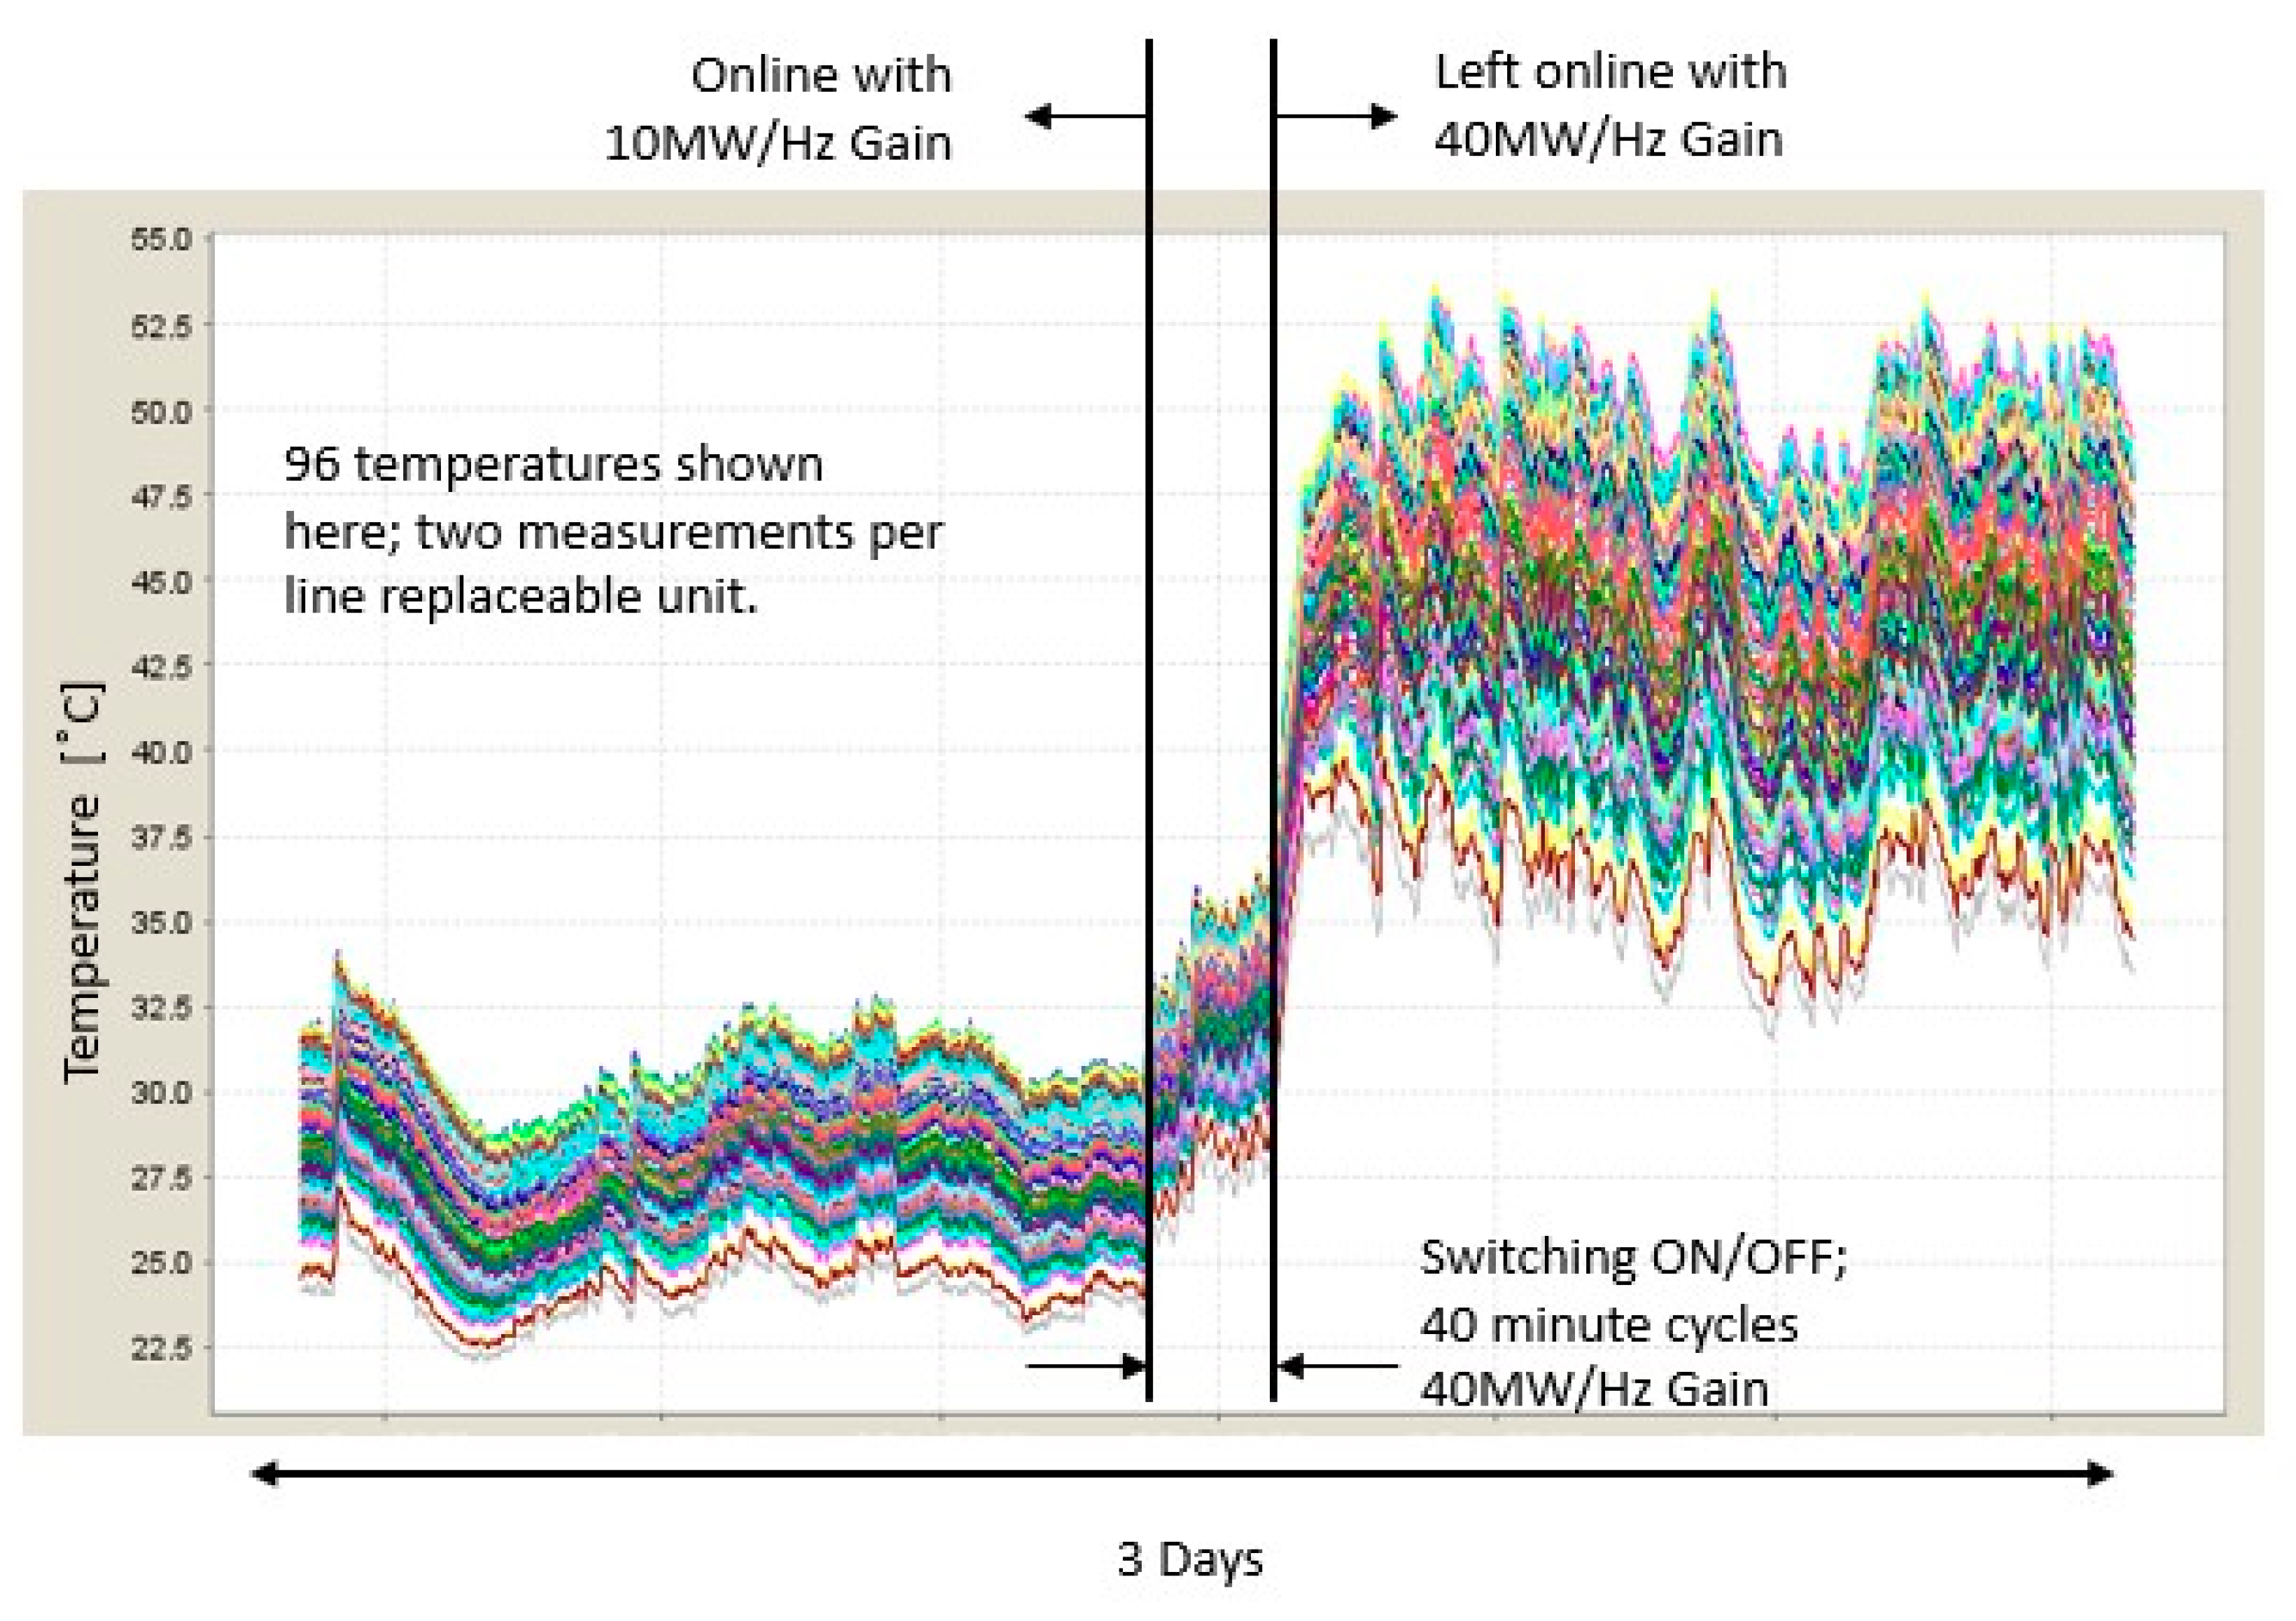
Shortly after commissioning, the focus of the research was the optimization of the frequency response algorithm. Particular attention was paid to the “gain” setting of the f-W curve. While higher proportional gains led to greater grid benefit, it did so with a substantial burden on the BESS resulting in more energy throughput (cycling). During early testing, gains of up to 40 MW/Hz were attempted but operation for extended times at these higher gains were found to increase the temperature of the modules (each module is 1/2 of a line replaceable unit), as shown in Figure 14. As the temperature excursions would cause excessive wear on the battery modules, a setting of 40 MW/Hz with no deadband was determined to be beyond the desirable operational limits of the BESS.
Another item of interest was the distribution of temperatures in the PM. It was found that the initial configuration of the HVAC air vents, set as they were upon shipment, were not optimal. In particular, the air vents shown in Figure 15 at the bases of the two HVAC units were wide open. This resulted in less air flow to the battery modules, which resulted in higher battery temperatures overall. Further, this resulted in increased temperature gradient across the LRUs, as can be seen in Figure 15 (left). HNEI personnel made adjustments on-site, resulting in an improvement to both total temperature and temperature gradient (right). Note that the two sets of temperature measurements shown in Figure 15 were collected on dates when weather and grid conditions, and the corresponding BESS usage, were similar. There are a number of other studies currently underway that utilize data from the subject BESSs. A recently published paper used BESS usage data over a three year period to develop a representative duty cycle [22], which was used to test cell degradation and calendar aging in the laboratory [21].

4. Summary and Future Work

In December of 2012, a 1 MW, 250 kW-Hr fast-acting BESS unit was installed on the Hawaii Island electric grid at the transmission level. This BESS was the first of three grid-scale BESS units installed by the Hawaii Natural Energy Institute as part of an integrated research, testing, and evaluation program. Two control algorithms were developed, one designed to smooth power output from a co-located wind farm and a second to regulate island-wide grid frequency. Both control algorithms proved successful at implementing their control objectives. When controlled by the wind smoothing algorithm, the BESS was able to reduce the maximum change in power output from the wind farm over a one-minute periods by more than 60%. When controlled by the frequency response algorithm, the BESS reduced the average standard deviation of grid frequency over one-minute periods by between 20% and 60% compared to periods when the BESS was OFF, depending on the settings for the control algorithm. The results demonstrate that a relatively small BESS unit, namely a 1 MW BESS installed on a grid with a peak load of around 180 MW, was able to provide measurable grid benefit and the utility company elected to develop a budget to maintain and operate the system.
Additionally, the results demonstrate that the impact of BESS units on the grid, and indeed the metric used to quantify the impact, can be highly timescale dependent. For the case of the wind smoothing algorithm, while the BESS was able to significantly reduce wind power output variability on the one-minute timescale, there was almost no effect at the two-seconds timescale. The measured effect of the BESS on grid frequency while running the frequency response algorithm depends on the timescale that is examined. While it is desirable to measure the BESS impact on grid frequency on short timescales because of the quick response time of the BESS, it was shown that timescales shorter than a minute can result in measurements of grid frequency that are timescale dependent and do not separate high and low variability periods well. It may be possible to take advantage of the timescale dependence to optimize BESS control algorithms for their particular intended tasks. The natural timescale for such BESS optimization would be at the relatively short timescales over which traditional generation units are incapable of responding.
Future work plans include investigating the impact of the Hawaii island BESS on large frequency events, and the ability of a 2 MW, 397 kW-Hr BESS to help stabilize the small isolated grid on the island of Molokai.

Author Contributions

Conceptualization, R.R. and K.M.; Methodology, R.R., K.M., M.T., K.S.; Software, K.M., M.T., K.S.; Validation, K.M., and K.S.; Formal Analysis, K.M. and M.T.; Investigation, R.R.; Resources, R.R.; Data Curation, M.T. and K.S.; Writing-Original Draft Preparation, K.S.; Writing-Review & Editing, R.R., M.T., and K.S.; Visualization, M.T.; Supervision, R.R.; Project Administration, R.R.; Funding Acquisition, R.R.

Funding

This work was funded by ONR under the Hawaii Energy and Environmental Technologies (HEET) 2010 Initiative, award No N00014-11-1-0391 and the Asia Pacific Research Initiative for Sustainable Energy Systems 2012, award No. N00014-13-1-0463.

Acknowledgments

The authors are grateful to the Hawaii Electric Light Company for their support and partnership on this project and their ongoing support to the operations of the Hawaii Sustainable Energy Research Facility (HiSERF), Haw’i Renewable Development for hosting the BESS, and Jerry Haverstick and Len Sekowski (Altairnano) for their help through the course of this study.

Conflicts of Interest

The authors declare no conflict of interest.

References

  1. Eftekharnejad, S.; Vittal, V.; Heydt, G.T.; Keel, B.; Loehr, J. Impact of increased penetration of photovoltaic generation on power systems. IEEE Trans. Power Syst. 2013, 28, 893–901. [Google Scholar] [CrossRef]
  2. Ulbig, A.; Borsche, T.S.; Andersson, G. Impact of low rotational inertia on power system stability and operation. arXiv, 2013; arXiv:1312.6435. [Google Scholar]
  3. Georgilakis, P.S. Technical challenges associated with the integration of wind power into power systems. Renew. Sustain. Energy Rev. 2008, 12, 852–863. [Google Scholar] [CrossRef] [Green Version]
  4. Hamsic, N.; Schmelter, A.; Mohd, A.; Ortjohann, E.; Schultze, E.; Tuckey, A.; Zimmermann, J. Increasing renewable energy penetration in isolated grids using a flywheel energy storage system. In Proceedings of the International Conference on Power Engineering, Energy and Electrical Drives, POWERENG 2007, Setubal, Portugal, 12–14 April 2007; pp. 195–200. [Google Scholar]
  5. Hawaii Clean Energy Initiative. Available online: http://www.hawaiicleanenergyinitiative.org/ (accessed on 27 November 2018).
  6. Rampazzoa, M.; Luvisottoa, M.; Tomasonea, N.; Fastellib, I.; Schiavettib, M. Modelling and simulation of a Li-ion energy storage system: Case study from the island of Ventotene in the Tyrrhenian Sea. J. Energy Storage 2018, 15, 57–68. [Google Scholar] [CrossRef]
  7. El-Bidairia, K.; Nguyena, H.; Jayasinghea, S.; Mahmoudb, T.; Penesisa, I. A hybrid energy management and battery size optimization for standalone microgrids: A case study for Flinders Island, Australia. Energy Convers. Manag. 2018, 175, 192–212. [Google Scholar] [CrossRef]
  8. Rodrigues, E.; Godina, R.; Catalão, J. Modelling Electrochemical Energy Storage Devices in Insular Power Network Applications Supported on Real Data. Appl. Energy 2017, 188, 315–329. [Google Scholar] [CrossRef]
  9. Cabrera, P.; Lund, H.; Carta, J. Smart renewable energy penetration strategies on islands: The case of Gran Canaria. Energy 2018, 162, 421–443. [Google Scholar] [CrossRef]
  10. Notton, G. Importance of Islands in Renewable Energy Production and Storage: The Situation of the French Islands. Renew. Sustain. Energy Rev. 2015, 47, 260–269. [Google Scholar] [CrossRef]
  11. Dunn, B.; Kamath, H.; Tarascon, J.-M. Electrical energy storage for the grid: A battery of choices. Science 2011, 334, 928–935. [Google Scholar] [CrossRef] [PubMed]
  12. Koohi-Kamali, S.; Tyagi, V.; Rahim, N.; Panwar, N.; Mokhlis, H. Emergence of energy storage technologies as the solution for reliable operation of smart power systems: A review. Renew. Sustain. Energy Rev. 2013, 25, 135–165. [Google Scholar] [CrossRef]
  13. Beaudin, M.; Zareipour, H.; Schellenberglabe, A.; Rosehart, W. Energy storage for mitigating the variability of renewable electricity sources: An updated review. Energy Sustain. Dev. 2010, 14, 302–314. [Google Scholar] [CrossRef]
  14. Castillo, A.; Gayme, D.F. Grid-scale energy storage applications in renewable energy integration: A survey. Energy Convers. Manag. 2014, 87, 885–894. [Google Scholar] [CrossRef]
  15. Hidalgo-León, R.; Siguenza, D.; Sanchez, C.; León, J.; Jácome-Ruiz, P.; Wu, J.; Ortiz, D. A survey of battery energy storage system (BESS), applications and environmental impacts in power systems. In Proceedings of the Ecuador Technical Chapters Meeting (ETCM), Salinas, Ecuador, 16–20 October 2017; pp. 1–6. [Google Scholar]
  16. Hernández, J.; Gyuk, I.; Christensen, C. DOE global energy storage database—A platform for large scale data analytics and system performance metrics. In Proceedings of the 2016 IEEE International Conference on Power System Technology (POWERCON), Wollongong, NSW, Australia, 28 September–1 October 2016; pp. 1–6. [Google Scholar]
  17. Consiglio, L.; Di Lembo, G.; Noce, C.; Eckert, P.; Rasic, A.; Schuette, A. Performances of the first electric storage system of ENEL Distribuzione. In Proceedings of the AEIT Annual Conference 2013, Mondello, Italy, 3–5 October 2013. [Google Scholar]
  18. Koller, M.; Borsche, T.; Ulbig, A.; Andersson, G. Review of grid applications with the Zurich 1 MW battery energy storage system. Electr. Power Syst. Res. 2015, 120, 128–135. [Google Scholar] [CrossRef]
  19. Swierczynski, M.; Stroe, D.-I.; Stan, A.-I.; Teodorescu, R.; Laerke, R.; Kjaer, P.C. Field tests experience from 1.6 MW/400kWh Li-ion battery energy storage system providing primary frequency regulation service. In Proceedings of the 2013 4th IEEE/PES Innovative Smart Grid Technologies Europe (ISGT EUROPE), Lyngby, Denmark, 6–9 October 2013; pp. 1–5. [Google Scholar]
  20. Stein, K.; Tun, M.; Matsuura, M.; Rocheleau, R. Characterization of a Fast Battery Energy Storage System for Primary Frequency Response. Energies 2018. submitted. [Google Scholar]
  21. Dubarry, M.; Devie, A. Battery durability and reliability under electric utility grid operations: Representative usage aging and calendar aging. J. Energy Storage 2018, 18, 185–195. [Google Scholar] [CrossRef]
  22. Dubarry, M.; Devie, A.; Stein, K.; Tun, M.; Matsuura, M.; Rocheleau, R. Battery Energy Storage System battery durability and reliability under electric utility grid operations: Analysis of 3 years of real usage. J. Power Sources 2017, 338, 65–73. [Google Scholar] [CrossRef]
  23. Timothy, M. Spitler, “Lithium Ion Batteries”. U.S. Patent Application US20070092798A1, 23 October 2006. [Google Scholar]
  24. HNEI. Development of Real-Time Closed-Loop Control Algorithms for Grid-Scale Battery Energy Storage Systems; Hawaii Natural Energy Institute: Honolulu, HI, USA, 2014. [Google Scholar]
  25. Kundur, P.; Balu, N.J.; Lauby, M.G. Power System Stability and Control; McGraw-Hill Eduation: New York, NY, USA, 1994; Volume 7. [Google Scholar]
  26. Existing Wind Farms. Available online: https://web.archive.org/web/20150222124557/http://hawaiianelectric.com/heco/_hidden_Hidden/Renewable-Energy/Existing-Wind-Farms (accessed on 27 November 2018).
Figure 1. Containers for the BESS (a) power module (PM); and (b) power conversion system (PCS).
Energies 11 03367 g001
Figure 2. Schematic of the Hawaii island BESS highlighting metering units. The pictures insets show the installed PM and PCS units on site (top), and the line replaceable units (LRUs) which house the battery cells within the PM (below).
Energies 11 03367 g002
Figure 3. Flowchart of the development process for the frequency response control algorithm.
Energies 11 03367 g003
Figure 4. Schematic of the frequency response control algorithm.
Energies 11 03367 g004
Figure 5. Schematic of the simple model of the Hawaii island grid, which was used to develop the frequency response algorithm.
Energies 11 03367 g005
Figure 6. Top: BESS power output with a gain of 30MW/Hz; Middle: wind power generation; Bottom: and grid frequency on an evening with light winds (a) and an evening with medium winds (b). Black lines indicate the BESS is OFF and red lines indicate BESS is ON. The BESS was switched between OFF and ON every 20 min.
Energies 11 03367 g006
Figure 7. Five 20-min frequency time series shown in order of increasing by-eye variability.
Energies 11 03367 g007
Figure 8. A frequency time-series is divided into several smaller segments, in this case 60-seconds in length. The standard deviation of each smaller time series is shown as just above the plot. The mean of those values is taken to be the “frequency variability” of the 20-min period on a 60-seconds timescale.
Energies 11 03367 g008
Figure 9. Frequency variability metrics for data shown in Figure 7, using different timescales. The colors correspond to the samples shown in Figure 7.
Energies 11 03367 g009
Figure 10. A comparison of two different days when total wind power output at Haw’i Renewable Development (HRD) and variability were similar. The gain setting used for the f-W curve of the BESS control algorithm was 30MW/Hz in both cases. The only difference is the limiting of the BESS output power, set to 1 MW for the left plots and 300 kW for the right plots. (Top) Time series of BESS real power output. (2nd from top) Time series of wind power at the HRD wind farm. (2nd from bottom) Time series of grid frequency. (bottom) The 60-seconds standard deviation of grid frequency.
Energies 11 03367 g010
Figure 11. Schematic of the wind smoothing control algorithm.
Energies 11 03367 g011
Figure 12. Time series of power output from the HRD wind farm (black) and the smoothed power (red) for the morning of 4/4/2013. The bottom three plots show the sections indicated by the blue boxes in greater detail.
Energies 11 03367 g012
Figure 13. Histograms of three metrics related to the power purchasing agreement between the HRD wind farm and the utility, HELCO. The metrics are the maximum change in power output over 2 s (left), the maximum change in power output over 60 s (middle), and the one-minute average of the maximum power output over 2 s (right). The black (red) lines indicate metrics calculated from data when the BESS was inactive (active). The data was collected from 8 a.m. to 6 p.m. on 4/5/2013.
Energies 11 03367 g013
Figure 14. Time series of the temperature of battery modules (two groups of seven cells) over a three-day period when the gain setting of the frequency control algorithm was increased from 10 MW/Hz to 40 MW/Hz. The operating specification for these battery cells is between −40 °C and +55 °C.
Energies 11 03367 g014
Figure 15. Temperature of the battery modules (two groups of seven cells, ½ of a LRU) for different configuration of the HVAC1 vents. Units are degrees Celsius.
Energies 11 03367 g015
Table 1. List of funding sources and partners for Hawaii Battery Energy Storage Systems (BESS) project.
Hawaii Natural Energy Institute (HNEI)Project Management
Algorithm Development
Technical Oversight
Office of Naval Research (ONR)Primary Funding Source
Program Oversight
Department of Energy (DOE)Partial Funding for Algorithm Development
Hawaii Electric Light Company (HELCO)Infrastructure Development
Planning
Grid Management
Haw’i Renewable Development (HRD)Host Site Owner
Site Preparation
AltairnanoBattery System Manufacturer
Systems Integration
Integrated Dynamics, Inc. (IDI)Frequency Algorithm Development
Software Development
SCADA SolutionsWind Algorithm Development
Parker–Hannifin CompanyPower Conversion System Supplier
Table 2. The standard deviation of the 20-min intervals with BESS OFF versus 20-min periods with BESS ON, along with the percent change between intervals, for the switching experiments shown in Figure 6. A: Results for the evening with light winds; B: Results for an evening with medium winds.
A: Frequency Variability: Evening with Light Wind
IntervalStandard Deviation of
Frequency w/BESS OFF [mHz]
Standard Deviation of
Frequency w/BESS ON [mHz]
Percent Change
113.48.3−38.1
210.36.0−41.7
39.07.7−14.4
47.16.7−5.6
56.68.122.7
B: Frequency Variability: Evening with Medium Wind
IntervalStandard Deviation of
Frequency w/BESS OFF [mHz]
Standard Deviation of
Frequency w/BESS ON [mHz]
Percent Change
115.98.6−45.9
213.57.9−41.5
314.38.8−38.5
412.67.2−42.9
511.49.5−16.7
Table 3. The 60-seconds frequency variability metric for the 20-min periods with BESS OFF against adjacent 20-min periods with BESS ON show in Figure 10. A: Results for the evening with high winds and the BESS allowed to use full rated power of 1 MW; B: Results for the evening with similar high winds and the BESS allowed to use 300 kW of power.
A: 60-Second Frequency Variability: 1000 kW Limit
IntervalFrequency Metric w/BESS OFF [mHz]Frequency Metric w/BESS ON [mHz]Percent Change
112.97.4−74.3
210.77.2−48.6
311.26.7−67.2
410.97.0−55.7
510.87.4−45.9
B: 60-Second Frequency Variability: 300 kW Limit
IntervalFrequency Metric w/BESS OFF [mHz]Frequency Metric w/BESS ON [mHz]Percent Change
19.27.0−23.9
211.58.5−26.1
312.78.9−29.9
411.210.5−6.3
512.19.9−18.2