Abstract
This study aims to estimate the performance of thermoelectric module (TEM) heat pump for simultaneous liquid cooling and heating and propose empirical models for predicting the heat exchange effectiveness. The experiments were conducted to investigate and collect the performance data of TEM heat pump where the working fluid was water. A total of 57 sets of experimental data were statistically analyzed to estimate the effects of each independent variable on the heat exchange effectiveness using analysis of variance (ANOVA). To develop the empirical model, the six design parameters were measured: the number of transfer units (NTU) of the heat exchangers (i.e., water blocks), the inlet water temperatures and temperatures of water blocks at the cold and hot sides of the TEM. As a result, two polynomial equations predicting heat exchange effectiveness at the cold and hot sides of the TEM heat pump were derived as a function of the six selected design parameters. Also, the proposed models and theoretical model of conventional condenser and evaporator for heat exchange effectiveness were compared with the additional measurement data to validate the reliability of the proposed models. Consequently, two conclusions have been made: (1) the possibility of using the TEM heat pump for simultaneous cooling and heating was examined with the maximum temperature difference of 30 °C between cold and hot side of TEM, and (2) it is revealed that TEM heat pump has difference with the conventional evaporator and condenser from the comparison results between the proposed models and theoretical model due to the heat conduction and Joule effect in TEM.
1. Introduction
Thermoelectric modules (TEMs) have been studied as an emerging technology for realizing a non-vapor compression heat pump that is applicable to the air conditioning of buildings [1]. Many researchers have focused on TEM owing to its advantages, such as compact size, simple control, no refrigerant, noiseless operation, higher reliability without moving parts, and a longer lifetime than electrical compressors [2,3]. TEM is a solid-state technology, whereby an electric voltage makes a temperature difference in a pair of n- and p-type semiconductor based on the Peltier effect. At the same time, the heat conduction is occurred from the hot side to the cold side due to its thin thickness. Also, TEM generates the heat by itself due to the electrical resistance that is based on the Joule effect [4]. Therefore, the thermal efficiency of a TEM can be determined using Seebeck coefficient that is related to the Peltier effect, heat conductivity and electrical resistance. These three coefficients of materials is defined using so-called dimensionless figure of merit (ZT) that is directly proportional to the square of Seebeck coefficient and is inversely proportional to the heat conductivity and electrical resistance. However, the ZT value of commercialized TEM is not sufficiently high to be competitive with vapor compression [5]. Although, the TEM is not widely used due to the lack of high energy efficiency in existing TEM products [6,7], many researches were conducted in improving various aspects.
The potential of TEM for cooling applications in buildings has been investigated in several studies. Tan and Zhao [8] proposed a thermoelectric cooling system for space cooling in a building, with a phase change material serving as storage for the cooling source during night time, to save cooling energy consumption. Irshad et al. [9] developed a thermoelectric air duct system assisted by a photovoltaic (PV) wall for space cooling. Using experiments and simulations, they investigated the optimum design of the system considering the temperature difference between the hot and cold sides of the TEM with cooling capacity. Liu et al. [10] suggested a PV-assisted thermoelectric cooled ceiling combined with a displacement ventilation system. They used TEM for dehumidifying the fresh air and cooling the ceiling panel that is powered by PV system. In the same way, the TEM can also be used for heating purposes. Allouhi et al. [11] investigated the possibility of using a thermoelectric heating system to serve an office room. Similar to an air source heat pump, the TEM cools exhaust air at the cold side and releases heat at the hot side that is used to heat the supply air during winter. They indicated that their proposed system consumed 55 to 64% less energy compared with a conventional electric air heater. Wang et al. [12] suggested a thermoelectric heating system powered by PV and a micro wind turbine. Their system showed energy savings of 64% and CO2 emission reductions of 4305.4 kg/year.
These studies focused on the cooling and heating applications of TEM in building and examined the feasibility of applications. Also, the models were developed to analyze the thermal and energy performances. However, most studies in the field of TEM have not dealt with simultaneous using of cooling and heating such as in the field of conventional vapor compression heat pump [13,14]. There are some literatures investigating TEM applications providing simultaneous cooling and heating of working fluids. Yilmazoglu [15] estimated the performance of a thermoelectric air cooling and heating system based on a numerical analysis and experiments, and showed the potential of TEM for simultaneous air heating and cooling, with a coefficient of performance (COP) of 4.1 for heating and 0.7 for cooling. Ramousse and Perier-Muzet [16] proposed a design method for a thermoelectric heat pump considering minimization of entropy generation. Their system consists of multi-channel heat exchangers for simultaneous cooling and heating of working fluids. They indicated the optimal ratio of the heat exchange area for heating to that for cooling was 4.0 in their proposed thermoelectric heat pump.
However, very limited studies have investigated the characteristics and behaviors of a thermoelectric heat pump, despite of its advantages [15,16]. The thermoelectric heat pump is expected to show different thermal behaviors with a conventional heat pump because the heat absorption (i.e., evaporator) and rejection (i.e., condenser) are occurred just within 3.5 mm to 4 mm distance in the TEM, while the condenser and evaporator in the conventional heat pump are thermally well separated. In addition, the cooling and heating effects of the thermoelectric heat pump are based on the Peltier effect, while those of the conventional heat pump are depending on the latent heat variation required in the phase change of a refrigerant. Consequently, in this study, the empirical models were developed to predict the heat exchange effectiveness of the thermoelectric heat pump at the hot and cold sides. The outlet fluid temperatures at the hot and cold sides can also be predicted based on the heat exchange effectiveness, as determined by the proposed models. To develop the empirical models, the experimental data of a thermoelectric heat pump for simultaneous cooling and heating of a working fluid were collected during real operation under a controlled environment. The impact of each design parameter and interactions between design parameters on the heat exchange effectiveness at the hot side and cold side were also evaluated by statistically analyzing the collected data. Two quadratic equations predicting the heat exchange effectiveness of the thermoelectric heat pump at the hot side and cold side were derived as a function of the selected physical and dimensionless parameters.
2. System Overview
Figure 1 shows the thermoelectric heat pump that is used in this study for the simultaneous cooling and heating of water. The water blocks, hollow aluminum blocks having channels for water flowing inside were attached onto both the hot and cold sides of the TEM. The water block works as a sensible heat exchanger between the water and the TEM surface at constant temperature. Teflon insulation was inserted between two water blocks to minimize the heat conduction from the hot side to the cold side of the TEM.
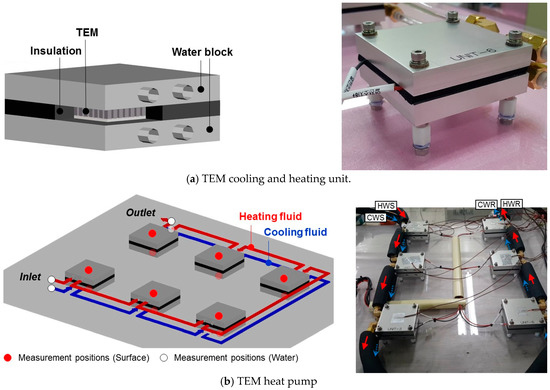
Figure 1.
Thermoelectric heat pump test setup.
A total of six TEMs with water blocks were connected in series. The series connection was selected to investigate the larger temperature difference between inlet and outlet of TEM heat pump. The water was supplied to the water blocks through 8-mm diameter polyvinyl chloride pipes by two self-priming diaphragm water pumps. The pipes were insulated with foam-rubber insulation to minimize the heat transfer to the surroundings. Water blocks were also covered with compressed polystyrene foam to insulate unnecessary heat exchange with the surroundings. The pumps had variable flow, with a maximum water flow rate of 0.034 kg/s and a maximum head of 3 m [17].
Table 1 shows the technical specifications of the TEMs that were used in this study. The max cooling capacity of TEM is measured when the temperature difference between cold and hot side of TEM is 0 °C under the hot side temperature of 25 °C and 50 °C. Also, the max temperature difference between cold and hot side of TEM is measured when the cooling capacity of TEM is 0 W under the hot side temperature of 25 °C and 50 °C. When direct current flows into a TEM, heat absorption and release occur at the cold side and hot side of the TEM, respectively. The material of TEM we used was bismuth telluride (Bi2TE3) and it is a general material of commercial TEM. The performance of TEM is quantified by using the dimensionless figure of merit and its value was 0.73. A switched-mode power supply (SMPS) was used to control the input current and voltage to the TEM. The SMPS that was used in this study can modulate input current and voltage within 0–30 A and 0–30 V, respectively. However, maximum input current and voltage to the TEM were limited to 4.2 A and 24.5 V, respectively, to prevent the break-down of the TEM.

Table 1.
The characteristics of the thermoelectric module (TEM) [18].
3. Experiments Design
3.1. Measurement Parameters
In this study, the operating parameters of the TEM heat pump, i.e., input current (I), hot-side inlet fluid temperature (Th,in), hot-side water flow rate (), cold-side inlet fluid temperature (Tc,in), cold-side water flow rate (), and the heat exchange area (Ahx), were selected. The heat exchange area is the surface area of channels inside the water block, as shown in Figure 2. Each water block had a heat exchange area of 0.00455 m2. In the experimental system, six TEMs were used, and water blocks were attached onto the cold and the hot sides of each TEM, as shown in Figure 1. Therefore, the total heat exchange area at the cold or the hot sides of the TEM heat pump could be varied from 0.00455 m2 to 0.02730 m2 during the experiment, depending on the number of activated TEMs.
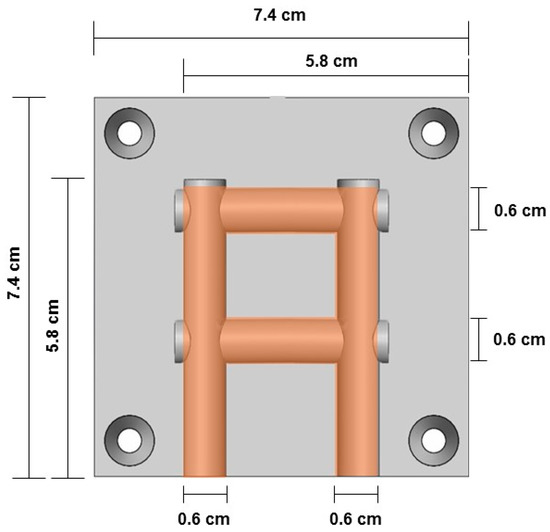
Figure 2.
Sectional diagram of the water block.
In order to design the series of experiments, the operating ranges (i.e., minimum and maximum values) of each parameter were determined. In the experimental TEM heat pump, the operable ranges of input current and water flow rate were 1 A to 4.2 A and 0.01 kg/s to 0.02 kg/s, respectively. The inlet water temperature range at the cooling and heating sides were 15 °C to 35 °C and 45 °C to 65 °C, respectively, which are the common inlet water temperature ranges in building mechanical system applications. The experimental cases could be designed by combining the minimum and maximum values of each operating parameter. However, in order to consider the impact of the non-linearity of each parameter on the heat exchange effectiveness, intermediate values within the predefined operating range of each parameter were also considered in the experiment design. Table 2 shows the values of operating parameters that are considered in the series of experiments for obtaining data on the heat exchange effectiveness at both the cold and hot sides of the TEM heat pump.
Table 2.
Operating parameters and ranges.
As for the experiment design, we used a central composite design (CCD) approach with face centered method that is useful in response surface methodology (RSM) for developing a second order quadratic model that returns the heat exchange effectiveness. In CCD, the experimental cases were defined from three experiment design matrices: the 2k factorial design matrix, the axial point matrix, and the center point matrix [19]. The 2k factorial design matrix is a combination of minimum and maximum values of each variable, where k is the number of variables. The axial point matrix is composed of the minimum or maximum value of one variable, and the intermediate values of the remaining variables. Therefore, the number of experimental sets for the axial point matrix is 2k. A center point matrix is composed of the intermediate values of all the variables. Consequently, a total of 77 experiment sets, i.e., 64 sets from the 2k factorial design matrix, 12 sets from the axial point matrix, and one set from the center point matrix, were established.
In each experiment, the input current (I) was controlled by using SMPS, and water flow rates () were modulated by the direct current motor speed controller for the pumps. The inlet water temperatures (Tin) were adjusted by using electric water heaters. The heat exchange area (Ahx) was varied by changing the number of activated TEM units. Outlet fluid temperatures at the hot side (Th,out) and cold side (Tc,out) were measured in each experiment.
Temperature measurements were performed using a T-type thermocouple (Omega Engineering, Inc., Norwalk, CT, USA, Error rate ±0.5 °C) with MV1000 data logger applicable within the range of −200 to 400 °C with ±0.5 °C accuracy [20]. Inlet and outlet fluid temperatures, and water block temperatures at the hot and cold sides of the TEM heat pump were measured at the total 16 measurement points (Figure 1b). The data was logged for 10 min at one-second intervals in each measurement when the temperatures at all of the measurement points were sufficiently stable. The input current and water flow rates were consistently maintained at their set points in each experiment.
3.2. Operation Data
Among the 77 experiment sets, 57 sets of measurement data (Data table in supplementary file) were used for developing the heat exchange effectiveness model of the TEM heat pump, while 20 sets of measurement data were excluded because the TEM heat pump did not produce meaningful water temperature variation between the inlet and outlet at both the hot side and cold side. The water temperature differences in the excluded data sets were smaller than the accuracy of the temperature sensor (i.e., ±0.5 °C).
Negligible water temperature differences between the inlet and outlet of the TEM heat pump were observed when the inlet water temperature difference between the hot and cold sides was too large, which showed that the Seebeck effect had overridden the Peltier effect. In the Seebeck effect, heat is transferred from the hot side to the cold side, and the TEM generates electricity. Conversely, in the Peltier effect, heat is transferred from the cold side to the hot side by supplying electric power from outside, and the TEM works as a heat pump. These two effects occur simultaneously; therefore, if one wants to use the TEM as a heat pump, then the Peltier effect should be more dominant than the Seebeck effect, which can only occur if the magnitude of input current that is supplied is enough to offset the Seebeck effect; otherwise, the TEM heat pump cannot produce a meaningful difference in the temperature of water at the inlets and outlets on both the hot and cold sides of the TEM.
Figure 3 shows the representative experiment data sets (i.e., Case 9 from the table in supplementary file). One can see that, when the TEM heat pump was activated, the temperature difference between the cold and hot side water blocks increased rapidly, and the outlet water temperatures were close of those of the water blocks at both sides. Using Equations (1) and (2), the heat exchange effectiveness values were calculated, and average values of 0.828 and 0.809 were obtained for cooling and heating, respectively.
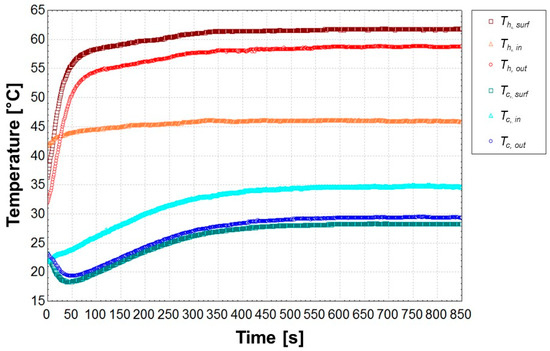
Figure 3.
Performance of thermoelectric heat pump in Case 9.
3.3. Uncertainty Analysis
The uncertainty analysis was performed to verify the experiments that were based on the ASHRAE guidelines [21] and previous studies [22,23]. The overall uncertainty consists of propagation of error (by) and random error (py), as shown in Equation (3). The propagation error (by) is the uncertainty propagated through a data reduction equation. In this study, heat exchange effectiveness is calculated using measured temperatures of the inlet, outlet, and surface. Therefore, the propagation error is calculated using Equation (4), based on the heat exchange effectiveness in Equations (1) and (2). The fixed error () is obtained by multiplying the sensor error in the technical specifications and the standard deviation of the measured parameter. The random error (py) is derived using Equation (5) based on the standard deviation and mean value of the data. The overall uncertainty values are summarized in Table 3. All of the temperatures values were lower than the value of the accuracy of the temperature sensor. Moreover, the overall uncertainty values of the heat exchange efficiencies for cooling and heating were below 0.03 (i.e., 3%).
Table 3.
Overall uncertainty of measured data.
4. Heat Exchange Effectiveness Prediction Model
4.1. Model Parameters
The water blocks that are attached on the hot and cold sides of the TEM work as a condenser and an evaporator, respectively, exchanging sensible heat between the water and the channel surface of the water block at constant temperature. In general, the effectiveness of the condenser and the evaporator can be expressed as a function of the number of transfer units (NTU) [24]. Consequently, the heat exchange effectiveness of the water blocks at the hot and cold sides of the TEM heat pump can also be derived as a function of NTU. Once the effectiveness of the water block is predicted by the proposed effectiveness-NTU relationship, the outlet fluid temperatures at the cold and hot sides of the TEM heat pump can be estimated.
The developed empirical model was derived as a function of six design parameters: NTU of the water block at the cooling side (NTUc) and heating side (NTUh), inlet fluid temperature at the hot side (Th,in) and the cold side (Tc,in), and temperature of the water block at the cold side (Th,surf) and hot side (Tc,surf). The NTUs were calculated using Equation (6). The convection heat transfer coefficient (h) at the channel surface was determined by using Equation (7), where the heat conductivity () of water was 0.6 W/m·°C and diameter of pipe (d) was 6 mm. The Nusselt number (Nu) was determined by using Equation (8) [25], which is recommended for turbulent flow in tubes, because the Reynolds number (Re) (Equation (9)) of the water flow in the channels of the water block was varied from 2380 to 9600 during the experiment. The Prandtl number (Pr) of the water was assumed to be constant (i.e., 1.75), and the friction factor (f) was calculated by using Equation (10) [26].
4.2. Model Derivation
A statistical analysis for developing the model was conducted using design expert version 10, which provides the analysis of variance (ANOVA) with RSM [27,28]. Based on the operation data sets with 4617 samples, two heat exchange effectiveness models for the cooling and heating sides of the TEM heat pump were developed as functions of six design parameters using RSM. An ANOVA was used to statistically estimate the significance of the model parameters and their interactions in the proposed models. Table 4 shows the selected model parameters and the results of the two-way ANOVA. The two factor interactions showed high significance (i.e., p-value < 0.05) on heat exchange effectiveness at the cooling (i.e., evaporator) and the heating (i.e., condenser) sides of the TEM heat pump.
Table 4.
ANOVA results of the heat exchange effectiveness of the water block.
Equations (11) and (12) are the proposed models that return the heat exchange effectiveness at the cooling side and heating side of the TEM heat pump, respectively. The model coefficients are summarized in Table 5, and the valid ranges of each model parameter are described in Table 6.
Table 5.
Model coefficients.
Table 6.
The valid range of the proposed model.
Normal probability plots of the proposed models shown in Figure 4 had good shapes. The R2 values of the models were 0.947 for cooling and 0.883 for heating, as shown in Figure 5.
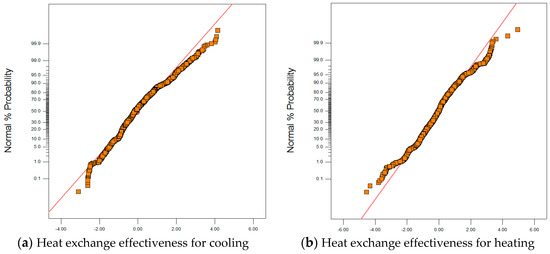
Figure 4.
Normal plot of residuals.
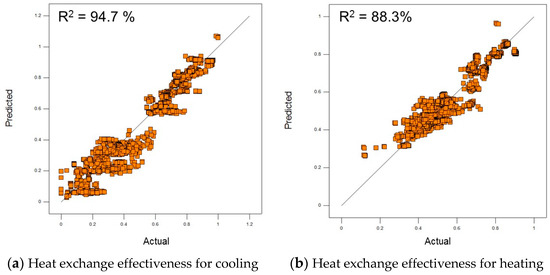
Figure 5.
Comparison of predicted heat exchange effectiveness with experimental results.
4.3. Model Validation
In this section, the proposed models were validated using additional experiment results and the conventional model for evaporator or condenser. For getting actual operation data for the model validation, a series of experiments were additionally conducted by designing experiments by using 2k factorial experiment design. Table 7 shows the minimum and maximum values of operating parameters defined for designing additional experiments. Total 32 experiment sets with 2060 data samples were acquired and used for the model validation.
Table 7.
Operating parameter ranges for model validation (Ahx = 0.014 m2).
For validating the proposed empirical models, heat exchange effectiveness values () were initially predicted by using the proposed models (i.e., Equations (11) and (12)), based on inlet water temperatures (Tc,in, Th, n), the water block temperatures (Tc,surf, Th,surf), and NTU values (NTUc, NTUh) measured at the cooling and heating sides in the additional measurements. Then, by using Equations (1) and (2), outlet water temperatures (Tc,out, Th,out) leaving the TEM heat pump were predicted for comparing them with the actual outlet temperatures that were measured in the additional experiments.
On the other hand, the waster block temperatures at the cooling or heating sides of the TEM heat pump should be maintained constantly under a given operating condition; therefore, in theory, one might also estimate the outlet water temperatures using Equation (13) with the assumption that the water was cooled or heated through the pipe with a constant surface temperature (13) [24].
In Figure 6, the predicted outlet water temperatures that were acquired from the proposed empirical models and from the theoretical equation (Equation (13)) for the convection heat transfer of the internal flow in a pipe at constant surface temperature were compared with the actual outlet water temperatures measured in the additional experiments. Figure 6a shows the comparison results of outlet water temperatures leaving the cold-side of the thermoelectric heat pump. One can see that the cold-side outlet water temperatures that were predicted by the proposed model agreed very well with the actual temperatures within 2% error bound, while those predicted by Equation (13) were relatively lower and were less in agreement with the actual temperatures. This observation also clearly shows that, in the thermoelectric heat pump, the cooling effectiveness at the cold-side is lower than that of the evaporator in a conventional heat pump under the identical evaporating temperature because of the heat that was transferred from the hot-side of the thermoelectric pump and heat generation by the Joule’s effect in TEMs.
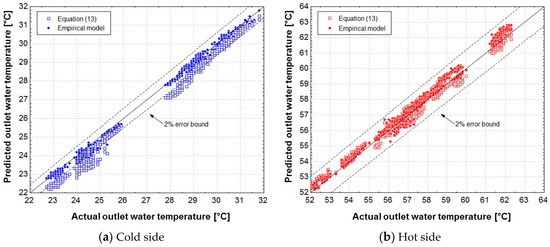
Figure 6.
Prediction results of the outlet temperature using the empirical and theoretical models.
On the other hands, at the hot-side of the thermoelectric heat pump, the outlet water temperatures predicted by proposed model agreed well within 2% error bounds with the actual measured outlet temperatures as shown in Figure 6b. Interestingly, one can also see that the outlet water temperatures predicted by the theoretical condenser equation were also well matched with the measured data within 2% error bounds.
From this observation, one can conclude that the undesirable heat transfer between the hot side and cold side in the TEM heat pump has less negative impact on the heating effect at the hot side when compared with the cooling effect at the cold side. It seems that the heat generation by the Joule’s effect in the TEMs offset the heat loss to the cold side, so that the predicted outlet temperatures at the hot side using proposed model and Equation (13) agreed better. However, the heat transferred by conduction [4] from hot side to cold side reduced the cooling effect at the cold side of the thermoelectric heat pump, which caused discrepancy between the outlet water temperatures at the cold side predicted by the proposed model and those that were determined by Equation (13).
5. Conclusions
The objective of this study was to investigate the thermodynamic behavior of a thermoelectric heat pump when it is used for simultaneous liquid cooling and heating. Based on the experimental data, empirical models for predicting heat exchange effectiveness at the cooling and heating side of the thermoelectric heat pump were suggested. The proposed models were developed using non-dimensional parameters of NTUs, inlet fluid temperatures, and water block temperatures at both the cooling and heating sides of the thermoelectric heat pump. Each parameter showed significant effects on the heat exchange effectiveness in the ANOVA analyses. The R2 values of the proposed model predicting the heat exchange effectiveness at the cooling side (i.e., evaporator) and heating side (i.e., condenser) of the thermoelectric heat pump were 94.7% and 88.3%, respectively.
The proposed models were validated using an additional 32 sets of measurement data and were compared with the theoretical model for evaporator and condenser of the conventional heat pump. The proposed models showed good agreement with the additional measurement data within 2% error bounds when the outlet water temperatures were predicted. In the comparison with the theoretical evaporator and condenser model, one could see that the outlet water temperatures that were predicted by the theoretical condenser equation were well matched with the measured data and those estimated by proposed models within 2% error bounds. However, one could also see that the cold-side outlet water temperatures predicted by the proposed models and measured data were relatively less agreed with those predicted by the conventional evaporator model. It seems that, in the thermoelectric heat pump, the cooling effectiveness at the cold-side is lower than that of the evaporator in a conventional heat pump under the identical evaporating temperature because of the heat transferred from the hot-side of the thermoelectric pump and heat generation by the Joule’s effect in TEMs. On the other hand, the heat generation by the Joule’s effect in the TEMs offset the heat loss to the cold side, so that the heat transfer between the hot side and cold side in the thermoelectric heat pump has a negligible impact on the heating performance at the hot side. In conclusion, it is necessary to use the proposed models in the design and analysis of thermoelectric heat pumps for liquid cooling and heating within the practical operation ranges indicated in this study. However, more experimental researches would be necessary to extend the valid ranges of the proposed models or when TEMs with different electrical and thermal performances are used in the thermoelectric heat pump.
Supplementary Materials
The following are available online at http://www.mdpi.com/1996-1073/11/3/580/s1, Table S1: Operating data of the thermoelectric heat pump.
Acknowledgments
This work was supported by the National Research Foundation (NRF) of Korea (2015R1A2A1A05001726), the Korea Agency for Infrastructure Technology Advancement (KAIA) grant (17CTAP-C116268-02), and the Korea Institute of Energy Technology Evaluation and Planning (KETEP) (No. 20164010200860).
Author Contributions
Hansol Lim, Seong-Yong Cheon and Jae-Weon Jeong performed the experiments, data analysis and wrote this paper based on the obtained results.
Conflicts of Interest
The authors declare no conflict of interest.
Nomenclature
| A | Area (m2) |
| bx | Fixed error |
| by | Propagation of error |
| cp | Specific heat (kJ/kg·°C) |
| d | Diameter of pipe (m) |
| f | Friction factor |
| h | Convection heat transfer coefficient (W/m2 · K) |
| I | Input current (A) |
| Mass flow rate (kg/s) | |
| M | Mean value |
| N | Number of multiple tests |
| Nu | Nusselt number |
| Pr | Prandtl number |
| py | Random error |
| Re | Reynolds number |
| Sr | Standard deviation of result |
| T | Temperature (°C) |
| Uy | Overall uncertainty |
| V | Velocity of flow (m/s) |
| ZT | Dimensionless figure of merit |
| Abbreviations | |
| ANOVA | Analysis of variance |
| CCD | Center composite design |
| NTU | Number of transfer units |
| RSM | Response surface methodology |
| SMPS | Switched mode power supply |
| TEM | Thermoelectric module |
| Greek Symbls | |
| Model coefficient | |
| Effectiveness | |
| Heat conductivity (W/m·°C) | |
| Viscosity (kg/ms) | |
| Density (kg/m3) | |
| Subscripts | |
| c | Cold |
| h | Hot |
| hx | Heat exchange |
| in | Inlet |
| out | Outlet |
| surf | Surface |
| w | Water |
References
- Goetzler, W.; Guernsey, M.; Young, J.; Fuhrman, J.; Abdelaziz, O. The Future of Air Conditioning for Buildings; Navigant Consulting, Inc.: Burlington, MA, USA, 2016; pp. 1–94. [Google Scholar]
- Al-Nimr, M.A.; Tashtoush, B.M.; Jaradat, A.A. Modeling and simulation of thermoelectric device working as a heat pump and an electric generator under Mediterranean climate. Energy 2015, 90, 1239–1250. [Google Scholar] [CrossRef]
- Ramousse, J.; Sgorlon, D.; Fraisse, G.; Perier-Muzet, M. Analytical optimal design of thermoelectric heat pumps. Appl. Therm. Eng. 2015, 82, 48–56. [Google Scholar] [CrossRef]
- Lee, H. Thermoelectrics: Design and Materials, 1st ed.; John Wiley & Sons, Inc.: Hoboken, NJ, USA, 2017. [Google Scholar]
- Hermes, C.J.L.; Barbosa, J.R., Jr. Thermodynamic comparison of Peltier, Stirling, and vapor compression portable coolers. Appl. Energy 2012, 91, 51–58. [Google Scholar] [CrossRef]
- David, B.; Ramousse, J.; Luo, L. Optimization of thermoelectric heat pumps by operating condition management and heat exchanger design. Energy Convers. Manag. 2012, 60, 125–133. [Google Scholar] [CrossRef]
- Heremans, J.P. Low-dimensional thermoelectricity. Acta Phys. Pol. A 2005, 108, 609–634. [Google Scholar] [CrossRef]
- Tan, G.; Zhao, D. Study of a thermoelectric space cooling system integrated with phase change material. Appl. Therm. Eng. 2015, 86, 187–198. [Google Scholar] [CrossRef]
- Irshad, K.; Habib, K.; Basrawi, F.; Saha, B.B. Study of a thermoelectric air duct system assisted by photovoltaic wall for space cooling in tropical climate. Energy 2017, 119, 504–522. [Google Scholar] [CrossRef]
- Liu, Z.; Zhang, L.; Gong, G. Experimental evaluation of a solar thermoelectric cooled ceiling combined with displacement ventilation system. Energy Convers. Manag. 2014, 87, 559–565. [Google Scholar] [CrossRef]
- Allouhi, A.; Boharb, A.; Ratlamwala, T.; Kousksou, T.; Amine, M.B.; Jamil, A.; Msaad, A.A. Dynamic analysis of a thermoelectric heating system for space heating in a continuous-occupancy office room. Appl. Therm. Eng. 2017, 113, 150–159. [Google Scholar] [CrossRef]
- Wang, C.; Calderon, C.; Wang, Y.D. An experimental study of a thermoelectric heat exchange module for domestic space heating. Energy Build. 2017, 145, 1–21. [Google Scholar] [CrossRef]
- Xie, Y.; Zhang, T.; Liu, X. Performance investigation of a counter-flow heat pump driven liquid desiccant dehumidification system. Energy 2016, 115, 446–457. [Google Scholar] [CrossRef]
- Shin, J.H.; Park, J.Y.; Jo, M.S.; Jeong, J.W. Impact of heat pump-driven liquid desiccant dehumidification on the energy performance of an evaporative cooling-assisted air conditioning system. Energies 2018, 11, 345. [Google Scholar] [CrossRef]
- Yilmazoglu, M.Z. Experimental and numerical investigation of a prototype thermoelectric heating and cooling unit. Energy Build. 2016, 113, 51–60. [Google Scholar] [CrossRef]
- Ramousse, J.; Perier-Muzet, M. Entropy generation minimization in thermoelectric heat pump systems with multi-channel heat exchangers. Int. J. Thermodyn. 2016, 19, 82–90. [Google Scholar] [CrossRef][Green Version]
- Technical Data Sheet for DWP-385R. Available online: https://www.eleparts.co.kr/EPXGTWHV (accessed on 23 January 2017).
- Technical Data Sheet for HMN6055. Available online: http://www.peltier.co.kr/mobile/sub01/sub01.php (accessed on 23 January 2017).
- Myers, R.H.; Montgomery, D.C.; Anderson-cook, C.M. Building empirical models. In Response Surface Methodology, 3rd ed.; John Wiley & Sons, Inc.: Hoboken, NJ, USA, 2009; pp. 40–146. ISBN 9780470174463. [Google Scholar]
- User’s Manual of MV1000/MV2000 (Yokogawa Electric Corporation). Available online: https://web-material3.yokogawa.com/IMMV1000-01E_020.pdf (accessed on 23 January 2017).
- ASHRAE Guideline 2-2010: Engineering Analysis of Experimental Data; American Society of Heating, Refrigerating and Air-Conditioning Engineers, Inc.: Atlanta, GA, USA, 2010.
- Kim, M.H.; Park, J.Y.; Jeong, J.W. Simplified model for packed-bed tower regenerator in a liquid desiccant system. Appl. Therm. Eng. 2015, 89, 717–726. [Google Scholar] [CrossRef]
- Park, J.Y.; Yoon, D.S.; Lee, S.J.; Jeong, J.W. Empirical model for predicting the dehumidification effectiveness of a liquid desiccant system. Energy Build. 2016, 126, 447–454. [Google Scholar] [CrossRef]
- Cengel, Y.A. Heat exchangers. In Heat and Mass Transfer: A Practical Approach, 3rd ed.; McGraw-Hill Education: New York, NY, USA, 2007; pp. 668–717. [Google Scholar]
- Gnielinski, V. New Equations for heat and mass transfer in turbulent pipe and channel flow. Int. Chem. Eng. 1976, 16, 359–368. [Google Scholar]
- Petukhov, B.S. Heat transfer and friction in turbulent pipe flow with variable physical properties. Adv. Heat Transf. 1970, 6, 503–564. [Google Scholar]
- Jones, R. Response surface methods and other approaches to process optimization. In Design and Analysis of Experiments, 5th ed.; John Wiley & Sons, Inc.: Hoboken, NJ, USA, 1997; pp. 427–510. ISBN 9780471316490. [Google Scholar]
- Jaluria, Y. Search methods. In Design and Optimization of Thermal Systems, 2nd ed.; CRC Press: Boca Raton, FL, USA, 2008; pp. 511–558. ISBN 9780849337536. [Google Scholar]


© 2018 by the authors. Licensee MDPI, Basel, Switzerland. This article is an open access article distributed under the terms and conditions of the Creative Commons Attribution (CC BY) license (http://creativecommons.org/licenses/by/4.0/).