Abstract
This paper presents the results of hot smoke tests, which were conducted in a real road tunnel. The tunnel is located within the expressway S69 in southern Poland between cities Żywiec and Zwardoń. Its common name is Laliki tunnel. It is a bidirectional non-urban tunnel. The length of the tunnel is 678 m and it is inclined by 4%. It is equipped with the longitudinal ventilation system. Two hot smoke tests have been carried out according to Australian Standard AS 4391-1999. Hot smoke tests corresponded to a Heat Release Rate (HRR) equal to respectively 750 kW and 1500 kW. The fire source was located in the middle of the road lane imitating an initial phase of a car fire (respectively 150 m and 265 m from S portal). The temperature distribution was recorded during both tests using a set of fourteen thermocouples that were mounted at two stand poles located at the main axis of the tunnel on windward. The stand poles were placed at distances of 5 m and 10 m. The recorded data were applied to validate a numerical model, which was built and solved using Ansys Fluent. The calculated temperature distribution matched the measured values.
1. Introduction
The development of a fire in a road tunnel is always a huge threat. The appearance of large amounts of toxic smoke makes it very difficult to evacuate people and to operate by rescue teams. The limited space of the tunnel means that the rapidly increasing temperature is also a threat.
Evacuation of people from the tunnel should start as soon as possible. It begins just after noting the fire—but this applies to direct observers. However, it concerns all the other endangered users of the tunnel only after activation of the fire emergency system. Activation of the fire system takes place after receiving a signal from a smoke detector, laser fiber sensor or tunnel technical service through video monitoring. The triggered fire signal activates sound and light systems that signal the necessity of evacuation. At the same time, the location where the signal was triggered informs the technical service and the emergency services about the place of fire development. This is of great importance for the operation of emergency services and for the activation of the fire ventilation system. Often, the fire ventilation system in the road tunnel is activated according to a specific emergency operation pattern, depending on the location of the fire. Such a working system is usually found in bidirectional tunnels. The safety of endangered people in the tunnel depends, to a large extent, on the speed of activation of the emergency system and the proper operation of the fire ventilation system under the given conditions. During common daily operation of the tunnel, the fans are turned on for ventilation purposes or dilution of pollutants. The signal aroused by exceeding the permissible concentrations of traffic pollution or a decrease in visibility will cause the fans to switch on in the normal mode [1].
All road tunnels should be equipped with fire ventilation systems. Depending on the length of the tunnel and whether the road traffic is one or bidirectional, it can be equipped with natural ventilation, longitudinal ventilation, transverse ventilation, or semi-transverse ventilation. For tunnels up to 1000 m long, longitudinal ventilation systems are most often designed. For longer tunnels, transverse ventilation is designed. The operation of longitudinal ventilation is based on the operation of axial fans that are located under the tunnel ceiling. A design of a longitudinal ventilation system involves determining the number and arrangement of axial fans.
The correct operation of longitudinal ventilation in a road tunnel is when the air accelerated by axial fans reaches the critical velocity and hot fumes are discharged through the nearest portal. In the initial growth phase of a fire, the critical velocity should be sufficient to ensure that both smoke and heat flow in the required direction. On the other hand, it should not disturb the natural stratification of smoke and air layers in the tunnel [2]. Smoke flow in the opposite direction is defined as backlayering. Backlayering can lead to the complete smokiness of a tunnel. This phenomenon is strongly undesirable because it causes smoke to contaminate the entire tunnel despite the operation of the longitudinal ventilation [3]. Researchers are conducting a lot of studies to avoid this phenomenon during the operation of fire ventilation. Gannouni used numerical analyses to study the impact of ventilation air velocity and the power of fire on the phenomenon of backlayering [4]. Studies on backlayering have shown that it can also occur locally in situations where the air velocity decreases near the tunnel walls or at its bend [5,6]. On the other hand, Yao investigated the appearance of reverse smoke flow in tunnels with vertical ventilation ducts [7].
The basic requirement for properly operating fire ventilation in the tunnel is to generate a flow with a specified critical velocity. However, it turns out that many factors affect the value of this velocity. The one of them is the inclination of a tunnel. It causes additional airflow that is related to the natural stack effect. It is assumed, that if the inclination is greater than 1–2%, then this fact should be taken into account when designing the ventilation system and determining the critical velocity [8,9,10]. The natural stack effect can be strengthened by the action of the wind [11]. It is obvious that if the slope of the tunnel and the wind blowing outside the tunnel affect the critical velocity value, these factors will also affect the flow of smoke in the initial phase of the fire. It may happen that the fire does not outbreak at once with very high power and in the initial stage the smoke does not reach high temperatures. Smoke of a low temperature, in the initial phase of a fire can float just over the road surface. This will result in an uncontrolled flow of smoke and consequently a delayed activation of the fire emergency system.
Studying the phenomena occurring in the tunnel during the fire development is difficult. Both model studies [12,13,14,15] and numerical analyses [16,17,18,19] are used for this purpose. Many authors point to the lack of data from research in real tunnels, which could be the basis for the validation of numerical models [17,19]. Undoubtedly, numerical analyses are the cheapest and are most willingly used way to study phenomena accompanying the development of fire and the operation of fire ventilation systems [20,21,22,23].
Two leading aims were set for the presented work: examining the operation of the fire detection system and acquisition the experimental data for validation of a numerical model. As was mentioned above, such tests in a real tunnel are valuable for the community of researches that are dealing with the issues of tunnel safety. However, such tests are burdened with the difficulties resulting mainly from the very short time that is available for experiments. It is due the necessity of temporarily traffic shutdown. The next difficulties results from high variability of flow conditions in a real tunnel, despite continuous monitoring of air velocity inside the tunnel and weather conditions at both portals the turbulent nature of air flow causes local fluctuations, which disturb the measurements.
At the beginning the article presents a short description of the tunnel, then the carried out tests with hot smoke are discussed in detail. Some observations on operation of fire detection system and fire ventilation system are pointed out. Then, the numerical model of the examined road tunnel was detailed described. The model was used to study the hot gases flow in the tunnel under wind conditions. The model was validated using the results of tests that were carried out in a real road tunnel. The presented experimental research was actually wider and included the measurements of air flows that were forced by fans [11].
2. Description of the Tunnel
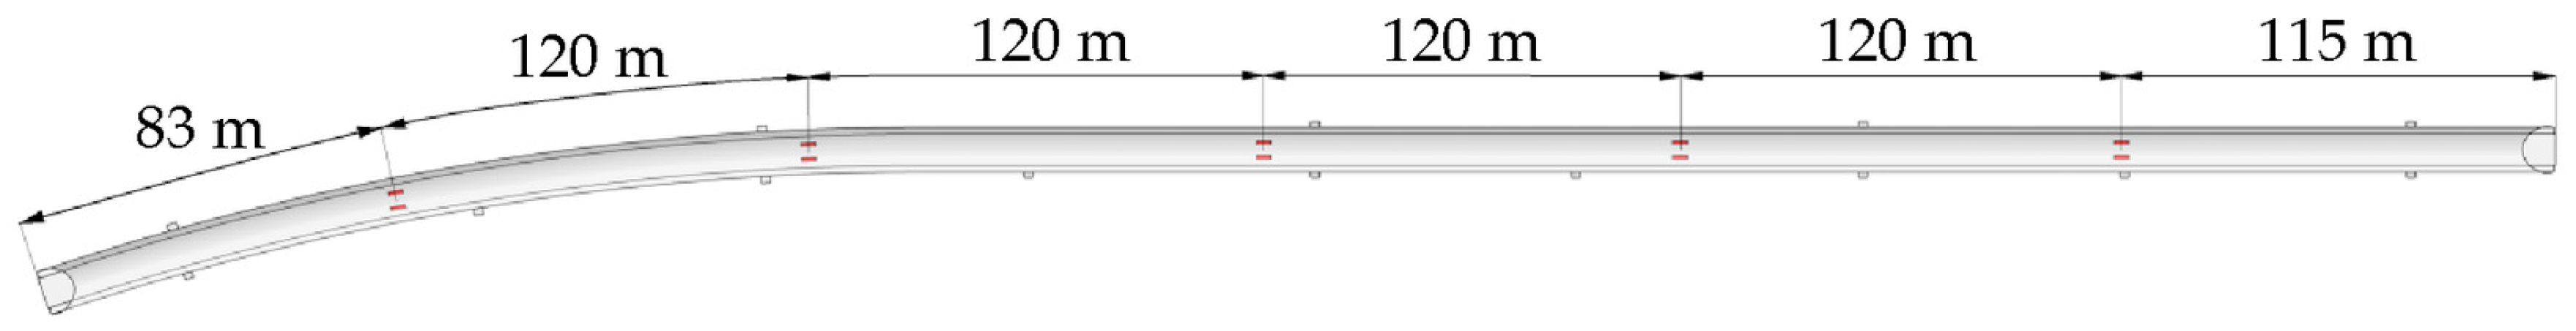
The tunnel is located within the S69 road and it links Żywiec and Zwardoń. The length of the tunnel is 678 m, the width is 11.9 m, and the height is 6.55 m. The gradient (inclination) of the tunnel is 4%. The tunnel is not rectilinear (Figure 1). The northern portal has an elevation of 669 m a.s.l. and the southern portal has an elevation of 642 m a.s.l.
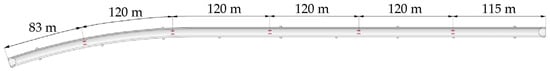
Figure 1.
The overlay of the tunnel and location of the fans.
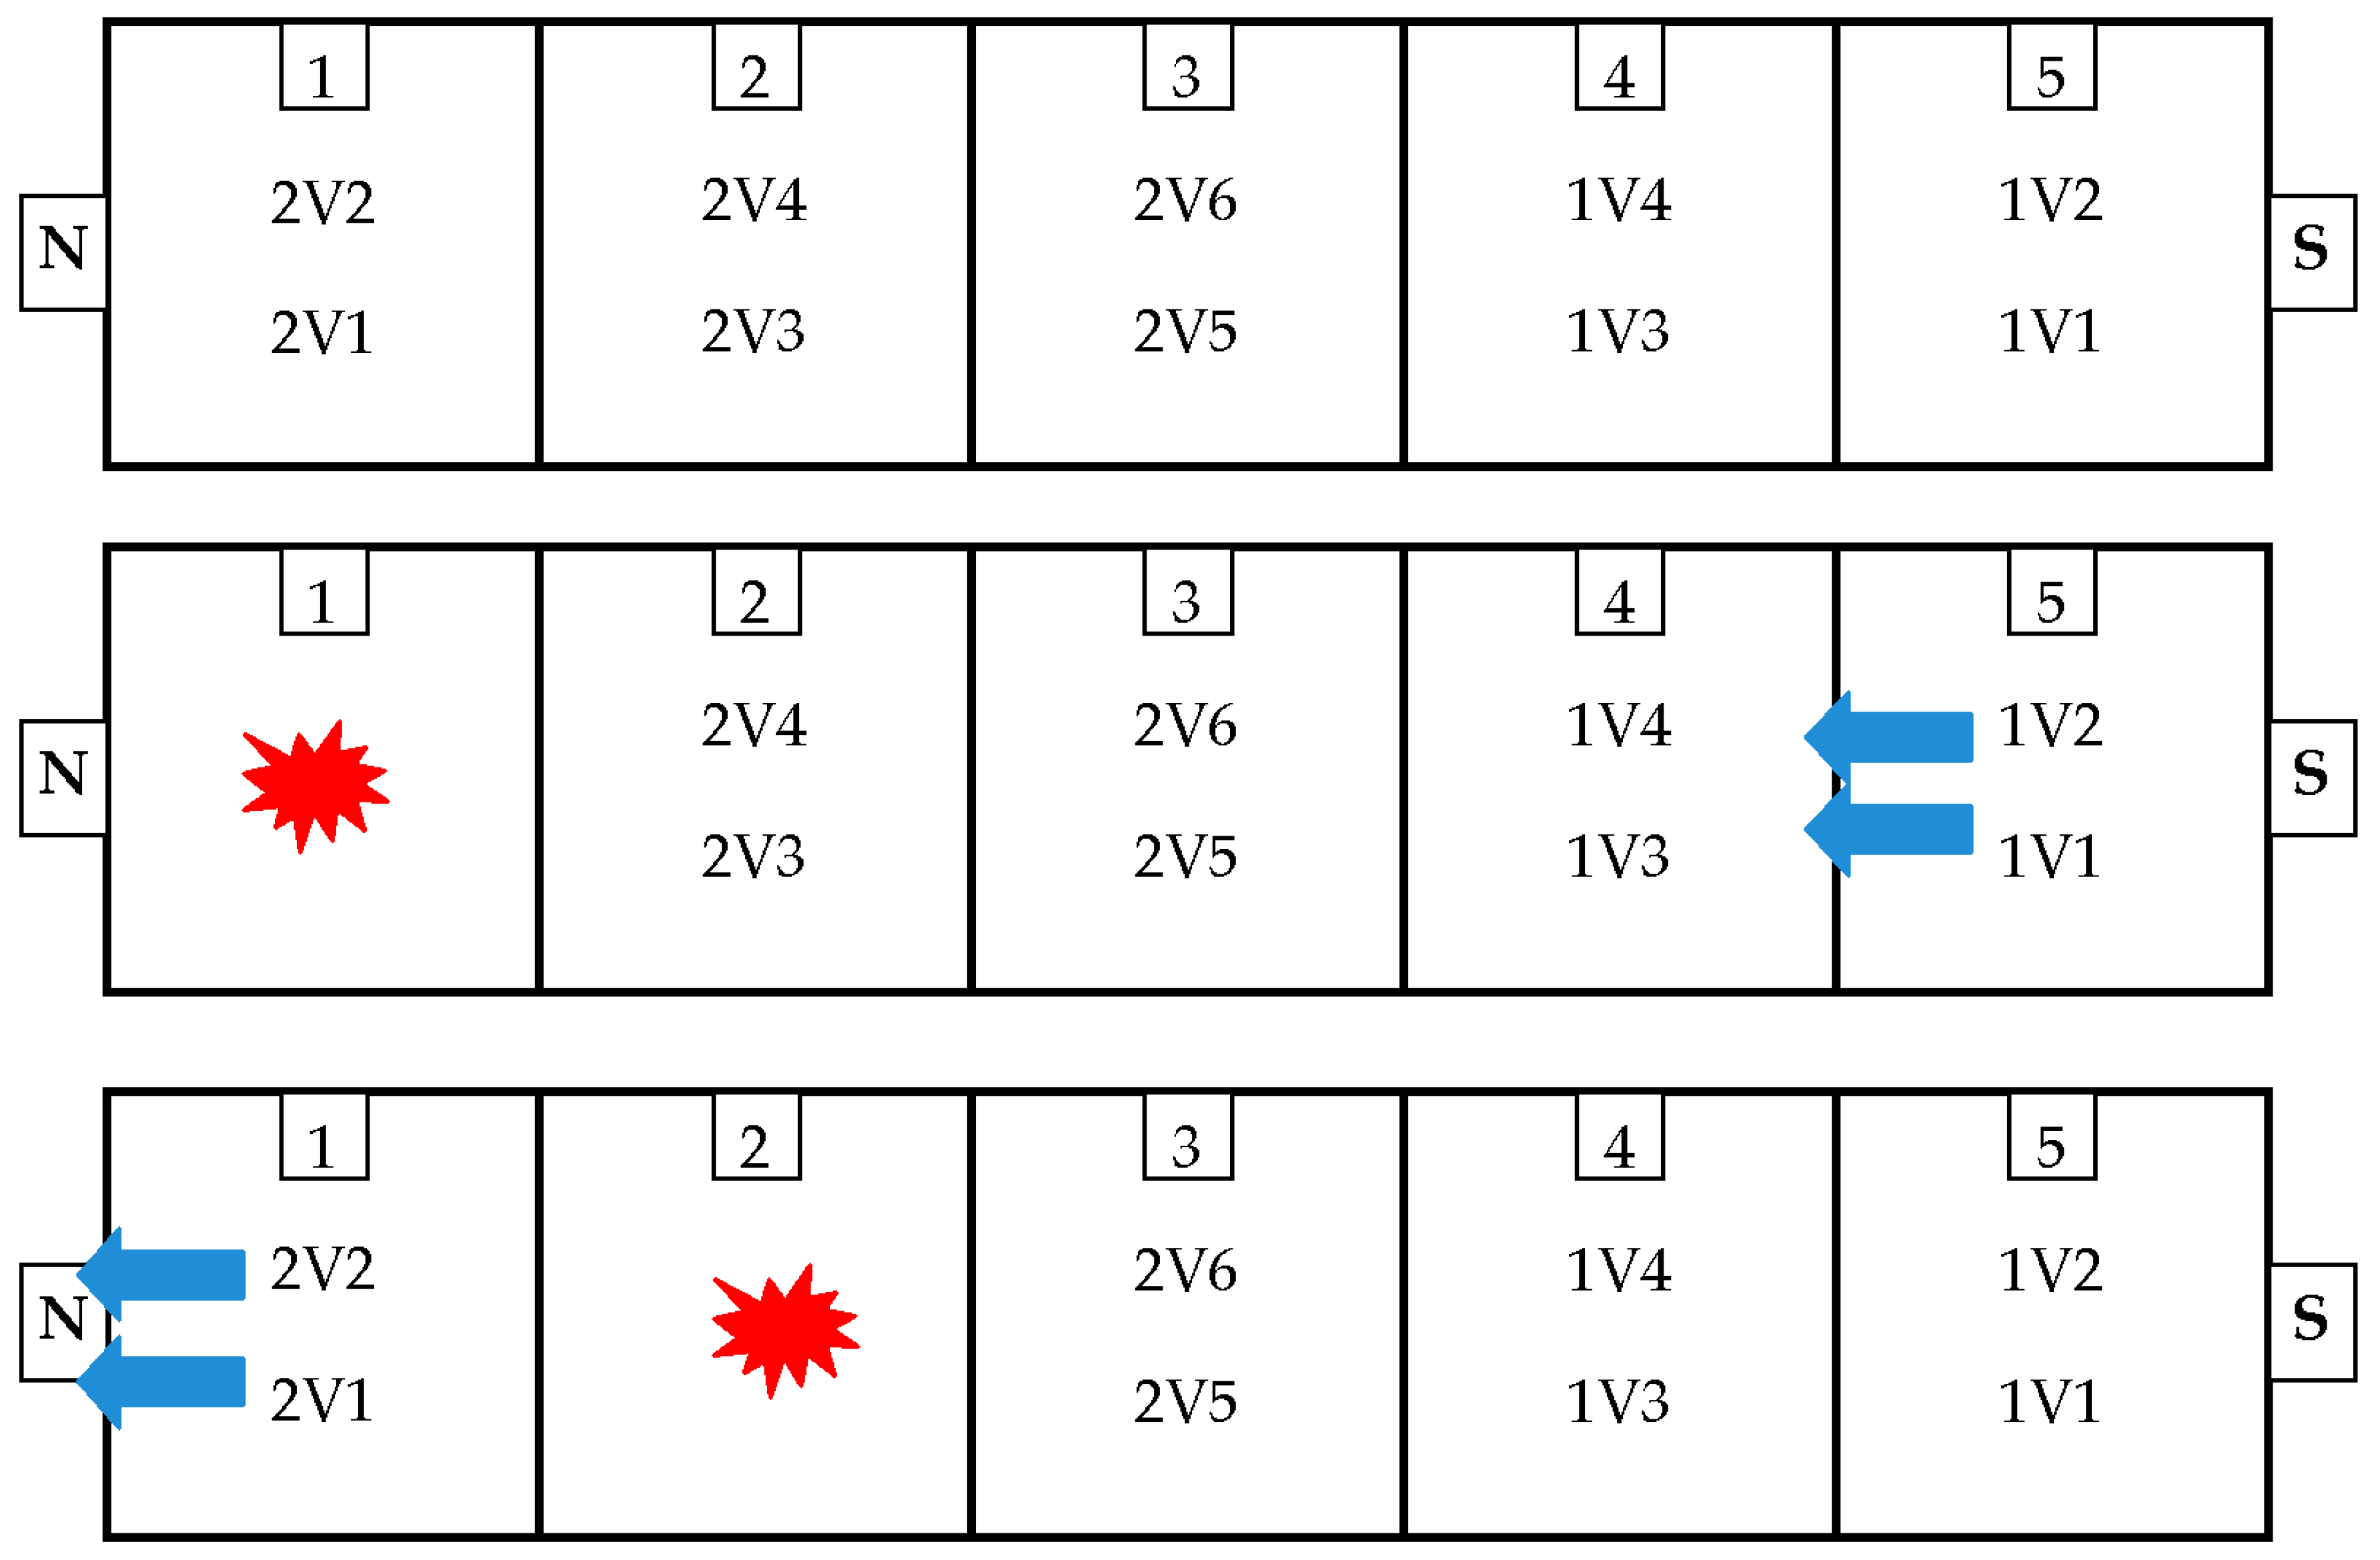
The tunnel is divided into five zones where the first is near the northern portal. Each zone has two fans mounted. The emergency operation pattern of the fans is set up to activate them in a given zone depending on the location of fire ignition. Figure 2 shows the division of the tunnel into zones and assignment of the fans. It presents also a part of the emergency operation pattern of the fans.

Figure 2.
Zones in the tunnel. Dimensions are given in meters; the figure is not in scale. Red spot denotes fire localization, blue arrows denote working fans and flow direction.
The work of the fans was determined in such a way to avoid smokiness of whole the tunnel. The main rule was to remove smoke instead of allowing it to flow through the tunnel. For example, a fire in zone 1 should activate fans 1V2 and 1V1 to blow in the N direction. A fire in zone 2 should activate fans 2V2 and 2V1, also to blow in the N direction.
The fans can also work in normal mode. The fans will turn on when the concentration of harmful substances in the tunnel is exceeded or when the visibility decreases. The direction of operation of the fans in the normal mode is consistent with the direction of the natural draught in that tunnel, i.e., S→N.
3. Experimental Method
3.1. Air Velocity Measurements
Air velocity was continuously recorded by the ultrasonic gauge FLSE200H. The gauge that was manufactured by SICK MAIHAK Company (Reute, Germany) was mounted under the tunnel ceiling at the distance of 114 from northern portal. Its measurement range was from −20 to 20 m/s, with an accuracy of ±0.1 m/s.
3.2. Weather Condition Monitoring
Wind strongly influences airflow and smoke flow in a tunnel (especially in a long one). Thus, wind velocity and direction were measured at both portals of the tunnel during the tests. An Ultrasonic anemometer WindMaster Pro, manufactured by Gill Instruments was used at the N portal. It allows for the measurement of wind velocity in three dimensions by determination of particular vectors in three-dimensions (3D). However, only the horizontal velocity was taken into further consideration. The range was from 0 to 45 m/s. Accuracy was 1% RMS with resolution 0.01 m/s. The meteorological station Kestrel 4500 was used at the S portal. The range of measured wind velocity was from 0.4 to 40 m/s. Accuracy was 5% with resolution 0.1 m/s. Both of the devices were also able to record continuously the atmospheric pressure and the air temperature. Both devices were placed close to the portals to measure the actual wind parameters at the portals.
3.3. Hot Smoke Tests
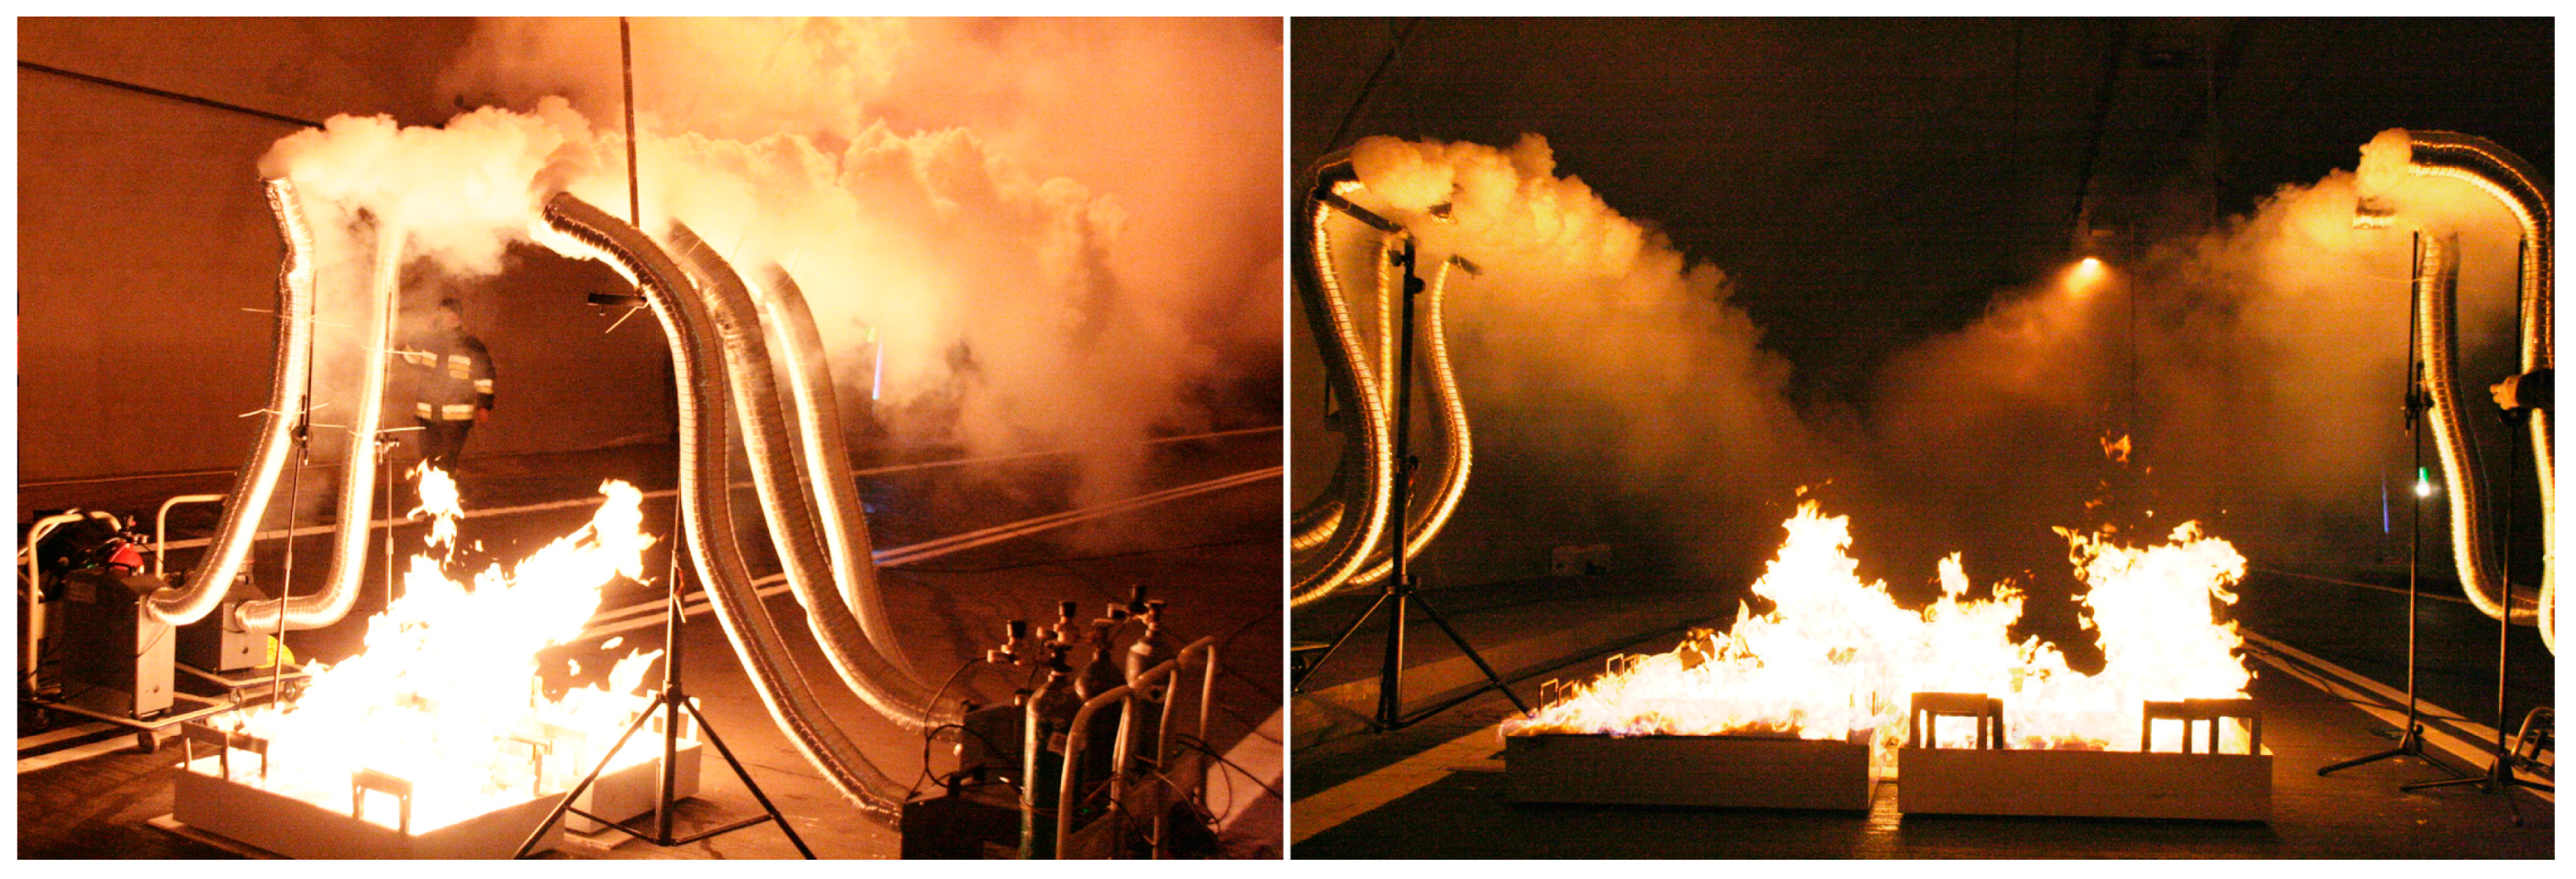
Two hot smoke tests have been conducted. They were based on the Australian Standard AS 4391-1999 [24]. Five smoke generators that were made by the Vulcan Company and two or four fire trays (containing ethanol) were in use. According to the above standard, two fire trays of A1 size filled with 16 dm3 of ethanol give a heat output (HRR) of 700 kW, whereas four fire trays the same size produce a heat output (HRR) of 1500 kW. Such trays configuration and the amount of fuel should assure the following burning sequence: 3 min of fire growth, 10 min of stable fire and 3 min of decay [24]. The trays were placed in the middle of the road lane (Figure 3).

Figure 3.
Configuration of the generators and trays during both hot smoke tests (left—two trays, right—four trays).
Fourteen thermocouples that were mounted at two stand-poles were used for continuous monitoring of the air temperature. A hand-held Flir thermo-vision camera was used for snatch measurements of the temperature at ceiling and walls. The stand-poles were located along the tunnel axis at the distances of 5 m and 10 m from the last tray on leeward towards the S portal (Figure 4).
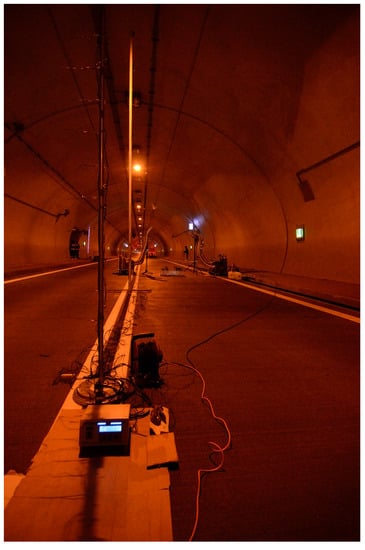
Figure 4.
Stand-poles with thermocouples and a thirty-channel thermometer.
The fire detection and ventilation systems were switched to automatic mode in the first test to examine their operation. Both of the systems were switched to manual mode in the second test, which is what allowed for the undisturbed fire development. The details of the hot smoke tests are given in Table 1.

Table 1.
Hot smoke tests—details.
4. Results
4.1. Ambient Conditions during the Tests
Both of the tunnel portals are located in a deep ravine; therefore, the weather conditions in their vicinity might differ from those at the upper lands. However, the recorded values exactly described the wind conditions at the portals. The variations of wind velocity and wind direction during the tests are given in Table 2.
Table 2.
The variations of wind velocity and wind direction during the tests.
Direction 0° corresponds to wind from N, 90° to E, ±180° to S, and −90° to W. The atmospheric pressure was 942 hPa and was almost unchanged during the whole day. The temperature was also stable and varied between 7 °C and 8 °C.
4.2. Hot Smoke Tests—Temperature Distribution
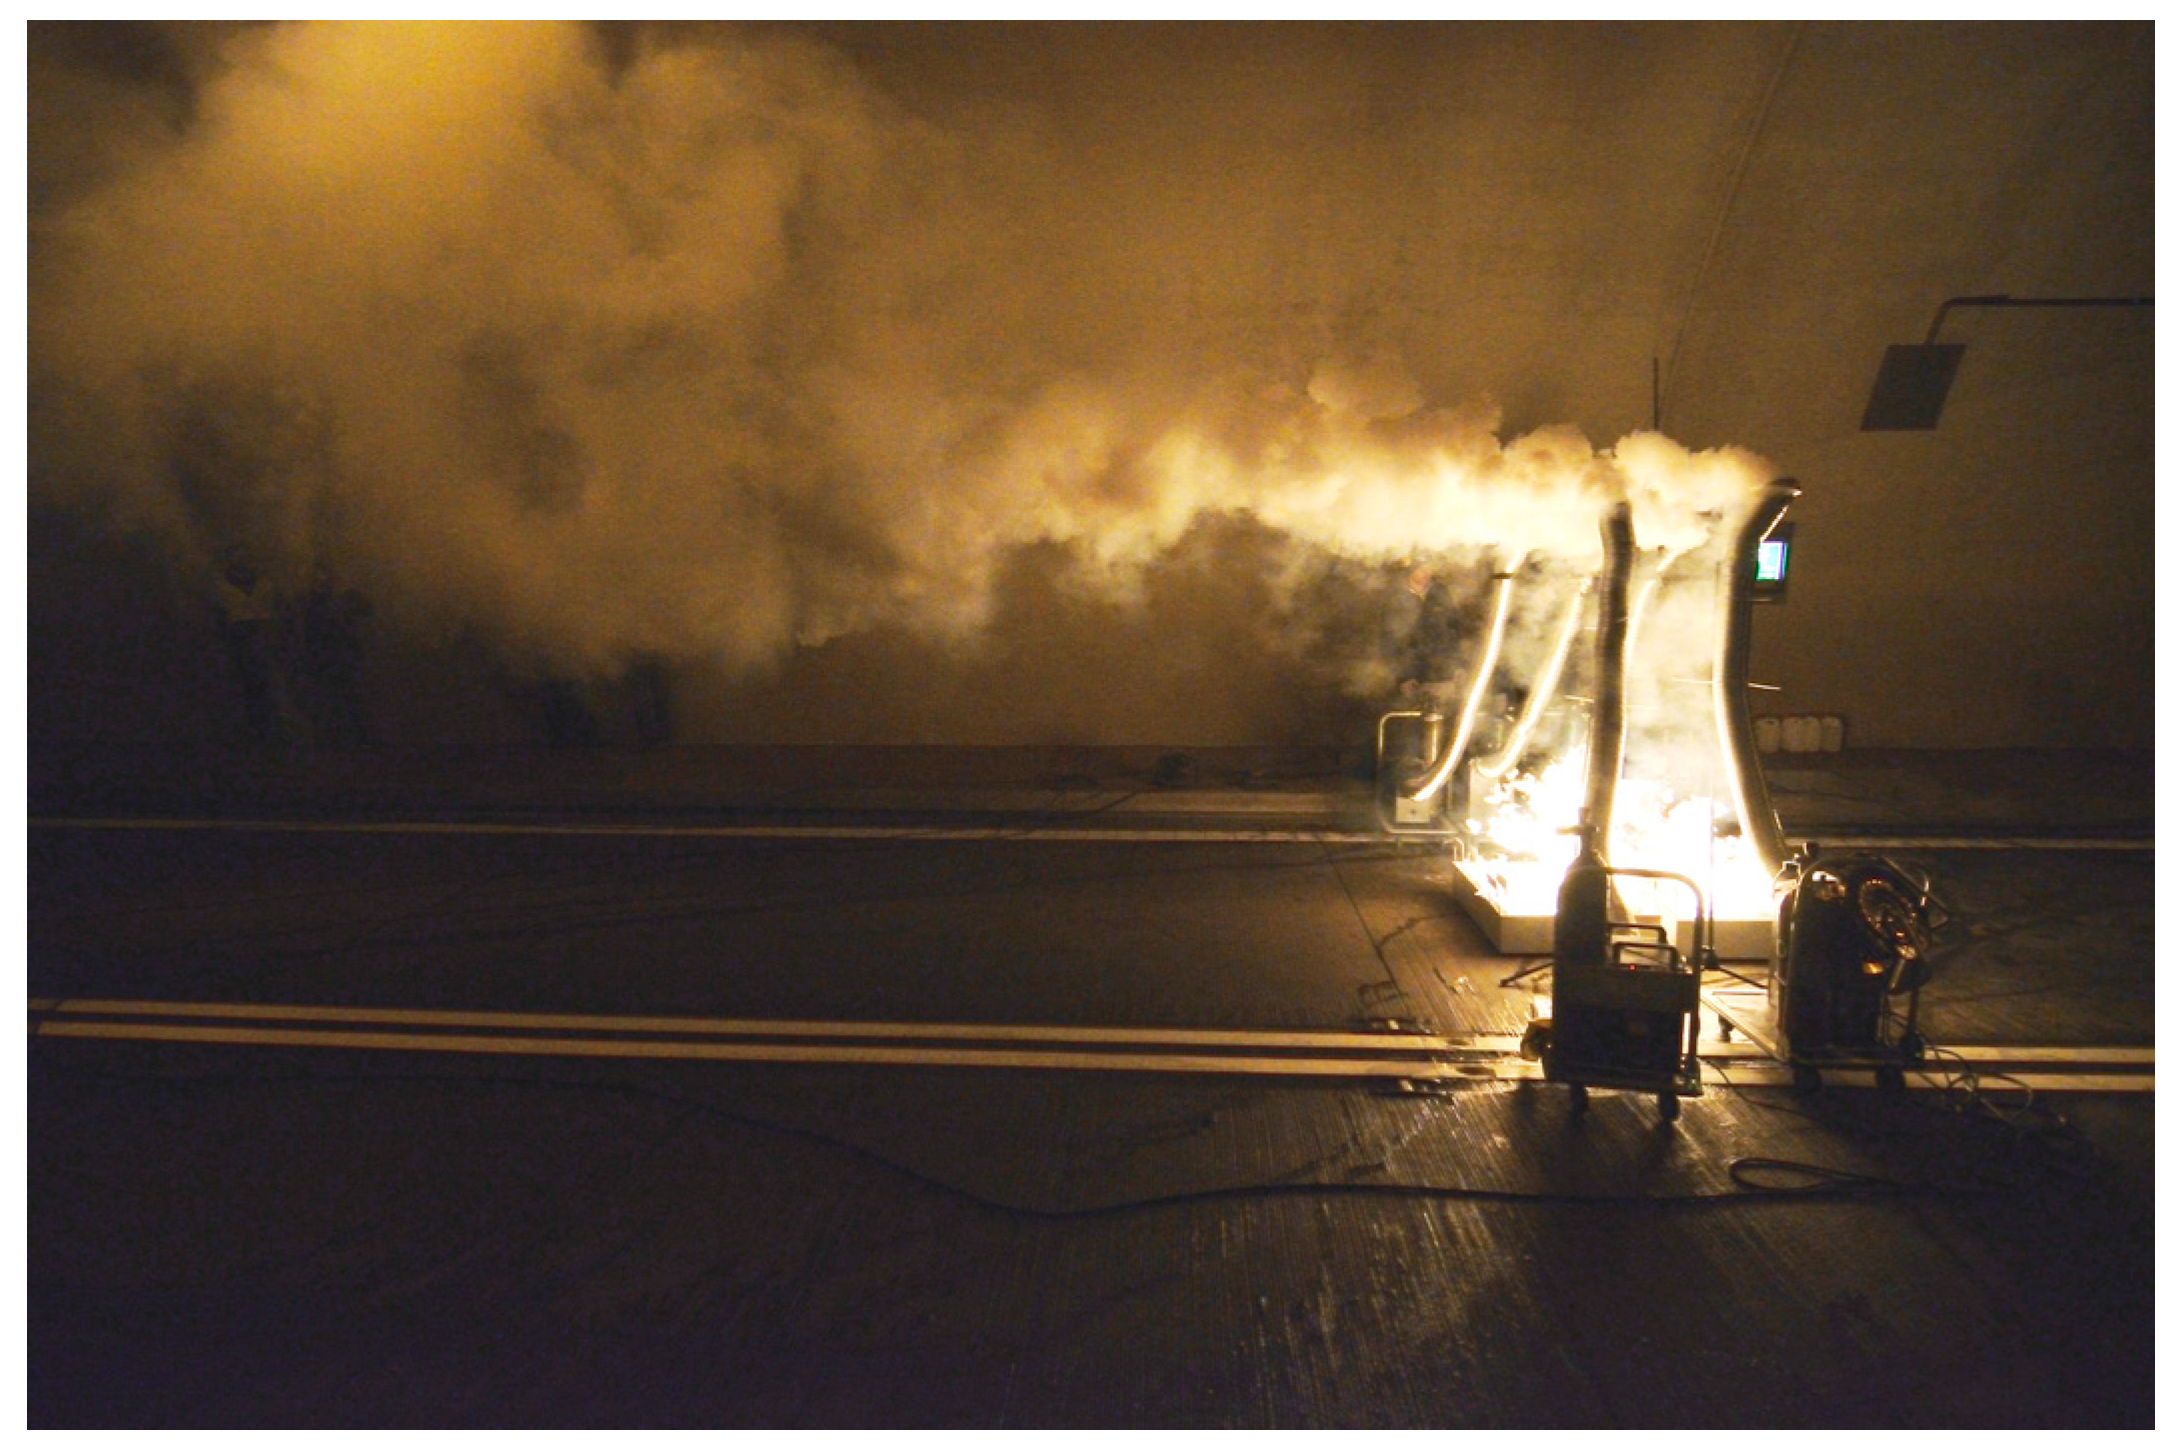
Two hot smoke tests were carried out. During the first test, two trays containing ethanol were burned and this provided an HRR that was equal to 700 kW, according to the Australian Standard [24]. Two stand-poles with mounted thermocouples were in use. They were placed on windward, respectively 5 m and 10 m from the edge of the last tray. During the test, it turned out that the natural stack effect and wind influence produced a strong natural airflow, forcing the smoke to flow almost horizontally (Figure 5), and no temperature increase at the thermocouples was detected (on windward).

Figure 5.
Horizontal direction of smoke flow during the first hot smoke test.
During the first test, the fire ventilation system was expected to turn on automatically. The first level of alarm was triggered in the 4th zone instead of the 5th (Figure 6). The smoke was flowing towards the N portal due to the natural stack effect and wind impact. The temperature of the smoke was too low to trigger the ventilation system in fire mode (second level alarm). Instead, the ventilation system was switched on in normal mode because moving smoke caused a decrease of visibility. Hence, the visibility sensor in the neighboring section gave a signal to start the ventilation system. As a result, the fans started working in the 3rd zone in the normal operation mode.
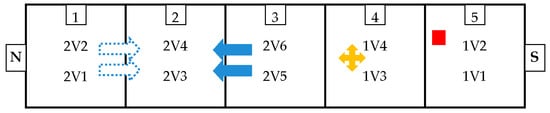
Figure 6.
Operation pattern of fans with the operating status of devices during the test (red square—fire, yellow cross—visibility detector, filled arrows—actual fans operation, dotted arrows—expected fans operation).
The location of the trays with burning ethanol is shown in Figure 6. The position of the visibility sensor in zone 4 is also marked. The expected reaction of fire ventilation system is marked by dotted arrows, filled arrows shows the actual operation of the ventilation system in normal mode. As the trays with burning alcohol were located in the 5th zone, the proper fire detection should indicate the fire in this section. Therefore, the fans in the 1st section should be activated in the fire mode. However, eventually the fans were activated in the 3rd zone in normal mode operation, which is what caused smokiness in whole tunnel.
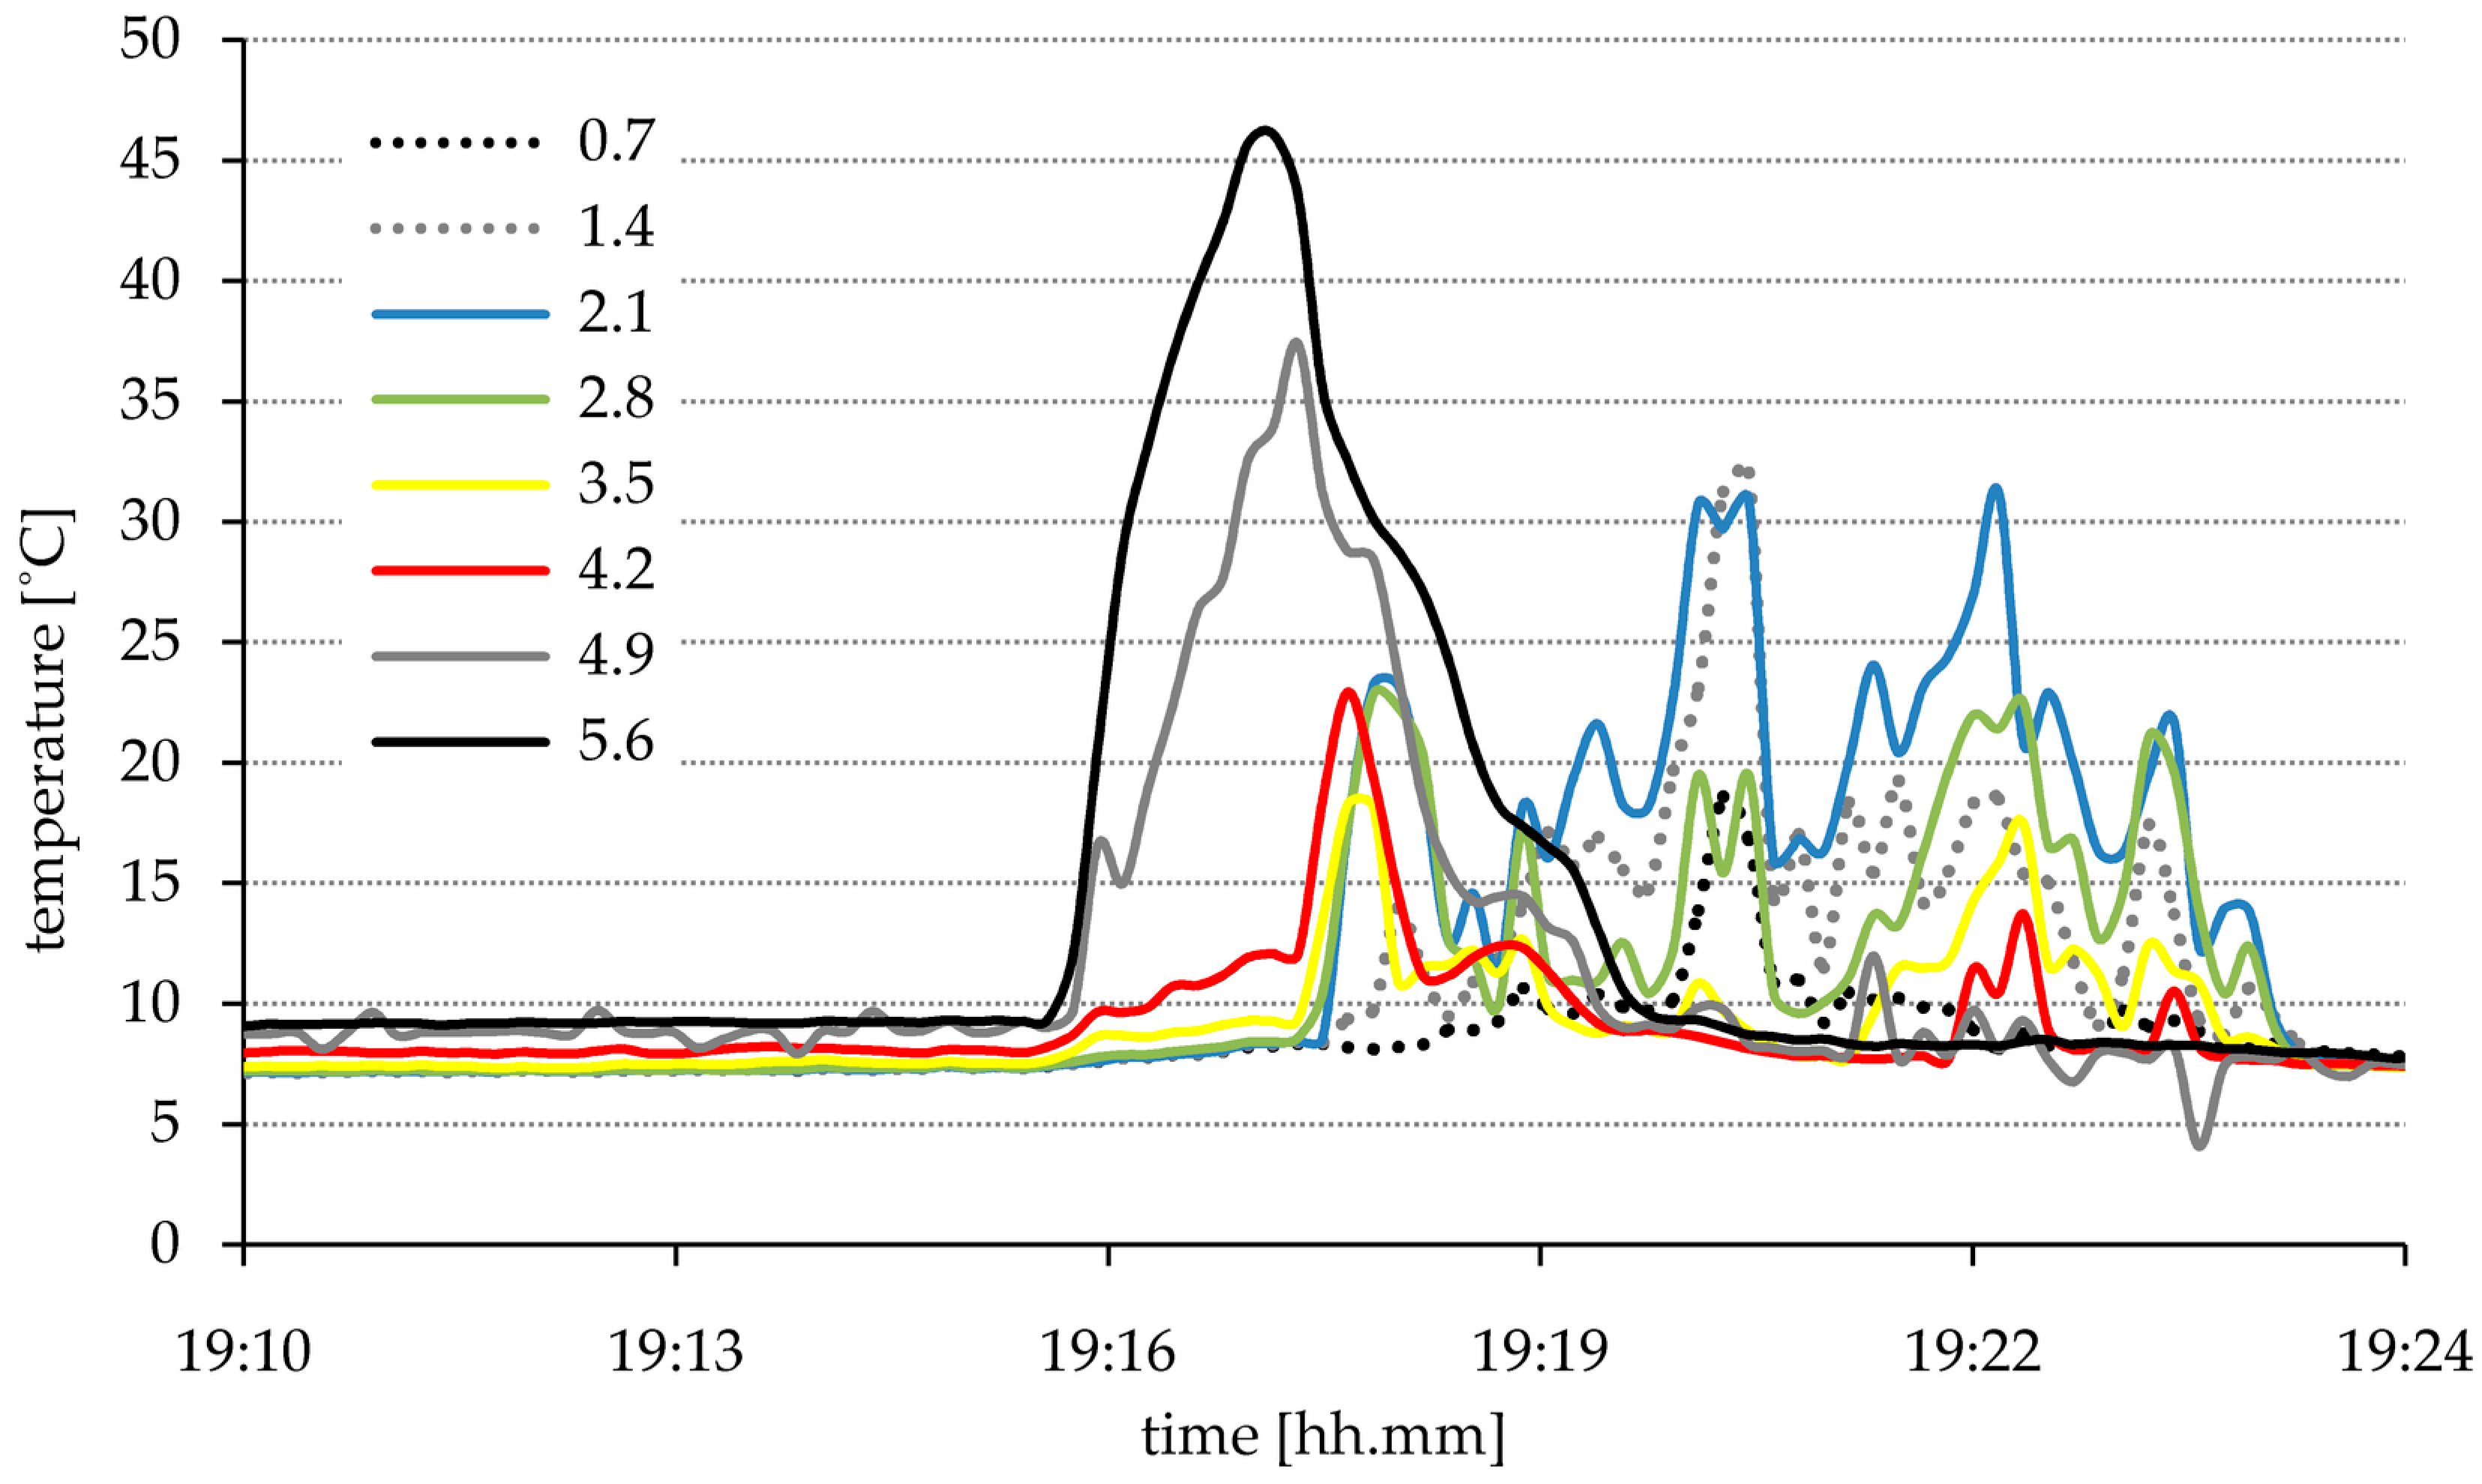
Four trays were applied in the second test. This provided an HRR equal to 1500 kW according to the Australian Standard [24]. The location of the test point was also moved (see Table 1), although the relative configuration of stand-poles was the same as during the first test. Preliminary test carried out in an empty hall showed the high sensitivity of convection plume on even weak gusts. Furthermore, the wind on the day of experiment, although weak, blew almost along the tunnel axis, which is what strongly influenced the first test. Therefore, when considering the strong natural stack effect and wind influence [11], it was decided to cover partially the portal S by a curtain. The curtain covered 90% of the cross-section area of S portal, so the natural draught was diminished to the average value of 0.6 m/s. During the second test, automatic detection of fire ventilation was turned off to allow the fire to develop in an undisturbed way. Then a temperature increase was detected by thermocouples (on windward). The temperature distribution at 5 m and 10 m is given in Figure 7 and Figure 8.
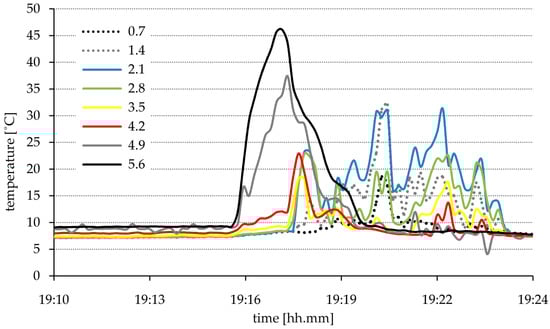
Figure 7.
Temperature distribution on windward at 5 m from the last tray. The height of a measuring point is given in meters.
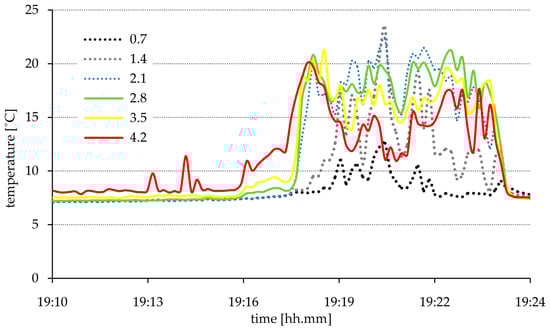
Figure 8.
Temperature distribution on windward at 10 m from the last tray. The height of a measuring point is given in meters.
As the second hot smoke test showed an increase of temperature on the windward side, evidently the upstream flow of hot gases was forced by the released heat. A reading of 46 °C was recorded at a height of 5.6 m, 5 m from the last tray. As was already mentioned, a residual natural flow remained, thus despite covering the S portal, smoke flow to the N portal was detected. Therefore, during this test, the leeward part of the tunnel was completely filled with smoke.
Due to the relatively short time of the hot smoke test, the tunnel ceiling was not warmed up significantly—the temperature of the tunnel ceiling just above the fire, as measured by the thermo-vision camera, did not exceed 20 °C in both tests. This value is beneath the temperature threshold of fibro-laser sensor activation (about 40 °C), but in the first test, this sensor should be also triggered by the rapid temperature rise (about 5 °C/60 s).
5. The Numerical Analysis of a Fire Development
5.1. Numerical Modeling of Combustion Process
The process of combustion is a very complex phenomenon. It involves many chemical reactions between the components of the fuel and the oxidant, which produce various intermediate and final products and release large amounts of energy. Complex turbulent flows must be also taken into account. This is a reason why some simplifications and pre-assumptions are required. The more so, because the research is focused on conditions inside the object in fire rather than on details of the combustion process. There are two fire models that are available when using Ansys Fluent software [25]:
- Species transport—the fire is modeled as a source emitting predefined combustion products. The mass flow rate and temperature of emitted species should be adjusted to fit the required fire heat release rate (HRR). This model only requires solving the additional transport equations for each taken into account specie. This approach entirely omits the details of combustion chemistry, thus it is unable to model the fire development controlled by ventilation.
- Non-premixed combustion—with the main assumption that chemical reactions of combustion run very quickly, therefore they can be regarded as immediate in comparison with the flows of all of the considered chemical compounds. This assumption allows for treating the combustion products (intermediate or final) and released heat as depending only on local composition of gases mixture and its temperature.
5.2. Numerical Model
The model consists of a tube representing the whole tunnel. Due to simplification, the curvature of the tunnel was neglected, but its inclination of 4% and shape were kept. Both portals were modeled as pressure boundary condition. It did not matter whether ‘pressure outlet’ or ‘pressure inlet’ type was finally selected. It was so because pressure boundary conditions of both types allow also for backflow. Thus, the resulting flow is determined by the pressure difference at portals and other phenomena occurring inside the tunnel instead of being predefined by boundary conditions.
The moving force of the examined phenomena was buoyancy, so gravity had to be taken into account in the model. In such circumstances, the variability of atmospheric pressure with the height could not be neglected. Therefore, the atmospheric pressure was generated using User Defined Function (UDF), according to the formula describing the pressure decrease with the height:
Additionally, a dynamic pressure component was added to the pressure at southern portal to model the wind influence:
The C++ codes of UDF functions modeling the gauge static pressure at both portals are listed below:
| Portal N | #define GACC 9.81 //gravity acceleration DEFINE_PROFILE(phstat_n,thread,i) { face_t f; real z; real vec[3]; begin_f_loop(f, thread) { F_CENTROID(vec,f,thread); z = vec[2]; F_PROFILE(f, thread, i) = -C_R(f, thread)*GACC*z; }end_f_loop(f, thread) } |
| Portal S | #define PDYN 0.21 //dynamic pressure of wind DEFINE_PROFILE(phstat_s,thread,i) { face_t f; real z; real vec[3]; begin_f_loop(f, thread) { F_CENTROID(vec,f,thread); z = vec[2]; F_PROFILE(f,thread, i) = -C_R(f, thread)*GACC*z + PDYN; }end_f_loop(f, thread) } |
The chemical reaction of combustion of ethanol in atmospheric oxygen runs according to the following expression:
Because the fire power in the considered case was rather low and the fire development was controlled by amount of fuel, it is no need to analyze the details of combustion process. So, the model of species transport was adopted. The net calorific value of ethanol is 27.2 MJ/kg, therefore to obtain HRR equal to 1.5 MW 0.055 kg of ethanol must burned per second. As the result of combustion process, according to reaction (3) 0.105 kg of CO2 and 0.065 kg of H2O is produced per second. Such values are assumed when defining the fire source as mass flow inlet. The temperature of emitted gases was so adjusted to achieve the required HRR. According to Australian Standard [24], the initial phase of fire growth should last about 3 min and this wasqualitatively confirmed using the thermo-vision camera during the tests. Therefore, this fact was taken into account by applying an UDF, which controlled the amount of emitted combustion products in the relevant way. The C++ code is listed below:
| #define T0 (3.0*60.0) //time of fire growth #define MFMAX 0.174 //mass flow rate of combustion products DEFINE_PROFILE(fire, thread, i) { face_t f; real t, m; t = CURRENT_TIME; if (t < T0) m = (t/T0)* MFMAX; else m = MFMAX; begin_f_loop(f, thread) { F_PROFILE (f, thread, i) = m; } end_f_loop(f, thread) } |
Because of relatively low fire power, the effect of radiative heat transport can be neglected. It was checked with the use of thermo-vision camera. In such circumstances there was no radiation model used.
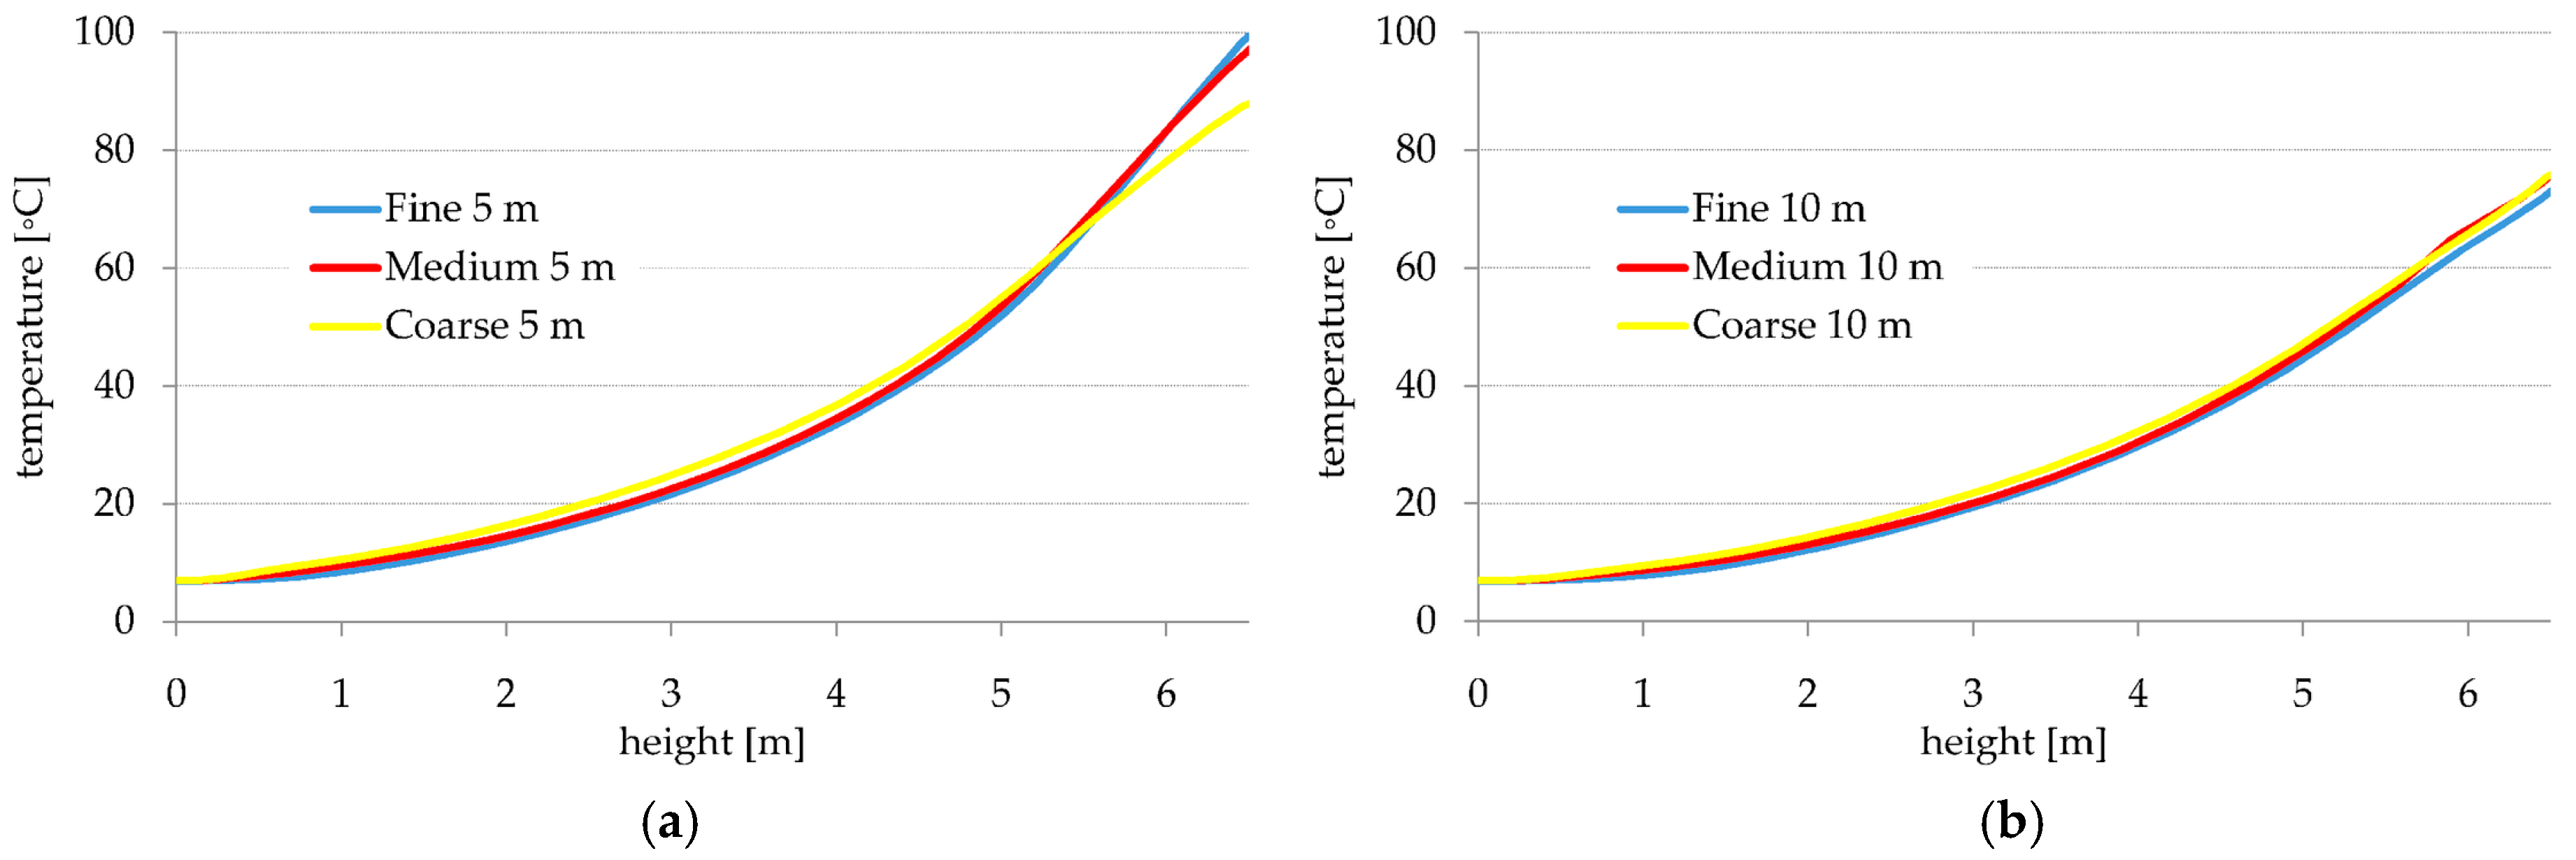
For tube-shaped objects, like tunnels, the effects of walls vicinity should be taken into account, therefore k-omega SST turbulence model was adopted. The quality of results of numerical modeling, especially when modeling fluid flows with RANS (Reynolds Averaged Navier-Stokes) approaches strongly depends on numerical mesh used. To assure the proper reproducing of the flows close to the fire the volume surrounding the fire and the convective plume above was meshed with denser grid. Five inflation layers were added in the vicinity of the tunnel walls, ceiling and floor. The mesh was generated using the cut cell assembly method, what allowed for almost regular mesh. The mesh sensitivity of the model was checked in steady calculation mode. Figure 9 shows the comparison of the results for three meshes of different densities, which are described in Table 3. Table 3 contains also the mass flow rate balances for obtained solutions.
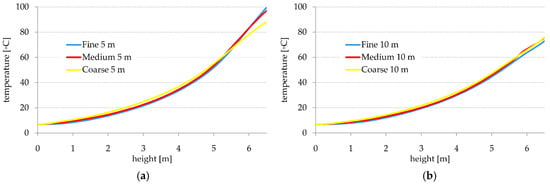
Figure 9.
Temperature distribution at the tunnel axis on windward at: (a) 5 m and (b) 10 m from the last tray for three mesh densities.
Table 3.
Preliminary test meshes and the overview mass flow rate balances.
As it can be seen, the temperature distributions for medium and fine meshes are almost the same. The mass flow rates through tunnel portals differ by 1.5%. All of the mass fluxes should be balanced—their sum should be very close to zero. Finally, taking into account the accuracy of mass flow rate balance the fine mesh was selected for successive calculations. The obtained results can be regarded as mesh independent.
The height of wall roughness for tunnel walls and ceiling was tuned to model the effective flow resistance of details of tunnel infrastructure (lamps, sensors, signs, cables, and fans) [11]. Table 4 contains the summary of the numerical model.
Table 4.
Numerical model summary.
5.3. Numerical Results and Validation
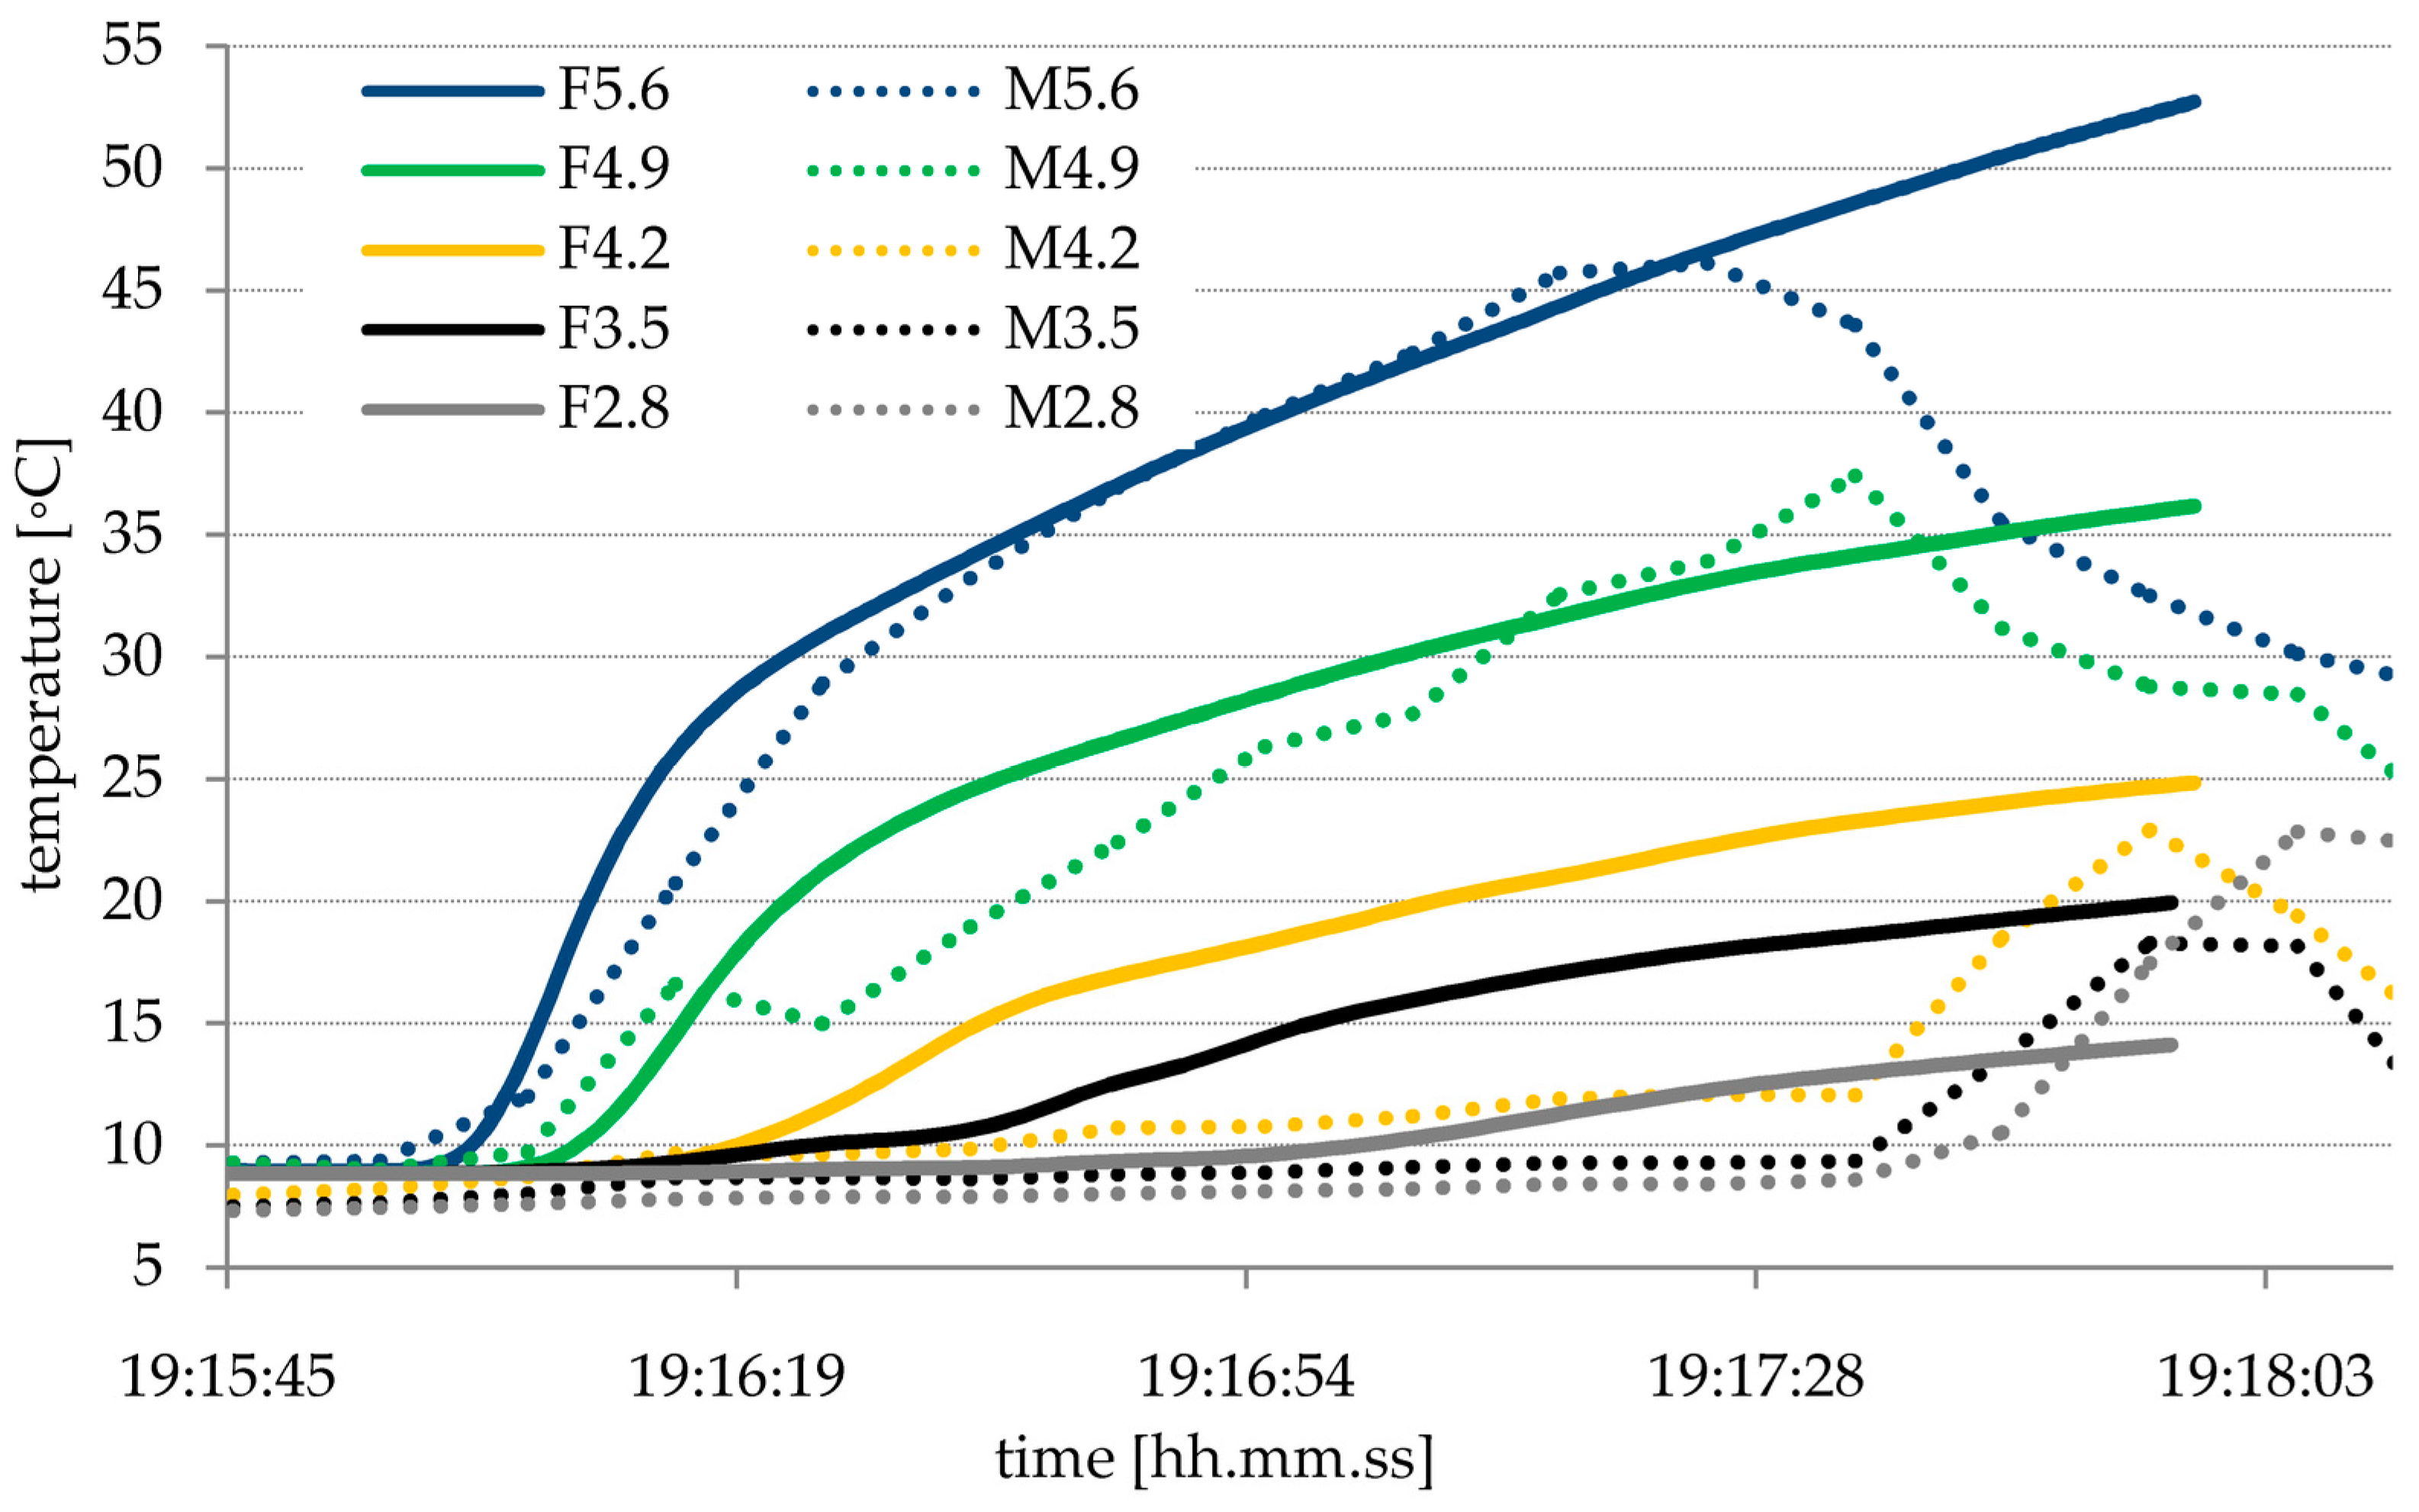
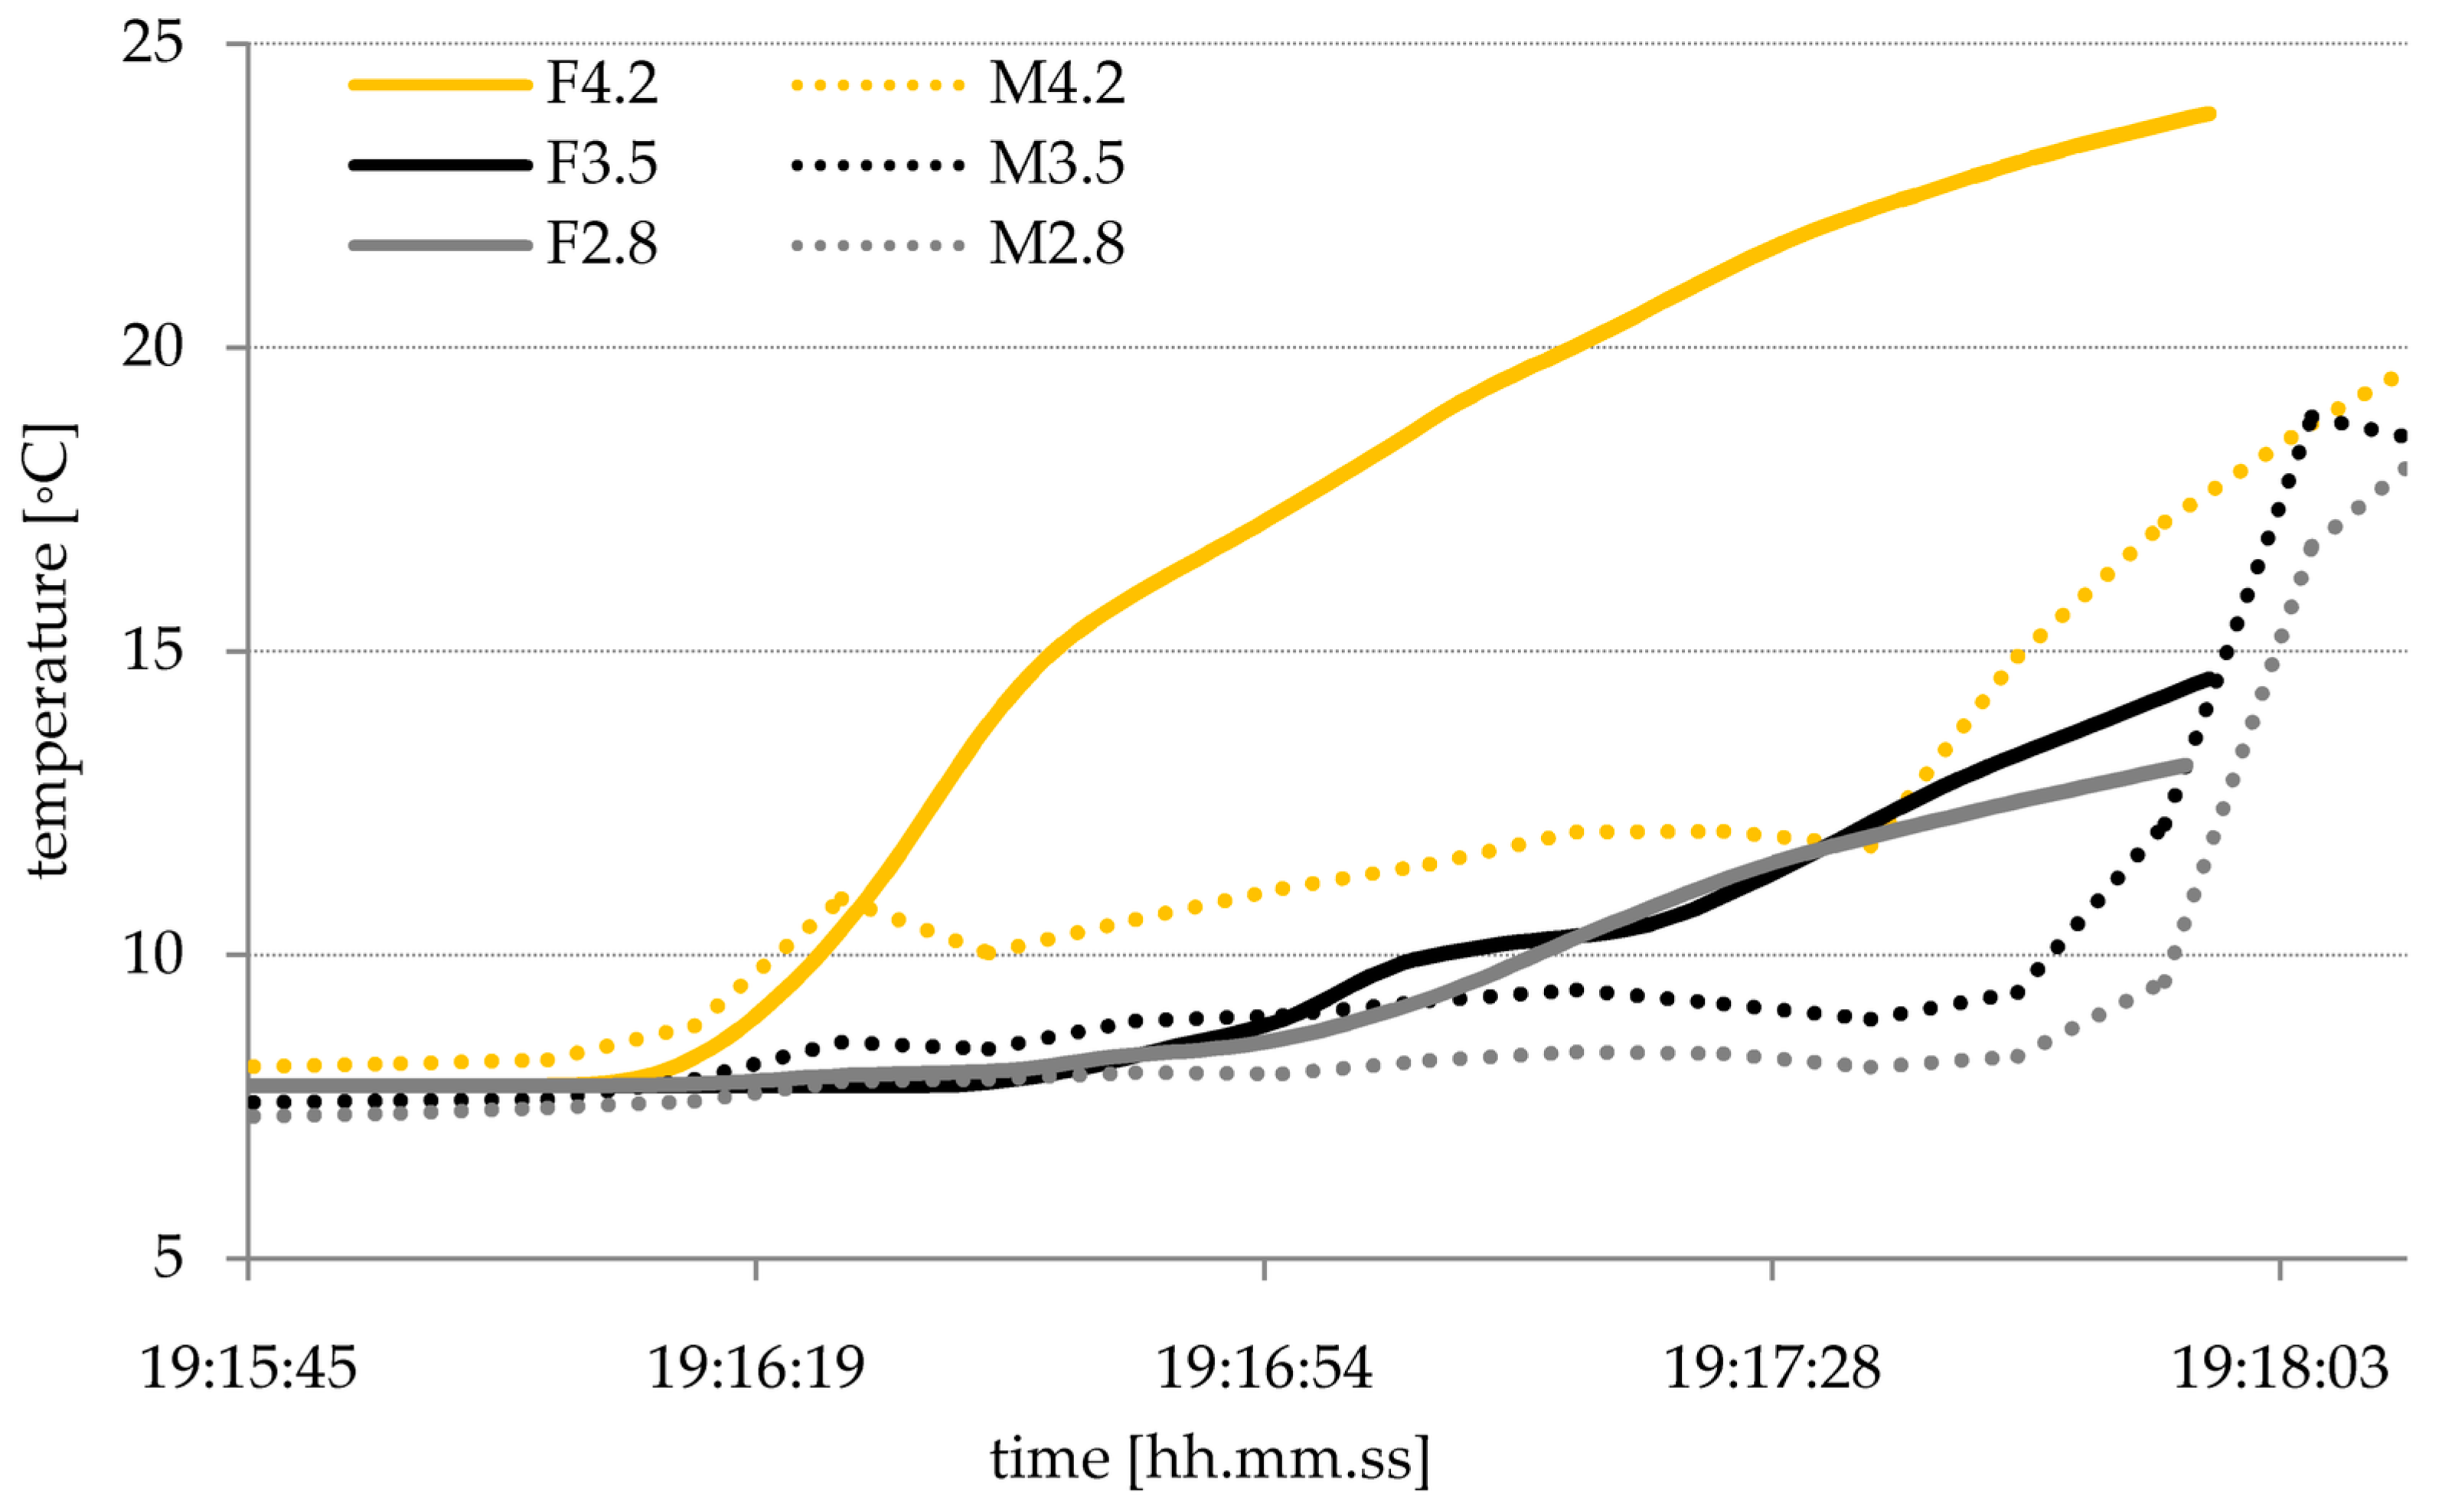
The main aim of numerical analyzes was to reproduce the temperature distribution. Figure 10 and Figure 11 show the comparison of the measured temperatures with the calculated ones (the experimental data are the same as in Figure 7 and Figure 8). The period of first 180 s of hot smoke test was taken into account. It was because, in this period, the fire developed in an undisturbed way (after then the fans were switched on manually to check the efficiency of smoke removal system).
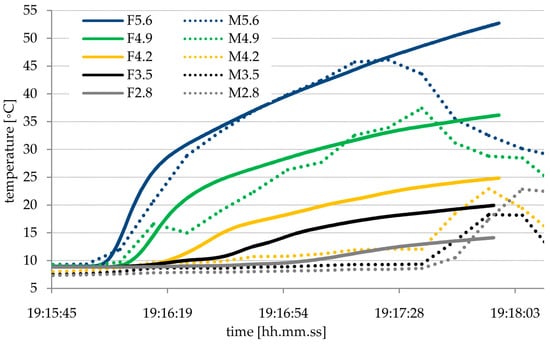
Figure 10.
Temperature increase on windward at 5 m from the last tray. Prefix M denotes measurement, prefix F denotes Fluent calculation.
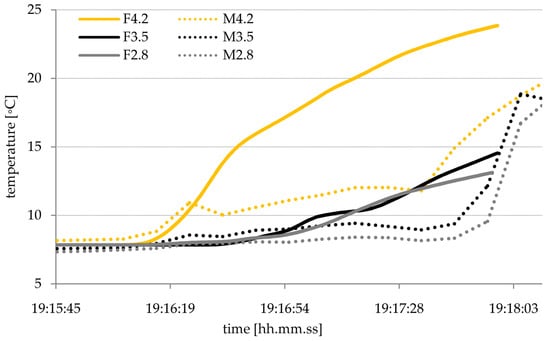
Figure 11.
Temperature increase on windward at 10 m from the last tray. Prefix M denotes measurement, prefix F denotes Fluent calculation.
As it can be seen the results of numerical analyses agree with the measurements, at least qualitatively. The temperature distribution and its variability in time are almost fully reproduced just under tunnel ceiling in close vicinity of the fire. It especially concerns the values of temperature measured by thermocouples that are mounted on the stand-pole at the distance of 5 m from the last tray at the heights of 4.9 m and 5.6 m. It can be explained while taking into account the fact that the buoyancy forces are significant there due to high temperature, so this portion of air is not susceptible to accidental gusts. Especially, data shown in Figure 11 cannot be regarded as satisfactory, but it is an effect of turbulent nature of airflow in tunnels. Just the average velocity that was recorded by FLSE200H gauge was adopted in the numerical model. Obviously, it would be potentially possible to take into account the momentary air velocity at many points if they were recorded. But, it would make the experiment much more complex, and what is more, the results would not be much more useful for the prediction of average conditions in the tunnel.
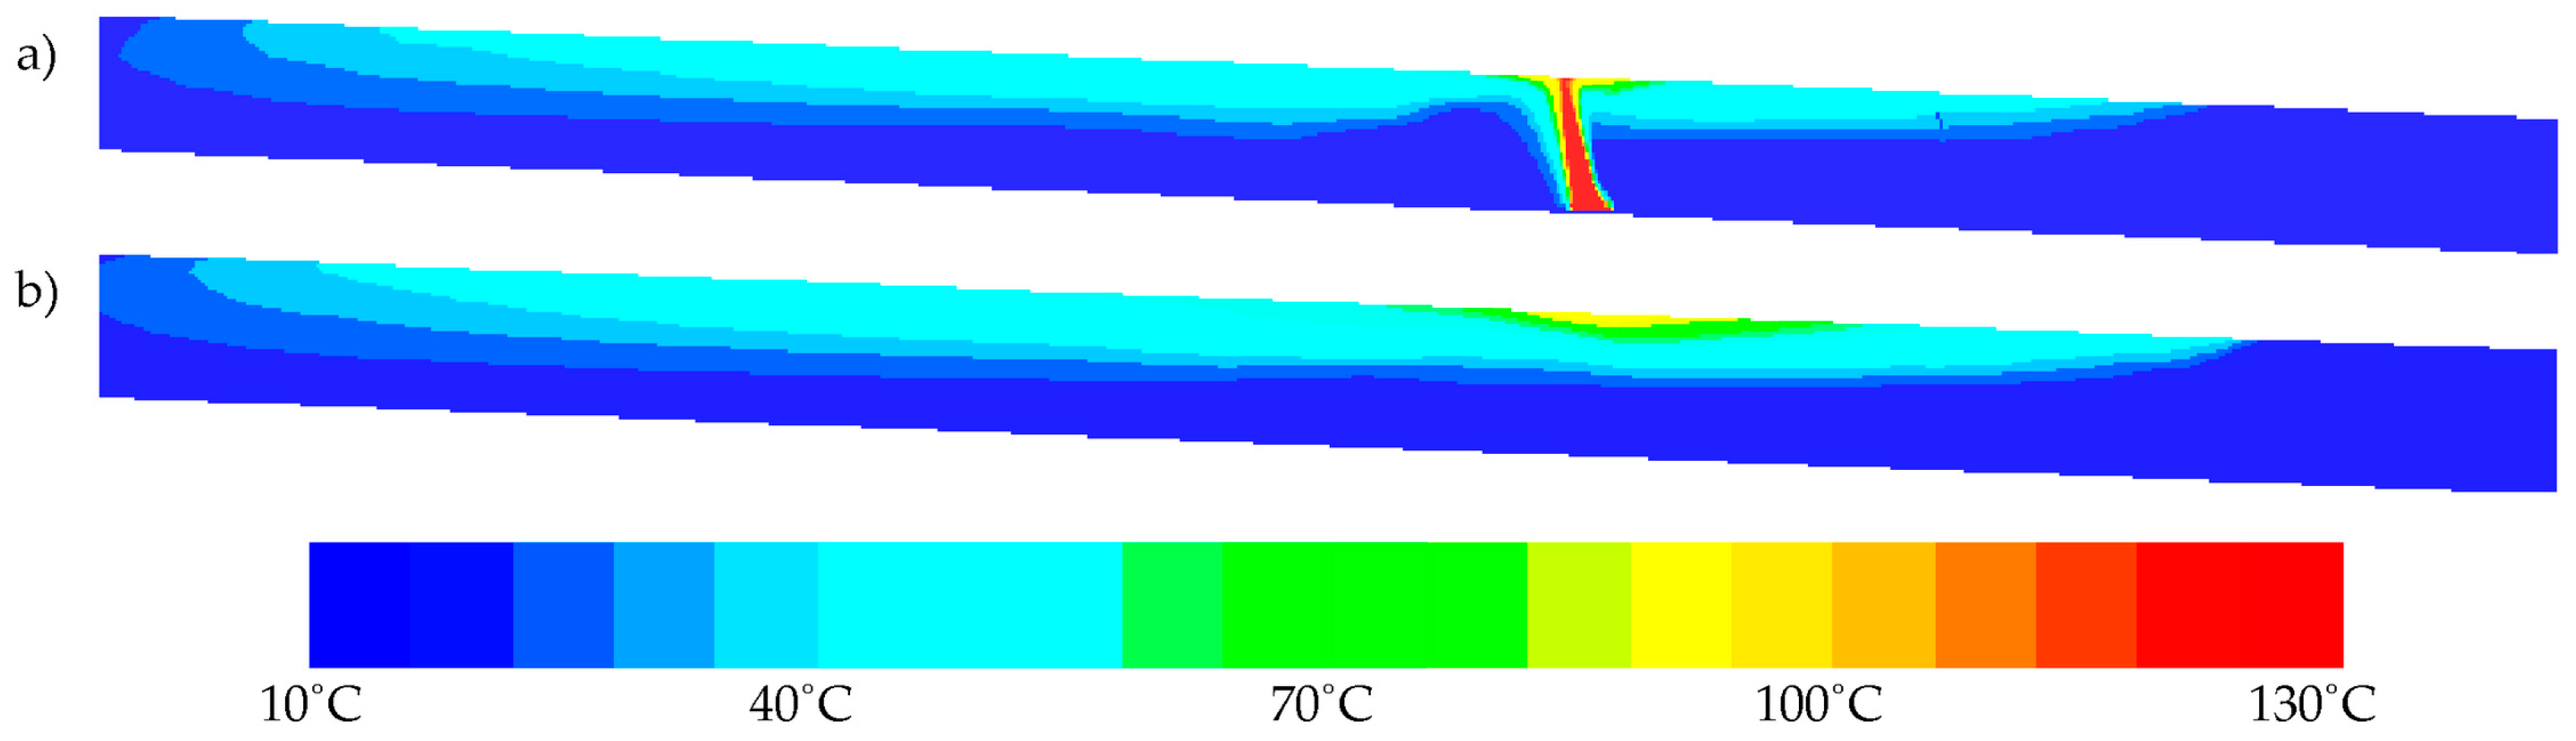
Figure 12 shows the calculated temperature distributions in 160 s after the fire outbreak for two tunnel longitudinal cross-sections. The length of the shown tunnel zone is about 114 m.
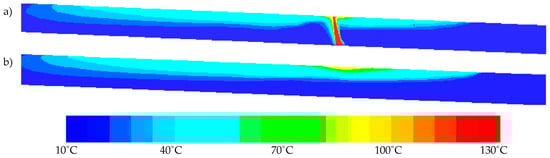
Figure 12.
Temperature distributions in 160 s of fire development: (a) at a plane of fire source, (b) at the tunnel symmetry plane.
According to the expectations, the gases moved towards the N portal because of the natural draught and the tunnel inclination. However, despite the relatively low fire power a portion of hot gases was able to move backward, what caused the measured temperature increase on windward. The extent of this backward movement of hot gases was estimated as about 20 m.
Figure 13 shows the calculated temperature distributions at the same time moment for two perpendicular tunnel cross-sections, which were located on both sides of fire source at a distance of 5 m. Worth noting, is the fact that the point of the maximum temperature at the tunnel ceiling is not located just above the fire, but rather is shifted to the other side. This observation can be explained taking into account the velocity distribution shown in Figure 14.
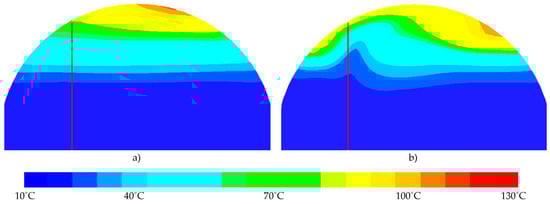
Figure 13.
Temperature distributions in 160 s of fire development at two perpendicular cross-sections at a distance of 5 m from fire source: (a) on windward, (b) on leeward. The plane of fire source is marked by the red line
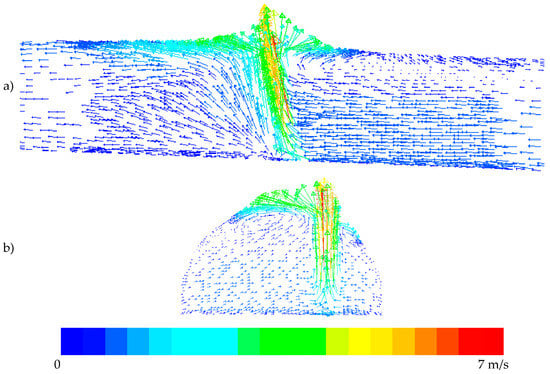
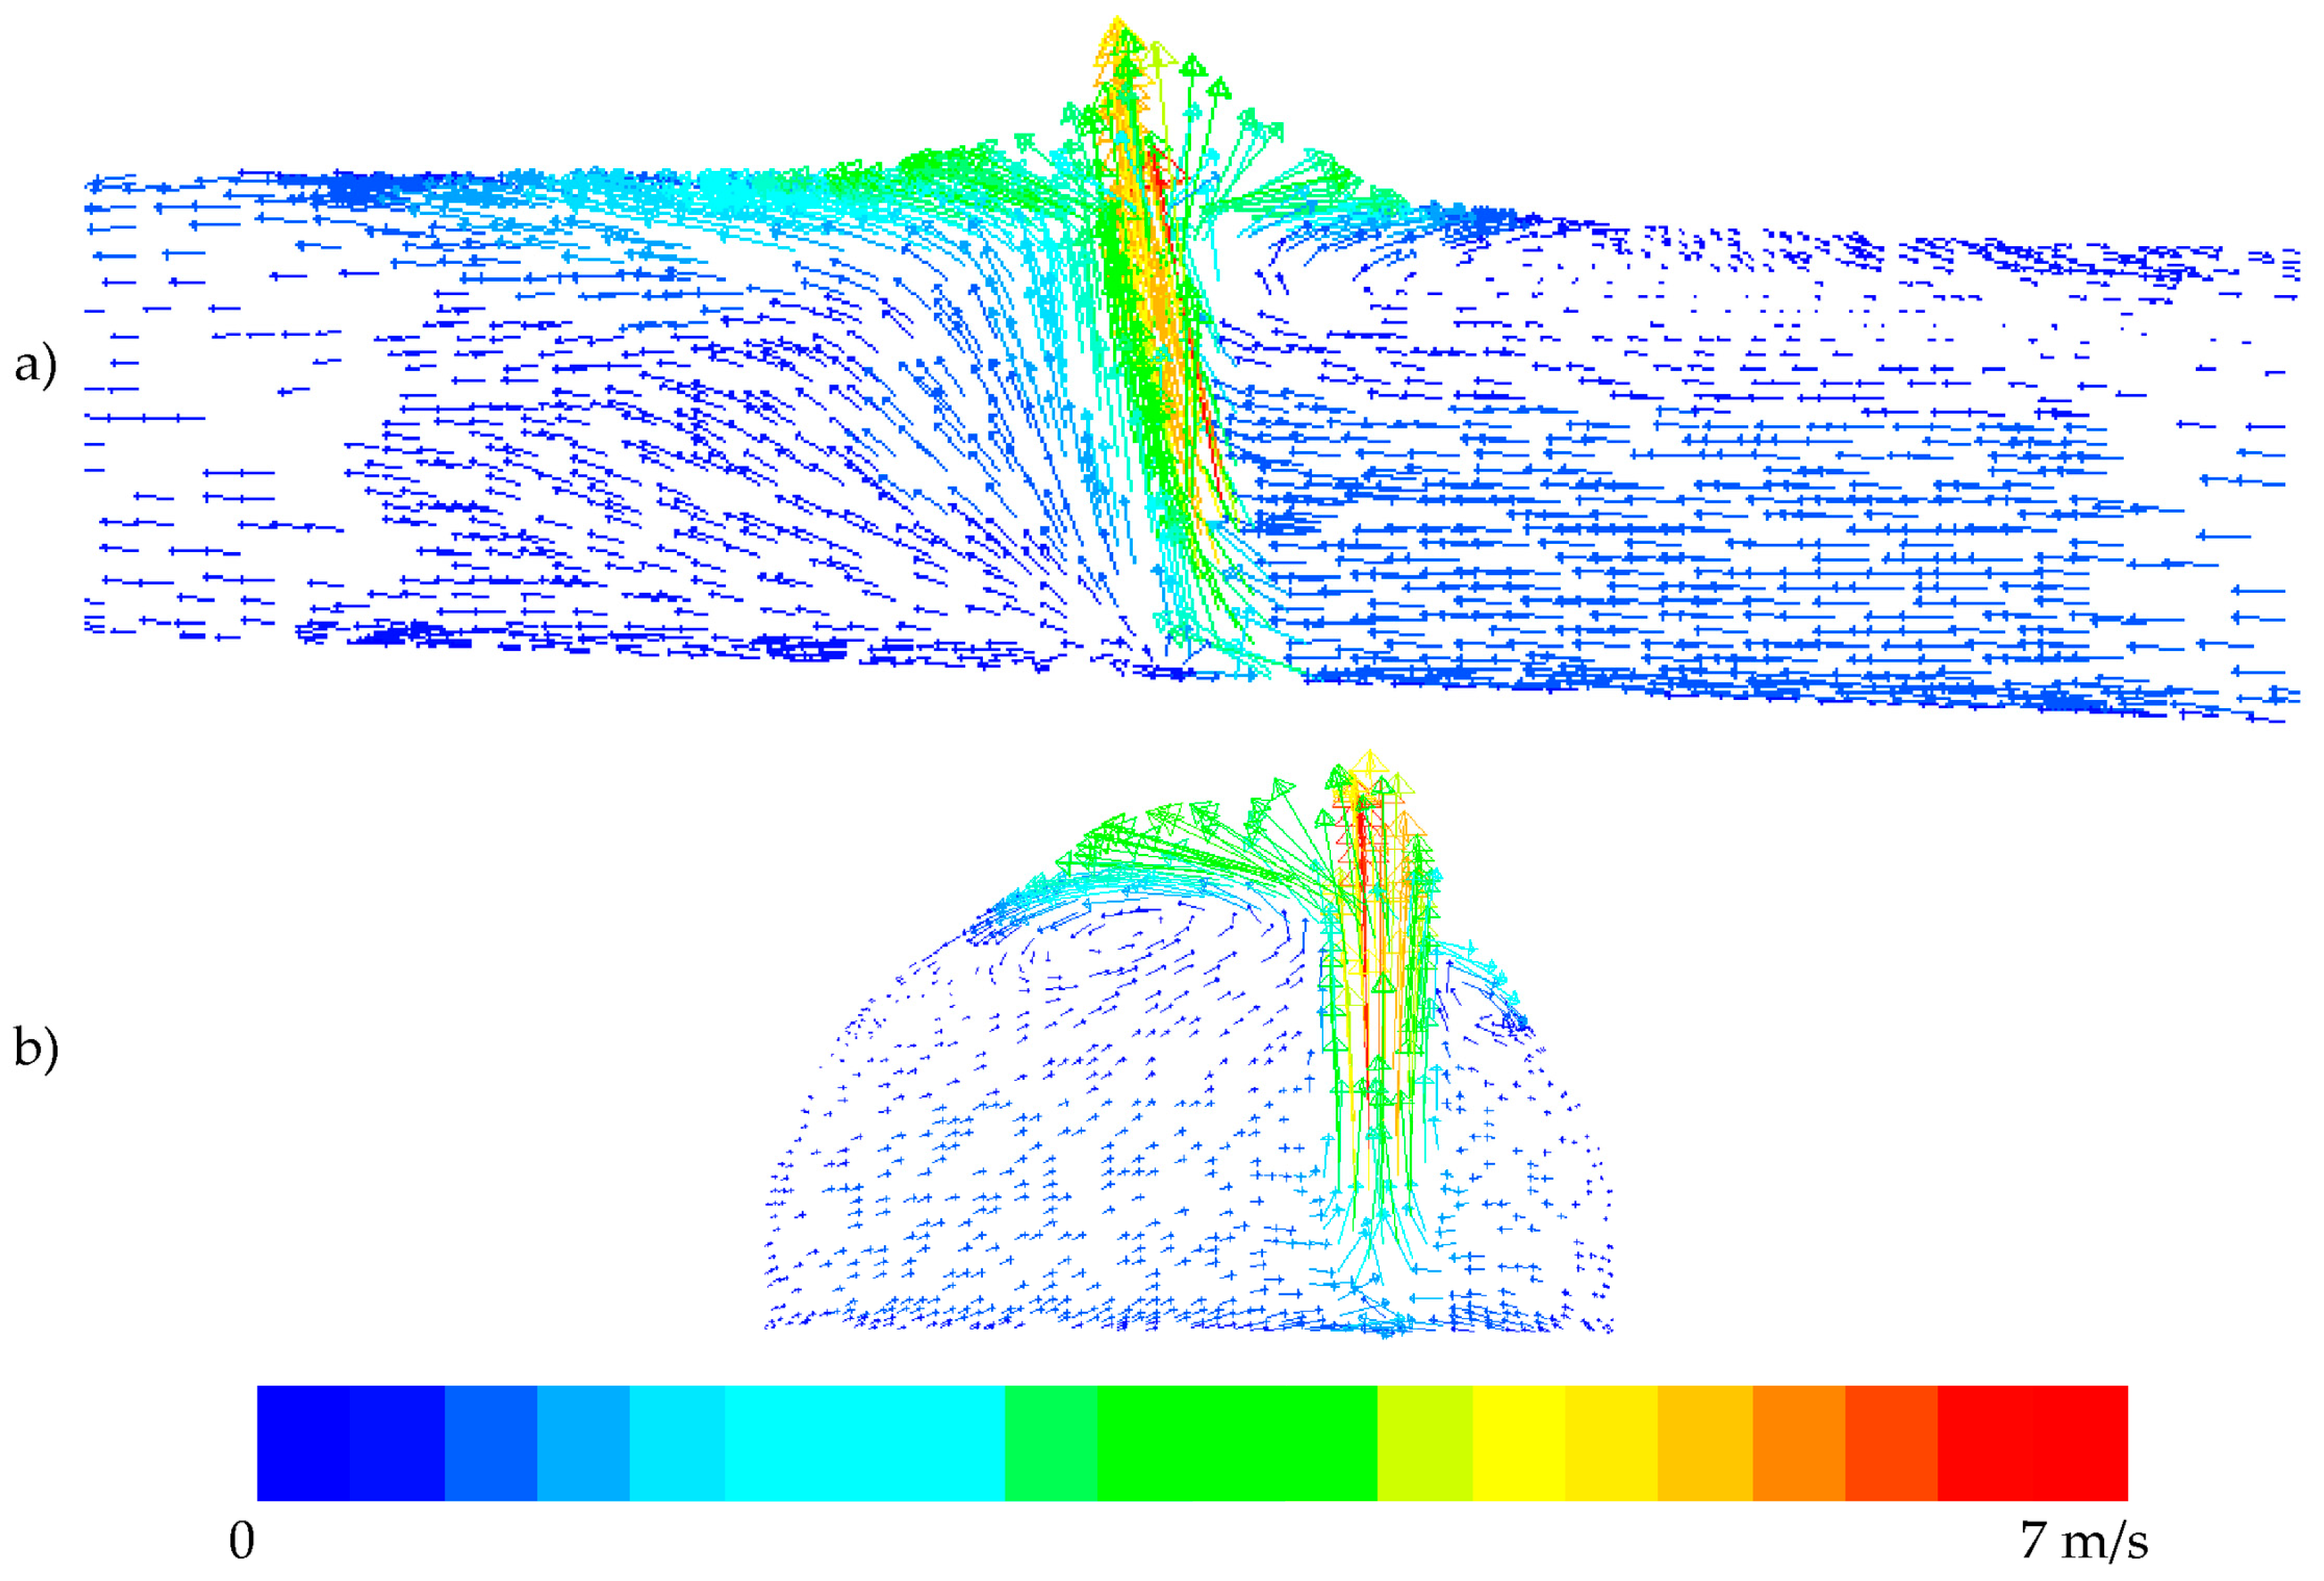
Figure 14.
Visualization of velocity vectors in 160 s of fire development at two planes: (a) at the plane of fire source, (b) on a perpendicular cross-section at the leeward edge of trays.
As it can be observed the convective plume is slanted due to the natural draught. When the hot gases reached the ceiling, they spread to both sides and flowed downward due to the vault shape of the ceiling. Then, the downward movement was stopped by the buoyancy. It caused the accumulation of the hot gases at a distance beneath the ceiling. Additionally, the results of calculations showed that the fire caused the increase of the average longitudinal air velocity in the tunnel from about 0.60 m/s to 0.66 m/s.
In last step of the numerical analyses, the validated model was applied to examine conditions inside the tunnel in a case of fully developed car fire. The 4000 kW HRR was assumed [26] and calculations were carried out in steady mode. The results are presented in Figure 15.
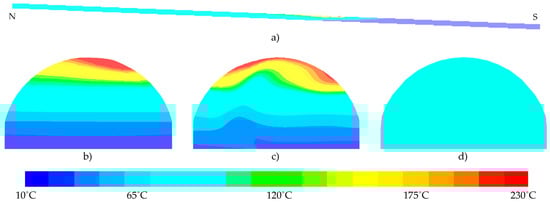
Figure 15.
Temperature distributions for fully developed car fire at entire tunnel symmetry plane (a), two cross-sections at a distance of 5 m from fire source: (b) on windward, (c) on leeward and (d) on N portal.
The most important observation is that the whole leeward side of the tunnel is filled with hot gases of temperature about 70–100 °C. It is a deadly threat to people in this zone. What is more, so hot gases (90 °C) flow out from N portal. The released energy intensified the average airflow in the tunnel, increasing the velocity to 0.84 m/s. Such conditions are expected to emerge after about ten minutes of fire development.
6. Discussion and Conclusions
The described studies and tests allowed for a better understanding of phenomena thatoccurred in tunnels in a case of fire. Obviously, the hot smoke tests and the measurements were limited by the fact that they were carried out during the temporarily traffic shutdown in the real tunnel (commonly in a normal operation). Furthermore, the maximum fire HRR was limited to 1500 kW, meanwhile according to British Standard [26] the heat flux of typical passenger car burning is 400 kW/m2 and the area of fire is approximately 10 m2, what gives 4000 kW for a fully developed fire. The average time of fire increase is about 10 min, but it varies in very wide range: between 5 and 15 min, according to experiments [27]. Furthermore, the value of HRR for a truck in fire can reach up to 30,000 kW. However, as was mentioned in the Introduction section, the special attention must be paid to the initial phase of a fire development. This phase and the time factor are crucial in taking into account the possibility of evacuation of threatened people. In the initial phase of a fire, the most dangerous factor is not the high temperature, but the toxic smoke. However, the temperature distribution influences the airflow, so it determines indirectly the safety conditions in a tunnel. Thus, studies on low power fires that have just started to develop are very important because their results allow for assessing the conditions in a tunnel and the operation of live-saving systems. It was exactly the result of the first described test, which revealed the wrong operation of fire detection system. The solution suggested here is to replace or tune the fibro-laser sensor. It should trigger the fire alarm first of all when detecting a fast temperature jump instead of waiting for a significant increase of temperature value (as was mentioned the ceiling temperature did not exceed 20 °C). It should prevent an improper activation of visibility sensor by the spreading smoke.
The uniqueness of presented research stems from the fact that all the experiments were carried out in real road tunnel, not in a laboratory. On the other side, the results were burdened with disturbances that were impossible to avoid in such real world conditions.
The numerical analyses are nowadays willingly applied method of examining the operation of fire ventilation systems in tunnels. It is because the real tests are difficult to carry out. However, one should have in mind that numerical models without validation are not quite reliable. Despite the fact that the presented experiment was only a simulation of a real fire, it gave a number of measured data, which were utilized for validation of numerical model. The presented results show that the model is validated correctly. Fire mapping in the numerical model seems to be accurate. The accordance of measured and the calculated temperatures at a higher distance from the fire source looks worse, but the differences does not change the overall view of the situation. As was mentioned in the results description, such discrepancies resulted from turbulent nature of air flows in tunnels. It is almost impossible to take into account the momentary features of air flows. Additionally, it would not significantly improve the prediction ability of the model. The numerical model that was validated by experimental data can be responsibly applied for further research on any fire configuration. As an example the conditions inside the tunnel in a case of fully developed car fire were examined. The results are clear—the whole leeward side of the tunnel was filled by hot gases, which were deadly threat for people who got stuck in this zone.
The authors are aware of the imperfections afflicting the described experiments. The lessons learned will allow for better preparing successive works, which are planned in the near future.
Acknowledgments
The authors would like to thank the General Directorate for National Roads and Motorways (Katowice Division) and the Headquarters of the State Fire Service in Katowice for the opportunity of conducting the research and for the management support provided. We would also like to thank the Smay Company and the Ardor Company for the technical support.
Publication supported as a part of the Rector’s grant in the area of scientific research and development works. Silesian University of Technology, grant number 12/050/RGJ18/0065-01.
Author Contributions
Aleksander Król participated in the preparation of the research and took part in the research in the tunnel. He built a numerical model and carried out the numerical analyses. He participated in the writing of the article. Małgorzata Król took part in the planning and preparation of the research in the tunnel. She supervised the research and worked out the recorded data. She participated in the writing of the article.
Conflicts of Interest
The authors declare no conflict of interest. The founding sponsors had no role in the design of the study; in the collection, analyses, or interpretation of data; in the writing of the manuscript, and in the decision to publish the results.
References
- National Fire Protection Association. NFPA 502. Standard for Road Tunnels, Bridges, and Other Limited Access Highways; National Fire Protection Association: Quincy, MA, USA, 2011. [Google Scholar]
- Klote, J.H.; Milke, J.A.; Turnbull, P.G.; Kashef, A.; Ferreira, M.J. Handbook of Smoke Control Engineering; ASHRAE: Atlanta, GA, USA, 2012; ISBN 978-1-936504-24-4. [Google Scholar]
- Tang, F.; Li, L.J.; Mei, F.Z.; Dong, M.S. Thermal smoke back-layering flow length with ceiling extraction at upstream side of fire source in a longitudinal ventilated tunnel. Appl. Therm. Eng. 2016, 106, 125–130. [Google Scholar] [CrossRef]
- Gannouni, S.; Maad, R.B. Numerical analysis of smoke dispersion against the wind in a tunnel fire. J. Wind Eng. Ind. Aerodyn. 2016, 158, 61–68. [Google Scholar] [CrossRef]
- Wang, F.; Wang, M. A computational study on effects of fire location on smoke movement in a road tunnel. Tunn. Undergr. Space Technol. 2016, 51, 405–413. [Google Scholar] [CrossRef]
- Wang, F.; Wang, M.; Carvel, R.; Wanga, Y. Numerical study on fire smoke movement and control in curved road tunnels. Tunn. Undergr. Space Technol. 2017, 67, 1–7. [Google Scholar] [CrossRef]
- Yao, Y.; Cheng, X.; Zhang, S.; Zhu, K.; Shi, L.; Zhang, H. Smoke back-layering flow length in longitudinal ventilated tunnel fires with vertical shaft in the upstream. Appl. Therm. Eng. 2016, 107, 738–746. [Google Scholar] [CrossRef]
- Musto, M.; Rotondo, G. Numerical comparison of performance between traditional and alternative jet fans in tiled tunnel in emergency ventilation. Tunn. Undergr. Space Technol. 2014, 42, 52–58. [Google Scholar] [CrossRef]
- Chow, W.K.; Gao, Y.; Zhao, J.H.; Dang, J.F.; Chow, C.L.; Miao, L. Smoke movement in tilted tunnel fires with longitudinal ventilation. Fire Saf. J. 2015, 75, 14–22. [Google Scholar] [CrossRef]
- Lin, P.; Lo, S.M.; Li, T. Numerical study on the impact of gradient on semi-transverse smoke control system in tunnel. Tunn. Undergr. Space Technol. 2014, 44, 68–79. [Google Scholar] [CrossRef]
- Król, M.; Król, A.; Koper, P.; Wrona, P. Full scale measurements of the operation of fire ventilation in a road tunnel. Tunn. Undergr. Space Technol. 2017, 70, 204–213. [Google Scholar] [CrossRef]
- Wang, Y.F.; Sun, X.F.; Li, B.; Qin, T.; Liu, S.; Liu, Y. Small-scale experimental and theoretical analysis on maximum temperature beneath ceiling in tunnel fire with vertical shafts. Appl. Therm. Eng. 2017, 114, 537–544. [Google Scholar] [CrossRef]
- Mei, F.; Tang, F.; Ling, X.; Yu, J. Evolution characteristics of fire smoke layer thickness in a mechanical ventilation tunnel with multiple point extraction. Appl. Therm. Eng. 2017, 111, 248–256. [Google Scholar] [CrossRef]
- Tanaka, F.; Kawabata, N.; Ura, F. Effects of a transverse external wind on natural ventilation during fires in shallow urban road tunnels with roof openings. Fire Saf. J. 2016, 79, 20–36. [Google Scholar] [CrossRef]
- Kashef, A.; Yuan, Z.; Lei, B. Ceiling temperature distribution and smoke diffusion in tunnel fires with natural ventilation. Fire Saf. J. 2013, 62, 249–255. [Google Scholar] [CrossRef]
- Eftekharian, E.; Dastan, A.; Abouali, O.; Meigolinedjad, J.; Ahmadi, G. A numerical investigation into the performance of two types of jet fans in ventilation of an urban tunnel under traffic jam condition. Tunn. Undergr. Space Technol. 2014, 44, 56–67. [Google Scholar] [CrossRef]
- Guo, X.; Zhang, Q. Analytical solution, experimental data and CFD simulation for longitudinal tunnel fire ventilation. Tunn. Undergr. Space Technol. 2014, 42, 307–313. [Google Scholar] [CrossRef]
- Wang, F.; Wang, M.; Wanga, Q. Numerical study of effects of deflected angles of jet fans on the normal ventilation in a curved tunnel. Tunn. Undergr. Space Technol. 2012, 31, 80–85. [Google Scholar] [CrossRef]
- Cascetta, F.; Musto, M.; Rotondo, G. Innovative experimental reduced scale model of road tunnel equipped with realistic longitudinal ventilation system. Tunn. Undergr. Space Technol. 2016, 52, 85–98. [Google Scholar] [CrossRef]
- Dziurzyński, W.; Krach, A.; Pałka, T. Airflow Sensitivity Assessment Based on Underground Mine Ventilation Systems Modeling. Energies 2017, 10, 1451. [Google Scholar] [CrossRef]
- Chow, W.K.; Dang, J.F.; Gao, Y.; Chow, C.L. Dependence of flame height of internal fire whirl in a vertical shaft on fuel burning rate in pool fire. Appl. Therm. Eng. 2017, 121, 712–720. [Google Scholar] [CrossRef]
- Węgrzyński, W. Transient characteristic of the flow of heat and mass in a fire as the basis for optimized solution for smoke exhaust. Int. J. Heat Mass Transf. 2017, 114, 483–500. [Google Scholar] [CrossRef]
- Węgrzyński, W.; Krajewski, G. Influence of wind on natural smoke and heat exhaust system performance in fire conditions. J. Wind Eng. Ind. Aerodyn. 2017, 164, 44–53. [Google Scholar] [CrossRef]
- Australian Standard Smoke Management Systems—Hot Smoke Test; AS 4391-1999; Standards Australia: Sydney, Australia, 1999.
- Ansys Fluent Tutorial Guide; Ansys Inc.: Canonsburg, PA, USA, 2009.
- Components for Smoke and Heat Control Systems. Part 4: Functional Recommendations and Calculation Methods for Smoke and Heat Exhaust Ventilation Systems, Employing Steady-State Design Fires—Code of Practice; BS 7346-4; BSI Group: London, UK, 2003.
- Jannsens, M. Development of a Database of Full-Scale Calorimeter Tests of Motor Vehicle Burns, Southwest Research Institute; Fire Technology Department, Southwest Research Institute: San Antonio, TX, USA, 2008. [Google Scholar]


© 2018 by the authors. Licensee MDPI, Basel, Switzerland. This article is an open access article distributed under the terms and conditions of the Creative Commons Attribution (CC BY) license (http://creativecommons.org/licenses/by/4.0/).