Abstract
Producing energy with biomass feedstocks as a renewable energy source can contribute to the mitigation of climate change through direct CO2 sequestration and higher CO2-emitting fuel replacement. Here, the correct location of a biomass power facility can be considered as a critical position due to their geographical and spatial characteristic. This research presents a novel approach involving a geographic information system (GIS) location and its integration scenario analysis with the consideration of biomass feedstocks and climate change in agroforestry systems, the agro-silvo-pastoral system (ASPS), of a Spanish case study. A combined participatory operative approach, that is, fuzzy-decision-making trial and evaluation laboratory (F-DEMATEL) with simple additive weighting (SAW) and sensitivity analysis in various disciplines and criteria, is applied by professionals. In particular, an analysis of five biomass power facilities in the area assessed by the methodology found that only one facility (BPF4) is located in the suitable area. Among five integration scenarios (A to E) as the likelihood test by the stakeholders, scenario E (suitability layer) was most supported—that is, it was selected as the most suitability map—while scenario D (general geophysical layer) was least supported, in that the results encapsulated foreseeable problems derived from the effects. Hence, the validation of the methodology proposed can be employed as a decision-making tool to support proper sustainable planning and development of a biomass power facility under the impact of climate change.
1. Introduction
With the goals of the Paris Agreement on climate change and of the United Nations on sustainable development and planning, bioenergy management and planning is anticipated to gradually contribute and subsidize the following: bioenergy, biofuel, and biochemicals in various forms and procedures can considerably enhance the generation of clean energy through co-generation and/or hybrid energy systems [1,2,3]. Climate change is a substantial force to various environmental, economic, and social aspects, which are closely connected to human growth, development, expansion, and consumption forms [4]. Additionally, the levels of greenhouse gas (GHG) can be stabilized as decarbonizing electricity generation in the world is key [5,6,7]. Producing energy with biomass feedstocks as a renewable energy source can contribute to the mitigation of climate change through direct CO2 sequestration and higher CO2-emitting fuels replacement [8,9,10]. The use of biomass in the form of bagasse and residues in agricultural land and forestry is widespread both spatially and geographically such that these materials produce electricity (280 TWh) globally, which is the 1.5% of the total world electricity production per year [11]. In future world power sources, generating energy from biomass feedstocks and materials will play an important role and have many advantages, dedicated energy crops and residues on agricultural land and forestry for the parallel environment together with energy promotion goals and strategies [12,13].
Because of their geographical and spatial characteristics and features, biomass power facilities are required to be located correctly at various governmental levels as a critical concern and under the recommendations of numerous researchers [14,15,16,17,18,19]. This significant concern has shaped a new renewable energy and bioenergy market to use biomass feedstocks and resources [20,21]. With the requirement of optimal biomass power facility locations, a renewable energy policy framework has been conceived by the European Union (EU) based on Directive 2009/28/EC until 2020 [22]. Each EU member country gets support from the Directive to develop and mature its own goal and strategy for renewable energy for the period 2011–2020 [23]. In the case of Spain, the government focuses more on long-term sustainability with a low carbon economy and without using the former feed-in-tariff (FIT), which is a payment of electricity through not contributing to the depletion of natural resources [24]. In particular, the Bioenergy Plan 2015–2020 in Extremadura province contains a major key working axis of smart concentration and adaptation in the sector of renewable energy development and planning [25]. Hence, an important tool for biomass and its plant location optimization process, the geographic information system (GIS), can be applied regardless of methods used, and can examine its location in depth to investigate large volumes of data in a map format [26,27].
Collaborative approaches of participatory spatial planning (PSP) consider different methods as gaining confidence and spreading various levels in an operational term [21,28,29]. With multi-criteria decision analysis (MCDA), the state of current matters and the notion of future settings can be distinguished and solved by decision-makers in terms of PSP and energy management and planning, which is a convoluted process that demands knowledge from diverse disciplines and situations [29,30]. Here, the analytic hierarchy process (AHP) is an effective technique, together with the pairwise comparison method (PCM), to extract the relative importance values and devise the evaluation scheme in the decision-making process [31]. Simple additive weighting (SAW) is a relatively logical and analytical method that is also easy-to-use and can be employed with MCDA in various conditions and situations [32]. Thus, the fuzzy-decision-making trial and evaluation laboratory (F-DEMATEL) forms a physical/structural procedure for the calculation of the criteria and their weights [33]. This inserts a converted worth to the evaluation of problems existing and betrothed in the optimization of biomass power facility locations. Hence, the F-DEMATEL and GIS-MCDA are an assessment step of the energy spatial decision support system (ESDSS) under climate change issues. Furthermore, it obtains a final result in policy decisions for renewable energy management and long-term sustainability [26,34].
The present study describes a novel method to analyze the location and integration scenario of biomass power facilities under the consideration of biomass feedstocks and climate change. The detailed criteria in the context of European, national, and regional strategies and policies were selected by professionals and processed by a detailed analytical procedure, based on a participatory operative multi-criteria F-DEMATEL and GIS-MCDA method. A Spanish case study area of agro-silvo-pastoral system (ASPS) as agroforestry systems was used as the area has abundant agriculture and forest resources and higher vulnerability to climate change. Then, a sensitivity analysis was tested against the suitability map of the criteria and their connected weights of the SAW. With five biomass power facilities assessed by the methodology, five integration scenarios were analyzed through the likelihood test by the stakeholders. The proposed framework is described with a case study, which is discussed along with the methods applied in this study, in Section 2. Section 3 and Section 4 describe the results and discussion, and the conclusions, respectively, from this approach.
2. Materials and Methods
To analyze a biomass power facility location and its integration scenarios under biomass feedstock and climate change, the proposed method is employed in a case study area of agroforestry systems in a long-term sustainability perspective. First, with the help of ArcGIS 10.3.1 ESRI software (ESRI Inc., Redlands, CA, USA) [35], the case study area was rasterized in certain grids (10 m by 10 m). Second, the criteria were selected by professionals to combine geospatial data. Third, the assessment framework was applied with F-DEMATEL and GIS-MCDA techniques. Fourth, the SAW and sensitivity analysis were reflected. Fifth and finally, the integration scenarios from the previous analyses considering five biomass power facilities were analyzed by the stakeholders.
2.1. Case Study Area Description
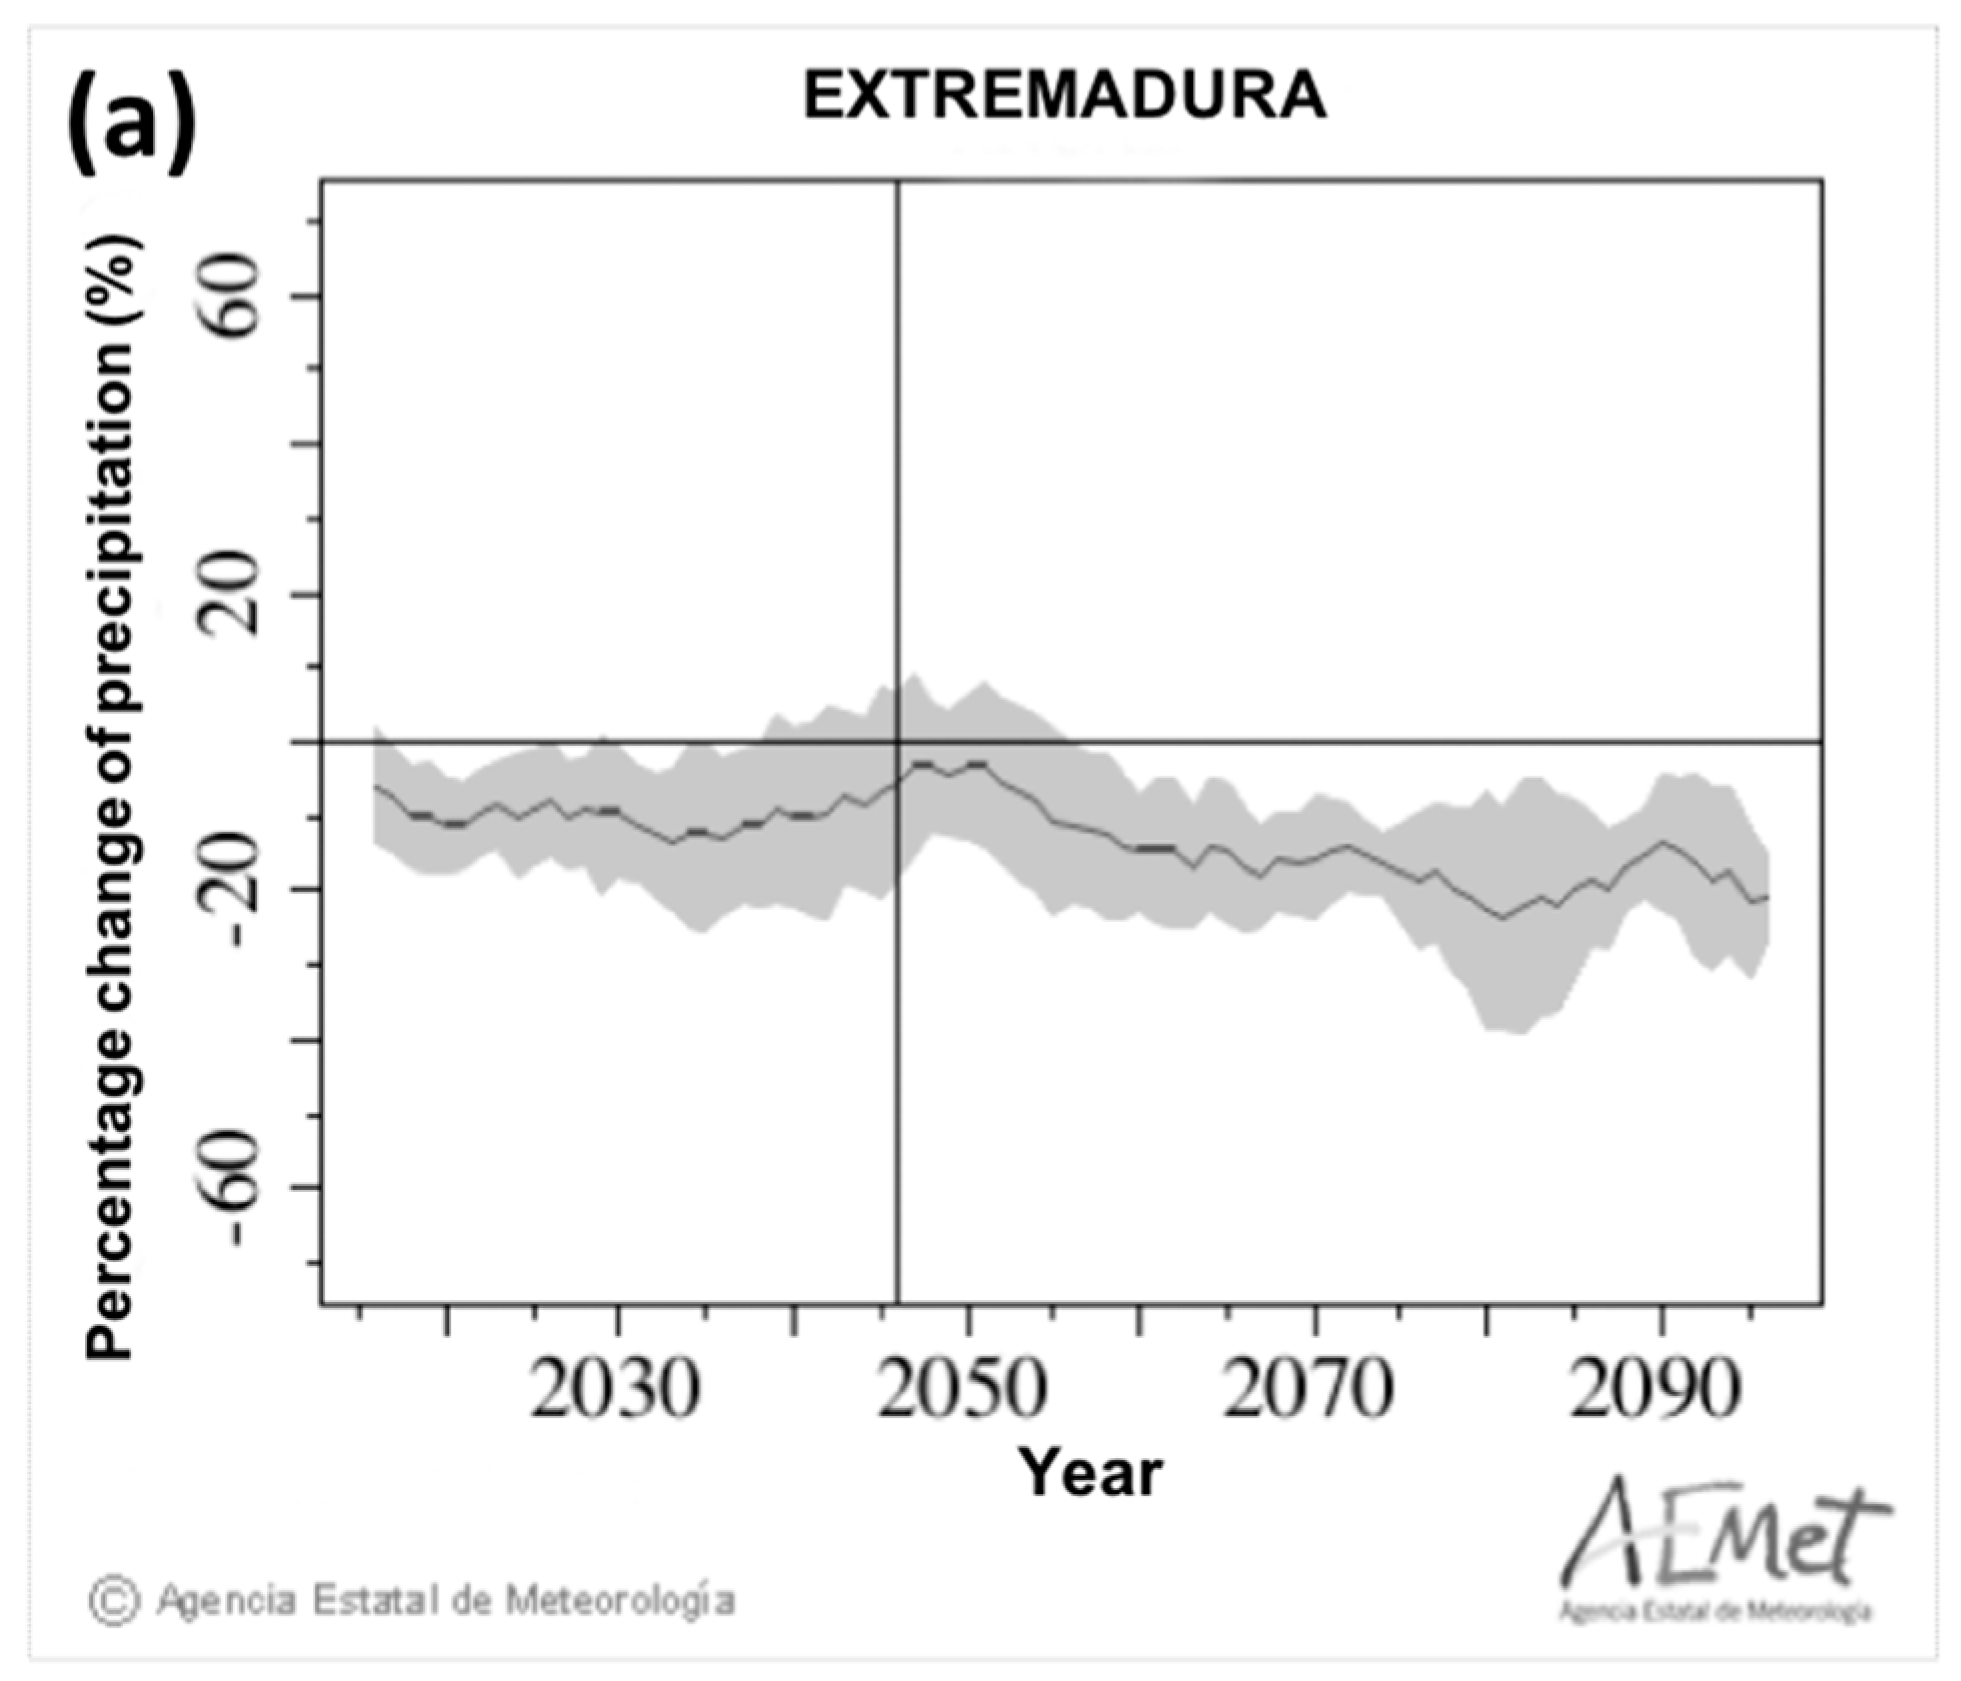
The proposed case study area consists of a multifunctional agroforestry system, ASPS. This system is the land-use scheme containing the connotation of deciduous forest (chestnut trees), wood modules with cattle and pre-existing agrarian activities. Thus, the case study area has extensive agro-forest resources as renewable/sustainable biomass feedstocks. In Table 1, it depicts the composition/distribution ratio of Extremadura province (Spain) [36]. Currently, a total 96% of biomass feedstocks are not used in this area to make the province’s fuel importation. Additionally, in Figure 1, climate conditions in the case study area are well-known by the base of high spatial and temporal variability in the indicated report [32,33]. Specifically, the case study area’s predicted average annual precipitation, based on information from 1940 to 2010 (average of 700–750 mm), demonstrates a decline of approximately −20% in total, which indicates over a long series that the impact of climate change could worsen [37]. In the case of predicted annual temperature, a further increase is indicated based on the information from the 1940 to 2010 period (average of 9–10 degrees) [38]. It is observed that the mean of both the maximum and minimum temperature increases by approximately 4 degrees in total by the end of the 21st century. To smear the established method, the case study area is chosen in particular, because more than 4 million tons of biomass raw materials in Extremadura province can be altered under climate change vulnerability and variability.

Table 1.
Territorial type distribution of Extremadura province, Spain [36].
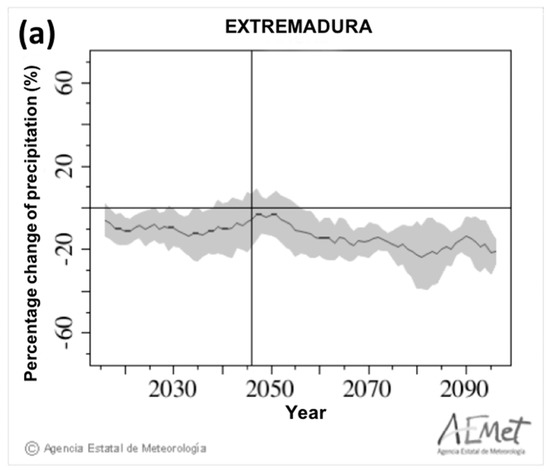
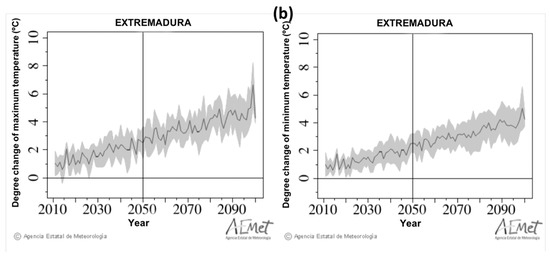
Figure 1.
Climate conditions. (a) Change modeling (%) of predicted precipitation in Extremadura and (b) change modeling (°C) of predicted maximum and minimum average temperature in Extremadura [37,38].
2.2. Participatory Multi-Criteria Method Description
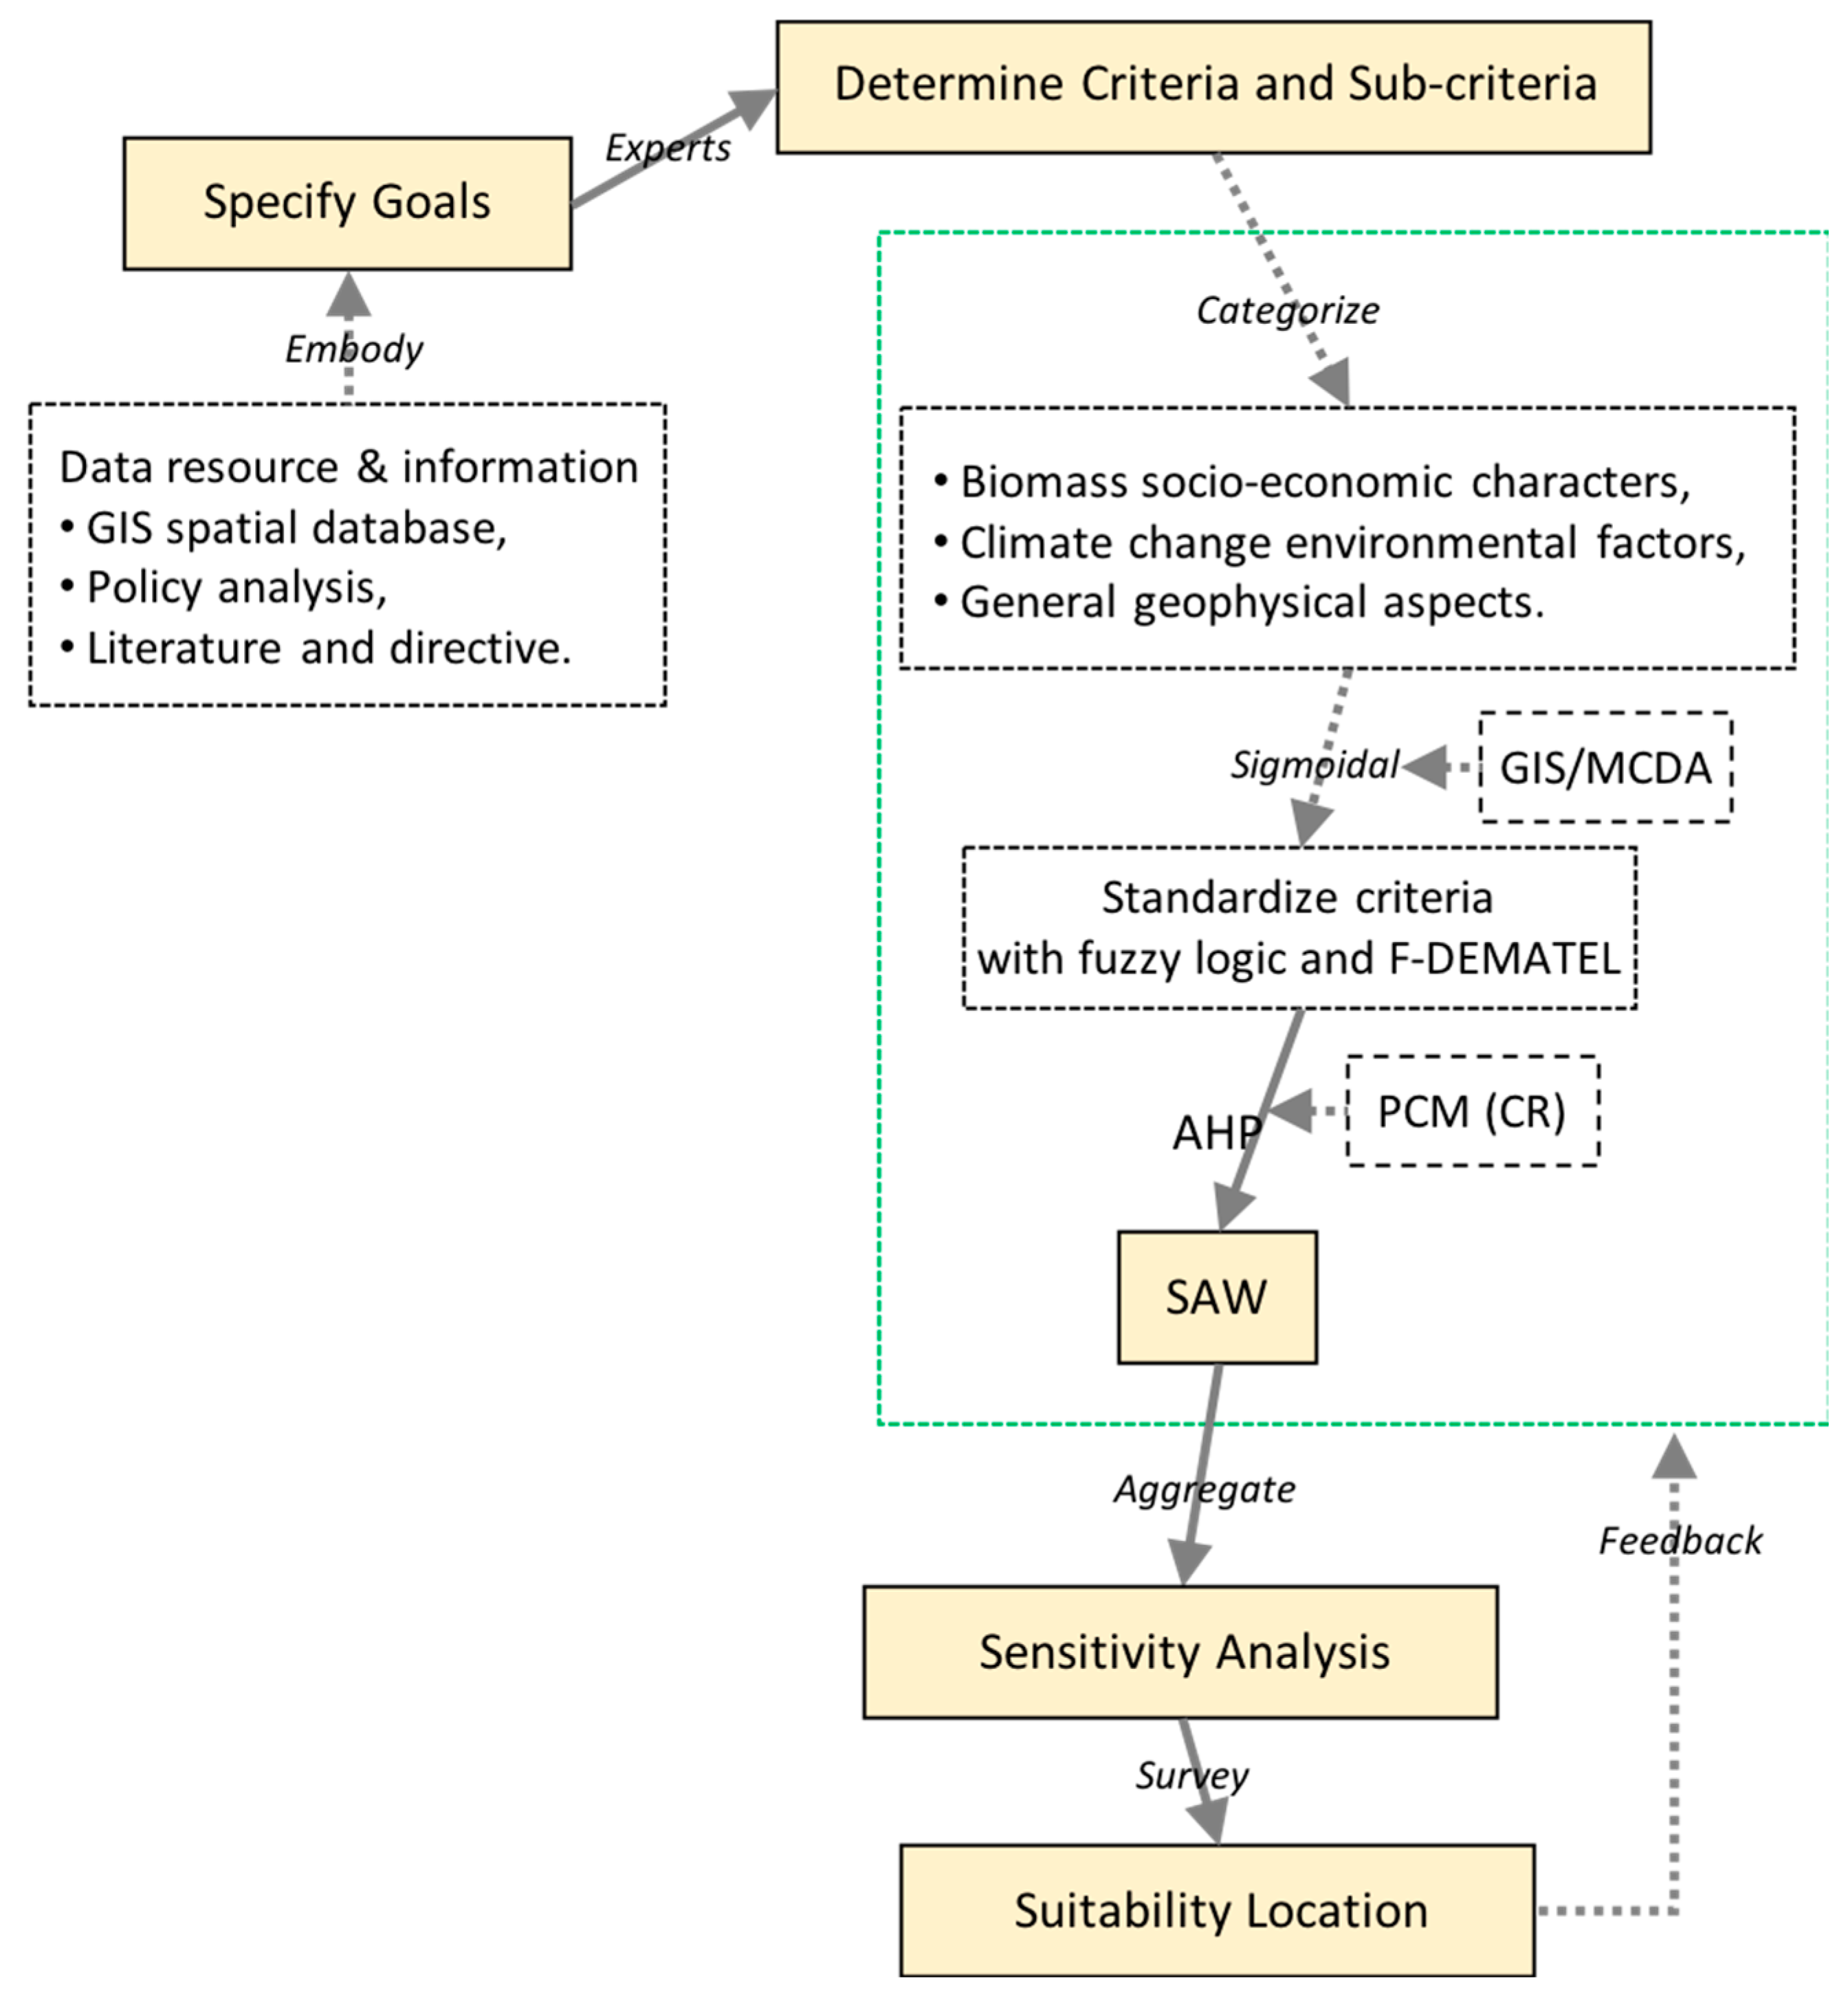
The criteria used for this study were determined and weighted by an expert panel, including professors, industrial mangers, policy makers, planners, and local authorities, who are involved with planning and policymaking on technical measures, and whose working field incorporated renewable energy together with environmental matters. These criteria are referenced from real data of the appropriate literature, regional and national polices, and EU directives [32]. The participatory multi-criteria method within a structured framework stipulates an apparent approach to catalog and analyze decision-making problems and supports the derivation of decision-making preferences (see Figure 2). In this study, extensive criteria and evaluation processes are organized into three main criteria involved in the computation procedure, as follows (see Table 2): first, biomass socio-economic criteria are (1) potential demand, (2) transport cost, (3) site access, and (4) economic area; second, climate change environmental criteria are (1) temperature, (2) precipitation, (3) biodiversity, and (4) hydrology; third, general geophysical criteria are (1) geology and soil, (2) orientation, (3) vegetation cover, and (4) visibility. Table 2 states a full interpretation of the criteria preferred for this study.

Figure 2.
Schematic flowchart for biomass power facilities’ location under biomass feedstock and climate change. GIS—geographic information system; MCDA—multi-criteria decision analysis; F-DEMATEL—fuzzy-decision-making trial and evaluation laboratory; PCM—pairwise comparison method; AHP—analytic hierarchy process; SAW—simple additive weighting; CR—consistency ratio.
Table 2.
Criteria and their description for the study designated.
To extract the criteria’s relative importance weights (selected and weighed by professionals), AHP and MCDA were utilized in the assessment system form for a detailed decision-making problem [31]. Additionally, PCM is used to postulate the hierarchical arrangement, to conclude the relative importance weights of the criteria and sub-criteria, and to allocate the relative weights of each alternative and the final mark. The PCM organization and design is significantly liable on the perceived importance of each criterion, which uses certain prearranged facts of scale (see Table 3) [39]. Here, the DEMATEL techniques and fuzzy sets are combined to judge crucial locations in planning for biomass power facilities under biomass feedstock and climate change. Hence, the relationship between the criteria and systematizing the criteria can be determined by the anticipated constructive method, according to the relationship severity type and its consequence on every criterion in Equation (1).
Table 3.
Pair-wise comparison of relative importance and numerical degrees [31,39].
Additionally, on the fuzziness condition, key profits are pliable in order to reflect the fuzziness situation and achieve the fuzzy unified DEMATEL [40]. According to these profits and benefits, the DEMATEL is utilized to choose the criteria in “cause and effect” and to realize the linguistics standard parameterized within the triangular fuzzy number (TFN). Particularly, in a fuzzy setting, the F-DEMATEL method for companies confronting difficulties and problems can be utilized to build group decisions. Then, the solicitation of the SAW method estimates the index of suitability, which is an extensively employed method for scheming and computing final score values of multi-criteria problem sets. Thus, in multi-criteria decision problems, it is used to determine the suitability value according to the grading scale used for the suitability index 0 to 255 (the higher score is the more suitable area), as shown in Equation (2) [41].
Sensitivity analysis is employed to examine the stability and constancy solution. The selected alternative and its rank are the alternations inside the input data. Finally, in this study, to change the weights of the input criteria, sensitivity analysis is applied and the generated outcome provides an idea of the visualization layout of the final results. Meszaros and Rapcsak [42] mentioned that sensitivity analysis is used to check the constancy of the answers acquired against the subjectivity that the decision-makers might create. In order to gauge its sensitivity, the sensitivity analysis is ended where the GIS layers’ weights are changed to measure the differences in the biomass power facilities’ suitability maps. Precisely, five different scenarios (A to E) were applied for the sensitivity analysis: for A, 0.33 is applied to all criteria as equal weights; for B, 0.50 is applied to biomass socio-economic criteria (given the priority) and 0.25 is applied to the rest of criteria; for C, 0.50 is applied to environmental criteria (given the priority) and 0.25 is applied to the rest of criteria; for D, 0.50 is applied to general geophysical criteria (given the priority) and 0.25 is applied to the rest of criteria; and for E, the suitability map—based on the authors’ weightings—are applied as 0.59, 0.29 and 0.12 for three criteria, respectively.
2.3. Survey Modeling Description
Five integration scenarios were obtained by the previous sensitivity analysis and the effective likelihood was tested by the stakeholders. For the test, survey data were collected with questionnaires, which avoids motivation of participants’ problems and augments effectiveness [43] and is designed by up-to-date standards to extract individual preferences [44,45]. Precisely, a total of 105 answered responses were collected through the survey.
Three parts addressed in the survey questionnaire consisted of the following: the first part questions the general background; the second part questions the likelihood that integration measures could be implemented if a certain scenario is applied (e.g., a total of five integration scenarios, numbered A to E, based on a five-point Likert-type scale), which can extend from ‘very likely’ to ‘very unlikely’; and the third and final part gives a choice for remarks and a zone for an email address if the stakeholders desire to be notified of the research results at a later time. Specifically, 105 respondents (86.78%) as actual participants from a total of 121 stakeholders completed their answers for the survey questionnaire. Their answers were post-coded to specify more generic explanations for the further assessments.
3. Results and Discussion
Regarding the final results, obtained through a participatory operative multi-criteria F-DEMATEL and GIS-MCDA method from the twelve possible impacts grouped into three criteria, the map layers were presented using SAW and sensitivity analysis to identify biomass power facility locations under biomass feedstock and climate change in the proposed case study area. Then, these five different integration scenarios, containing five biomass power facilities constructed in the area, were evaluated by 105 stakeholders using a survey questionnaire. Hence, they conveyed the correct routine and redirected the main patterns and designs used to locate biomass power facilities under climate change vulnerabilities.
3.1. Participatory Spatial Location Analysis
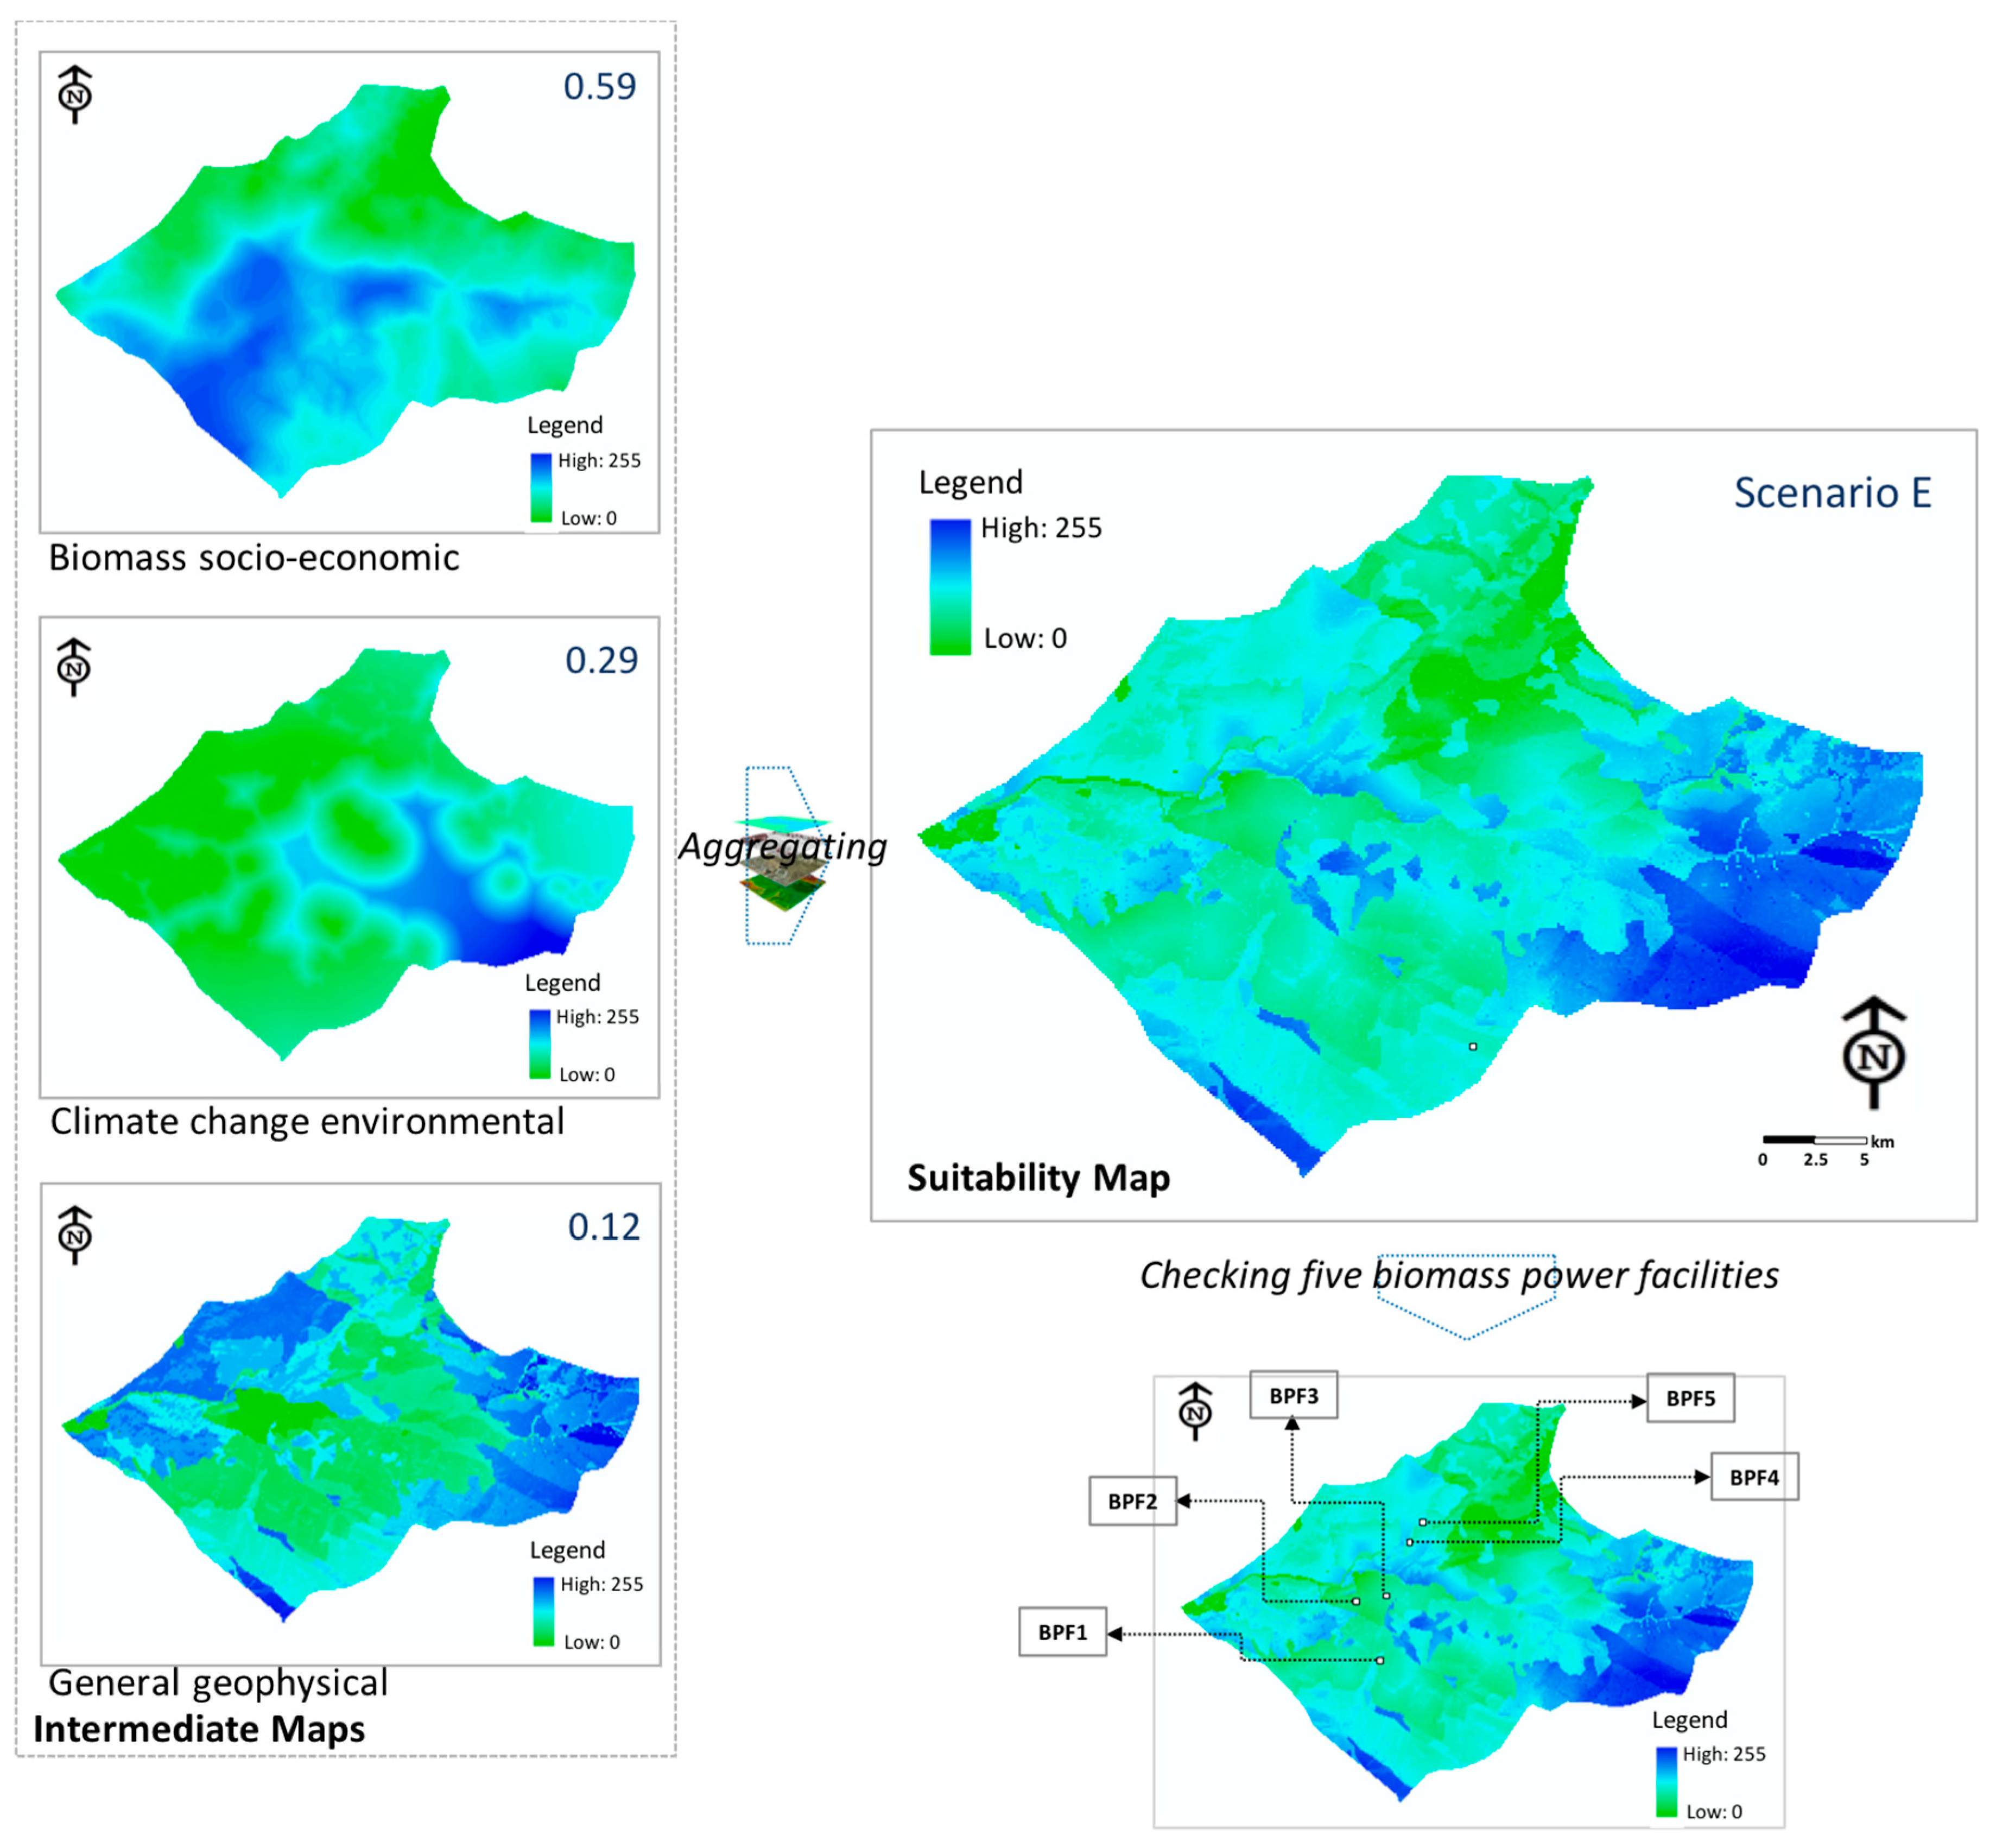
Figure 3 shows three major criteria as intermediate layers (see figures on the left of Figure 3), derived from the previous twelve sub-criteria displayed in Table 2, the final suitability map (E), and the current situations faced by the five biomass power facilities in the proposed case study area. Three intermediate maps were calculated and aggregated: 0.59 was applied to the biomass socio-economic criterion, 0.29 was applied to the climate change environmental criterion, and 0.12 was applied to the general geophysical criterion. Then, these generated maps present consistent and constant processes for concluding the land optimization, suitably fulfilling the research goals presented. To extract the final suitability map (E), the SAW method was first used. The maps of biomass power facilities under biomass feedstock and climate change were recognized as the suitability index 0–255 (the higher the number is, the more priority the area in the dark blue color), as shown in the legend of Figure 3. Constraints can be excepted from the suitability map (E) (see figures on the right of Figure 4), which always left Boolean-like masks and was truly not connected with any procedure of weight distribution. The analysis of the results determined that the most suitable locations were near to forest and agricultural areas, with 9.23% and 5.53 km2 being the transport cost, and precipitation and vegetation cover, respectively, as the most influential ones under each criterion. Regarding the five biomass power facilities (named BPF1 to BPF5) (see figures on the right of Figure 3), we can see that one was situated in suitable areas (BPF4), two were in moderately suitable areas (BPF1 and BPF5), and two were in slightly suitable areas (BPF2 and BPF3). None were in the most suitable area. Alternatively, we suggest moving the current locations and/or constructing a new biomass power facility in the very highly suitable areas.

Figure 3.
Process of final suitability map, with three intermediate maps and five biomass power facilities’ situations of location optimization in the case study area.
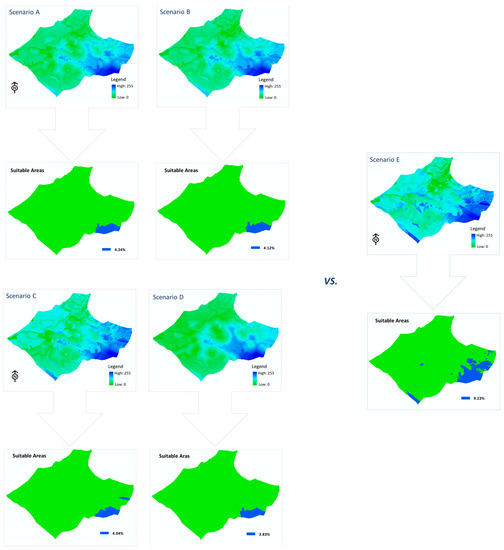
Figure 4.
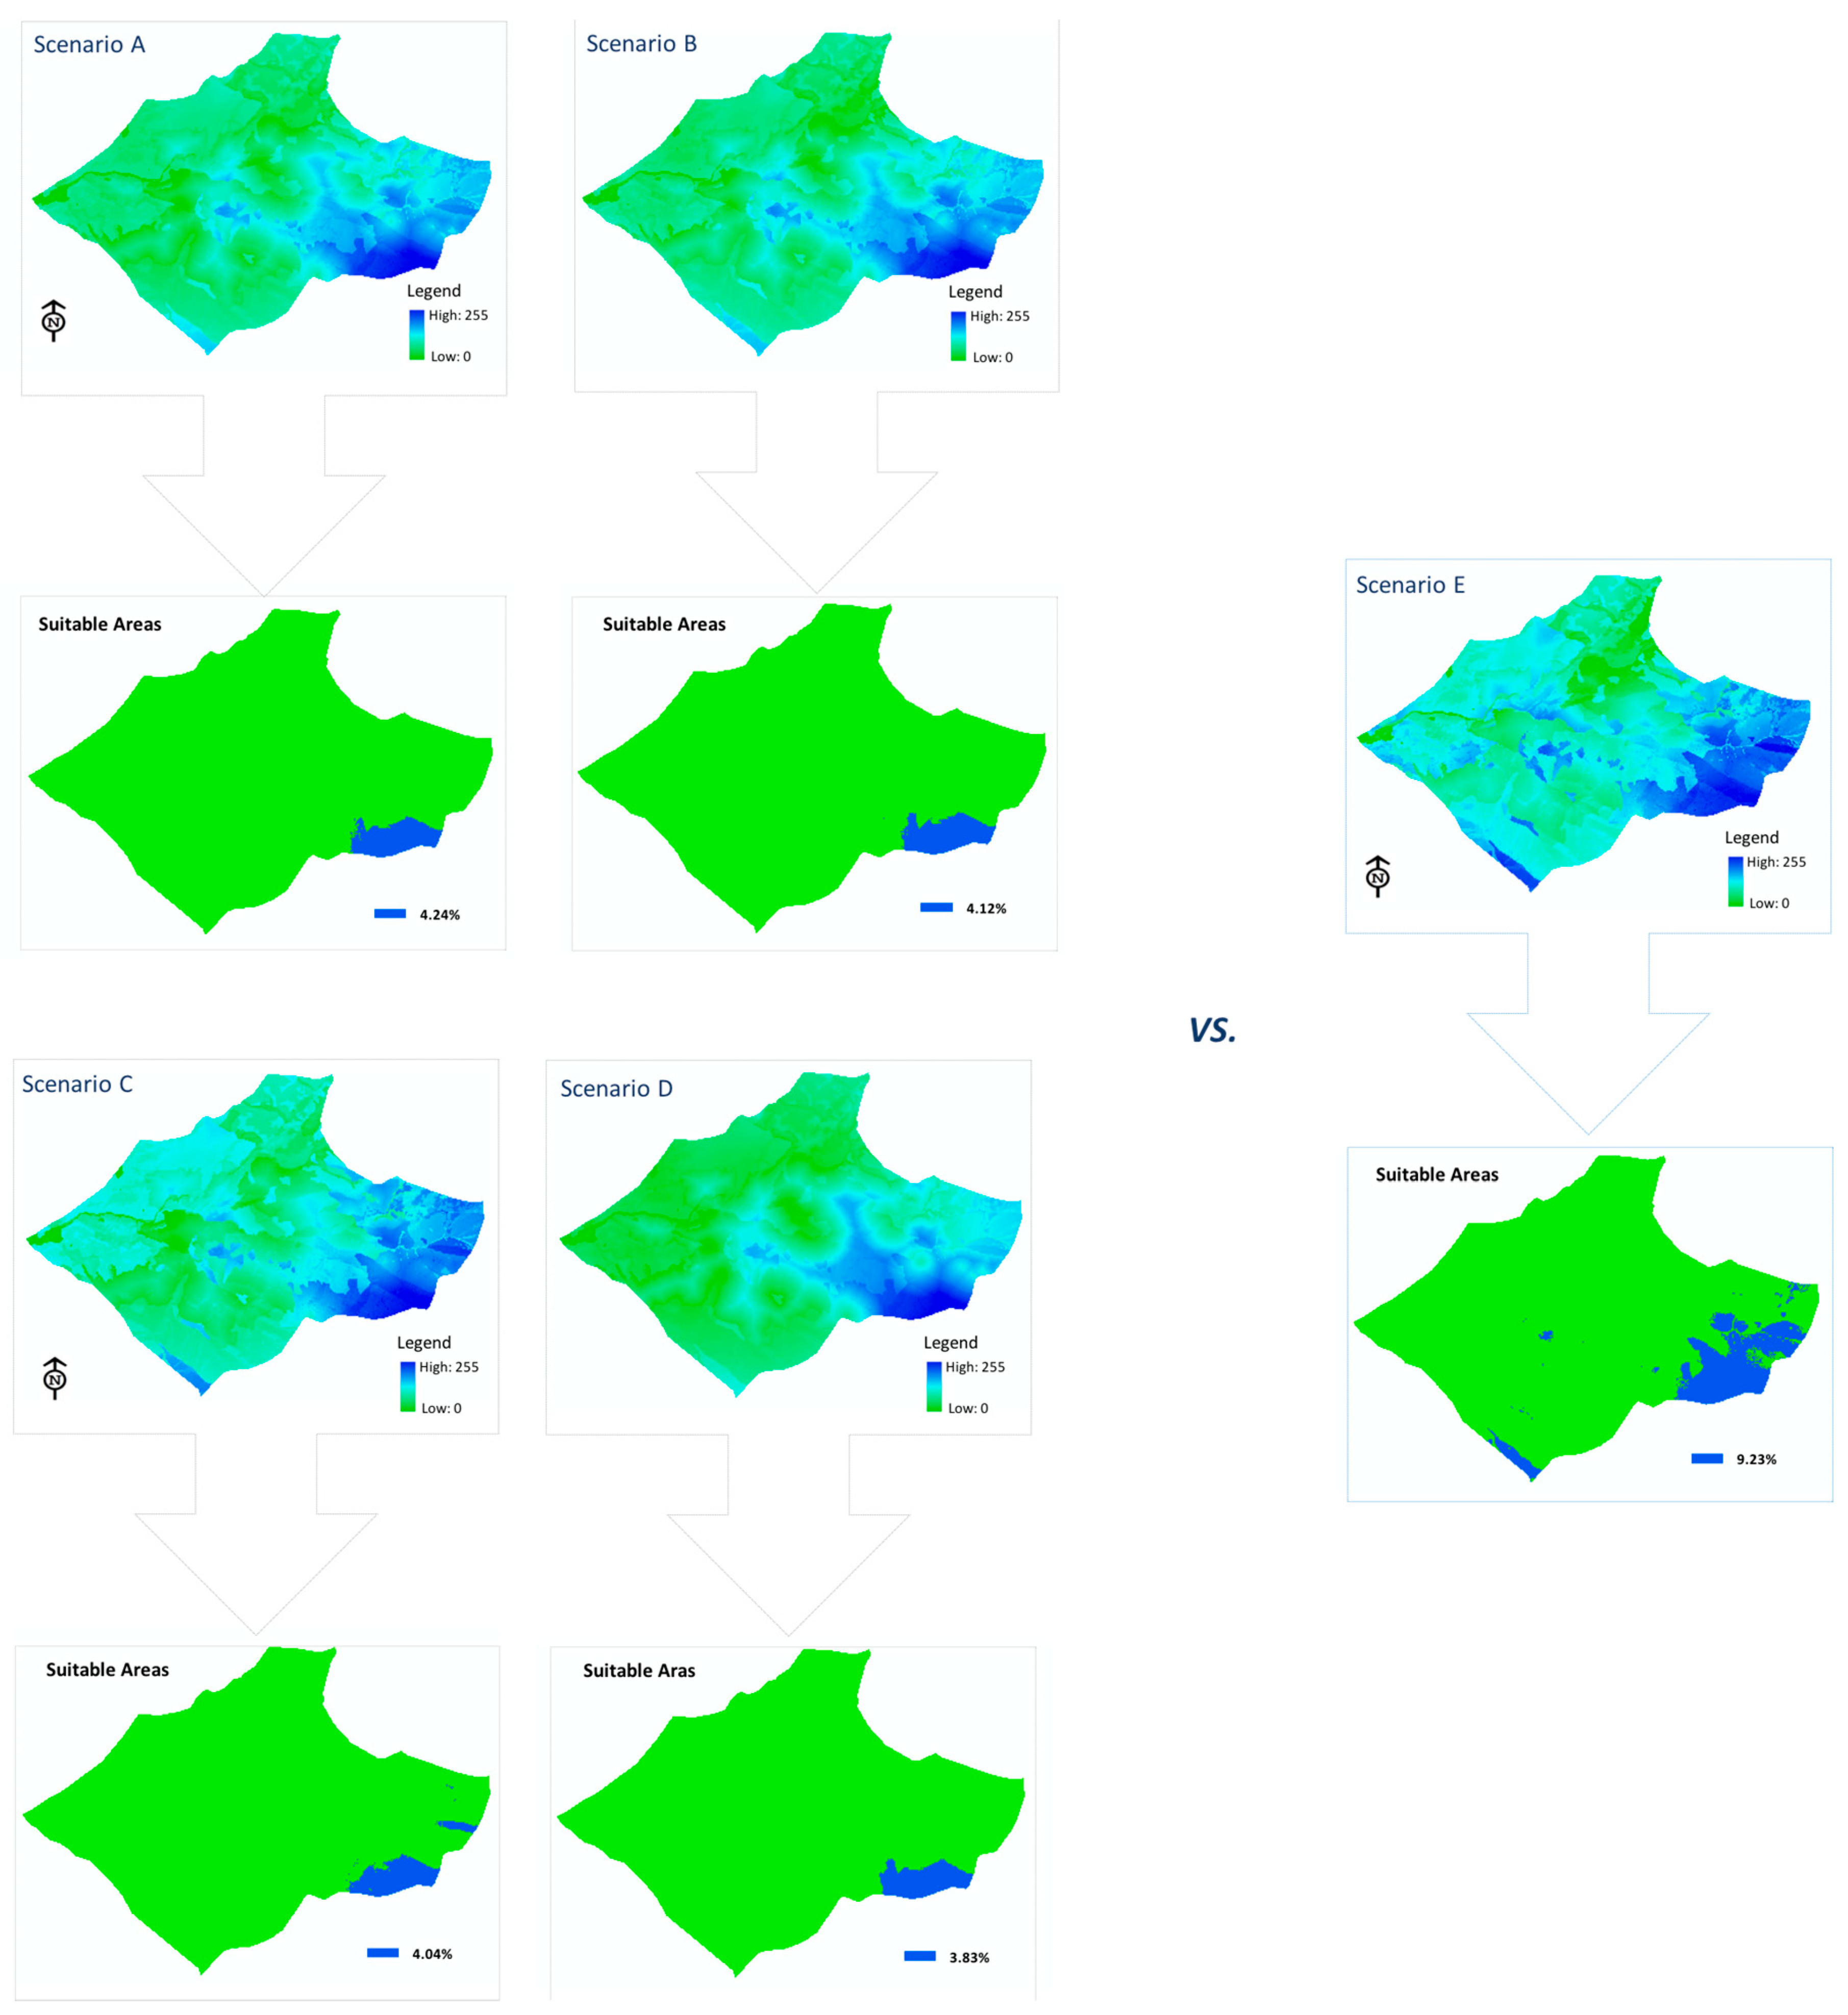
Various sensitivity analysis variations and most suitable areas compared with the final suitability map (scenario E).
Figure 4 presents different suitability maps from the sensitivity analysis test for identifying suitable areas for biomass power facilities in the proposed case study area. The maps used the various criteria weights of the SAW method and sensitivity analysis. Five different integration scenarios were produced by the sensitivity analysis, with different weights applied to the aforementioned three criteria. Five different scenarios (A to E) indicate the following (as shown in Figure 4): A applies equal weights to all criteria (0.33 to all); B prioritizes biomass socio-economic criteria (0.50, 0.25 and 0.25); C prioritizes climate change environmental criteria (0.25, 0.50 and 0.25); D prioritizes general geophysical criteria (0.25, 0.25 and 0.50); and E is the suitability map based on the authors’ weightings (0.59, 0.29 and 0.12 for three criteria, respectively). Specifically, each run generates a different final map of a distinct new biomass power facility site. Regarding the sensitivity analysis, scenario E (suitability map) had the biggest suitable area (5.53 km2). Additionally, looking at scenario D (priority to general geophysical map), which had the smallest suitable area (2.30 km2), there was 3.23 km2 and 5.40% difference between D and E. Hence, it indicates how to manage the location suitability problems, as well as the straightforward link for molding the highly suitable and favorable areas for a locally built biomass power facility.
The application of a multi-criteria model, based on the adopted criteria for identifying suitable areas for biomass power facilities under biomass feedstock and climate change, verifies as positive and justified in sustainable environment. The sensitivity analysis, which alters the criteria weights, reveals a high degree of model stability and constancy. Hence, because of its flexible character, this methodology can be utilized for renewable and sustainable energy planning and development policy at all governmental and industrial sectors for solving decision problems. Thus, this approach allows for the utilization of individual advantages that take a much more holistic view on certain decision-making processes.
3.2. Survey Modeling Analysis of Integration Scenarios
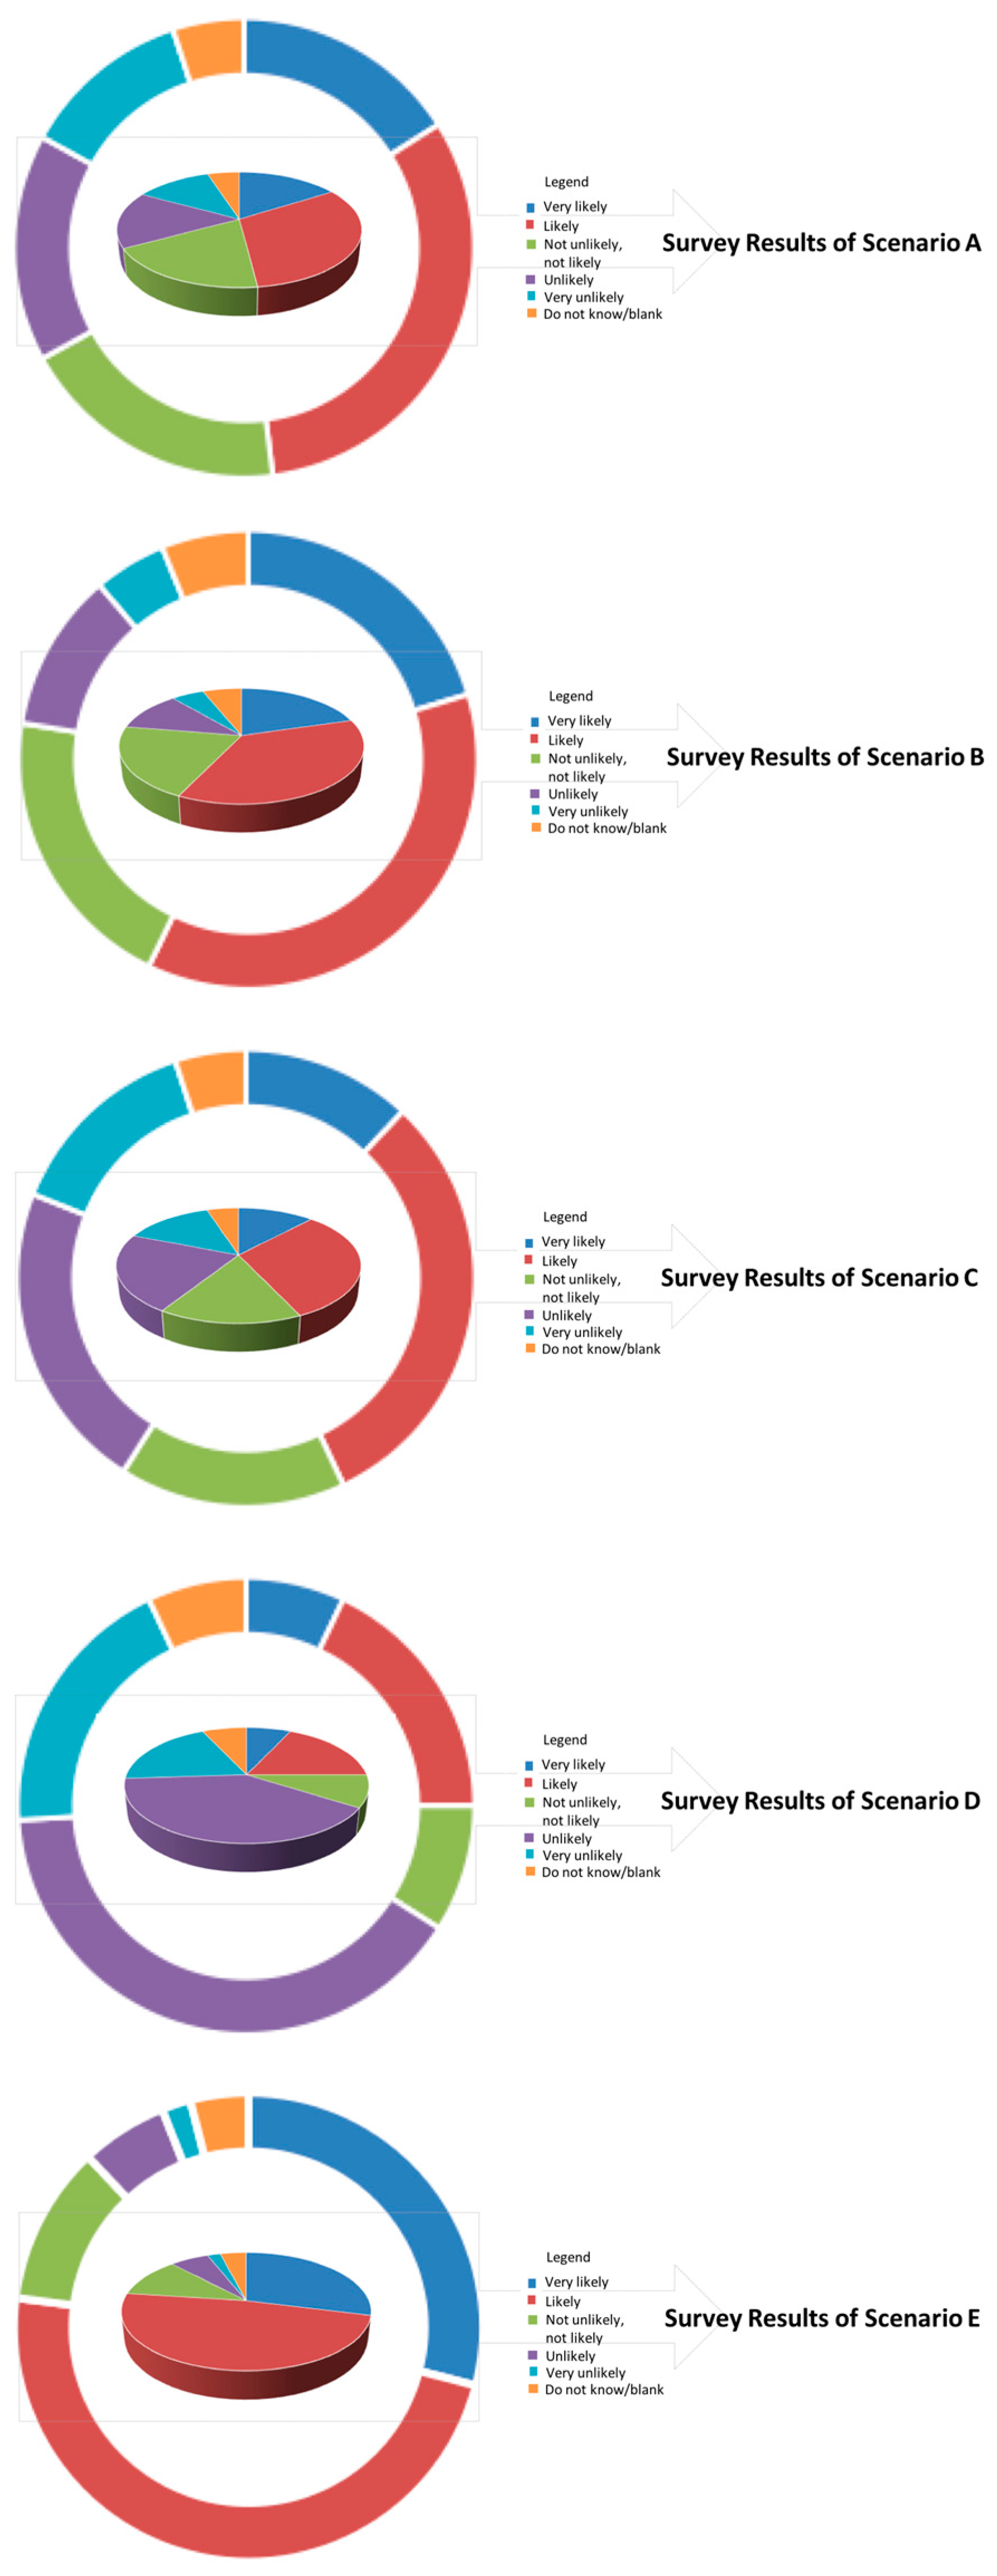
The five different integration scenarios explained above (see Figure 4) were determined feasible for the effective integration of biomass power facilities’ adaptation to biomass feedstock and climate change. This is because of the combination of the theoretical approaches while mutually reimbursing them for their fragile points. The sensitivity analysis results revealed that the paradigm pattern shaped by the SAW had very high dependability and suitability. Whereas the previous theoretical approaches were assessed by the stakeholders, this work sheds light on the implementation chances of a larger stakeholder population of the five integration scenarios (see Figure 5). Particularly, these results were also reinforced by a five-point Likert examination completed by 105 stakeholders. Scenario E (suitability map) acquired 29% ‘very likely’, whereas scenario D (general geophysical map) acquired 7% ‘very likely’ (see Table 4). Through the analysis of the map and survey questionnaire, an interesting facet can be found: both analyses reinforced that scenario E is the most favored and scenario D is the least favored. Thus, scenario E, as most favored, has an overall assessment of 3.84 calcification, a difference of 1.51 points when compared with scenario D (least favored). Between scenarios A and C, there is no indication of a significant difference to prove. Hence, the aforementioned clarified integration scenarios are considered reasonable and practical for the effective integration of biomass power facilities’ adaptation on biomass feedstock and climate change.
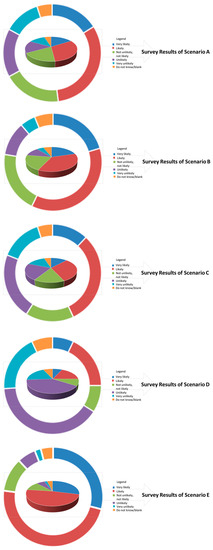
Figure 5.
Survey analysis of five integration scenarios by the participating stakeholders.
Table 4.
Likelihood of the integration strategies by the survey.
3.3. Study Discussions, Comparisons and Limiations
Although a new method was presented for adapting biomass power facilities under biomass feedstocks and climate change, this work has several discussions, comparisons, and limitations for authentic implication. This work discusses an operative participatory multi-criteria F-DMATEL and GIS-MCDA, in the context of professionals’ and stakeholders’ participation, to analyze the location and integration scenario of biomass power facilities under the consideration of biomass feedstocks and climate change for the renewable energy sector. The approach is confident and justified based on the adopted criteria in the agroforestry system environment. Positively, it distinguishes space parts, which are vastly favorable and suitable for planning biomass power facilities on a long-term, sustainable basis. The sensitivity analysis, which changes the criteria weights, reveals a high degree of model constancy and stability. By shifting the weight coefficients of the criteria, the analysis of the sensitivity test discloses a high stability degree of the proposed model. Hence, the validation of the proposed methodology can be utilized as a decision-making tool to support proper sustainable planning and development of a biomass power facility under the impact of climate change.
With the comparison of approaches available in literature, a range of factors and methodologies, inducing the optimization and decision-making of biomass power facility locations, are studied. According to Viana et al. [46], GIS data has been utilized to analyze, map, regulate, and classify the optimal biomass power facility location by gathering the radius area of thirteen new forest biomass power facilities in Portugal. Herrea-Seara et al. [47] utilized a MCDA, as well as AHP and GIS techniques, to choose the optimal biomass power facility location in Granada province in Spain, and a comparable approach was projected in Valencia province by Prepina et al. [48]. The Valencia province case of Spain has also been addressed with different approaches and methodologies to associate GIS methods on mathematical programming in order to optimize the location and size of a biomass power facility [49], as was a similar case in Italy by Freppaz et al. [50].
This work then describes the limitations. It notes that the data for the influence and risk appraisal were attained from a very extensive scope and established with diverse research methods. These very extensive analysis goals to reduce the uncertainty and insecurity levels of the results were acquired from the numerous pertaining methods. Nevertheless, across works in a particular area, it can be stimulating to build harmony and commonality. This work consequently reproduces data that can be contradictory. Additionally, the weighting mechanism for criteria is slightly arbitrary in character, and it is recognized that grounding the method upon the criteria is broadly conventional of impact evaluations available in various peer-reviewed literature. Hence, further analysis of the previously mentioned factors could move toward to tangible likelihood together with these limitations given in advance.
4. Conclusions
The approach proposed in this study, as a powerful application, shows the final results via a participatory operative F-DEMATEL and GIS-MCDA method, together with SAW and the sensitivity analysis, and consequently answers biomass power facilities’ suitable location questions in regard to renewable energy problems under climate change on a long-term, sustainable basis. The results derived from the criteria and groups decided by professionals demonstrate five different integration scenarios of the current five biomass plants constructed with five categorical values on a grading scale of 0 to 255. The five scenarios were assessed by the stakeholders via the survey. Hence, this study denotes a proper way to optimize suitable biomass power facilities under biomass feedstocks and climate change in the aforementioned case study area.
This work describes an operative participatory multi-criteria F-DMATEL and GIS-MCDA approach, in the context of professionals’ and stakeholders’ participation, to analyze the location and integration scenario of biomass power facilities under the consideration of biomass feedstocks and climate change for the renewable energy sector. It was applied to an empirical case study area of agroforestry systems, ASPS, in Spain. SAW and the sensitivity analysis deliver great flexibility in the arrangement procedure, proposing rankings-based weights. The analysis of results determines that the most suitable locations are near to forest and agricultural areas, with 9.23% of the proposed case study area being the transport cost, and precipitation and vegetation cover as the most influential one under each criterion. For five biomass power facilities (named BPF1 to BPF5), we can see that one is situated in a suitable area (BPF4), two are in moderately suitable areas (BPF1 and BPF5), and two are in slightly suitable areas (BPF2 and BPF3). None are in the most suitable area. Regarding the sensitivity analysis, scenario E (suitability map) had the biggest suitable area (5.53 km2). Additionally, looking at scenario D (priority to general geophysical map), which had the smallest suitable area (2.30 km2), there was 3.23 km2 and 5.40% difference between them. The results of the sensitivity analysis suggest that the paradigm created by SAW has high reliability and suitability. These results were also supported by a five-point Likert test completed by 105 stakeholders. Scenario E acquired 29% ‘very likely’, while scenario D acquired 7% ‘very likely’. The integration scenarios explained above are considered feasible for the effective integration of biomass power facilities’ adaptation on biomass feedstock and climate change.
Author Contributions
This work was completed by the author, who has reviewed and improved the manuscript, as well as revised and approved the final manuscript.
Acknowledgments
The author gratefully acknowledges the program of the Juan de la Cierva-Formación of the Economy and Competitiveness of Spain (ref. JDC-2015), which makes this work possible.
Conflicts of Interest
The author declares no conflict of interest.
Nomenclature
| AHP | analytic hierarchy process |
| ASPS | agro-silvo-pastoral system |
| ESDSS | energy spatial decision support system |
| e | decision-maker preference |
| EU | European Union |
| F-DEMATEL | fuzzy-decision-making trial and evaluation laboratory |
| FIT | feed-in-tariff |
| GHG | greenhouse gas |
| GIS | geographic information system |
| k | total number of decision-maker |
| MCDA | multi-criteria decision analysis |
| n | number of criteria |
| PCM | pairwise comparison method |
| P | final criteria |
| PSP | participatory spatial planning |
| SAW | simple additive weighting |
| SI | suitability index |
| TFN | triangular fuzzy number |
| xij | grading value of area i under criterion j |
| wi | normalized value of weight criterion i |
References
- International Renewable Energy Agency. Renewable Energy and Jobs—Annual Review 2015. Available online: http://www.irena.org/menu/index.aspx?mnu=Subcat&PriMenuID=36&CatID=141&SubcatID=585 (accessed on 11 January 2018).
- Elbersen, B.; Startisky, I.; Hengeveld, G.; Schelhaas, M.; Naeff, H.; Böttcher, H. Atlas of EU Biomass Potentials: Spatially Detailed and Quantified Overview of EU Biomass Potential Taking into Account the Main Criteria Determining Biomass Availability from Different Sources; Staff Publications: Brussels, Belgium, 2012. [Google Scholar]
- Füssel, H.M. An updated assessment of the risks from climate change based on research published since the IPCC Fourth Assessment Report. Clim. Chang. 2009, 97, 469–482. [Google Scholar] [CrossRef]
- Intergovernmental Panel on Climate Change (IPCC). Climate Change 2007: Synthesis Report; IPCC: Geneva, Switzerland, 2007. [Google Scholar]
- Edenhofer, O.; Pichs-Madruga, R.; Sokona, Y.; Farahani, E.; Kadner, S.; Seyboth, K.; Adler, A.; Baum, I.; Brunner, S.; Eickemeier, P. Climate Change 2014: Mitigation of Climate Change. Working Group III Contribution to the Fifth Assessment Report of the Intergovernmental Panel on Climate Change; IPCC: Geneva, Switzerland, 2014. [Google Scholar]
- Ministry of Agriculture, Food and Environment. Inventory of Greenhouse Gases Spain, Edition 2013 (1990–2011 Series), Summary of Results; Ministry of Agriculture, Food and Environment: Madrid, Spain, 2013.
- Chianese, S.; Fail, S.; Binder, M.; Rauch, R.; Hofbauer, H.; Molino, A.; Blasi, A.; Musmarra, D. Experimental investigations of hydrogen production from CO catalytic conversion of tar rich syngas by biomass gasification. Catal. Today 2016, 277, 182–191. [Google Scholar] [CrossRef]
- Molino, A.; Larocca, V.; Chianese, S.; Musmarra, D. Biofuels production by biomass gasification: A review. Energies 2018, 11, 811. [Google Scholar] [CrossRef]
- Styles, D.; Jones, M.B. Energy crops in Ireland: Quantifying the potential lifecycle greenhouse gas reductions of energy-crop electricity. Biomass Bioenergy 2007, 31, 759–772. [Google Scholar] [CrossRef]
- Jeong, J.S.; Ramírez-Gómez, Á. Optimizing the location of a biomass plant with a fuzzy-DEcision-MAking Trial and Evaluation Laboratory (F-DEMATEL) and multi-criteria spatial decision assessment for renewable energy management and long-term sustainability. J. Clean. Prod. 2018, 182, 509–529. [Google Scholar] [CrossRef]
- Eisentraut, A.; Brown, A. Technology Roadmap: Bioenergy for Heat and Power; International Energy Agency: Paris, France, 2012. [Google Scholar]
- Evans, A.; Strezov, V.; Evans, T.J. Sustainability considerations for electricity generation from biomass. Renew. Sustain. Energy Rev. 2010, 14, 1419–1427. [Google Scholar] [CrossRef]
- Commission of the European Communities. Biomass Action Plan; Commission of the European Communities: Brussels, Belgium, 2005. [Google Scholar]
- Manos, B.; Partalidou, M.; Fantozzi, F.; Arampatzis, S.; Papadopoulou, O. Agro-energy districts contributing to environmental and social sustainability in rural areas: Evaluation of a local public-private partnership scheme in Greece. Renew. Sustain. Energy Rev. 2014, 29, 85–95. [Google Scholar] [CrossRef]
- Manos, B.; Bartocci, P.; Partalidou, M.; Fantozzi, F.; Arampatzis, S. Review of public-private partnerships in agro-energy districts in Southern Europe: The cases of Greece and Italy. Renew. Sustain. Energy Rev. 2014, 39, 667–678. [Google Scholar] [CrossRef]
- Fantozzi, F.; Bartocci, P.; D’Alessandro, B.; Arampatzis, S.; Manos, B. Public-private partnerships value in bioenergy projects: Economic feasibility analysis based on two case studies. Biomass Bioenergy 2014, 66, 387–397. [Google Scholar] [CrossRef]
- Schmidt, J.; Leduc, S.; Dotzauer, E.; Kindermann, G.; Schmid, E. Potential of biomass-fired combined heat and power plants considering the spatial distribution of biomass supply and heat demand. Int. J. Energy Res. 2009, 34, 970–985. [Google Scholar] [CrossRef]
- Vera, D.; Carabias, J.; Jurado, F.; Ruiz-Reyes, N. A honey bee foraging approach for optimal location of a biomass power plant. Appl. Energy 2010, 87, 2119–2127. [Google Scholar] [CrossRef]
- Jeong, J.S.; Ramírez-Gómez, Á. A multicriteria GIS-based assessment to optimize biomass facility sites with parallel environment—A case study in Spain. Energies 2017, 10, 2095. [Google Scholar] [CrossRef]
- Sahoo, K.; Hawkins, G.L.; Yao, X.A.; Samples, K.; Mani, S. GIS-based biomass assessment and supply logistics system for a sustainable biorefinery: A case study with cotton stalks in the Southeastern US. Appl. Energy 2016, 182, 260–273. [Google Scholar] [CrossRef]
- Mardani, A.; Zavadskas, E.K.; Streimikiene, D.; Jusoh, A.; Nor, K.M.; Khoshnoudi, M. Using fuzzy multiple criteria decision making approaches for evaluating energy saving technologies and solutions in five star hotels: A new hierarchical framework. Energy 2016, 117, 131–148. [Google Scholar] [CrossRef]
- Paredes-Sánchez, J.P.; García-Elcoro, V.E.; Rosillo-Calle, F.; Xiberta-Bernat, J. Assessment of forest bioenergy potential in a coal-producing area in Asturias (Spain) and recommendations for setting up a Biomass Logistic Centre (BLC). Appl. Energy 2016, 171, 133–141. [Google Scholar] [CrossRef]
- European Commission. 2020 by 2020, Europe’s Climate Change Opportunity; COM 30; European Commission: Brussels, Belgium, 2008. [Google Scholar]
- Diversification and Energy Saving Institute. Biomass: Climatization; Diversification and Energy Saving Institute: Madrid, Spain, 2008. [Google Scholar]
- Extremadura Energy Agency. Biomasa Para Proyectistas Curso Técnico de Sistemas de Biomasa y Sistemas Híbridos; Extremadura Energy Agency: Merida, Spain, 2011. [Google Scholar]
- Jeong, J.S.; García-Moruno, L.; Hernández-Blanco, J.; Sánchez-Ríos, A.; Ramírez-Gómez, Á. Identifying priority areas for rural housing development using the participatory multi-criteria and contingent valuation methods in Alange reservoir area, Central Extremadura (Spain). J. Rural Stud. 2017, 50, 117–128. [Google Scholar] [CrossRef]
- González-Ramiro, A.; Gonçalvez, G.; Sánchez-Ríos, A.; Jeong, J.S. Using a VGI and GIS-based multicriteria approach for assessing the potential of rural tourism in Extremadura (Spain). Sustainability 2016, 8, 1144. [Google Scholar] [CrossRef]
- McCall, M.K.; Dunn, C.E. Geo-information tools for participatory spatial planning: Fulfilling the criteria for ‘good’ governance? Geoforum 2012, 43, 81–94. [Google Scholar] [CrossRef]
- Jeong, J.S.; García-Moruno, L.; Hernández-Blanco, J. A site planning approach for rural buildings into a landscape using a spatial multi-criteria decision analysis methodology. Land Use Policy 2013, 32, 108–118. [Google Scholar] [CrossRef]
- Tassinari, P.; Torreggiani, D.; Benni, S. Dealing with agriculture, environment and landscape in spatial planning: A discussion about the Italian case study. Land Use Policy 2013, 30, 739–747. [Google Scholar] [CrossRef]
- Saaty, T.L. The Analytic Hierarchy Process; McGraw-Hill: New York, NY, USA, 1996. [Google Scholar]
- Eastman, J.R. IDRISI Kilimanjaro: Guide to GIS and Image Processing; Clark Laboratories, Clark University: Worcester, UK, 2003. [Google Scholar]
- Gutiérrez Gallego, J.; Naranjo Gómez, J.M.; Jaraíz-Cabanillas, F.J.; Ruiz Labrador, E.E.; Jeong, J.S. A methodology to assess the connectivity caused by a transportation infrastructure: Application to the high-speed rail in Extremadura. Case Stud. Transp. Policy 2015, 3, 392–401. [Google Scholar] [CrossRef]
- Govindan, K.; Khodaverdi, R.; Vafadarnikjoo, A. Intuitionistic fuzzy based DEMATEL method for developing green practices and performances in a green supply chain. Expert Syst. Appl. 2015, 42, 7207–7220. [Google Scholar] [CrossRef]
- ESRI. About the ArcGIS Network Analyst Extension Tutorial. 2016. Available online: http://desktop.arcgis.com/en/arcmap/latest/extensions/network-analyst/about-the-networkanalyst-tutorial-exercises.htm (accessed on 23 November 2017).
- Extremadura Energy Agency. La Biomasa Forestal; Extremadura Energy Agency: Merida, Spain, 2016. [Google Scholar]
- Spanish Meteorological Agency. Scenarios’ Generation of Regionalized Climate Change for Spain; Spanish Meteorological Agency: Madrid, Spain, 2009. [Google Scholar]
- Ministry of Agriculture, Food and Environment. Integrated Water Information System, Spain. Available online: http://www.magrama.gob.es/es/agua/temas/planificacion-hidrologica/sia-/ (accessed on 23 March 2018).
- Jaraíz Cabanillas, F.J.; Mora Aliseda, J.; Gutiérrez Gallego, J.A.; Jeong, J.S. Comparison of regional planning strategies: Countywide general plans in USA and territorial plans in Spain. Land Use Policy 2013, 30, 758–773. [Google Scholar] [CrossRef]
- Jeong, J.S.; García-Moruno, L.; Hernández-Blanco, J.; Sánchez-Ríos, A. Planning of rural housings in reservoir areas under (mass) tourism based on a fuzzy DEMATEL-GIS/MCDA hybrid and participatory method for Alange, Spain. Habitat Int. 2016, 57, 143–153. [Google Scholar] [CrossRef]
- Chen, S.J.; Hwang, C.L. Fuzzy Multiple Attribute Decision Making: Methods and Applications; Springer-Verlag: New York, NY, USA, 1992. [Google Scholar]
- Meszaros, C.; Rapcsak, T. On sensitivity analysis for a class of decision systems. Decis. Support Syst. 1996, 16, 231–240. [Google Scholar] [CrossRef]
- Gillham, B. Developing a Questionnaire; Continuum: London, UK, 2000. [Google Scholar]
- Reips, U.D. Standards for internet-based experimenting. J. Exp. Psychol. 2002, 49, 243–256. [Google Scholar] [CrossRef] [PubMed]
- Jeong, J.S.; García-Moruno, L.; Hernández-Blanco, J.; Jaraíz-Cabanillas, F.J. An operational method to supporting siting decisions for sustainable rural second home planning in ecotourism sites. Land Use Policy 2014, 41, 550–560. [Google Scholar] [CrossRef]
- Viana, H.; Cohen, W.B.; Lopes, D.; Aranha, J. Assessment of forest biomass for use as energy. GIS-based analysis of geographical availability of wood-fired power plants in Portugal. Appl. Energy 2010, 87, 2551–2560. [Google Scholar] [CrossRef]
- Herrera-Seara, M.A.; Aznar Dols, F.; Zamorano, M.; Alameda-Hernandez, E. Optimal location of a biomass power plant in the province of Granada analyzed by multi-criteria evaluation using appropriate geographic information system according to the analytic hierarchy process. Eur. Assoc. Dev. Renew. Energies Environ. Power Qual. 2010, 484–485. [Google Scholar] [CrossRef]
- Perpina, C.; Martínez-Llario, J.C.; Pérez-Navarro, Á. Multicriteria assessment in GIS environments for siting biomass plants. Land Use Policy 2013, 31, 326–335. [Google Scholar] [CrossRef]
- Velazquez-Marti, B.; Fernandez-Gonzalez, E. Mathematical algorithms to locate factories to transform biomass in bioenergy focused on logistic network construction. Renew. Energy 2010, 36, 2136–2142. [Google Scholar] [CrossRef]
- Freppaz, D.; Minciardi, R.; Robba, M.; Rovatti, M.; Sacile, R.; Taramasso, A. Optimizing forest biomass exploitation for energy supply at a regional level. Biomass Bioenergy 2004, 26, 15–25. [Google Scholar] [CrossRef]

© 2018 by the author. Licensee MDPI, Basel, Switzerland. This article is an open access article distributed under the terms and conditions of the Creative Commons Attribution (CC BY) license (http://creativecommons.org/licenses/by/4.0/).