Article

Numerical Investigation of Gas-Liquid Two-Phase Flow inside PEMFC Gas Channels with Rectangular and Trapezoidal Cross Sections

Department of Mechanical and Automotive Engineering, Kongju National University, 1223-24 Cheonan Daero, Seobuk-gu, Cheonan 31080, Chungnam, Korea
*
Author to whom correspondence should be addressed.
Energies 2018, 11(6), 1403; https://doi.org/10.3390/en11061403
Submission received: 9 May 2018 / Revised: 26 May 2018 / Accepted: 28 May 2018 / Published: 30 May 2018
(This article belongs to the Section L: Energy Sources)

Abstract

:
The dynamics of liquid water in the gas channels with rectangular sections (REC), trapezoidal sections with open angles of 60 degrees (T60), and trapezoidal sections with open angles of 72 degrees (T72) are numerically investigated via the volume of fluid method. The effects of the contact angle of the top and side walls (CATS), the water inlet configuration, and the air inlet velocity are studied based on the temporal evolution of gas-liquid interface, the water volume fraction (WVF), the water coverage ratio of the gas diffusion layer (GDL) surface (GWCR), and the pressure drop between the air inlet and the outlet. For the hydrophobic GDL surface and the hydrophilic top and side walls, the T72 provides the lowest WVF and GWCR of around 7 percent due to periodic pressure spikes. The REC and T60 show a higher WVF and a lower GWCR as most of liquid water moves along the channel while attached to the top wall. As the CATS increases from 60 to 120 degrees, the behaviors of liquid water become similar for the three cross-sectional shapes. The T72 shows especially similar results irrespective of the CATS. When the liquid water emergence is concentrated along the side wall, the T72 shows the best water removal characteristics. For all the three channel cross-sectional shapes, water slugs move faster and have smaller sizes as the air inlet velocity increases.

Graphical Abstract

1. Introduction

To address the problems of environmental pollution, energy depletion, and climate change due to the excessive usage of fossil fuels, polymer electrolyte membrane (PEM) fuel cell has been one of the promising candidates among various alternative energy technologies [1,2,3,4]. The PEM fuel cell has many advantages which include high power density, zero emissions, a low operating temperature range, and a wide range of applications. One major technological issue of the PEM fuel cell is proper water management to avoid membrane dehydration and the so-called water flooding phenomena [5,6,7,8]. A properly hydrated membrane produces the best performance and the cathode gas diffusion layer (GDL) surface should be free of liquid water to provide sufficient amounts of oxygen. Water removal in the gas channel (GC) is especially important in automotive applications of PEM fuel cells due to the frequent demand for high current density.
To visualize and quantify the gas-liquid two-phase flow phenomena in the GC and the GDL, many experimental and numerical modeling techniques have been applied [5,6]. The total pressure drop measurement between the inlet and outlet of the GC was used to characterize the two-phase flow pattern and the efficacy of water management [9,10]. Grim et al. developed a variable water flow rate pressure drop model to account for the water introduction through the GDL using the pressure drop data for different two-phase flow regimes [10]. Various in situ or ex situ liquid water visualization techniques in PEM fuel cells have been applied to investigate the qualitative and quantitative behaviors of the liquid water [5,11]. Through the application of visualization techniques including direct optical photography, X-ray tomography, synchrotron radiography, nuclear magnetic resonance (NMR) imaging, and neutron imaging, liquid water accumulation and transport behavior was explained in PEM fuel cells [11]. Together with the experimental approach, many numerical modeling techniques have been applied to predict the complex two-phase flows inside PEM fuel cells. The most commonly used numerical models are the volume of fluid (VOF) method and the lattice Boltzmann method (LBM). Ferreira et al. reviewed the most popular approach, the VOF simulations of two-phase flow in PEM fuel cells and provided recommendations for future challenges of applying the VOF method [12]. Molaeimanesh et al. provided a review on numerous LBM simulations of PEM fuel cells and classified LBM simulations as the following three categories: Calculation of micro-porous layer (MPL) and catalyst layer (CL) transport properties, simulation of water droplet dynamics in GC, and investigation of multi-component multi-phase reactive flow through an operating electrode [13].
The geometry of GC is one of the important factors affecting the water removal characteristics in a PEM fuel cell [14]. The main geometric parameters include flow field configuration, flow direction, channel length, number of channels, use of baffles in GC, channel cross-sectional shape, channel and rib width, channel depth, and height to width ratio of the channel cross section. Several experimental and numerical investigations were conducted to study the effect of GC cross-sectional geometry [7,8,14,15,16,17,18,19,20]. Owejan et al. measured the volume of accumulated liquid water in the GCs with triangular and rectangular cross-sectional shapes in operating fuel cells using the neutron radiography method [15]. The triangular channel retains less water and shows a water morphology where droplets are in the channel corners at the GDL surface. In contrast, the rectangular channel has larger droplets dispersed individually in the direction of flow. Zhu et al. performed the VOF simulations to study the effect of the six cross-sectional shapes of the cathode GC on the droplet detachment time, the detachment diameter, the water coverage ratio (WCR), the water volume fraction (WVF), and the water removal time [16]. Lu et al. compared the three cross-sectional shapes by conducting ex situ experiments and reported that sinusoidal and trapezoidal GCs produce lower pressure drop than the rectangular GC [17]. Gopalan and Kandlikar conducted ex situ experiments to study the water droplet dynamics in a GC with different trapezoidal open angles and developed a prediction model for the minimum velocity required to remove droplet from GC [18]. Lorenzini-Gutierrez et al. performed the VOF simulations to study the effects of channel wall wettability and cross-sectional shapes on the removal characteristics of a liquid slug located in a straight GC [7]. For a fixed GDL surface contact angle of 140°, the range of top and side wall contact angle between 60° and 65° was favorable for the formation of stable top wall film and the high removal rate of liquid water. The trapezoidal cross sections with open angle of 50° and 60° resulted in a better water removal behavior compared to other cross-sectional shapes. Kim et al. investigated the liquid water dynamics in bent gas channels with one rectangular and two trapezoidal cross sections in a channel flooding situation [8]. The trapezoidal channel with open angle of 60° showed the most favorable combined WVF and WCR characteristics. Table 1 summarizes the numerical studies on the effect on GC cross-sectional shape on gas-liquid two-phase flow in PEM fuel cells.
In this paper, the dynamics of liquid water in a straight GCs with the rectangular and trapezoidal channel cross sections with the same cross-sectional area is investigated via the VOF method. Compared to the previous studies [7,8] which were rather limited to the liquid water film or slug flow situation without continuous water supply from GDL surfaces, four different water inlet configurations are adopted to simulate complex water accumulation patterns in the cathode GC. While fixing the contact angle of the GDL surface as the hydrophobic contact angle of 130°, parametric studies are conducted to evaluate the effects of the contact angle of the top and side walls, the water inlet configuration, and the air inlet velocity. The temporal evolution of gas-liquid interface, WVF, WCR of the GDL surface (GWCR), and the pressure drop between the air inlet and the outlet are presented to describe the water removal behaviors in GCs with different cross-sectional shapes.

2. Model Formulation

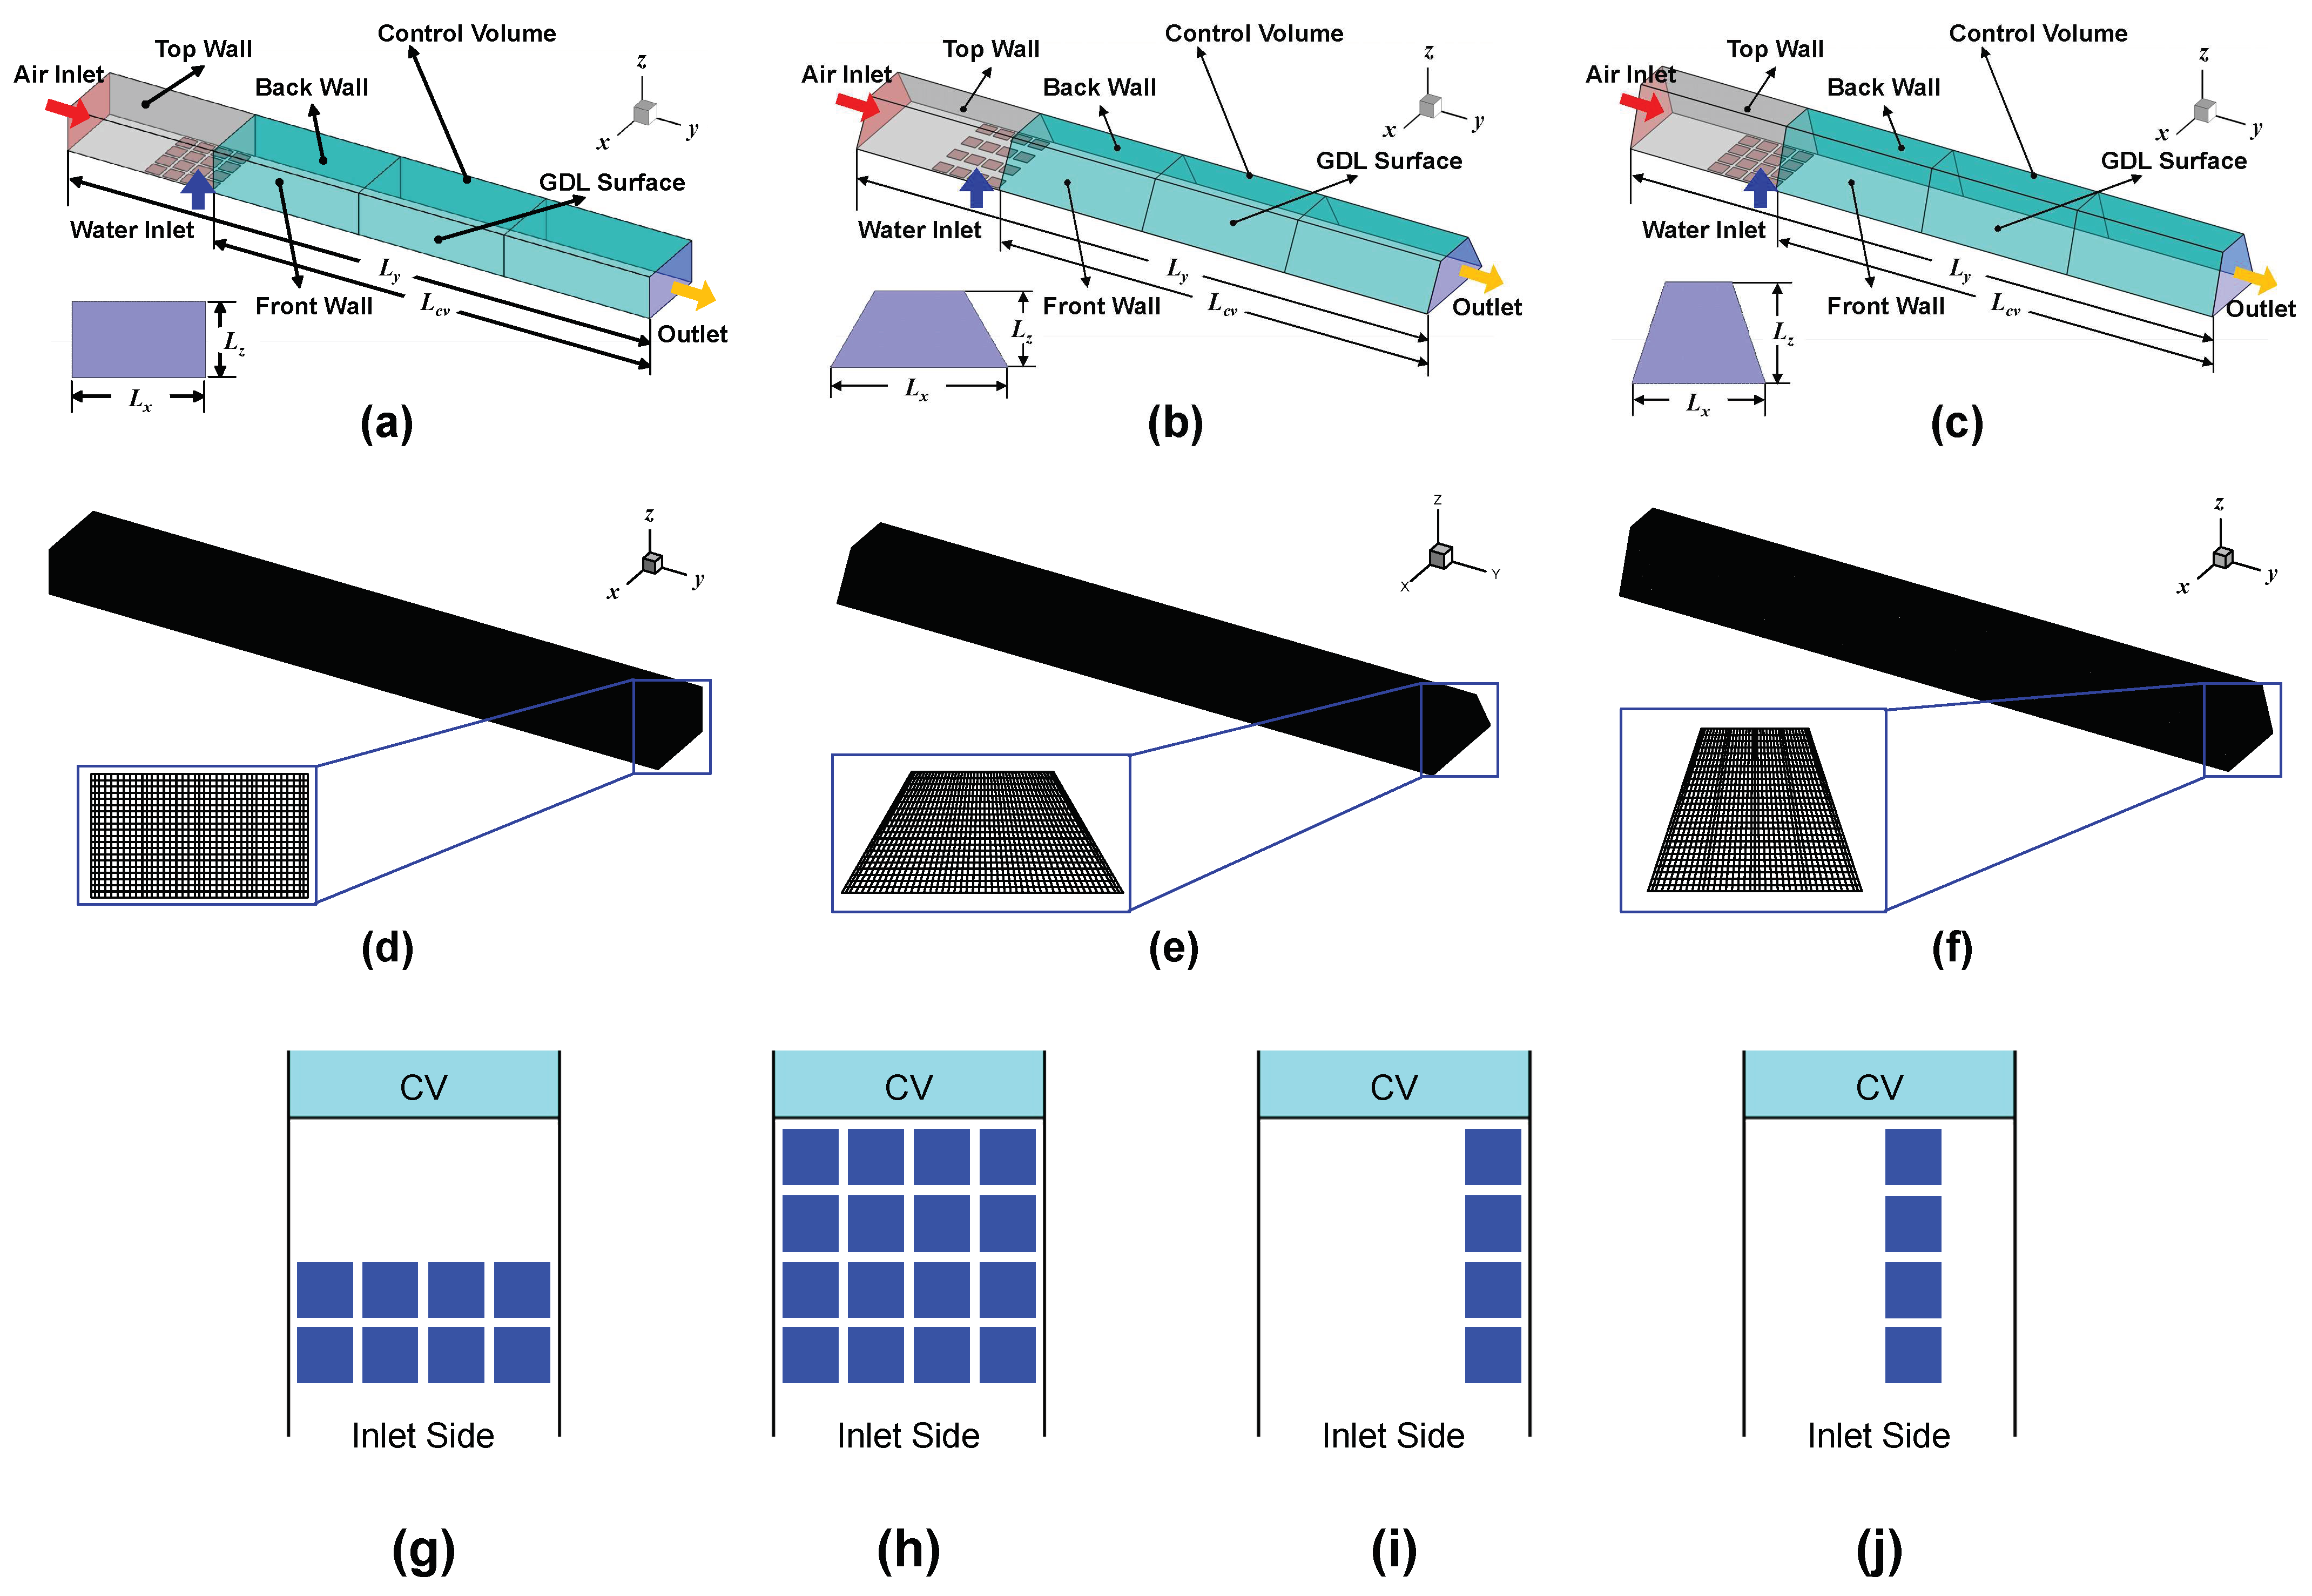
2.1. Computational Domain

The design of the GC geometry is one of the most important issues in the PEM fuel cell research, because the two-phase flow pattern from the GC geometry has a considerable effect on the performance of the PEM fuel cell stack. The most commonly used GC configurations are a straight parallel channel, a serpentine channel, and an interdigitated channel. In addition, a cascade flow field channel and a pin or mesh flow field channels are also considered [14]. To study the complex gas-liquid two-phase flow in the PEM fuel cell GC, the three different straight GCs with a rectangular and two trapezoidal channel cross sections which have the same cross-sectional area are selected as shown in Figure 1. In Figure 1a, the REC configuration has a rectangular channel cross section with a width of 700   μ m and a height of 400   μ m . Based on published numerical and experimental studies, this channel geometry is proposed by Owejan et al. [19]. The channel and land widths of 700 and 500   μ m , respectively, were determined to provide an improved performance and uniform flow distribution. Considering the flow deviation from carbon fiber GDL intrusion and manufacturing dimensional variation, a channel height of 400   μ m is selected to be optimal for PEM fuel cell performance. A relatively short entrance length of 700   μ m is used before the micro pores on the GDL surface because a fully developed velocity profile is applied at the air inlet. To quantify the liquid water behavior in the GC, a control volume with the length of L c v   ( = 4.2   mm ) is defined in Figure 1a–c. In addition to the rectangular GC, the GC with trapezoidal cross-sectional shape are reported to provide favorable water removal characteristics based on experimental and numerical investigations [7,8,17,18]. Lu et al. reported that sinusoidal or trapezoidal cross-sectional shapes are recommended for stamped metal plates and molded carbon composite plates, which are more feasible for the mass production of PEM fuel cell flow fields [17]. In Figure 1b, the T60 configuration has a trapezoidal channel cross section with an open angle of 60° (bottom width of 931   μ m ) which has the same channel height and cross-sectional area with the REC configuration. In Figure 1c, the T72 configuration has a trapezoidal channel cross section with an open angle of 72° (height of 533   μ m ) which has the same cross-sectional area and channel width at the bottom with the REC configuration. To maintain similar maximum cell sizes, structured meshes with 215,080, 266,020, and 279,604 hexahedral computational cells are used for the REC, T60, and T72 configurations, respectively, as shown in Figure 1d–f. The grid dependency test was performed for the three levels of grid resolutions, 34 × 18 (coarse), 38 × 20 (medium), and 42 × 22 (high) for the channel cross section with the corresponding resolution adjustment along the channel length. All the three meshes produced similar temporal evolution of computed gas-liquid interface shape, WVF, and GWCR. To ensure both the accuracy and efficiency of the calculation, the medium grid resolution is adopted in the present study. This resolution is much finer than the resolution adopted in the previous studies for similar GC geometries [7,8]. To study the effect of water inlet configuration on the liquid water dynamics in the three different GCs, the four different water inlet configurations are considered as shown in Figure 1g–j. Ding et al. performed the VOF simulations to study the effect of GDL surface microstructure by changing the size and number of micro pores on GDL surface [20]. The two-phase flow patterns with 4 pores, 16 pores, and 64 pores arrangements are very similar while 1 pore case shows some discrepancy. Based on the simulation results, the 4 pores case is recommended as a minimum required number of pores in fuel cell mini channel to capture the essential two-phase flow features [20]. In real operating PEM fuel cells, liquid water emerges from randomly distributed preferential sites on the GDL surface. As small droplets move along the channel, droplets interact with each other and channel walls to form complex patterns [20]. In this study, 16 pores arrangement of Ding et al. [20] is adopted to simulate accumulated water patterns as shown in Figure 1g–j.

2.2. Numerical Method

In the numerical simulation of gas-liquid two-phase flow inside the GCs, the gas flow is assumed to be laminar, unsteady, isothermal, and three-dimensional. The Reynolds number defined by the maximum air inlet velocity, channel height, and air properties is calculated as 125 which corresponds to the laminar flow regime. The gas and liquid water properties including surface tension are assumed to be constant. In addition, evaporation and condensation effects of liquid water in the GCs are assumed to be negligible. To model time dependent gas-liquid two-phase flow, the VOF method is adopted. The VOF method solves a set of momentum equations and the continuity equation for the volume fraction of each of the fluids [21,22,23,24,25,26,27]. A surface tracking technique is employed on a non-moving Eulerian mesh to calculate the location of the interface between the immiscible fluids. In the VOF method, the key variable is the volume fraction of the qth fluid in the computational cell, α q . When the computational cell is empty of the qth fluid, α q = 0 . When the cell is completely filled with the qth fluid, α q = 1 . When the cell is partially filled with the qth fluid, 0 < α q < 1 . Because only the two fluids are present in this study, the volume fractions of gas and liquid phases are denoted by α 1 and α 2 , respectively. The interface between the immiscible fluids can be tracked by solving the continuity equation for α 2 .
t ( α 2 ) + ( α 2 u 2 ) = 0
Here, u 2 is the velocity vector of the liquid phase. Once α 2 is known, α 1 can be given from the following constraint.
α 1 + α 2 = 1
Continuity and momentum equations for a mixture flow are given by
u = 0
t ( ρ u ) + ( ρ u u ) = p + [ μ ( u + u T ) ] + ρ g + F
where p is the static pressure, g is the gravitational acceleration vector, and F is a momentum source term related to surface tension. The density and dynamic viscosity of the mixture are given by
ρ = ( 1 α 2 ) ρ 1 + α 2 ρ 2
μ = ( 1 α 2 ) μ 1 + α 2 μ 2
To account for the surface tension effect, the continuum surface force (CSF) model [28] is employed to add an extra source term to the momentum equation.
F = Γ σ κ δ ( x x s ) n d Γ ( x s )
where Γ is the gas-liquid interface, σ is the surface tension coefficient, κ is the surface curvature of the gas-liquid interface, δ ( x x s ) is the three-dimensional Dirac delta function, x is the position vector, and n is the unit normal vector at the interface. In addition, the local interfacial curvature can be obtained from the volume fractions using
κ = n
Here, n is computed from local gradients in the surface normal at the gas-liquid interface as
n = α 2 | α 2 |
The governing equations are implemented into the open source CFD software, OpenFOAM 4.1 (The OpenFOAM Foundation, London, W13 3DB, United Kingdom, https://openfoam.org) which is based on the finite volume method and C++ libraries [23]. Among the various application solvers in OpenFOAM, the interFoam solver for two incompressible, isothermal immiscible fluids using the VOF method is adopted. In comparison to the original VOF method, the interFoam includes an interfacial compression flux term in the volume fraction equation to mitigate the effects of numerical smearing of the interface [24]. The complete set of the governing equations solved by the interFoam is described in detail in the literatures [24]. Several studies have been performed to verify the accuracy and validity of the interFoam solver in simulating the dynamics of two-phase flow [24,25,26]. Francois et al. reported that the consistency of pressure-surface tension formulation and accuracy of curvature are important in simulating dynamics of surface tension-dominated flows [24,25]. Deshpande et al. applied the interFoam solver to the Rayleigh breakup of a laminar liquid jet [24]. The simulation successfully predicts the jet disintegration and identifies the main and satellite droplets. The simulated radii of the main and satellite droplets show a good agreement with experimental and analytical data. Deshpande et al. investigated a circular water jet plunging at shallow angles into a quiescent pool computationally and experimentally [26]. The computational prediction from the interFoam solver shows an excellent agreement with experimental generation frequencies of cavity which have the order of jet diameter.
In this study, the following finite volume discretization schemes are employed. In the temporal discretization, a first order, bounded, implicit Euler scheme is used. The pressure-velocity coupling is treated by the PIMPLE algorithm which is a combination of semi-implicit method for pressure-linked equations (SIMPLE) and pressure implicit with splitting of operator (PISO) algorithms [27]. For the spatial discretization of gradient and Laplacian terms, Gauss linear and Gauss linear corrected schemes are used respectively, where “corrected” means that the scheme is numerically unbounded, second order, and conservative. For the spatial discretization of convection terms in the momentum equation and volume fraction equation, Gauss upwind and Gauss vanLeer schemes are adopted respectively. The surface tension coefficient between the air and liquid water is set as a constant value of 0.0626 N·m−1. To achieve both temporal accuracy and numerical stability, a Courant number (Co) for one cell is required to be less than 1. With the multi-dimensional universal limiter for explicit solution (MULES) algorithm, an upper limit of Co = 0.25 for stability is typical in the region of the gas liquid interface [23]. Therefore, the maximum Co of 0.25 is set for the volume fraction and other fields. To satisfy the Co criterion, a variable time step size typically ranged from 10−7 to 10−6 s is automatically adjusted throughout all the simulation cases.

2.3. Boundary, Initial, and Operating Conditions

The boundary conditions for the governing equations are specified at the air and water inlets, the outlet, and the channel walls in Figure 1. For the momentum equations, a fully developed laminar velocity profile is prescribed at the air inlet, no slip condition is specified on the channel walls, and zero velocity gradient is applied at the outlet. In addition, water is supplied with a uniform velocity profile because it is difficult to obtain a functional form of the velocity distribution in a micro pore due to a tangled porous structure inside the GDL of a PEM fuel cell. For the pressure equation, a fixed flux pressure condition is used at the air inlet and the channel walls, a zero-pressure gradient is set for the water inlets, and a fixed pressure value is applied at the outlet. For the volume fraction equation, a fixed value of zero is prescribed at the air inlet, a fixed value of one is applied at the water inlets, an internal field condition which equates the volume fraction at the boundary point with the value at the nearest internal grid point is used at the outlet, and a constant contact angle condition is applied at the channel walls. The numerical details of the boundary conditions can be found in the OpenFOAM references [23,24]. The contact angle (θ) is defined as the geometric angle between the liquid-gas interface and liquid-solid interface at the wall where gas, liquid, and solid intersect [21]. The numerical calculations are initiated with uniform zero air velocity and volume fraction fields in the computational domain. Table 2 summarizes the boundary conditions and material properties used in the simulations.
PEM fuel cells operate in the temperature range of 60°–90°C [5,6,20] and the normal operating temperature is usually maintained at around 80°C [6]. All the simulations are performed at the air temperature of 303.15 K, the water temperature of 353.15 K, and the pressure of 1 bar. Although the water temperature is relatively high, it is assumed that neglecting the water evaporation effect does not change the two-phase flow patterns in the GC. The air inlet velocity ( V i n , a i r ) is varied in the range of 1.0–5.0 m·s−1. The GDL surface contact angle ( θ g ) is fixed at 130°, which represents a typical hydrophobic polytetrafluoroethylene (PTFE) treated carbon paper or carbon cloth surface [18,29,30]. The contact angle at the top and side wall surfaces ( θ t s ) is varied in the range of 60°–120°. The hydrophilic contact angle on the side and top walls, in combination with the hydrophobic contact angle on the GDL surface, is reported to be favorable for water removal [19]. The reference simulation conditions are V i n , a i r = 5.0 m·s−1, V i n , w a t e r = 0.1 m·s−1, θ g = 130°, and θ t s = 60°. The air velocity of 5.0 m·s−1 corresponds to the operating condition of a fuel cell that the active area is 100 cm2, the current density is 0.8 A·cm−2, and the cathode stoichiometry is 2.0 [31]. If the net water transfer coefficient is assumed to be 0.85 [30] and all the generated water changes to liquid phase, liquid water is created at the rate of 0.02 g·s−1 at the same operating conditions. Moreover, if the total area of micro pores on the entire GDL surface corresponds to 10% of the total GC area, the average water velocity through all the micro pores on the GDL is calculated as 4.1 × 10 5 m·s−1. Although the water production rate can be varied depending on the relative humidity in the reactant streams, such a small water injection velocity would require an excessively large computation time to simulate water accumulation inside an entire GC geometry with the time step on the order of 10−7 s. To expedite the computation, Ding et al. and Hossain et al. set the liquid water injection velocity at 0.0625 m·s−1, which is several orders of magnitude higher than the estimated value [20,32]. Ding et al. showed that the two-phase flow pattern remained the same even when the liquid water injection velocity was changed by two orders of magnitude in their numerical simulation [20]. Quan and Lai reported a water generation rate that is several orders of magnitude higher does not cause significant deviations because the flow rate ratio between liquid water and gas is large [33]. Moreover, very complex two-phase flow patterns from a full scale numerical simulation which covers the entire GC geometry may complicate the analysis of the interactions of liquid water and the channel walls. Because the objective of this paper is to study the interaction between gas-liquid two-phase flow and the channel walls with different cross-sectional shapes, the water inlet velocity of 0.1 m·s−1 is adopted as the standard condition to accelerate water accumulation in the GC. Instead, the four different water inlet configurations in Figure 1 are used to investigate the effect of distribution patterns of accumulated water. The H12 and H1234 configurations represent uniform water distribution patterns, across the channel width, with different amounts of water supply. The V1 configuration represents a situation where water is accumulated near the side wall. The V2 configuration simulates a situation where water is produced near the center region of the GDL surface. Since the Reynolds number of each phase is relatively small ( Re air = 125, Re water = 38), the laminar flow assumption is applied to all the simulations.

3. Results and Discussion

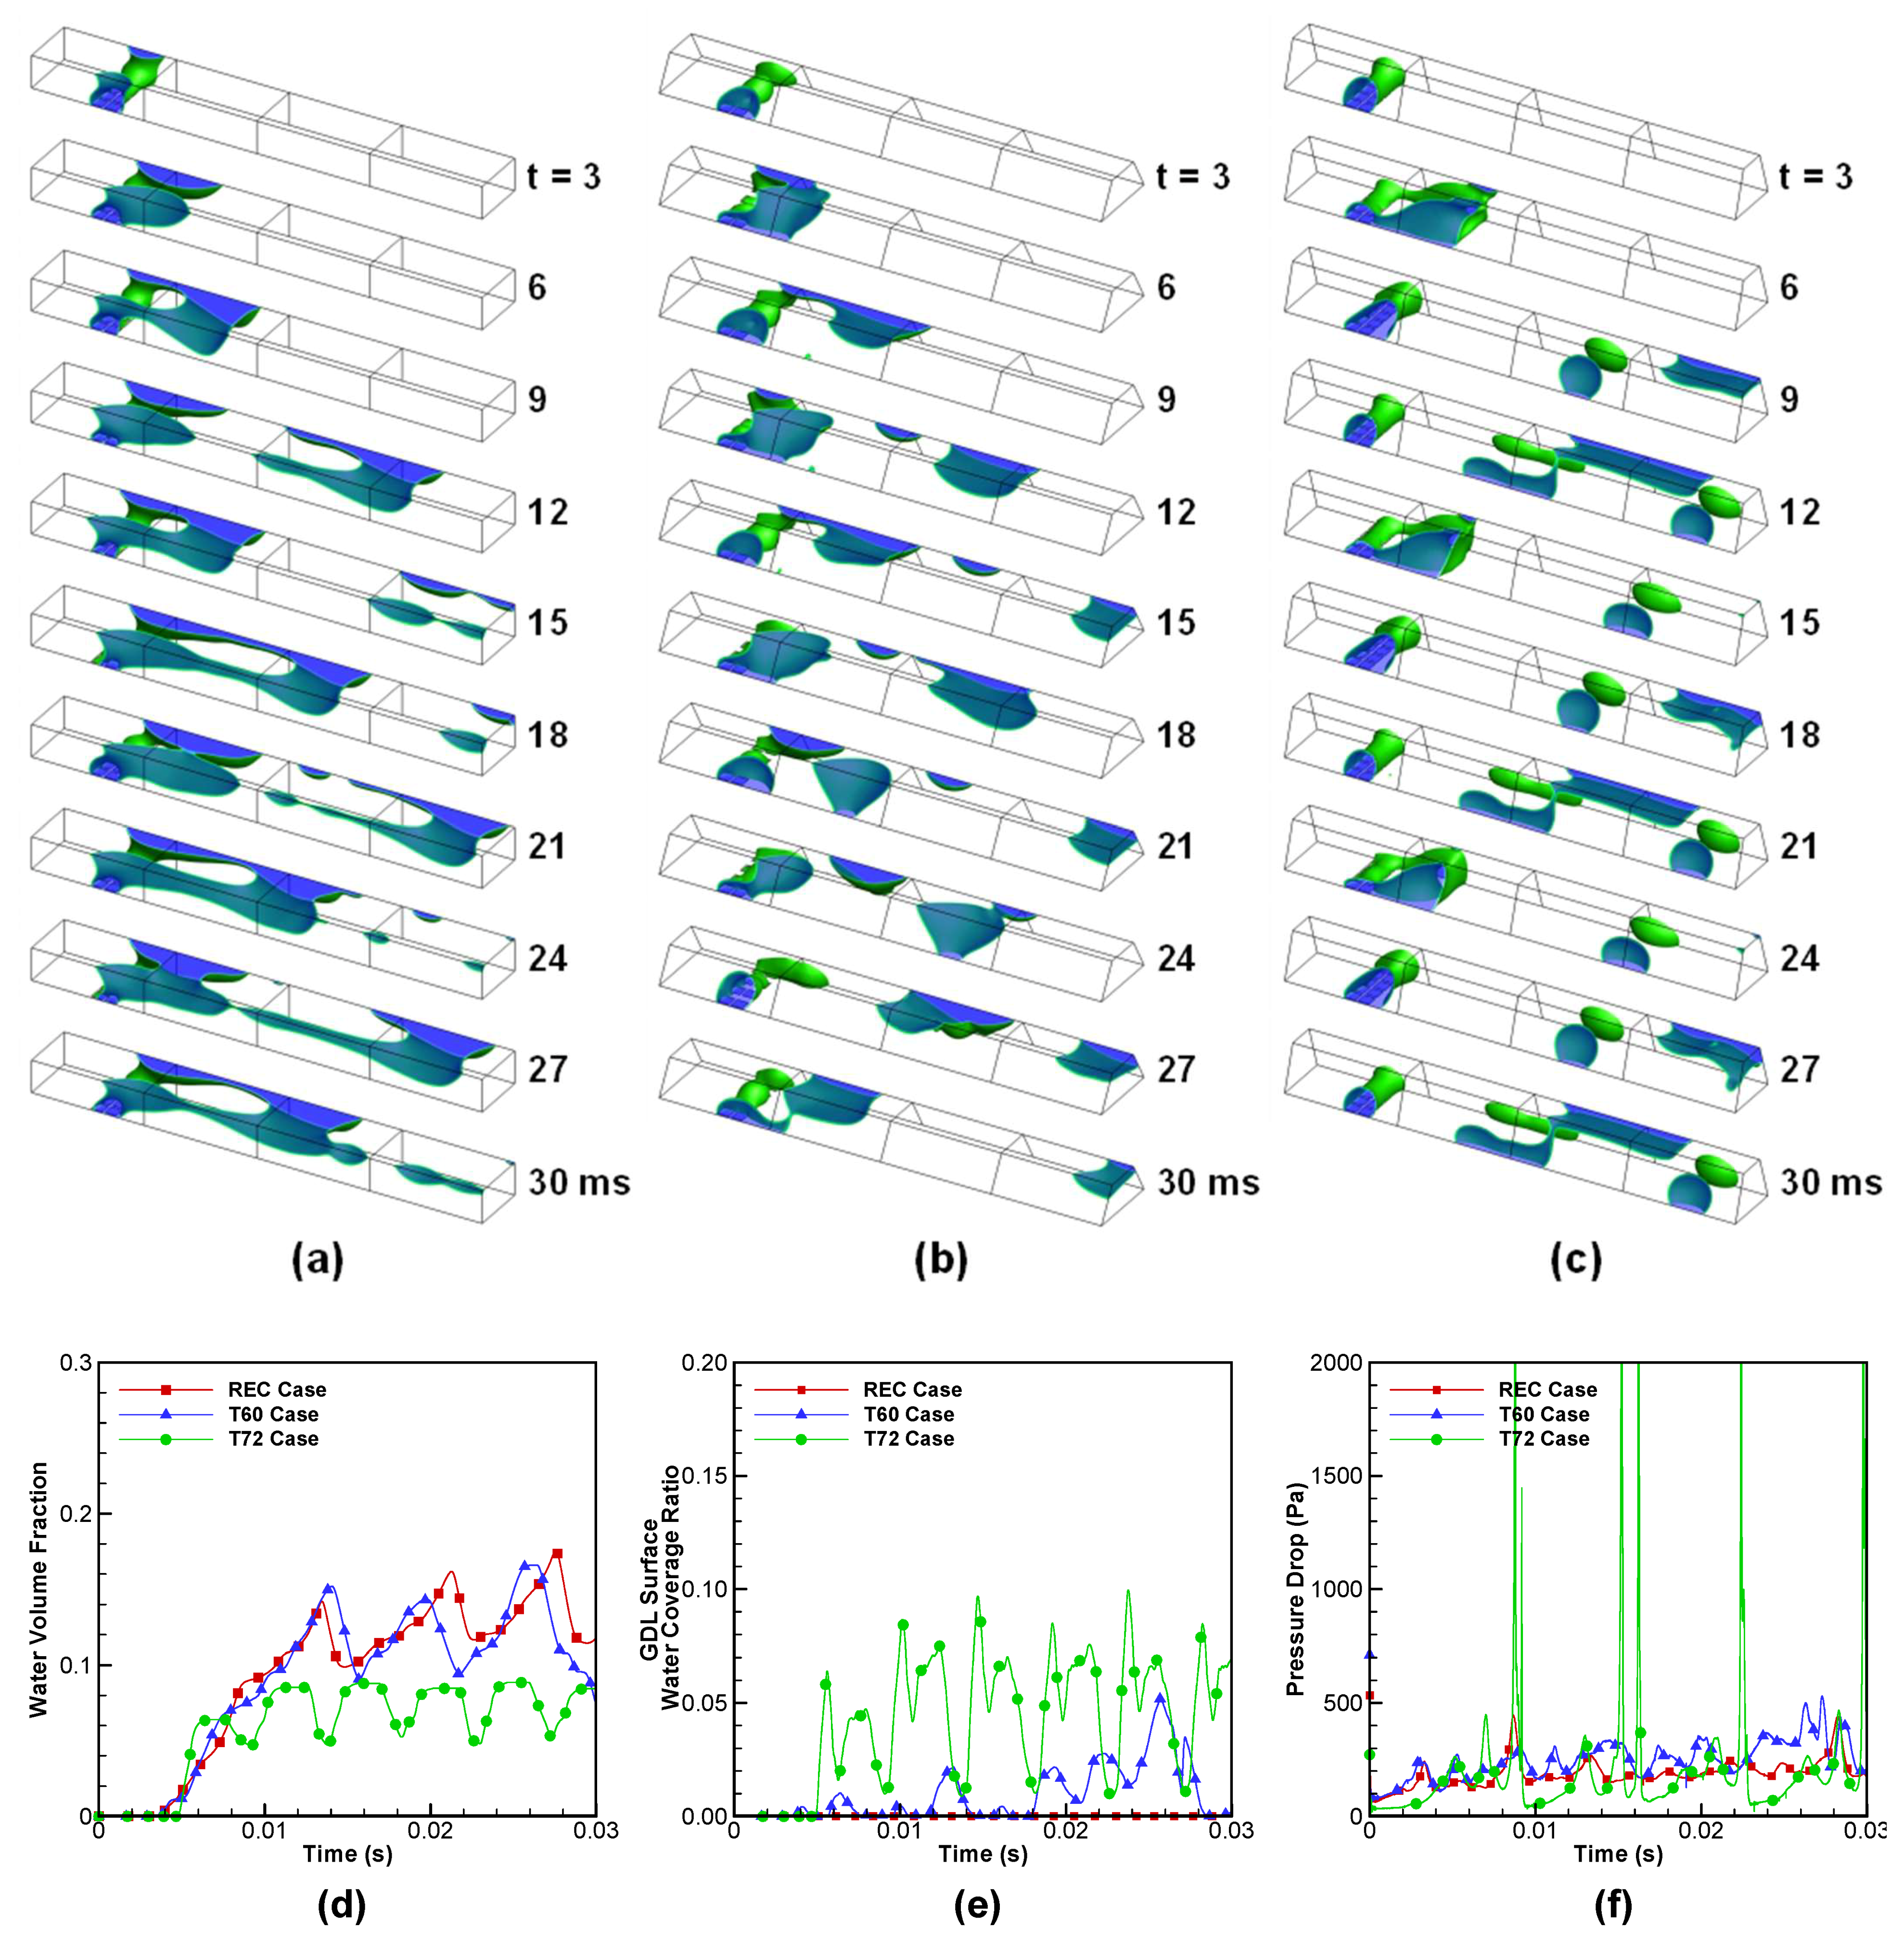
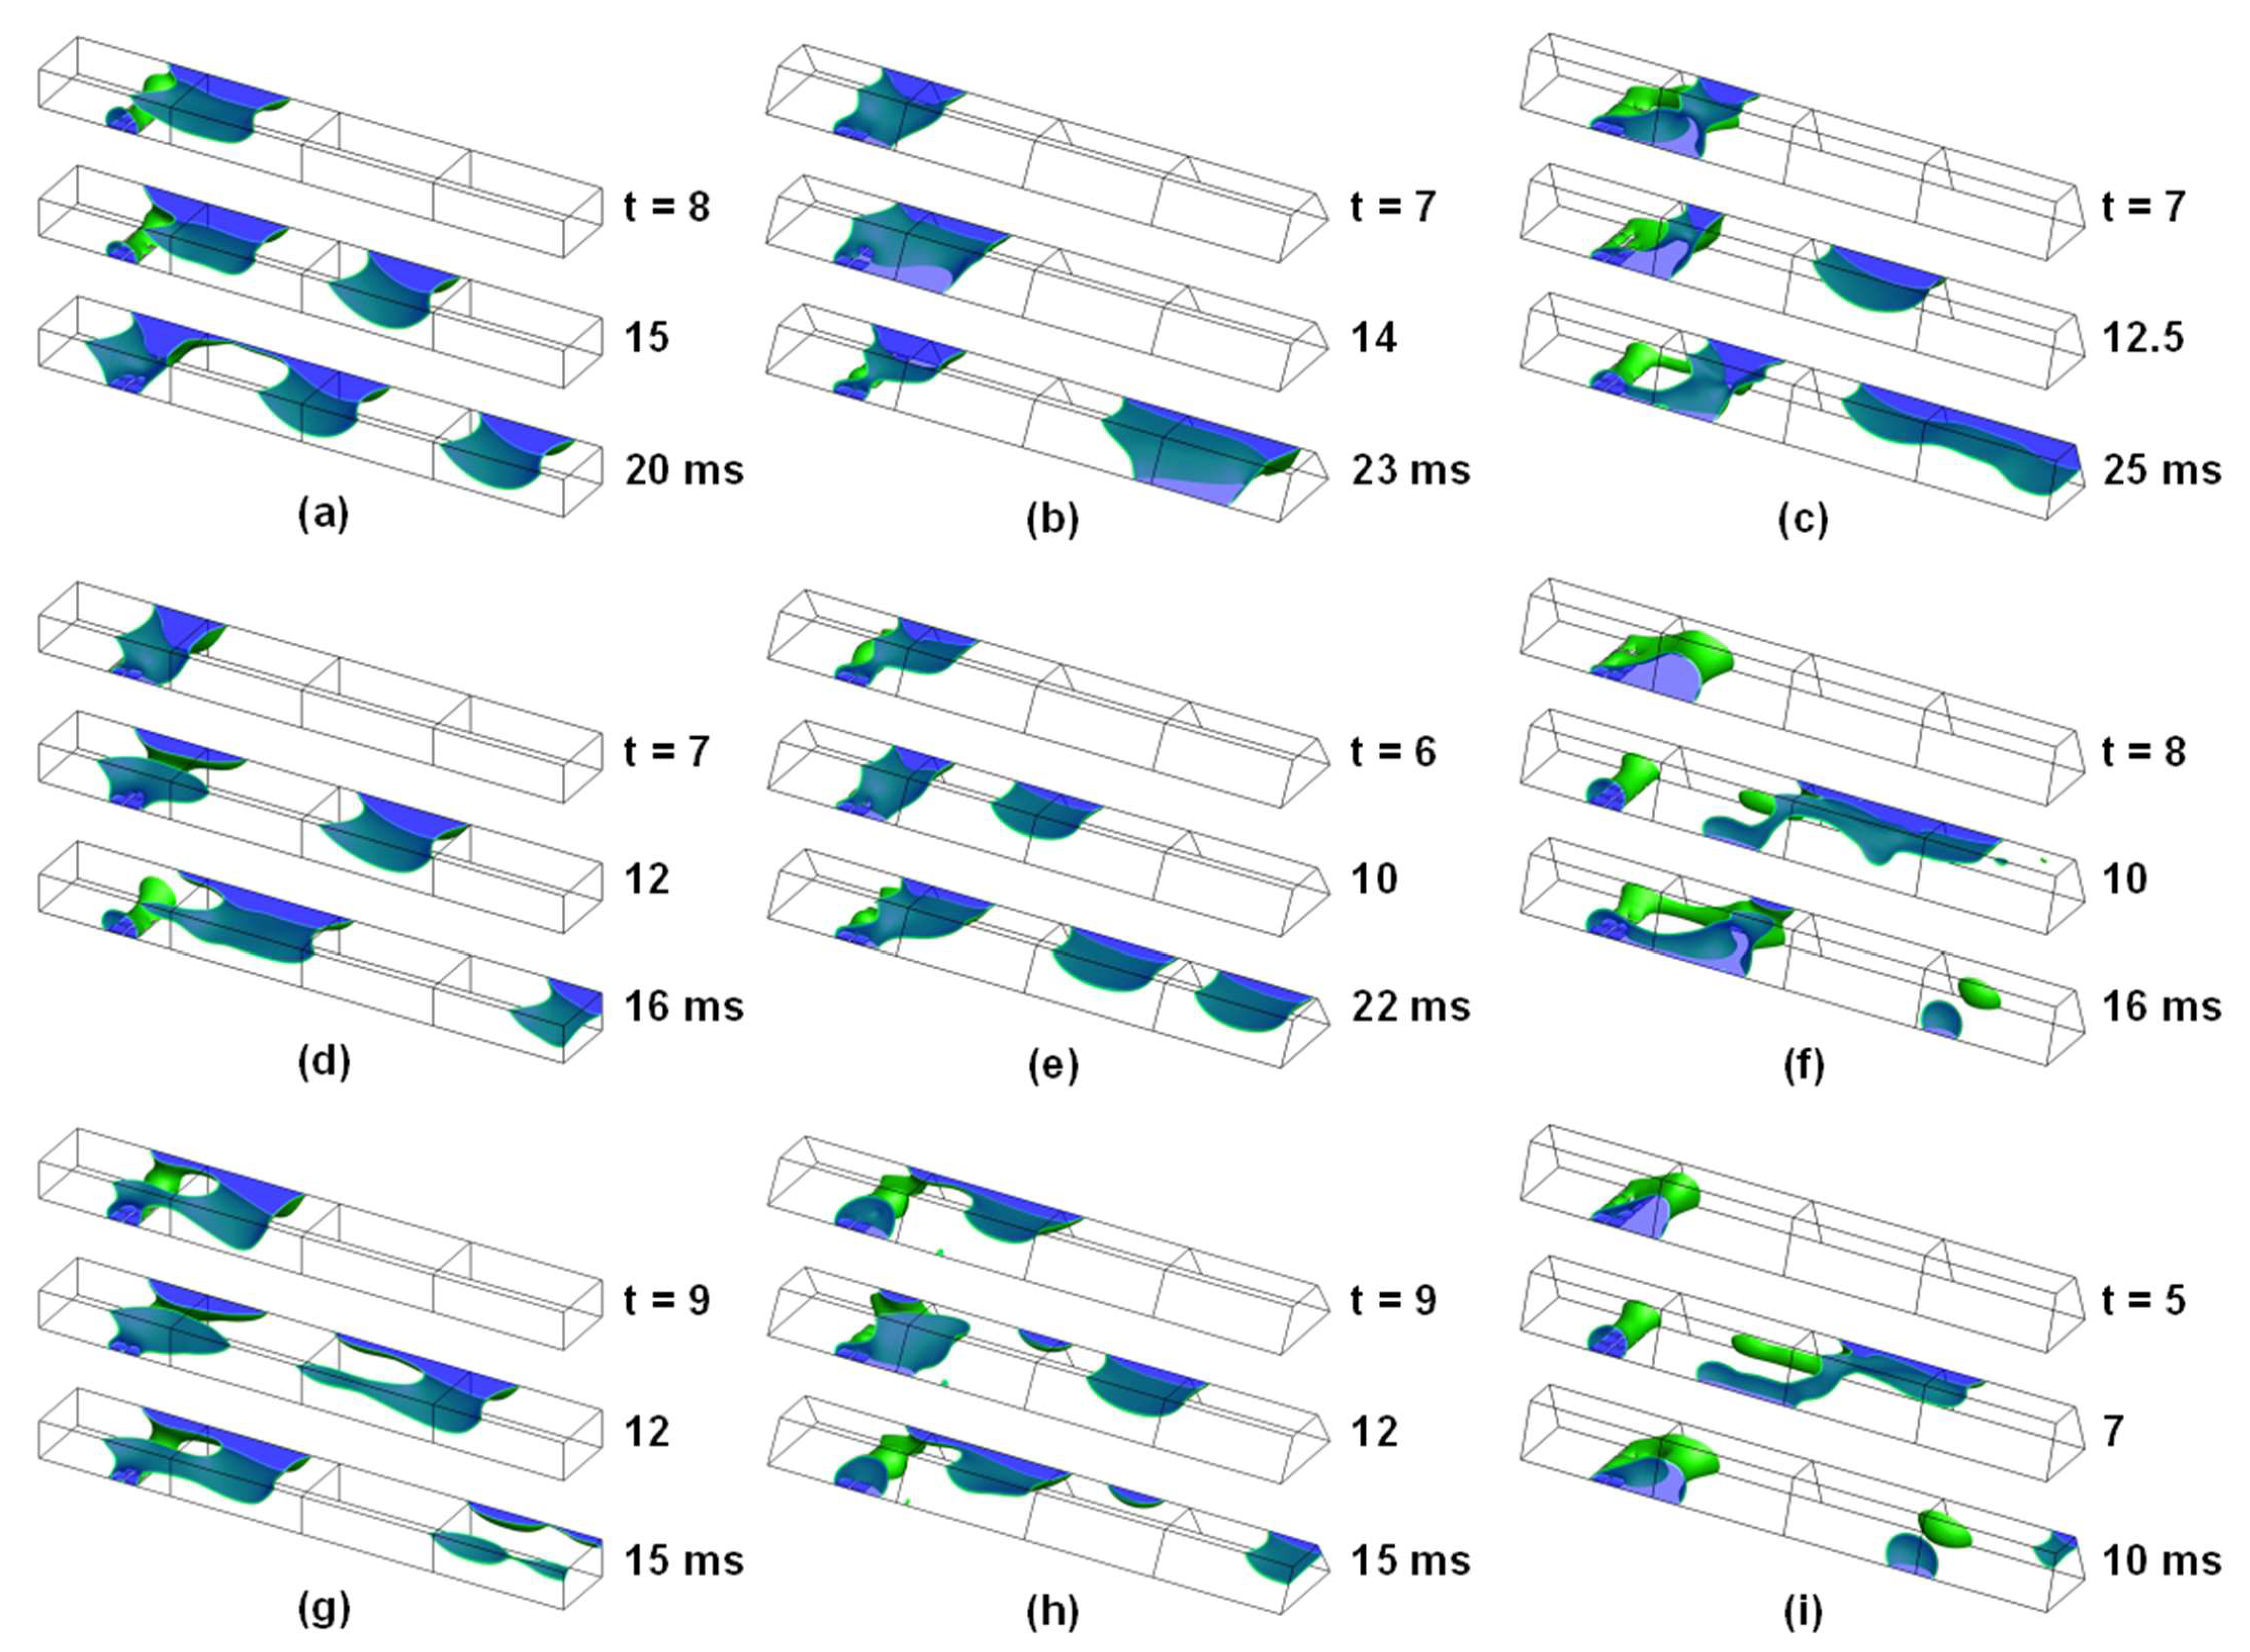
3.1. Temporal Evolution of Gas-Liquid Two-Phase Flow Pattern

When liquid water emerges through micro pores on the GDL surface, droplets appear, grow, merge, accumulate, and detach due to the combined effects of surface tension, pressure, shear, inertial, and gravitational forces [21]. Figure 2 shows the time evolution of the gas-liquid interface, WVF, GWCR, and pressure drop between the air inlet and the outlet for the REC, T60, and T72 configurations, respectively. In Figure 2a–c, the ten snapshot images of the gas-liquid interface with 3 ms interval are shown for V i n , a i r = 5.0 m·s−1, V i n , w a t e r = 0.1 m·s−1, θ t s = 60°, θ g = 130°, and the H12 water inlet configuration. In Figure 2a, liquid water emerges through 8 micro pores and merges on the GDL surface first. Then the water accumulates on the sidewall at t = 3 ms and climbs to the upper edges and the top wall at t = 6 ms. A water slug attached on the top wall moves toward the outlet due to the action of pressure and shear forces and leaves long tails along the upper edges at t = 12 ms. While a water slug exits through the outlet, a new water slug forms near the water inlet at t = 15 ms. As time passes by, water slug formation and movement toward the outlet repeats almost every 6 ms periodically. As most of the liquid water supplied attaches to the top wall while traveling along the GC for the REC configuration, GWCR in CV is almost zero in Figure 2e. In Figure 2b, the T60 configuration shows a similar two-phase flow pattern with the REC configuration. But the water slug attached on the top wall is smaller and moves a little faster than the REC configuration. Due to the trapezoidal cross-sectional shape, a relatively higher velocity in the upper part of the T60 GC cross section could promote faster slug movement. In Figure 2d, the REC and T60 configurations show similar temporal WVF profiles. In Figure 2c, the T72 configuration shows a somewhat different two-phase flow pattern compared to the REC and T60 configurations. Because the channel depth is higher, high pressure is built up in front of a large water slug before the accumulated liquid water moves to the top wall and then the water slug is quickly purged out through the outlet due to the action of strong pressure force. A water slug attached to the water inlet behaves like a variable sized valve in the GC cross section and the spike in the pressure difference is observed in Figure 2f for the T72 configuration. Due to the periodic purging action, the WVF of the T72 configuration is lower than the other two in Figure 2d. After the detachment from the water inlet, a water slug is split into two parts that one part attached to the top wall and the other moves along the side walls in Figure 2c. The GWCR of the T72 configuration shows higher values than the other two because some portion of liquid water travels along the GC attached to the side and GDL surfaces. The results of the T72 configuration can be explained by the observations of Owejan et al. [15] based on the neutron radiography method applied to operating PEM fuel cells. The larger slugs blocking the GC are regularly removed by the pressure drop they induce, which results in the lower average water mass in the GC at a given current density [15]. In contrast, the smaller and shattered slugs tend to remain in the GC since the pressure drop required to purge these small liquid droplets is not produced.

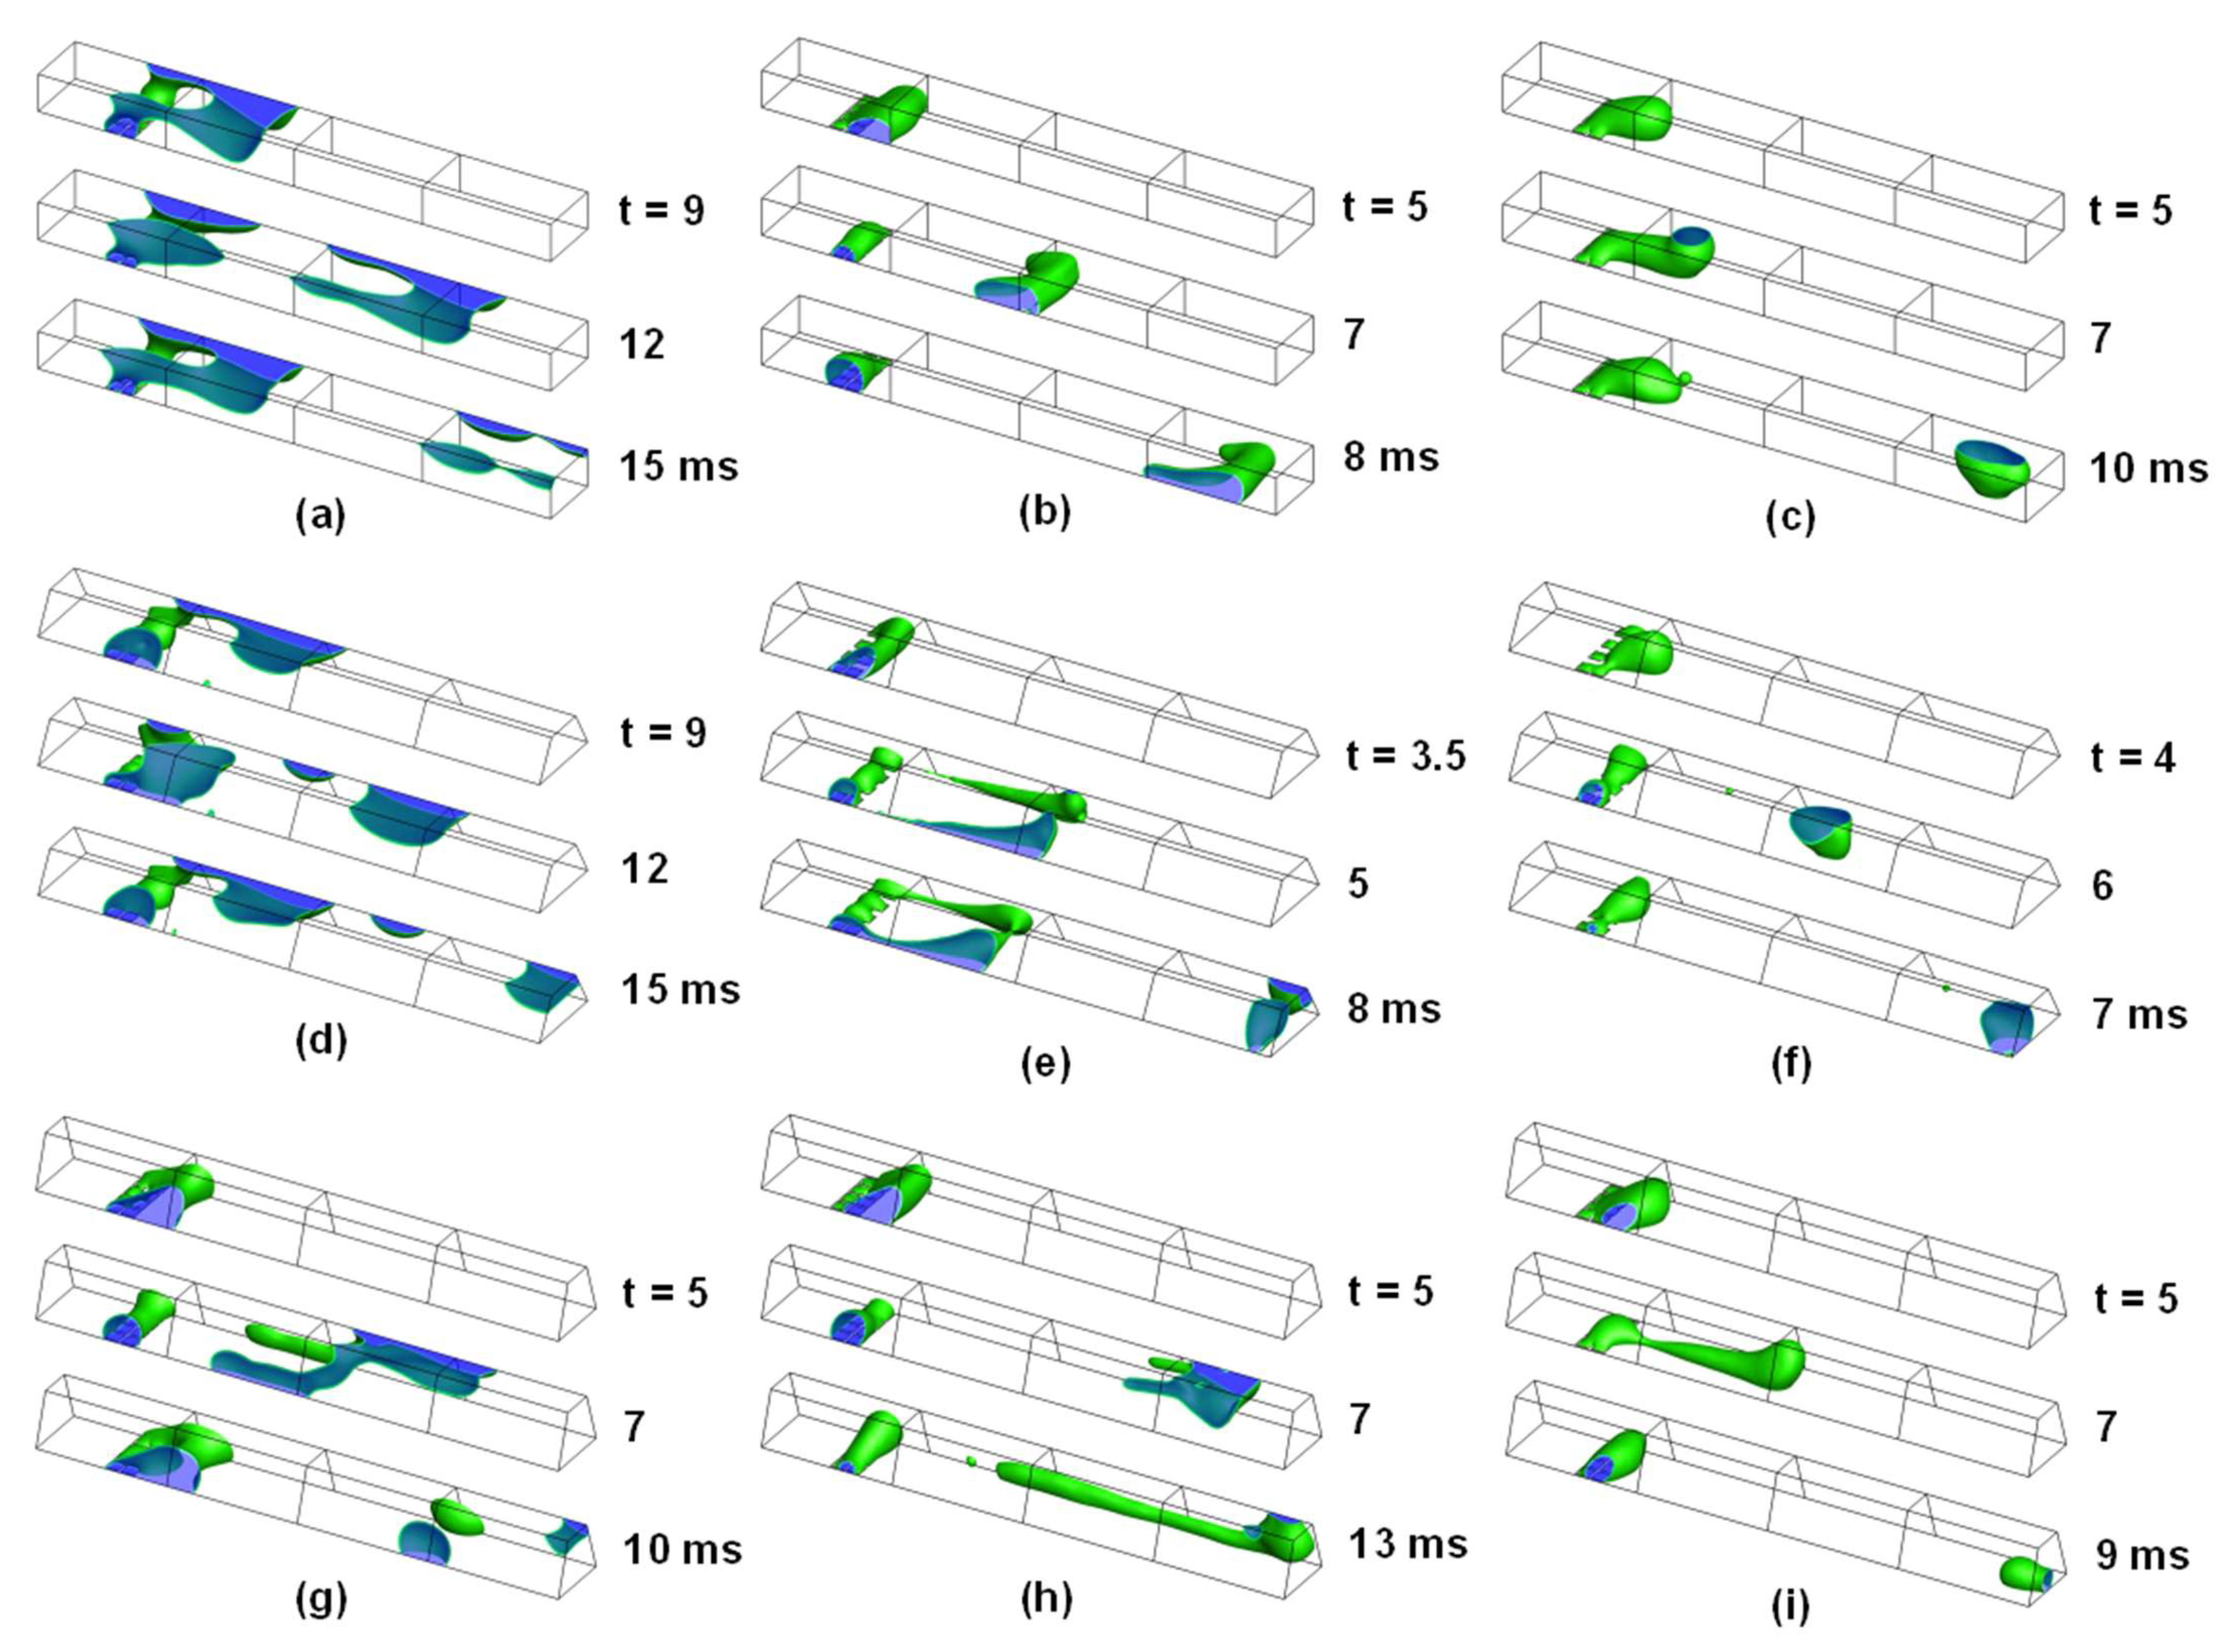
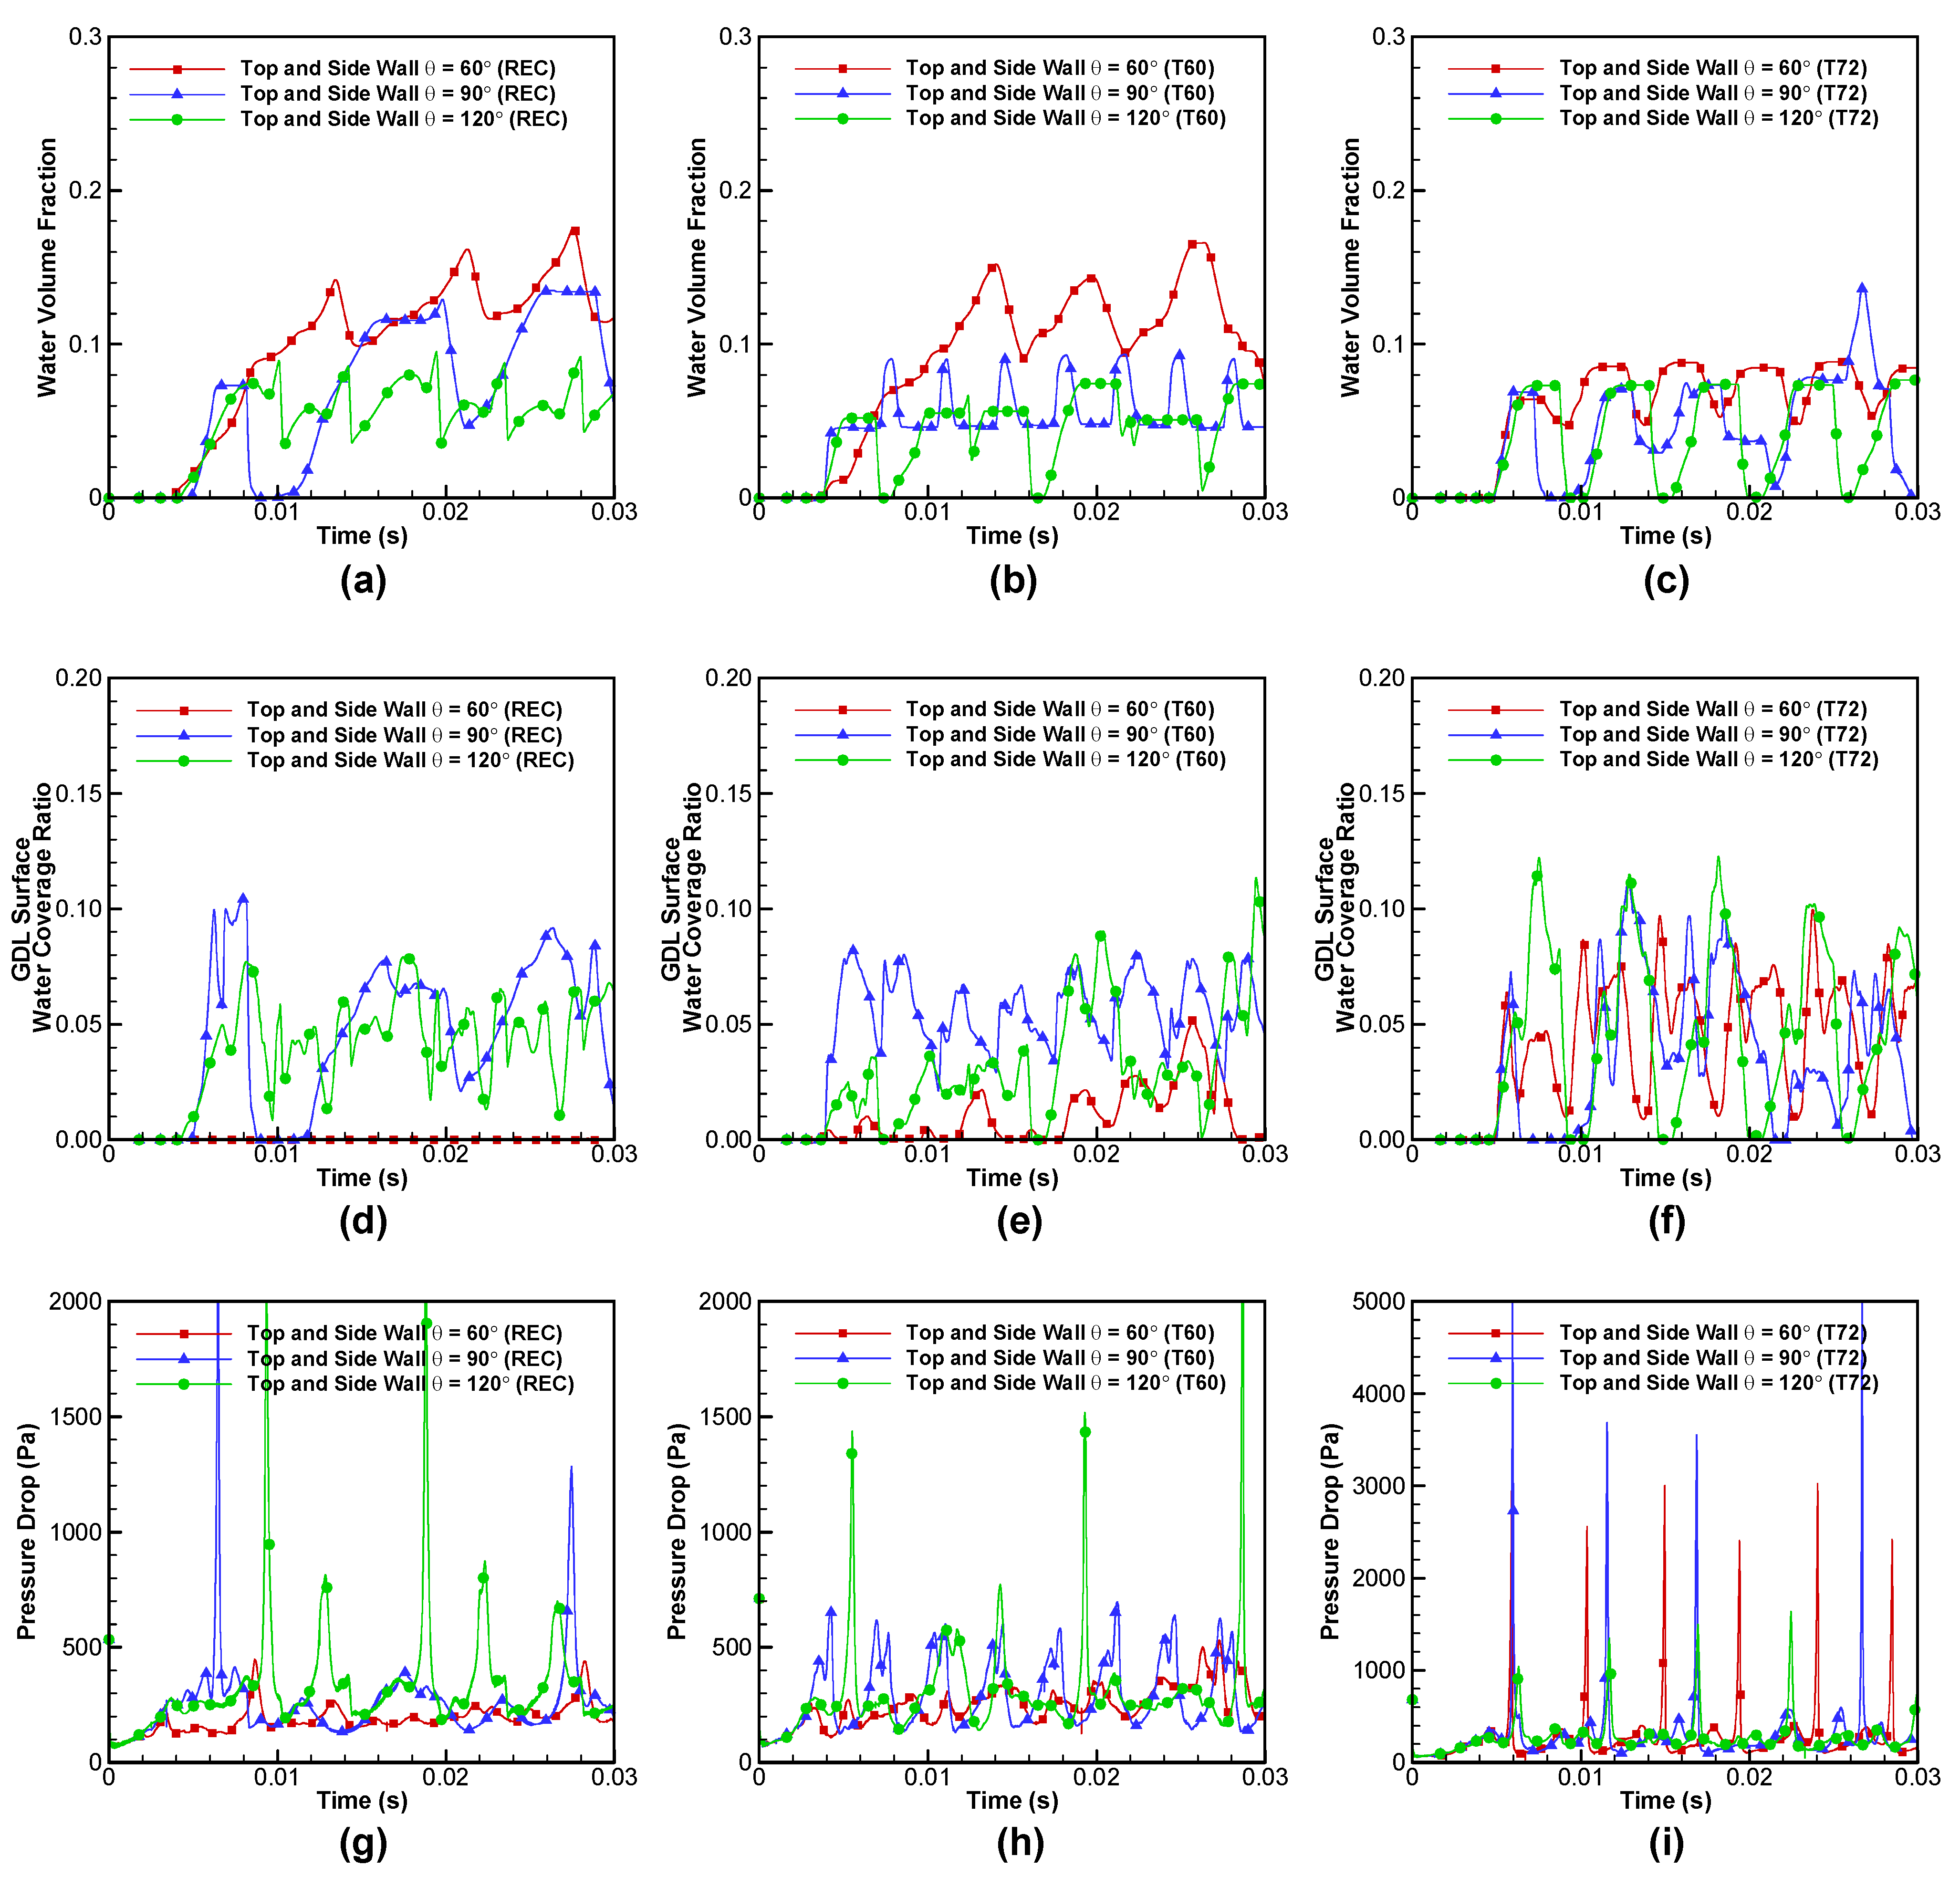
3.2. Effect of Surface Contact Angle of Top and Side Walls

The water droplet dynamics inside a GC of a PEM fuel cell are intrinsically nonlinear and very complex due to the influence of channel wall wettability, surface roughness, channel geometric factors, inlet air velocity profile, relative humidity of supplied air, gravity, and the micro structure of GDL. The contact angle of channel walls is very important as the surface tension force is relatively stronger than the inertial force in micron sized GCs. Several experimental and numerical investigations have been performed to study the effect of channel wall wettability on the two-phase flow patterns [5,6,7,8,15,16,17,18,19,20,21,32,34]. A hydrophobic GDL surface is reported to be advantageous in removing liquid water from the GDL surface and supplying sufficient oxygen to the cathode reaction sites [7,8,20]. However, the recommended contact angle of top and side channel walls for effective water removal changes depends on other parameters including GC geometry. Lu et al. reported that hydrophilic channel wall cases result in a more uniform water distribution, a more regular flow distribution, and more film flow features compared to uncoated and hydrophobic channel walls based on ex situ PEM fuel cell experiments [17]. In this regard, Lu et al. recommended hydrophilic channel walls which would have more stable performance than neutral or hydrophobic channel walls. Figure 3 shows the time evolution of the gas-liquid interface for the different static θ t s when V i n , a i r = 5.0 m·s−1, V i n , w a t e r = 0.1 m·s−1, θ g = 130°, and H12 water inlet configuration is used. Figure 4 shows the corresponding WVF, GWCR, and pressure drop. In Figure 3b, a water slug detached from the water inlet does not climb to the upper edges and the top wall due to the neutral wettability of the side walls for the REC configuration. As the size of a water slug is relatively large and moves on the GDL surface, the WVF shows large oscillations as the water slug periodically exits through the outlet in Figure 4a. As θ t s increases to 120° in Figure 3c, a rounded shape slug is formed in the center of the GC for the water liquid does not attached to the side walls. As the size of the slug grows, the slug clings to the top wall and moves toward the outlet. For θ t s = 90° (REC) and θ t s = 120° (REC) cases in Figure 3b–c, water slugs block the GC cross section and produce spikes in the pressure drop in Figure 4g in contrast to θ t s = 60° (REC) case in Figure 3a in which most of the water is traveling to the outlet while attached to the top wall and upper edges. The T60 configuration shows a similar behavior with the REC configuration while changing θ t s in Figure 3 and Figure 4. The θ t s = 90° (T60) case in particular shows very stable oscillatory patterns in the WVF, GWCR, and pressure drop. For the T72 configuration, the water droplet dynamics are very similar to each other for the three θ t s cases as shown in Figure 4c,f,i. Large slugs are formed near the water inlet and the increased pressure spikes quickly purge out the slugs in Figure 3g–i.

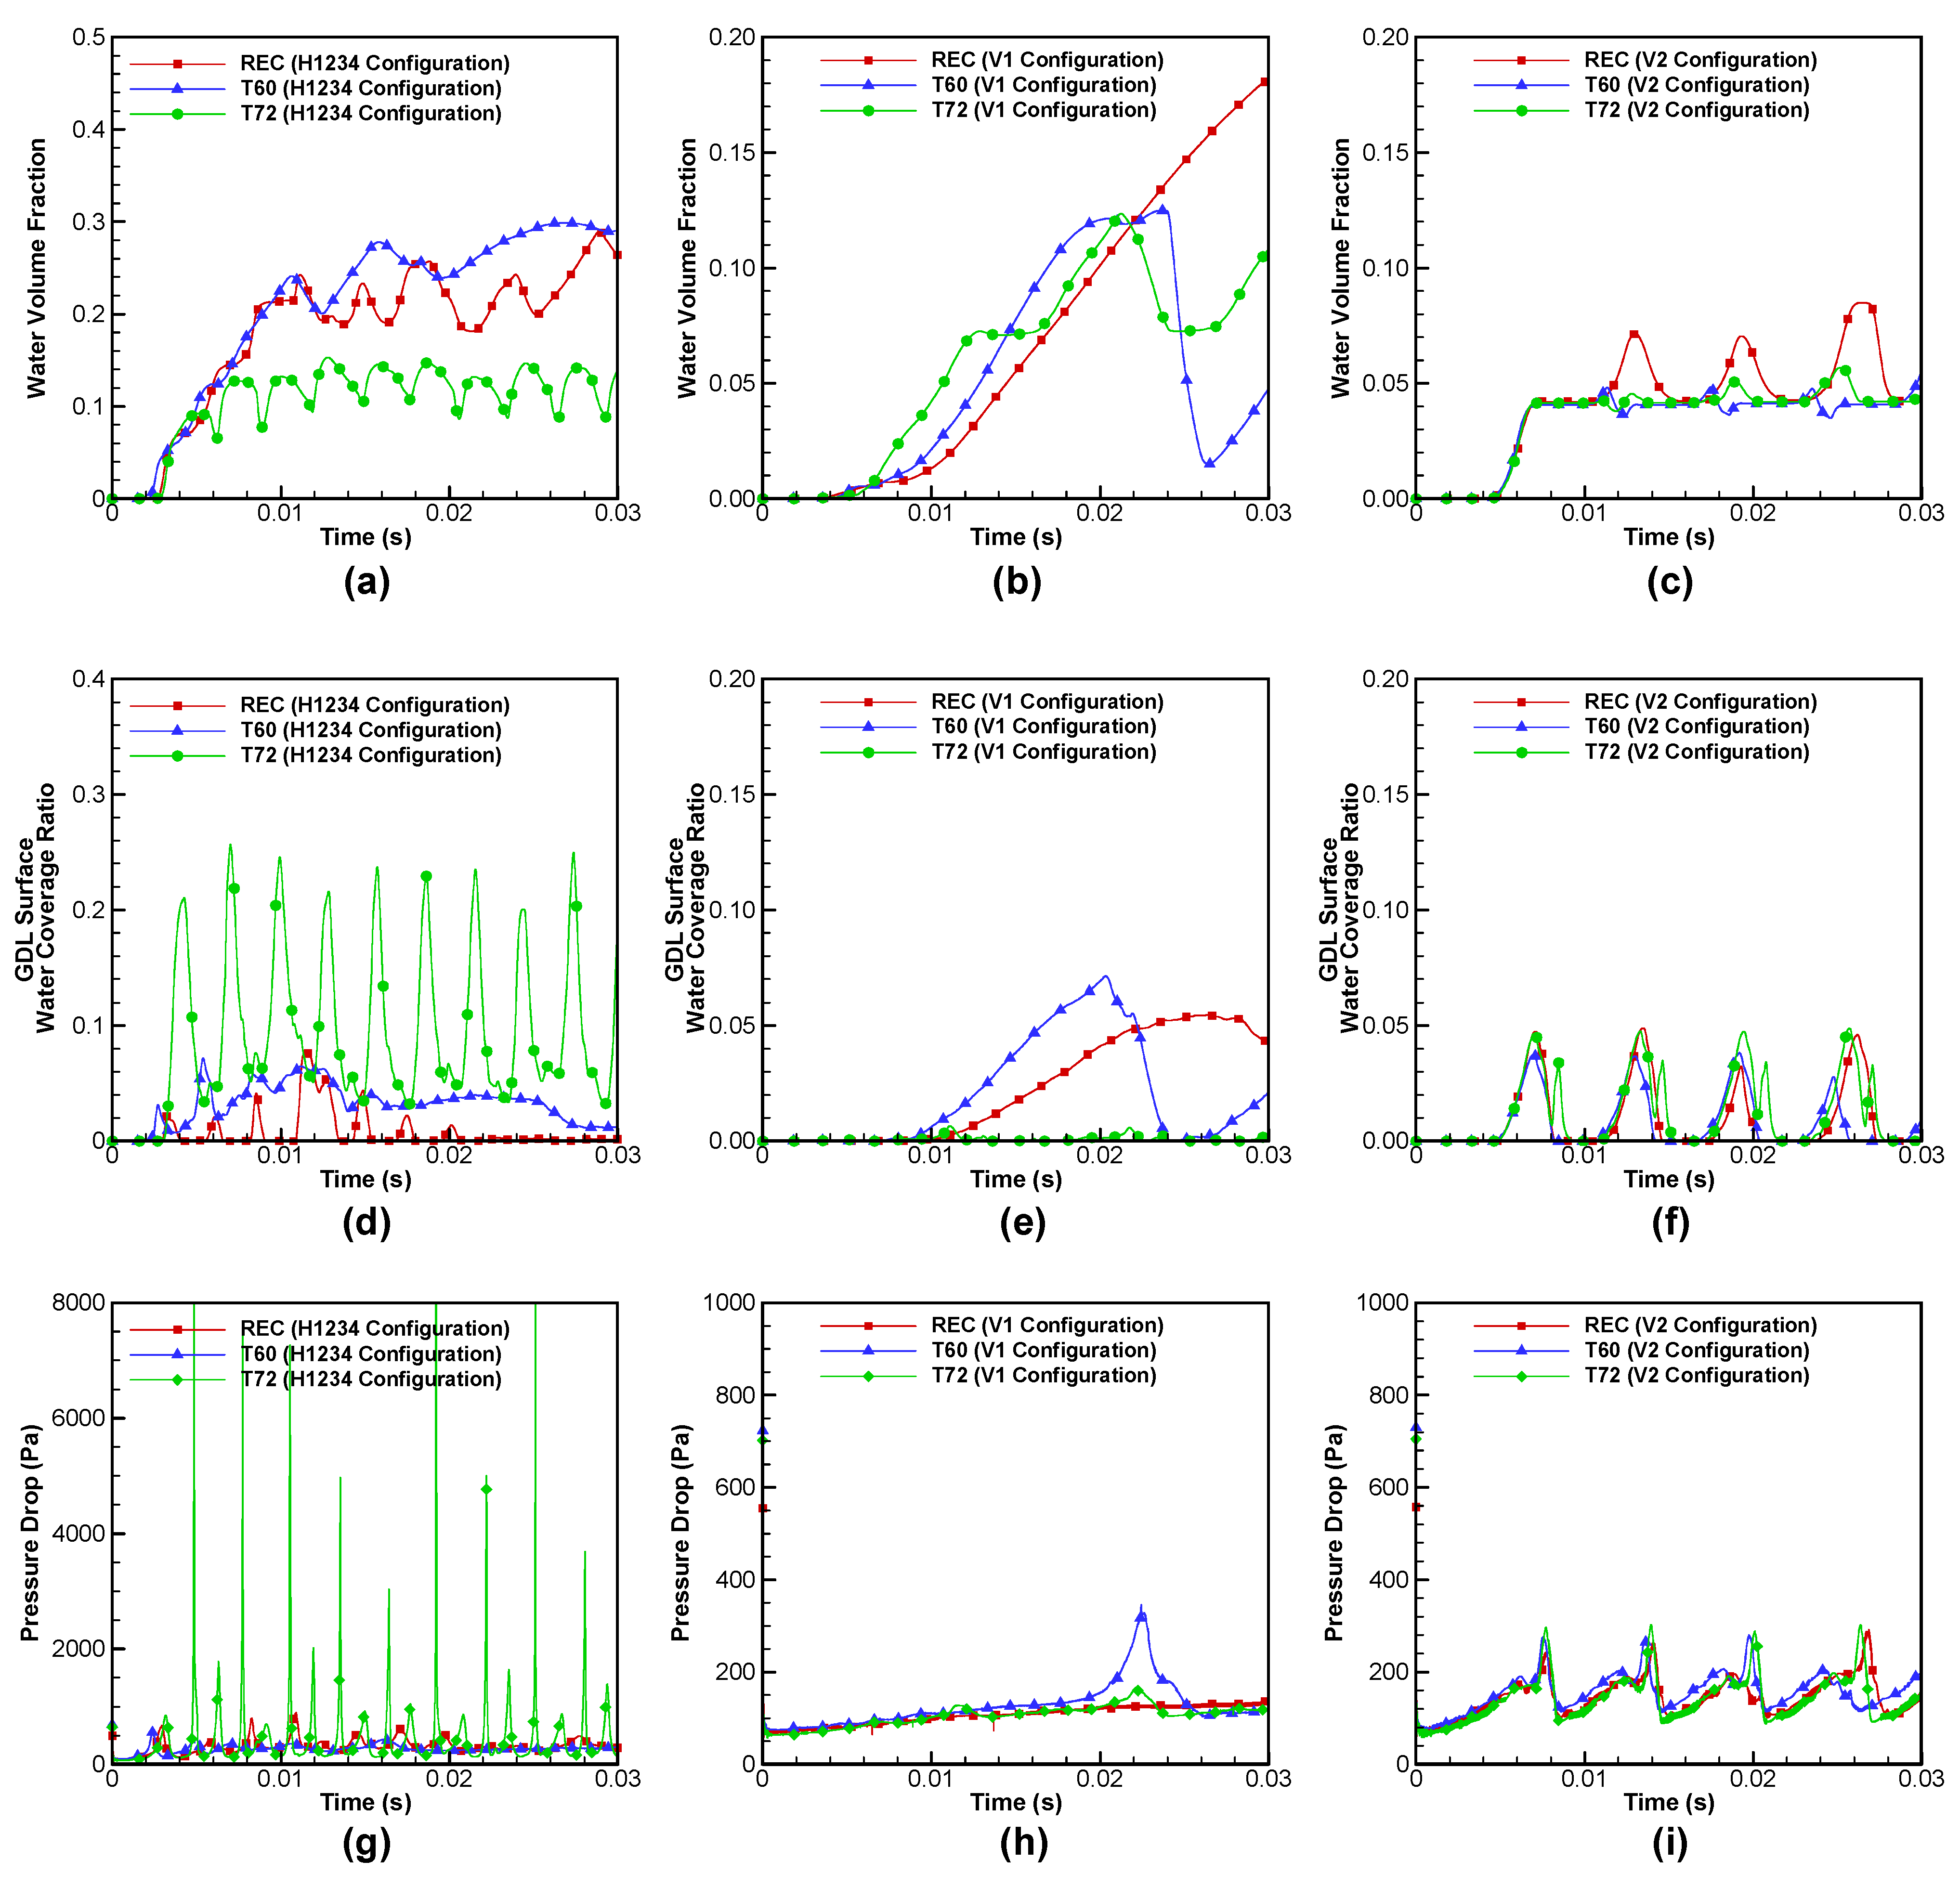
3.3. Effect of Water Inlet Configuration

To study the effect of distribution patterns of accumulated water in the GC, the four different water inlet configurations are used. In addition to the results of the H12 configuration in Figure 2, those of the H1234, V1, and V2 configurations are shown in Figure 5 and Figure 6. The H1234 configuration in Figure 5a–c represents cases with a doubled water generation rate compared to the H12 configuration in Figure 2a–c. Although the amount of supplied water is doubled, the gas-liquid interface, WVF, GWCR, and pressure drop are similar for all the three cross-sectional shapes. The amount of water supply does not change the patterns of water droplet dynamics. Figure 5d–f show the results of the V1 configuration, which represent a situation where water generation is concentrated along the side wall. For the REC (V1) configuration, the water is tightly attached to the side wall, forms a thick film, and produces the worst-case scenario in Figure 5d. For the T60 (V1) configuration, a water slug is detached around t = 21 ms, moves to the top wall, and then exits the outlet around t = 25 ms in Figure 5e. For the T72 (V1) configuration, a water slug attaches to the side wall, moves to the top wall, and then travel along the top wall toward the outlet. For the V1 water inlet configuration, the T72 configuration shows the best water removal characteristics in Figure 6b,e,h. Figure 5g–i show the gas-liquid interface for the V2 configuration where water is supplied near the center of the GC. The behavior of the water dynamics is almost identical irrespective of the GC cross-sectional shapes in Figure 5g–i and Figure 6c,f,i as the water does not interact with the side walls. To compare the statistical behavior, the mean, standard deviation, and maximum values of WVF, GWCR, and pressure drop for some selected simulation cases are given in Table 3.

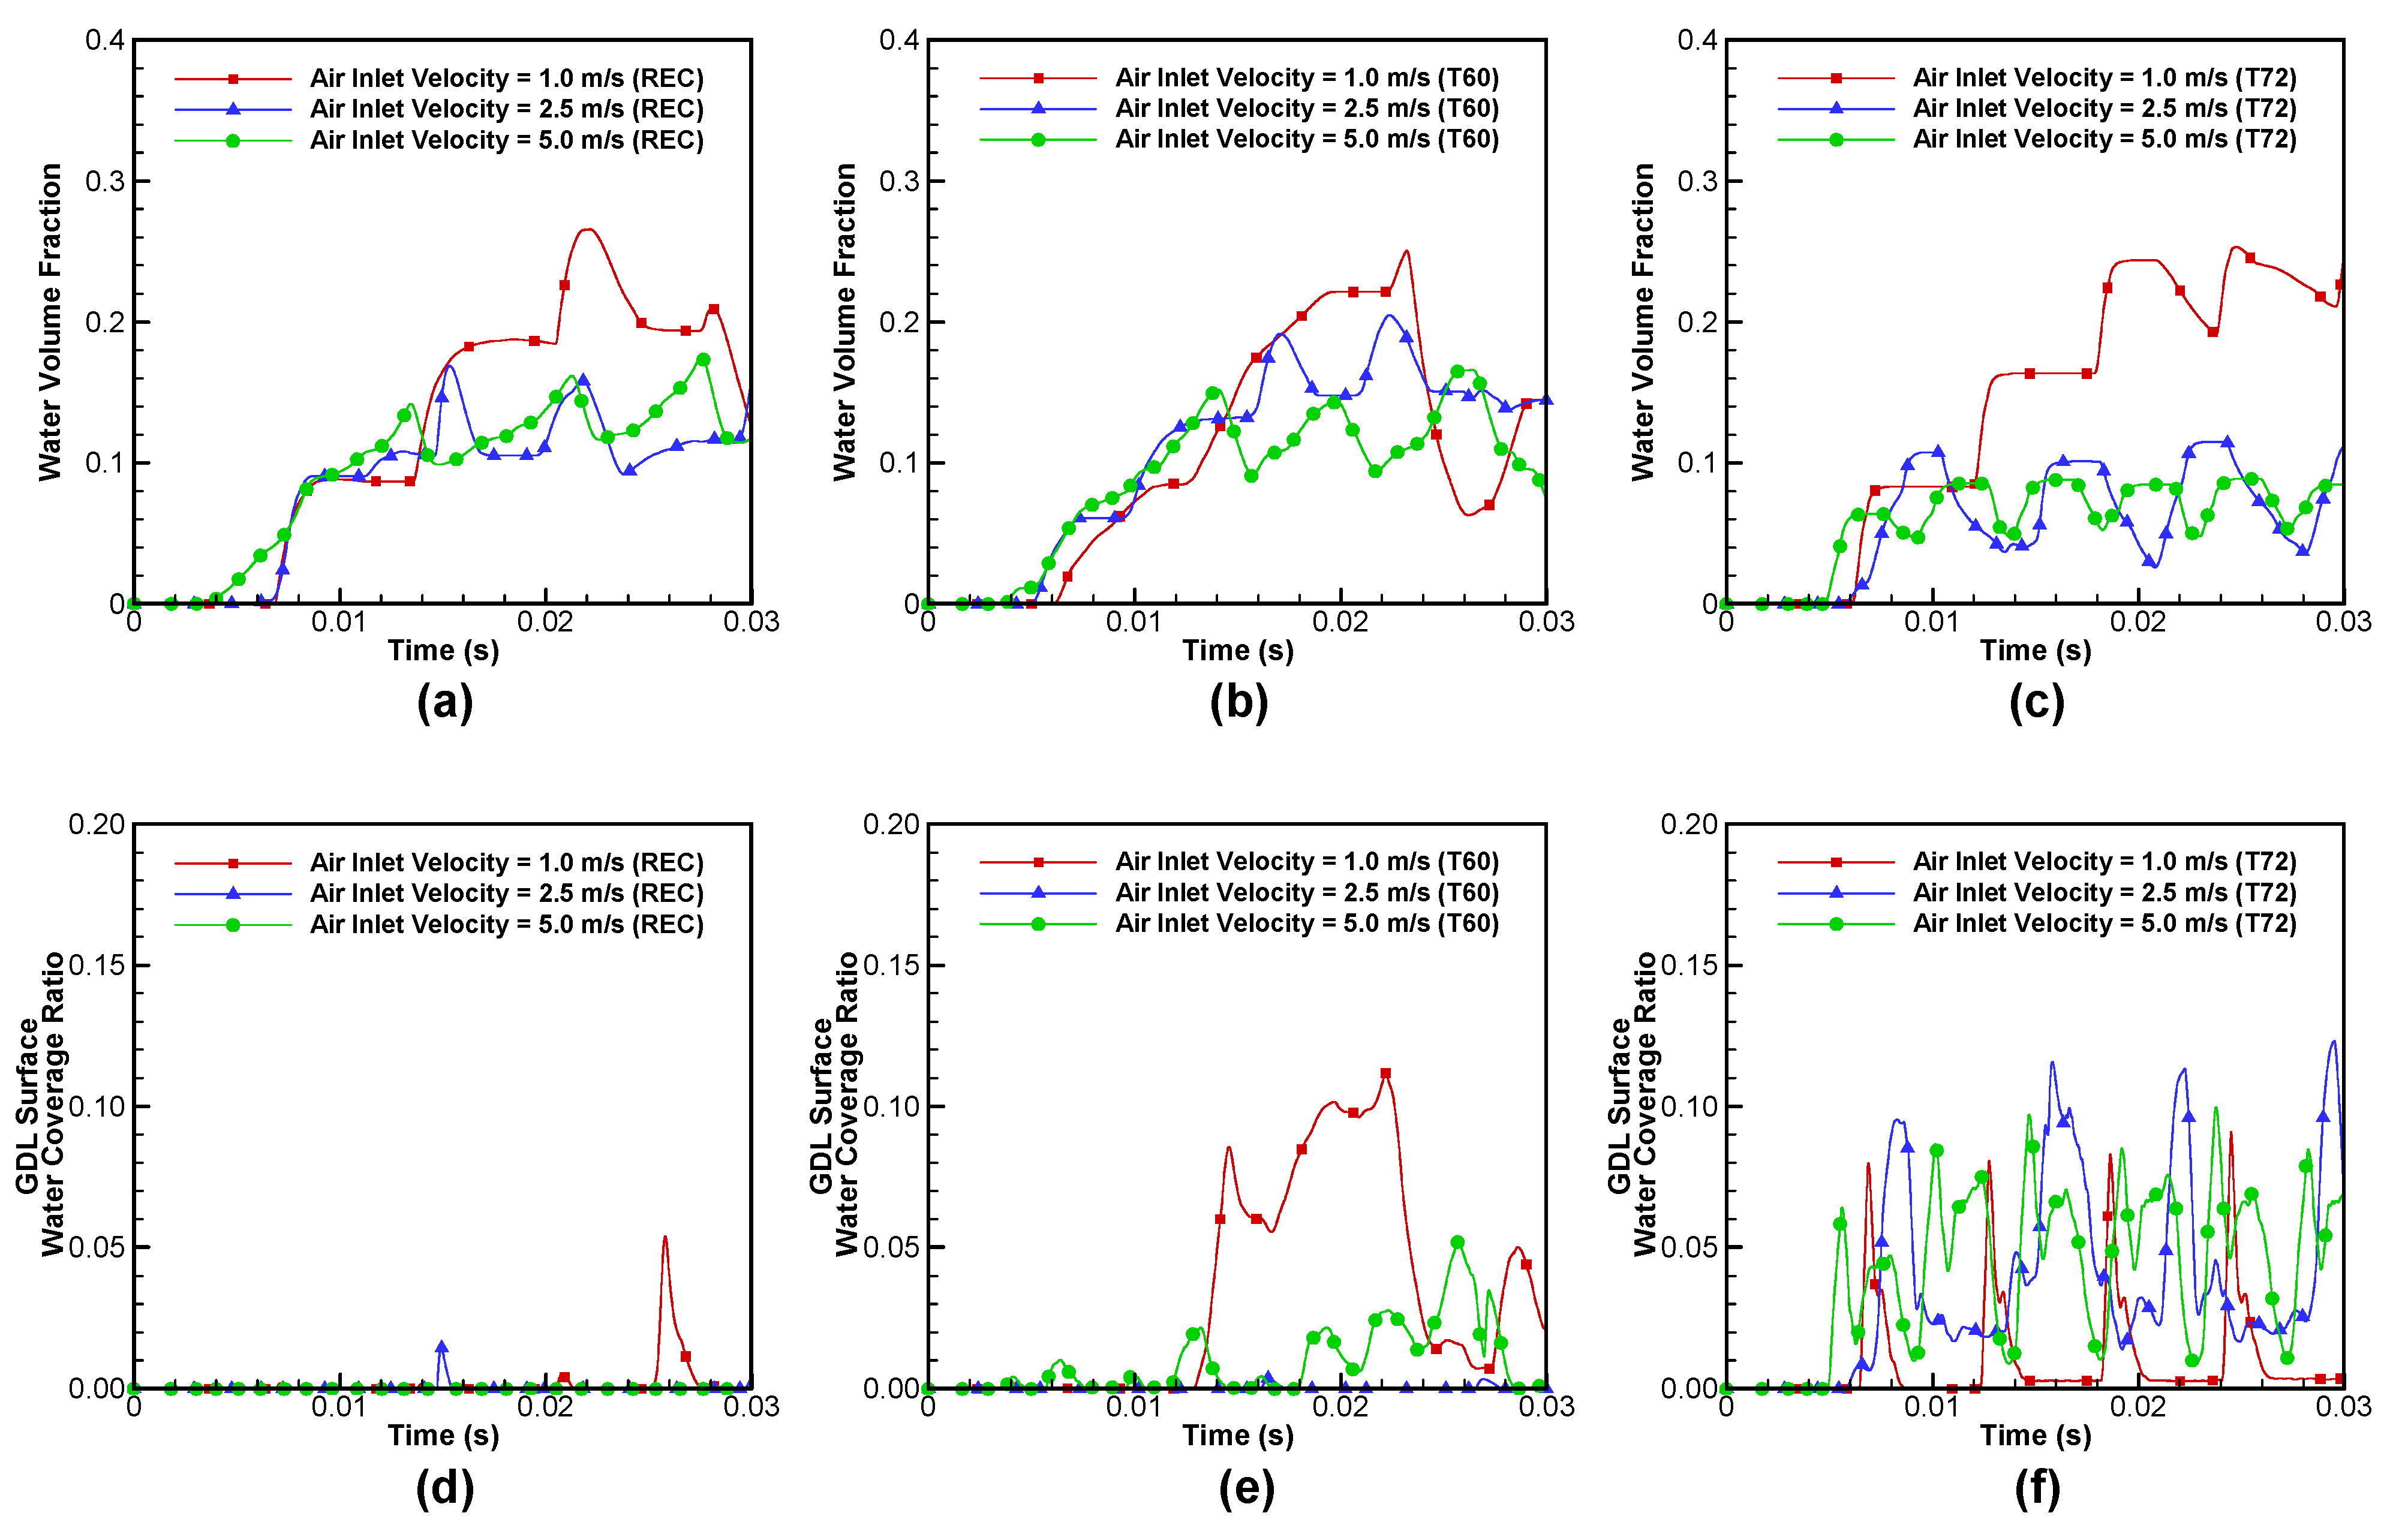
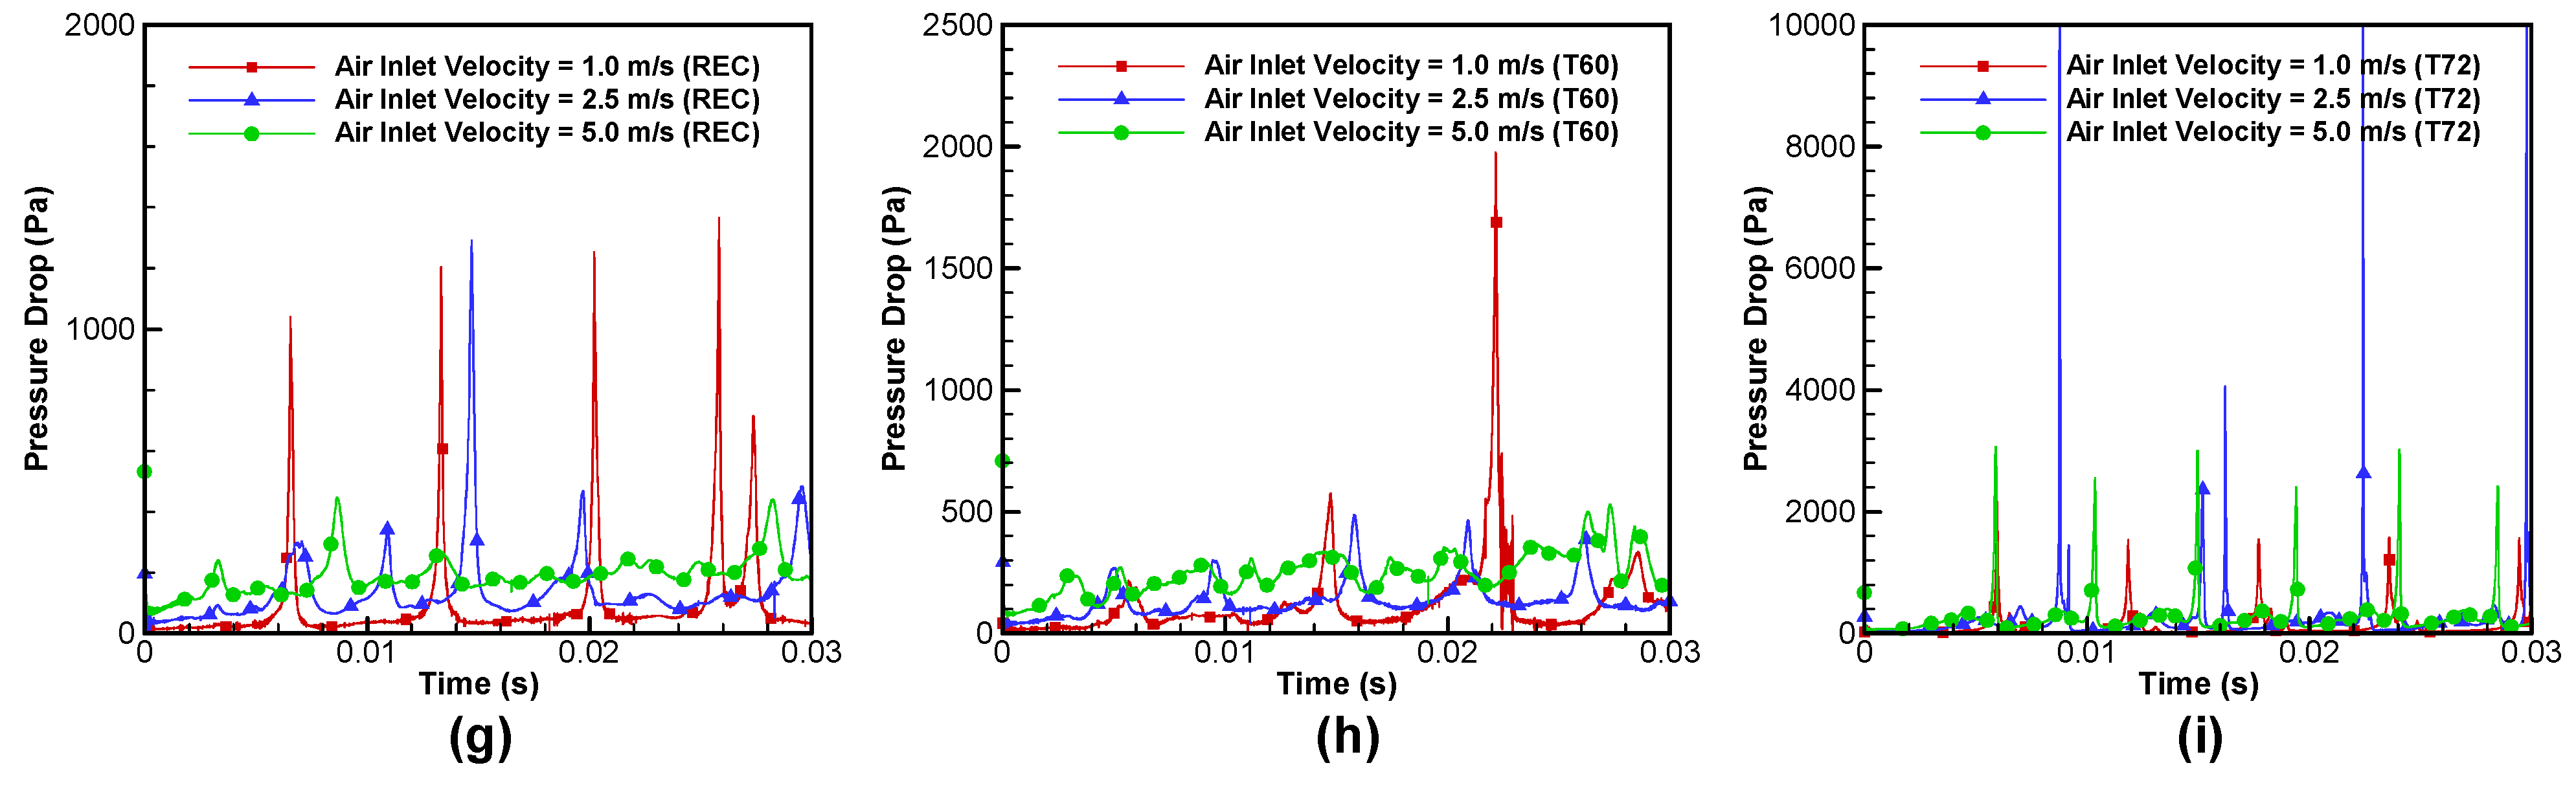
3.4. Effect of Air Inlet Velocity

Figure 7 and Figure 8 illustrate the effect of the air inlet velocity. For the REC, T60, and T72 configurations, water slugs move faster and have smaller sizes as the air inlet velocity increases. Due to the increased size of water slugs, the pressure drop shows several spikes for V i n , a i r = 1.0 m·s−1 and V i n , a i r = 2.5 m·s−1 for the REC configuration in Figure 8g. For the T72 configuration, the particularly notable pressure drop spikes are observed for all the inlet velocities in Figure 8i.

4. Conclusions

The dynamics of liquid water in a straight GCs with the rectangular sections, trapezoidal sections with open angles of 60°, and trapezoidal sections with open angles of 72° channel cross sections with the same cross-sectional area is investigated via the VOF method. The effects of the contact angle of the top and side walls, the water inlet configuration, and the air inlet velocity are studied based on the temporal evolution of gas-liquid interface, the water volume fraction, the water coverage ratio of the GDL surface, and the pressure drop between the air inlet and the outlet. The main conclusions can be summarized as follows.
(1)
For the hydrophobic GDL surface and the hydrophilic top and side walls, the trapezoidal channel with open angles of 72° provides the lowest water volume fraction and the water coverage ratio of the GDL surface around 7% due to the action of periodic pressure spikes. The other two cases show a higher water volume fraction and a lower water coverage ratio of the GDL surface as most of liquid water moves along the channel while attached to the top wall.
(2)
As the contact angle of top and side walls increases from 60° to 120°, the patterns of liquid water dynamics become similar for all the three cross-sectional shapes. In particular, the trapezoidal cross section with open angles of 72° produces similar results irrespective of the contact angle of top and side walls.
(3)
When the liquid water emergence is concentrated along the side wall, the trapezoidal cross section with open angles of 72° shows the best water removal characteristics.
(4)
For all the three channel cross-sectional shapes, water slugs move faster and have smaller sizes as the air inlet velocity increases.
The conclusions of this study are more likely to be applicable to the parallel flow field configuration as a single straight gas channel is considered. To further expand the validity of the simulation results, more complex gas channel geometries which include several bent sections or the whole gas channel need to be investigated. In addition, the gas-liquid two-phase flow inside the GDL can be simulated together with the GC fluid flows for a more accurate modeling instead of water inlet pores on the GDL.

Author Contributions

Conceptualization, W.T.K.; Investigation, J.H.K.

Acknowledgments

This work was supported by the Human Resources Development Program (No. 20154030200940) of the Korea Institute of Energy Technology Evaluation and Planning (KETEP) grant funded by the Korean Government Ministry of Trade, Industry and Energy. This research was also supported by the Basic Science Research Program through the National Research Foundation of Korea (NRF), funded by the Ministry of Education, Science and Technology (Grant No. 2010-0006892).

Conflicts of Interest

The authors declare no conflict of interest.

Nomenclature

CoCourant number
F Momentum source term related to surface tension, N·m−3
g Gravitational acceleration vector, m·s−2
GCGas channel
GDLGas diffusion layer
GWCRWater coverage ratio at the GDL surface
n Unit normal vector at the interface
p Static pressure, N·m−2
PEMPolymer electrolyte membrane
ReReynolds number
ReairReynolds number at the air inlet
RewaterReynolds number at the water inlet pore
RECRectangular channel cross section
sStandard deviation
tTime, s
T60Trapezoidal channel cross section with open angles of 60 degrees
T72Trapezoidal channel cross section with open angles of 72 degrees
u Velocity vector, m·s−1
u 2 Velocity vector of the liquid phase, m·s−1
V i n , a i r Air inlet velocity, m·s−1
V i n , w a t e r Water inlet velocity, m·s−1
WCRWater coverage ratio
WVFWater volume fraction
x Position vector, m
Greek Symbols
α 1 Volume fraction of the gas phase
α 2 Volume fraction of the liquid phase
α q Volume fraction of qth fluid
Γ Gas-liquid interface
δ Three-dimensional Dirac delta function
κ Surface curvature of the gas-liquid phase
θContact angle, degrees
θ g Contact angle at the GDL surface, degrees
θ t s Contact angle at the top and side wall surfaces, degrees
μ Dynamic viscosity of the mixture, N·s·m−2
μ 1 Dynamic viscosity of the gas phase, N·s·m−2
μ 2 Dynamic viscosity of the liquid phase, N·s·m−2
ρ Density of the mixture, kg·m−3
ρ 1 Density of the gas phase, kg·m−3
ρ 2 Density of the liquid phase, kg·m−3
σ Surface tension coefficient, N·m−1
Subscripts
1Gas phase
2Liquid phase
gGDL surface
in,airAir inlet
in,waterWater inlet
qIndex for qth fluid
tsTop and side wall surfaces

References

  1. Byun, S.-J.; Wang, Z.H.; Son, J.; Kwak, D.-K.; Kwon, Y.-C. Experimental study on improvement of performance by wave form cathode channels in a PEM fuel cell. Energies 2018, 11, 319. [Google Scholar] [CrossRef]
  2. Qin, Y.; Wang, X.; Chen, R.; Shangguan, X. Water transport and removal in PEMFC gas flow channel with various water droplet locations and channel surface wettability. Energies 2018, 11, 880. [Google Scholar] [CrossRef]
  3. Wang, C.; Wang, S.; Peng, L.; Zhang, J.; Shao, Z.; Huang, J.; Sun, C.; Ouyang, M.; He, X. Recent progress on the key materials and components for proton exchange membrane fuel cells in vehicle applications. Energies 2016, 9, 603. [Google Scholar] [CrossRef]
  4. Vinh, N.D.; Kim, H.-M. Comparison of numerical and experimental studies for flow-field optimization based on under-rib convection in polymer electrolyte membrane fuel cells. Energies 2016, 9, 844. [Google Scholar] [CrossRef]
  5. Anderson, R.; Zhang, L.; Ding, Y.; Blanco, M.; Bi, X.; Wilkinson, D.P. A critical review of two-phase flow in gas flow channels of proton exchange membrane fuel cells. J. Power Sources 2010, 195, 4531–4553. [Google Scholar] [CrossRef]
  6. Jiao, K.; Li, X. Water transport in polymer electrolyte membrane fuel cells. Prog. Energy Combust. Sci. 2011, 37, 221–291. [Google Scholar] [CrossRef]
  7. Lorenzini-Gutierrez, D.; Kandlikar, S.G.; Hernandez-Guerrero, A.; Elizalde-Blancas, F. Residence time of water film and slug flow features in fuel cell gas channels and their effect on instantaneous area coverage ratio. J. Power Sources 2015, 279, 567–580. [Google Scholar] [CrossRef]
  8. Kim, J.H.; Lee, G.G.; Kim, W.T. Comparison of liquid water dynamics in bent gas channels of a polymer electrolyte membrane fuel cell with different channel cross sections in a channel flooding situation. Energies 2017, 10, 748. [Google Scholar] [CrossRef]
  9. Liu, X.; Guo, H.; Ye, F.; Ma, C.F. Water flooding and pressure drop characteristics in flow channels of proton exchange membrane fuel cells. Electrochim. Acta 2007, 52, 3607–3614. [Google Scholar] [CrossRef]
  10. Grimm, M.; See, E.J.; Kandlikar, S.G. Modeling gas flow in PEMFC channels: Part I—Flow pattern transitions and pressure drop in a simulated ex situ channel with uniform water injection through the GDL. Int. J. Hydrogen Energy 2012, 37, 12489–12503. [Google Scholar] [CrossRef]
  11. Bazylak, A. Liquid water visualization in PEM fuel cells: A review. Int. J. Hydrogen Energy 2009, 34, 3845–3857. [Google Scholar] [CrossRef]
  12. Ferreira, R.B.; Falcão, D.S.; Oliveira, V.B.; Pinto, A.M.F.R. Numerical simulations of two-phase flow in proton exchange membrane fuel cells using the volume of fluid method: A review. J. Power Sources 2015, 277, 329–342. [Google Scholar] [CrossRef]
  13. Molaeimanesh, G.R.; Googarchin, H.S.; Mqaddam, A.Q. Lattice Boltzmann simulation of proton exchange membrane fuel cells—A review on opportunities and challenges. Int. J. Hydrogen Energy 2016, 41, 22221–22245. [Google Scholar] [CrossRef]
  14. Manso, A.P.; Marzo, F.F.; Barranco, J.; Garikano, X.; Mujika, M.G. Influence of geometric parameters of the flow fields on the performance of a PEM fuel cell. A review. Int. J. Hydrogen Energy 2012, 37, 15256–15287. [Google Scholar] [CrossRef]
  15. Owejan, J.P.; Trabold, T.A.; Jacobson, D.L.; Arif, M.; Kandlikar, S.G. Effects of flow field and diffusion layer properties on water accumulation in a PEM fuel cell. Int. J. Hydrogen Energy 2007, 32, 4489–4502. [Google Scholar] [CrossRef]
  16. Zhu, X.; Liao, Q.; Sui, P.C.; Djilali, N. Numerical investigation of water droplet dynamics in a low-temperature fuel cell microchannel: Effect of channel geometry. J. Power Sources 2010, 195, 801–812. [Google Scholar] [CrossRef]
  17. Lu, Z.; Rath, C.; Zhang, G.; Kandlikar, S.G. Water management studies in PEM fuel cells, part IV: Effects of channel surface wettability, geometry and orientation on the two-phase flow in parallel gas channels. Int. J. Hydrogen Energy 2011, 36, 9864–9875. [Google Scholar] [CrossRef]
  18. Gopalan, P.; Kandlikar, S.G. Effect of channel materials and trapezoidal corner angles on emerging droplet behavior in proton exchange membrane fuel cell gas channels. J. Power Sources 2014, 248, 230–238. [Google Scholar] [CrossRef]
  19. Owejan, J.P.; Gagliardo, J.J.; Sergi, J.M.; Kandlikar, S.G. Water management studies in PEM fuel cells, Part I: Fuel cell design and in situ water distributions. Int. J. Hydrogen Energy 2009, 34, 3436–3444. [Google Scholar] [CrossRef]
  20. Ding, Y.; Bi, H.T.; Wilkinson, D.P. Three-dimensional numerical simulation of water droplet emerging from a gas diffusion layer surface in micro-channels. J. Power Sources 2010, 195, 7278–7288. [Google Scholar] [CrossRef]
  21. Jo, J.H.; Kim, W.T. Numerical simulation of water droplet dynamics in a right angle gas channel of a polymer electrolyte membrane fuel cell. Int. J. Hydrogen Energy 2015, 40, 8368–8383. [Google Scholar] [CrossRef]
  22. Gopala, V.R.; van Wachem, B.G.M. Volume of fluid methods for immiscible-fluid and free-surface flows. Chem. Eng. J. 2008, 141, 204–221. [Google Scholar] [CrossRef]
  23. The OpenFOAM Foundation. OpenFOAM v4 User Guide; OpenFOAM Foundation: London, UK, 2017. [Google Scholar]
  24. Deshpande, S.; Anumolu, L.; Trujillo, M.F. Evaluating the performance of the two-phase flow solver interFoam. Comput. Sci. Discov. 2012, 5, 014016. [Google Scholar] [CrossRef]
  25. Francois, M.M.; Cummins, S.J.; Dendy, E.D.; Kothe, D.B.; Sicilian, J.M.; Williams, M.W. A balanced-force algorithm for continuous and sharp interfacial surface tension models within a volume tracking framework. J. Comput. Phys. 2006, 213, 141–173. [Google Scholar] [CrossRef]
  26. Deshpande, S.; Trujillo, M.F.; Wu, X.; Chahine, G. Computational and experimental characterization of a liquid jet plunging into a quiescent pool at shallow inclination. Int. J. Heat Fluid Flow 2012, 34, 1–14. [Google Scholar] [CrossRef]
  27. Holzmann, T. SIMPLE, PISO and PIMPLE algorithm. In Mathematics, Numerics, Derivations and OpenFOAM, 4th ed.; Holzmann CFD: Leoben, Austria, 2017. [Google Scholar]
  28. Brackbill, J.U.; Kothe, D.B.; Zamach, C. A continuum method for modeling surface tension. J. Comput. Phys. 1992, 100, 335–354. [Google Scholar] [CrossRef]
  29. Park, S.; Lee, J.-W.; Popov, B.N. A review of gas diffusion layer in PEM fuel cells: Materials and designs. Int. J. Hydrogen Energy 2012, 37, 5850–5865. [Google Scholar] [CrossRef]
  30. Gurau, V.; Bluemle, M.J.; De Castro, E.S.; Tsou, Y.-M.; Mann, J.A., Jr.; Zawodzinski, T.A., Jr. Characterization of transport properties in gas diffusion layers for proton exchange membrane fuel cells 1. Wettability (internal contact angle to water and surface energy of GDL fibers). J. Power Sources 2006, 160, 1156–1162. [Google Scholar] [CrossRef]
  31. Enz, S.; Dao, T.A.; Messerschmidt, M.; Scholta, J. Investigation of degradation effects in polymer electrolyte fuel cells under automotive-related operating conditions. J. Power Sources 2015, 274, 521–535. [Google Scholar] [CrossRef]
  32. Hossain, M.; Islam, S.Z.; Colley-Davies, A.; Adom, E. Water dynamics inside a cathode channel of a polymer electrolyte membrane fuel cell. Int. J. Hydrogen Energy 2013, 50, 763–779. [Google Scholar] [CrossRef]
  33. Quan, P.; Lai, M.-C. Numerical study of water management in the air flow channel of a PEM fuel cell cathode. J. Power Sources 2007, 164, 222–237. [Google Scholar] [CrossRef]
  34. Turhan, A.; Kim, S.; Hatzell, M.; Mench, M.M. Impact of channel wall hydrophobicity on through-plane water distribution and flooding behavior in a polymer electrolyte fuel cell. Electrochim. Acta 2010, 55, 2734–2745. [Google Scholar] [CrossRef]
Figure 1. Three dimensional computational domains and grids considered in the present study: (a) rectangular channel cross section (REC); (b) trapezoidal channel cross sections with open angles of 60° (T60); (c) trapezoidal channel cross sections with open angles of 72° (T72), (d) computational grid (REC); (e) T60; (f) T72; (g) water inlet configuration (H12); (h) H1234; (i) V1; and (j) V2.
Energies 11 01403 g001
Figure 2. Time evolution of the gas-liquid interface, water volume fraction (WVF), water coverage ratio of the GDL surface (GWCR), and pressure drop in the GCs ( V i n , a i r = 5.0 m·s−1, V i n , w a t e r = 0.1 m·s−1, θ t s = 60°, θ g = 130°, H12 water inlet configuration): (a) gas-liquid interface (REC); (b) gas-liquid interface (T60); (c) gas-liquid interface (T72); (d) WVF; (e) GWCR; (f) pressure drop between inlet and outlet.
Energies 11 01403 g002
Figure 3. Time evolution of the gas-liquid interface in the GCs ( V i n , a i r = 5.0 m·s−1, V i n , w a t e r = 0.1 m·s−1, θ g = 130°, H12 water inlet configuration): (a) θ t s = 60° (REC); (b) θ t s = 90° (REC); (c) θ t s = 120° (REC); (d) θ t s = 60° (T60); (e) θ t s = 90° (T60); (f) θ t s = 120° (T60); (g) θ t s = 60° (T72); (h) θ t s = 90° (T72); (i) θ t s = 120° (T72).
Energies 11 01403 g003
Figure 4. Effect of the top and side wall contact angle on the time evolution of (a) WVF (REC); (b) WVF (T60); (c) WVF (T72); (d) GWCR (REC); (e) GWCR (T60); (f) GWCR (T72); (g) pressure drop (REC); (h) pressure drop (T60); (i) pressure drop (T72) ( V i n , a i r = 5.0 m·s−1, V i n , w a t e r = 0.1 m·s−1, θ g = 130°, H12 water inlet configuration).
Energies 11 01403 g004
Figure 5. Time evolution of the gas-liquid interface in the GCs ( V i n , a i r = 5.0 m·s−1, V i n , w a t e r = 0.1 m·s−1, θ t s = 60°, θ g = 140°): (a) REC (H1234); (b) T60 (H1234); (c) T72 (H1234); (d) REC (V1); (e) T60 (V1); (f) T72 (V1); (g) REC (V2); (h) T60 (V2); (i) T72 (V2).
Energies 11 01403 g005
Figure 6. Effect of the GC cross-sectional shape on the time evolution of (a) WVF (H1234); (b) WVF (V1); (c) WVF (V2); (d) GWCR (H1234); (e) GWCR (V1); (f) GWCR (V2); (g) pressure drop (H1234); (h) pressure drop (V1); (i) pressure drop (V2) ( V i n , a i r = 5.0 m·s−1, V i n , w a t e r = 0.1 m·s−1, θ t s = 60°, θ g = 130°).
Energies 11 01403 g006
Figure 7. Time evolution of the gas-liquid interface in the GCs ( V i n , w a t e r = 0.1 m·s−1, θ t s = 60°, θ g = 130°, H12 water inlet configuration): (a) V i n , a i r = 1.0 m·s−1 (REC); (b) V i n , a i r = 1.0 m·s−1 (T60); (c) V i n , a i r = 1.0 m·s−1 (T72); (d) V i n , a i r = 2.5 m·s−1 (REC); (e) V i n , a i r = 2.5 m·s−1 (T60); (f) V i n , a i r = 2.5 m·s−1 (T72); (g) V i n , a i r = 5.0 m·s−1 (REC); (h) V i n , a i r = 5.0 m·s−1 (T60); (i) V i n , a i r = 5.0 m·s−1 (T72).
Energies 11 01403 g007
Figure 8. Effect of the air inlet velocity on the time evolution of (a) WVF (REC); (b) WVF (T60); (c) WVF (T72); (d) GWCR (REC); (e) GWCR (T60); (f) GWCR (T72); (g) pressure drop (REC); (h) pressure drop (T60); (i) pressure drop (T72) ( V i n , w a t e r = 0.1 m·s−1, θ t s = 60°, θ g = 130°, H12 water inlet configuration).
Energies 11 01403 g008aEnergies 11 01403 g008b
Table 1. Numerical studies on the effect of gas channel (GC) cross-sectional shape on gas-liquid two-phase flow in polymer electrolyte membrane (PEM) fuel cells.
Reference and Published YearGC Cross Sectional ShapeGC Flow Field GeometryWater IntroductionNumerical Method (Software)
Zhu et al. [16] (2010)Rectangle, Trapezoid, Upside-down Trapezoid, Triangle, Rectangle with a Curved Bottom Wall, Semicircle (Width 177–790 μ m, Height 79–354 μ m)Straight GC (Length 1000 μ m)Continuous water injection through a single micropore on the GDLVOF (FLUENT 6.3.26)
Ding et al. [20] (2010)Rectangle (250 μ m × 250 μ m) Straight GC (Length 1250 μ m)Continuous water injection through 1–64 micropores on the GDLVOF (FLUENT 6.3.26)
Lorenzini-Gutierrez et al. [7] (2015)Rectangle, Trapezoid with open angle of 40°, Trapezoid with open angle of 50°, Trapezoid with open angle of 60°, Semi-circle (Width 700–1177 μ m, Height 400–422 μ m)Straight GC (Length 30,000 μ m)Hexahedral water slug in the GC at the start of the calculationVOF (FLUENT 14.0)
Kim et al. [8] (2017)Rectangle, Trapezoid with open angle of 50°, Trapezoid with open angle of 60° (Width 700–1036 μ m, Height 400 μ m)Bent GC (Length 20,000 μ m)Hexahedral water slug in the GC at the start of the calculationVOF (FLUENT 14.0)
Present (2018)Rectangle, Trapezoid with open angle of 60°, Trapezoid with open angle of 72° (Width 700–931 μ m, Height 400–533 μ m)Straight GC (Length 5000 μ m)Continuous water injection through 4–16 micropores on the GDLVOF (OpenFOAM 4.1, interFoam)
Table 2. Boundary conditions and material properties.
Boundary TypeMomentum EquationPressure EquationVolume Fraction Equation
Air InletA fully developed laminar velocity profile (mean V i n , a i r = 5.0/2.5/1.0 m·s−1)Fixed flux pressure conditionConstant = 0.0
Water InletA uniform velocity profile ( V i n , w a t e r = 0.1 m·s−1)Zero gradientConstant = 1.0
OutletZero velocity gradientFixed pressure value (1 atm.)Internal field condition
WallNo slipFixed flux pressure conditionConstant contact angle ( θ t s = 60°/90°/120°, θ g = 130°)
Air Temperature303.15 K
Water Temperature353.15 K
Dynamic Viscosity of Air1.86 × 10−5 N·s·m−2
Air-water Surface Tension Coefficient0.0626 N·m−1
Table 3. Mean, standard deviation (s), and maximum values of WVF, GWCR, and pressure drop for some selected simulation cases ( V i n , a i r = 5.0 m·s−1, V i n , w a t e r = 0.1 m·s−1, θ t s = 60°, θ g = 130°).
CaseWVFGWCRPressure Drop (Pa)
Mean s Max . Mean s Max . Mean s Max .
REC, H120.0950.0510.1760.0000.0000.00119160534
T60, H120.0920.0480.1660.0090.0120.05225781711
T72, H120.0600.0280.0890.0410.0280.1003564723067
REC, H12340.1820.0760.2900.0070.0150.077339137897
T60, H12340.2080.0900.2990.0320.0170.07227667686
T72, H12340.1050.0380.1530.0780.0560.256782129514,855
REC, V10.0690.0600.1820.0230.0220.05510819555
T60, V10.0510.0450.1250.0200.0220.07112849723
T72, V10.0610.0390.1240.0010.0010.00710722702
REC, V20.0420.0230.0850.0090.0140.04915041558
T60, V20.0340.0160.0560.0080.0110.03816140730
T72, V20.0350.0160.0570.0120.0150.04914750705

