Article

Design Methodology, Modeling, and Comparative Study of Wireless Power Transfer Systems for Electric Vehicles

1
ETEC Department & MOBI Research Group, Vrije Universiteit Brussel (VUB), Pleinlaan 2, 1050 Brussel, Belgium
2
Flanders Make, 3001 Heverlee, Belgium
3
Faculty of Engineering, Helwan University, Cairo 11795, Egypt
*
Author to whom correspondence should be addressed.
Energies 2018, 11(7), 1716; https://doi.org/10.3390/en11071716
Submission received: 23 May 2018 / Revised: 20 June 2018 / Accepted: 21 June 2018 / Published: 1 July 2018

Abstract

:
Recently, wireless power transfer (WPT) systems have been used as battery chargers for electric vehicles. In a WPT system, the design approach and control strategy have a significant impact on the performance of the wireless power transfer systems in electric vehicle powertrains in terms of efficiency, charging power, charging modes, charging time, etc. A characteristic of different topologies appears depending on whether the compensation capacitor is connected in series or parallel with coils. Therefore, it is necessary to select a suitable compensation topology depending on different applications. Thus, this paper proposes a new design methodology and control system for bidirectional 3.7 kW and 7.7 kW WPTs in light-duty electric vehicles (EVs) operating at both 40 kHz and 85 kHz resonance frequencies. In this paper, the series-series (SS) WPT compensation topology is optimally designed and controlled for grid-to-vehicle (G2V) mode using MATLAB/Simulink. A simulation study is performed for a selected WPT design for G2V mode to ensure its functionality and performance at different power levels. Moreover, the magnetic design of the coils and its parameters are verified by using COMSOL. Finally, experimental results are validated for the WPT system.

1. Introduction

Electric vehicles (EVs) are considered to be an attractive alternative to conventional vehicles that are mainly based on an internal combustion engine (ICE), especially for reducing greenhouse emissions. In recent years, the commercialization of electric vehicles has significantly grown thanks to recent advances in battery technologies, power electronics interfaces (i.e., inverters, DC/DC converters, on/off-board charging systems), electric motors, and power management control [1]. Nowadays, the number of EVs in circulation increases more and more every year. According to data from the European Automobile Manufacturers’ Association (ACEA), during the first nine months of 2015, more than 190,000 plug-in electric and hybrid cars were sold in Europe, with a growth of approximately 95% in comparison with 2014 [2]. However, EVs have some major issues (such as battery cost, battery lifetime, slow charging speed, efficient charging systems, limited energy density, weight, reliability, etc.) that need to be solved. One of the main challenges for EV growth is represented by the lack of adequate infrastructures, such as charging stations [3]. The most frequented areas where vehicles are parked for relatively long times are certainly better suited for the installation of charging stations, e.g., garages, restaurants, hotels, cottages, public parking areas, camping sites, shopping centers, business parks, sports centers, or other business activities with parking [4,5]. Furthermore, the optimization of EV drivetrains and their management systems towards optimized energy efficiency and minimized total cost of ownership (TCO) are the most important challenges in EVs. In 2010, according to a survey conducted by Ernst & Young and presented in [6], one of the most important issues regarding the public acceptance of EVs is the problem of accessing a charging station. Therefore, one of the key constraints for the mass market penetration of EVs is the inconvenience and safety concerns associated with charging systems and their availability. Currently, fast-charging systems and safety issues associated with light-duty EVs are some of the main areas of interest in many studies.
Plug-in charging of electric vehicles (PHEVs) and EVs are still the premier choice since conductive charging is the traditional method for power transfer. Conductive charging systems use metal-to-metal contact as in most appliances and electronic devices. However, environmental issues (such as rain, ice, snow, and extreme heat and cold) present some challenges with plugs and cables. Meanwhile, there is another disadvantage of this conductive system: the connection has to be manually made between the EVs and charging stations. It is not convenient for users to charge their EVs when parking the EV at public charging stations. With the development of wireless power transfer (WPT) technology in recent years, it has become possible to charge electric vehicles without a physical connection [7,8,9]. Meanwhile, WPT technology is used in the fast-charging systems available on the market, for example, city battery buses [10]. It is one of the most reliable applications for this alternative form of charging. There are several projects using inductive charging for buses that have been conducted: Scania (Sweden, 2016), Flanders DRIVE (Belgium, 2011), City of Den Bosch (the Netherlands, 2012), Bombardier (Germany, 2013), Dong Won Olev (South Korea, 2013), and Wrightbus (the UK, 2014), which were mentioned in [11]. Compared with the conductive charging system, there are many advantages in WPT systems for EVs that are given as follows, particularly in terms of convenience and safety [12,13]:
  • Convenience: eliminating the need for power cables and the effect of the bad weather;
  • Safety: eliminating the danger of sparking and electrical shock risk;
  • Reliability: eliminating the components with the greatest possibility of failure in most electronic systems, namely, the power cords and connectors.
In the literature, the WPT system can be divided into stationary wireless charging and dynamic wireless charging [14,15]. With stationary wireless charging, the user simply parks the vehicle over a charging pad mounted on the ground and a corresponding charging pad mounted on the underside of the vehicle picks up the signal and charges the vehicle. The key challenge of WPT technology is that WPT has lower transfer efficiency and lower receiver power compared with conductive charging systems. Generally, the coupling coefficient is proportional to the size of the loosely coupled transformer at a fixed air gap. Most of the current WPT researches focus on the topologies of resonant circuits and the control method for the inverters or converters either in the charger side or in the load side. For the topologies of resonant circuits, two common topologies for the primary and secondary resonant circuits, the series and parallel connected circuits, have been tested in previous works for different applications [16,17,18]. As reported in the literature, there are many different compensation topologies which have been addressed. Each topology has its advantages and drawbacks. The choice has to be made according to the specifications of the application [19,20,21]. Therefore, different compensation networks and the choice of compensation networks are explicated in this section. In [22,23], the authors proposed a general design method that includes the magnetic coupling effect in the primary resonance design for the commonly used resonant topologies. The series–series (SS) compensation topology has been established as a good solution because its resonant circuit can be designed independently of the coupling and load. Moreover, the equivalent electric circuit model with SS compensation is discussed in [24,25]. In [26], the parallel–parallel (PP) compensation topology is the dependence of primary capacitance on load and it can be driven more easily than SS topologies. In [27], the authors studied a series-parallel mixed resonant coupling topology, which has the advantages of the transfer distance being longer than series topology and the transfer efficiency being higher than parallel topology. In [28], the authors proposed a novel compensation circuit called the series parallel-series (SP-S) topology for inductive power transfer (IPT) systems. By designing a proper ratio between the two primary side capacitors, the characteristics of SS and PS are mixed. The results showed that the SP-S topology is suitable for mobile battery chargers, where high misalignment may occur. In this paper, considering the convenience for EV battery charging and practical application, the SS topology was selected for our analysis of compensation topology. The choice of the SS topology allows for the selection of compensation capacitances depending only on the self-inductances, with no relation with the load and the magnetic coupling [25]. Due to these reasons, the SS topology turns out to be convenient for EV battery charging. For the control methods of WPT systems, in [29] they used the standard control concepts: (1) frequency control at fixed duty cycle; (2) duty cycle control at a fixed frequency; and (3) dual control-combine frequency control and duty cycle control. In [30], the authors applied a pulse width modulation (PWM) control method. PWM is most commonly used as a basic modulation. Regarding some research on the charging strategies to determine the location and size of the EVs and photovoltaic (PV) systems, in [31], the authors presented a probabilistic method that accurately verifies the fulfillment of voltage constraints in radial distribution systems (RDSs) with PV systems and EV charging loads. Moreover, the assessment accuracy of the EV and PV interaction in RDSs was improved, which was extended from a weekly assessment to a one-year time period in [32]. In addition, concerning the safe use of EVs, Hernández et al. [33] defined the foundations for the safe, efficient, and smart interconnection of complementary AC and DC sources, which feed bidirectional EV charging stations thanks to a reference DC node. In [34], the authors described a multiterminal DC compact node consisting of voltage-source converters and DC-DC converters as a promising arrangement to feed EV charging stations with renewable power sources.
In this paper, the main objective is to develop a new design approach and control system for a series-series (SS) topology based on 3.7 kW and 7.7 kW WPT systems operating at resonant frequencies of both 40 kHz and 85 kHz to verify their feasibility and performance for light-duty EV applications operating in charging grid-to-vehicle (G2V) mode. The paper is structured as follows: In Section 2, the design optimization approach for the SS topology of the WPT system is presented in detail. In Section 3, this paper presents the optimal sizing of the primary and secondary coils to achieve the maximum coupling coefficient through the proposed design methodology. In Section 4, the magnetic design of the coils is verified by using the COMSOL program. In Section 5, the power electronics converter (PEC) topology and its control strategies for G2V operating modes is presented, which were designed and validated using MATLAB/Simulink. In Section 6, the experimental results are presented to verify the design performance of the WPT system. Section 7 draws the final conclusion of this paper.

2. Design Sizing Methodology for the SS Topology of the WPT System

2.1. Resonant Wireless Power Transfer System

The resonant WPT system consists of magnetically coupled primary and secondary coils as well as power electronics converters (such as AC/DC rectifier, DC/AC inverters) and compensation circuits. Figure 1 shows a general block diagram of the components and power electronics conversion for wireless power transfer from the grid to load. The input AC utility grid power is converted to DC power, and then an inverter converts the DC power into a high-frequency AC power. The high-frequency current in the primary coil generates an alternating magnetic field, which induces an AC voltage on the secondary coil. By resonating with the compensation circuits, the transfer power and efficiency are significantly improved. The secondary coil receives this high-frequency AC power, and it is rectified to DC power to charge the electric vehicle batteries.

2.2. WPT System Model for SS Topology

The principle of the design method of the WPT system is in a backward calculation, whereas the design steps are calculated from the battery side to the high-frequency inverter side in the primary side. The bidirectional WPT system of SS-compensated topology is shown in Figure 2. The specific design steps for the SS topology of the WPT system are explained in Section 2.5.
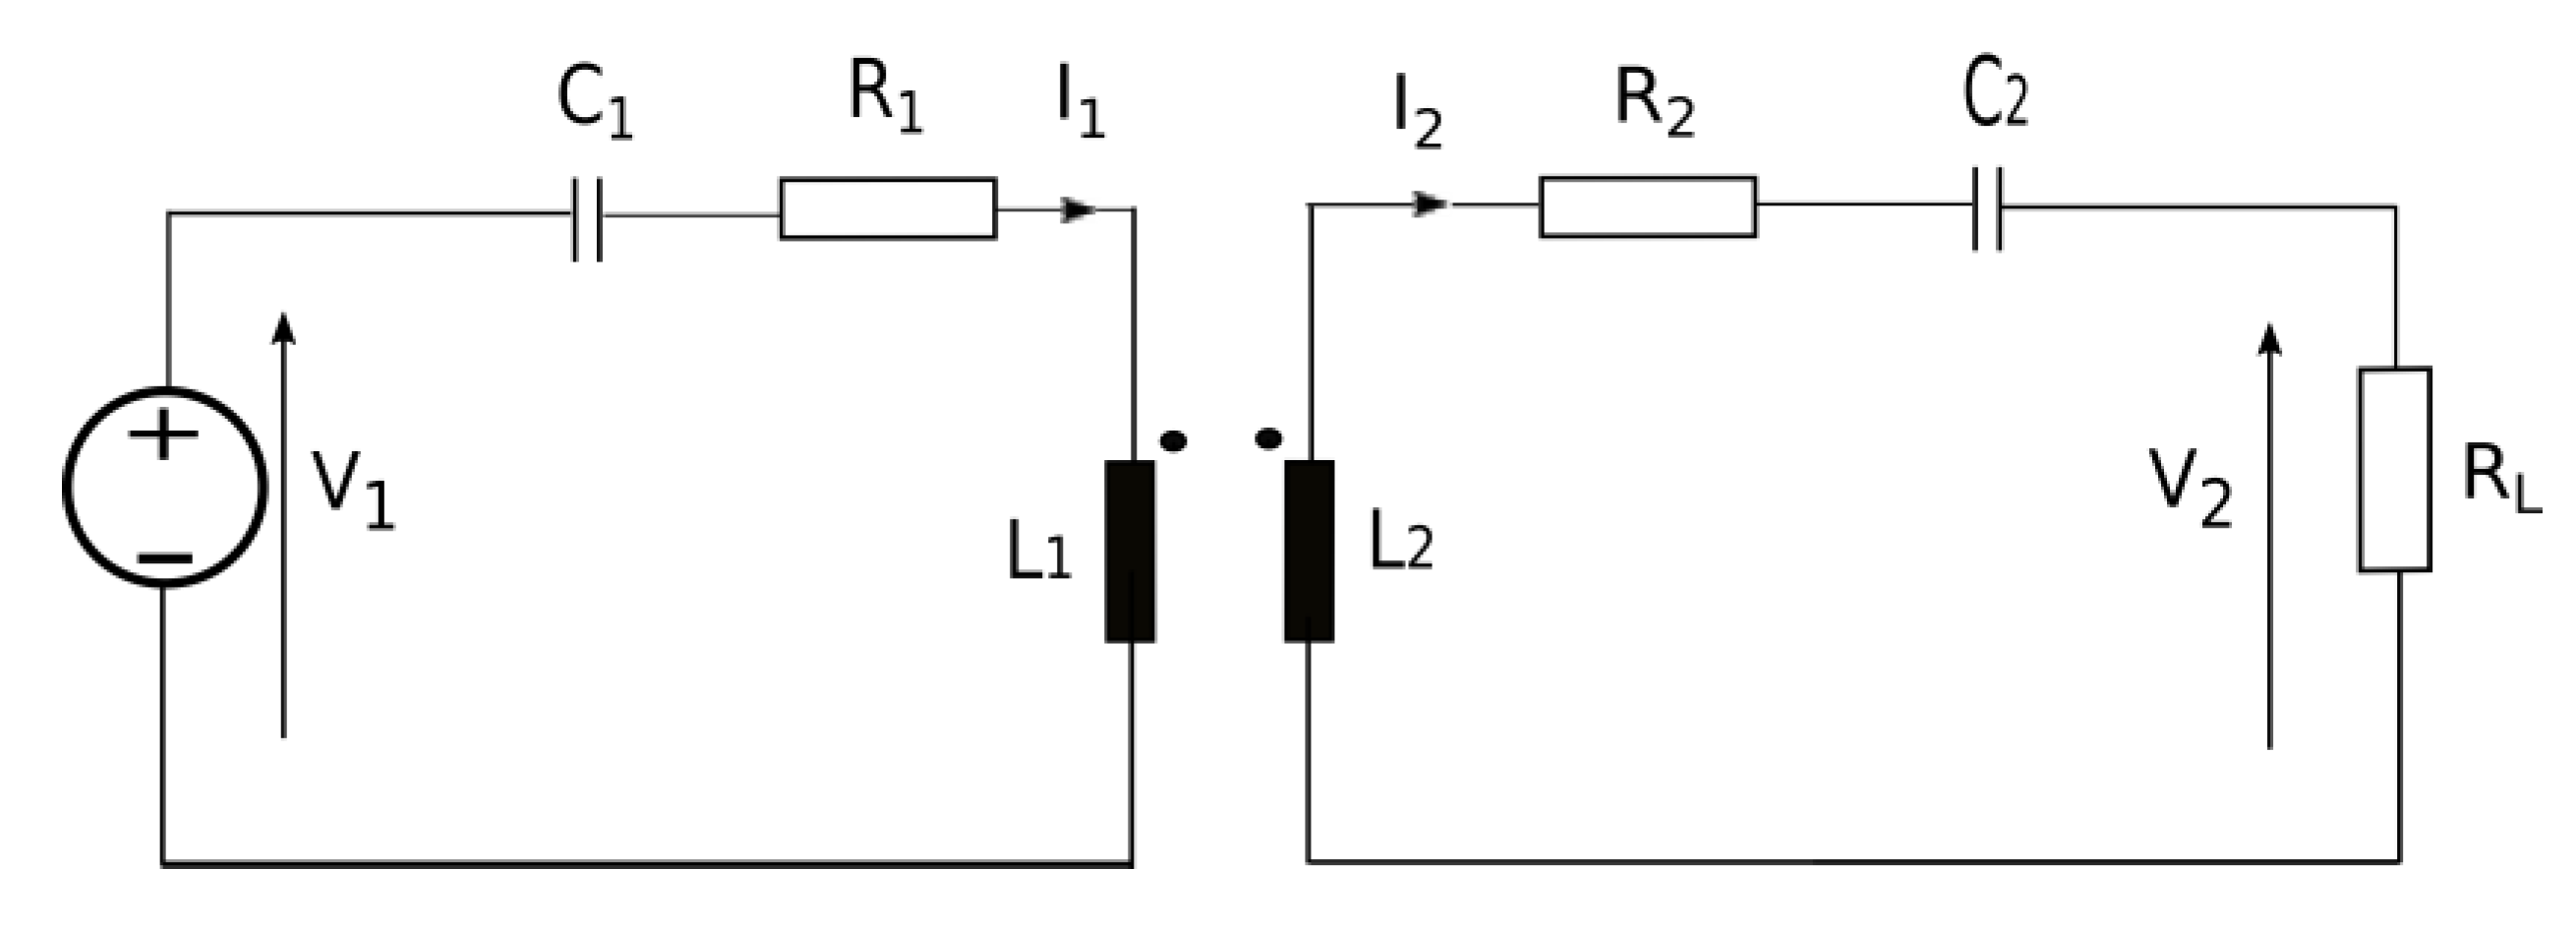
An equivalent circuit model of a WPT system with compensation capacitors arranged in an SS topology is shown in Figure 3. For simplification, the equivalent source resistance is neglected. Here, the subscripts “1” and “2” refer to the “primary” and “secondary” coil values of inductor L, resistance R, and capacitance C, respectively. V1 is the source voltage of the primary circuit. RL is the equivalent load resistance. I1 is the source current flowing through the primary coil, and I2 is the load current flowing through the secondary coil.
The degree of the coupling between two coils can be expressed with the coupling coefficient k, which has a value ranging from 0 to 1, and is defined by Equation (1). M represents the mutual inductance between the primary and secondary coils.
k = M L 1 × L 2
The voltage equations in Figure 3 can be written using the mutual inductance, M . ω is the frequency of V1.
V 1 = ( 1 j ω C 1 + j ω L 1 + R 1 ) I 1 j ω M I 2
V 2 = j ω M I 1 ( 1 j ω C 2 + j ω L 2 + R 2 ) I 2
The resonant frequencies ω 0 at the primary coil and the secondary coil are assumed to be equal to
ω 0 = 1 L 2 × C 2 = 1 L 1 × C 1
At the perfect resonant frequency ω 0 , Equation (2) can be rewritten as (4).
V 1 = R 1 I 1 j ω 0 M I 2
V 2 = j ω 0 M I 1 R 2 I 2
In Figure 3, the delivered power to the load PL and the transfer efficiency η at the resonant frequency ω 0 can be obtained as follows in Equations (5) and (6) [35]:
P L = ω 0 2 M 2 V 1 2 R L [ R 1 ( R L + R 2 ) + ω 0 2 M 2 ] 2
η = ω 0 2 M 2 R L R 1 ( R L + R 2 ) 2 + ω 0 2 M 2 ( R L + R 2 )
By defining the quality factor of the primary and secondary coils, Q 1 = ω L 1 / R 1 , Q 2 = ω L 2 / R 2 , so the transferred efficiency Equation (6) replaced by Q 1 and Q 2 can be rewritten in Equation (7):
η = R L ( R L + R 2 ) 2 k 2 Q 1 Q 2 R 2 + R L + R 2
The maximum transmission efficiency η max of the WPT system can be derived as [35]
η m a x = k 2 Q 1 Q 2 ( 1 + 1 + k 2 Q 1 Q 2 ) 2
From Equation (8), the maximum efficiency increases as k 2 Q 1 Q 2 increases. It should be noted that the maximum efficiency of a WPT system is limited by the product of the coupling coefficient k and the inductor quality factor Q. Therefore, the foremost design consideration in a WPT system is the attainment of the higher possible Q and k. These two vital parameters are functions of the shape, size, and the relative position of the primary and secondary coils. The main goal in the design of a WPT system is to achieve maximum efficiency and to optimize the power transfer capability according to the operating conditions.
In EV wireless charging applications, the battery is usually connected to the coil through a diode-bridge rectifier or via a controlled converter. The battery could be represented as a resistance R b = U b I b , where U b and I b are the battery voltage and current, respectively. If the battery is connected to the rectifier directly in an SS-compensated WPT system, the equivalent AC side resistance R L could be calculated by Equation (9). Thus, a battery load could be converted to an equivalent resistive load [36].
R L = 8 π 2 × R b

2.3. Windings Sizing Calculation

Figure 4 shows a rectangular spiral coil with a square cross-section. The basic dimensional parameters of such a spiral are N, w, γ , d x i , and d x o , as depicted in Figure 4, which are the number of turns, cross-sectional width, the spacing between consecutive turns, the inner side length of the spiral, and the outer side length of the spiral, respectively. The outer side length d x o is derived from the other geometrical parameters as
d x o = d x i + 2   ×   [ N × w + ( N 1 )   ×   γ ]
The total length l t o t of the spiral can be calculated as
l t o t = 2 × N × [ d x o ( w + γ ) × ( N 1 ) ] + 2 × N × [ d y o ( w + γ ) × ( N 1 ) ]

2.4. Self and Mutual Inductance Calculation

From Figure 4, the inductance of each coil is obtained with Equation (12), where the number of turns is N i , the coil resistance is R i , the coil cross-section area is S i , and r i is the equivalent radius of the coil. In addition, i = 1 should be used for the primary coil and i = 2 for the secondary coil.
L i = μ 0 π N i 2 [ d x o i × l n 2 d x o i d y o i r i ( d x o i + d x o i 2 + d y o i 2 ) + d y o i × l n 2 d x o i d y o i r i ( d y o i + d x o i 2 + d y o i 2 ) 2 ( d x o i + d y o i d x o i 2 + d y o i 2 ) + 0.25 ( d x o i + d y o i ) ]
r i = N i × S i π
R i = ρ × N i × 2 × ( d x o i + d y o i ) S i
where ρ = 1.72 × 10 8   Ω   · m .
The calculation of mutual inductance M is computed using Neumann’s formula for a rectangular coil with N 1 and N 2 turns and their equivalent radius. The coupling coefficient k of two magnetically coupled coils is defined by the ratio of the mutual inductance M and the two self-inductances L 1 and L 2 .
M = k   L 1 × L 2

2.5. Design Steps for the SS Topology WPT System

Step 1: Calculate the AC equivalent load resistance R L :
R b =   V b a t 2 P b a t
R L =   8 π 2 × R b
where P b a t is the battery charging power and V b a t is the battery voltage.
Step 2: Calculate the optimal frequency f 0 [37]:
ω 0 = K ω × R 1 × ( R 2 + R L ) M
f 0 = ω 0 2 π
where f 0 is the resonant frequency. R 1 , R 2 is the primary and secondary coil resistance.
Step 3: Calculate the primary capacitance C 1 and secondary capacitance C 2 :
C 1 = 1 ω 0 2 × L 1
C 2 = 1 ω 0 2 × L 2
Step 4: Calculate the total impedance Z 1 of the equivalent circuit [18]:
Z 1 = R 1 + ω 0 2 × M 2 R 2 + R L
Step 5: Calculate the primary current I 1 and the secondary current I 2 :
I 1 = V 1 Z 1
I 2 = I 1 × ω 0 × M R 2 + R L
Step 6: Choose the current density δ and calculate the coils cross-sectional area S i .
Step 7: Calculate the primary capacitance voltage V c 1 and secondary capacitance voltage V c 2 :
V c 1 = I 1 × 1 ω 0 × C 1
V c 2 = I 2 × 1 ω 0 × C 2
Step 8: Calculate the quality factor of the primary coil Q p and secondary coil Q s [38]:
Q p = L 1 R L ω 0 M 2
Q s = ω 0 L 2 R L

3. Design Optimization for SS Topology of WPT System

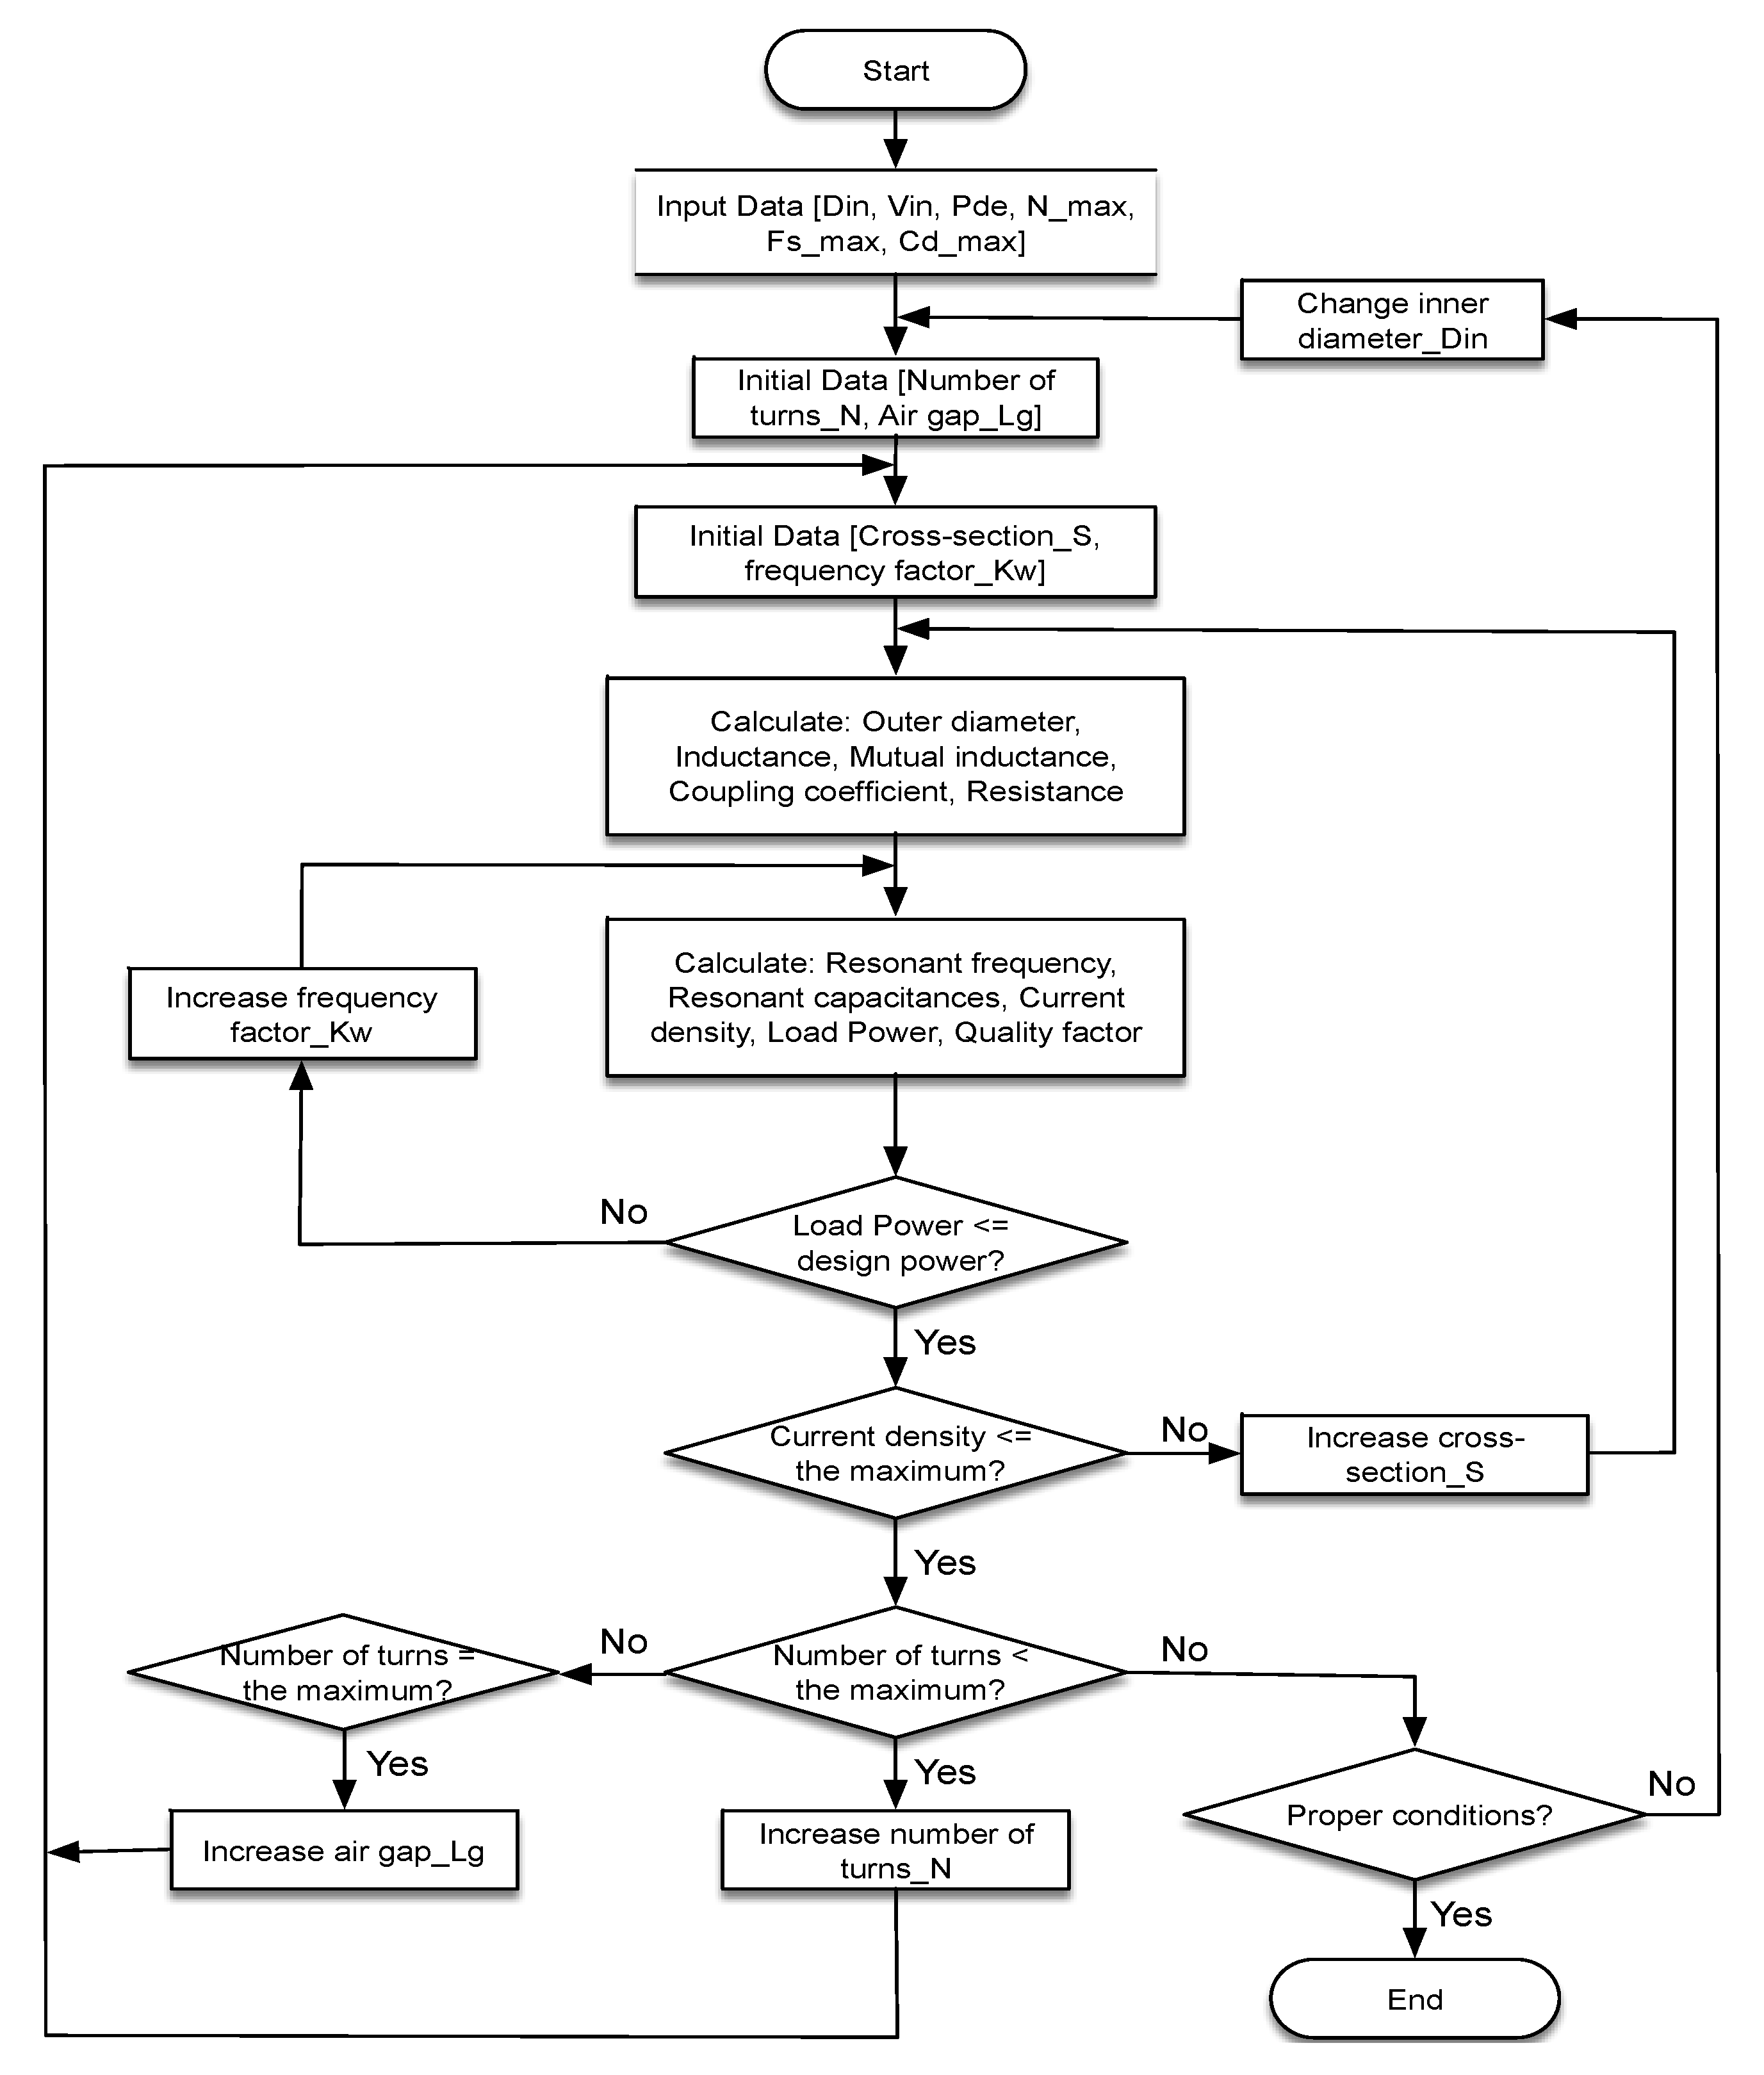
In [37], the authors presented a basic design method using an iterative algorithm for the WPT system. In this paper, a design optimization approach for the SS topology of WPT system was developed with coil dimension optimization using an iterative algorithm. For the desired SS-compensated 3.7 kW and 7.7 kW WPT systems, the design process initiates with an initial geometry, number of turns, cross-sectional area, and the current density of the coils and then an iterative optimization process is applied to fulfill the required power level within the permissible maximum frequency and the geometry of coil. All of these parameters along with the circuit’s electrical states and outputs (system currents and voltages) can be iteratively evaluated. In this section, we focus on the optimal design of an SS topology WPT system using an iterative algorithm. From the various results, a WPT design is selected based on the required operation parameters such as needed power and voltage levels and operating (resonance) frequency.

3.1. Flow Chart of Coil Sizing Optimization

A flow chart of the WPT system design process is depicted in Figure 5. This design flow process can be applied to different power levels of a WPT system. According to this flow chart, the design process initiates with an initial geometry, number of turns, cross-sectional area, and the current density of the coils and then an iterative process is applied until the fulfillment of the required power level with the permissible maximum frequency and the geometry of coils.

3.2. Optimal Parameters and Coil Dimensions

In [37,39,40], only preliminary simulation results were presented. However, there is no optimization method for the dimensions of the primary and secondary coils. In this paper, the design optimization approach for the SS topology of the WPT system is presented. For the 3.7 kW and 7.7 kW WPT systems, the airgap L g is fixed at 100 mm and the spacing between consecutive turns is fixed at 1 mm when the resonant frequency is at both 40 kHz and 85 kHz. However, the number of turns and the inner dimensions of the primary and secondary coils are variable. The coupling coefficient is calculated by the simulation process using an iterative algorithm, which is a function of the inner dimension of the primary and secondary coils [41].
For the 3.7 kW WPT system, shown in Table 1, the inner dimensions of 250 × 250 mm of the primary and secondary coils was chosen to get the maximum coupling coefficient at the resonant frequency for both 40 kHz and 85 kHz and the number of turns N 1 = 23, N 2 = 22 when the current density of the coils is 4 A/mm2.
For the 7.7 kW WPT system, the inner dimensions of 250 × 250 mm of the primary and secondary coils was chosen to get the maximum coupling coefficient at the resonant frequency for both 40 kHz and 85 kHz and the number of turns N 1 = 16, N 2 = 15, respectively. The optimal coil dimensions are summarized in Table 1, where the current density of coils is 4 A/mm2.
The main parameters of the final design process that were used in this simulation study are reported in Table 2. The resistance values R 1 and R 2 represented the primary and secondary resistors, respectively. The design process was analyzed to ensure the optimal parameters of the primary and secondary coils and their dimensions. Design parameters for the 3.7 kW and 7.7 kW WPT systems, which are both operating at 40 kHz and 85 kHz, are shown in Table 2.

4. Magnetic Design and Verification

Magnetic Design and Verification of Coils Parameters

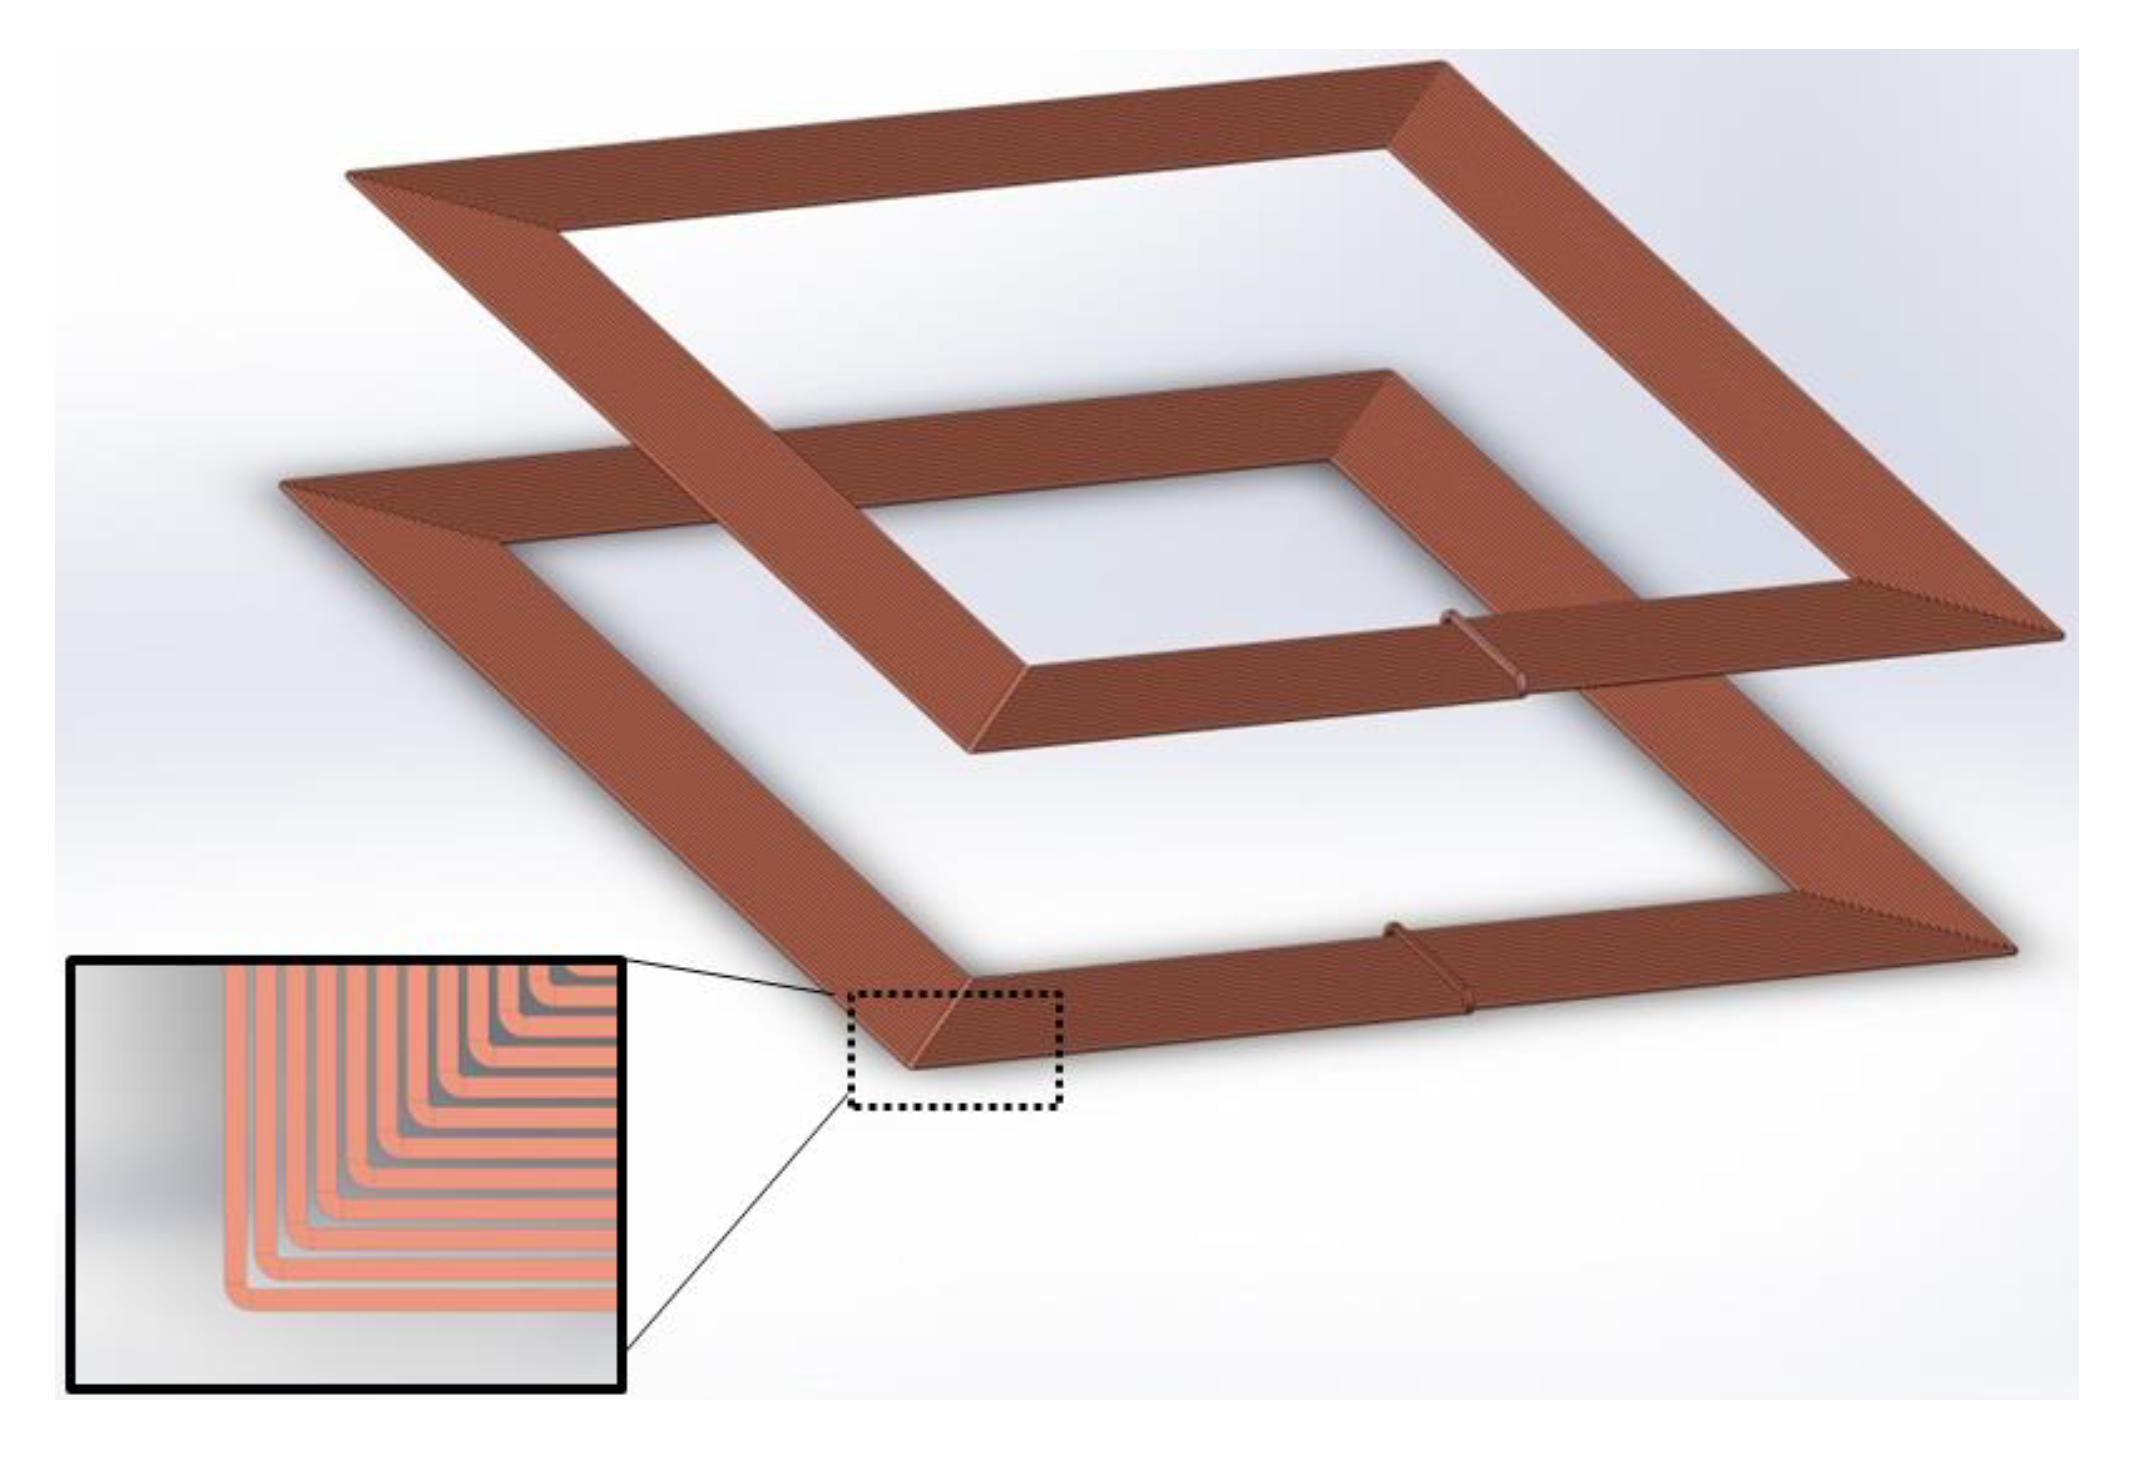
The finite element method (FEM) was used to verify the design of the coils. After the CAD models were built by the mechanical design software SOLIDWORKS, FEM computations were implemented by the commercial FEM software COMSOL Multiphysics 5.3a. The verification was implemented with a physics interface, named Magnetic Fields (mf), within the AC/DC module. An infinite element component was used to simulate the infinite far area in the air. Figure 6 shows the CAD model of the WPT system.
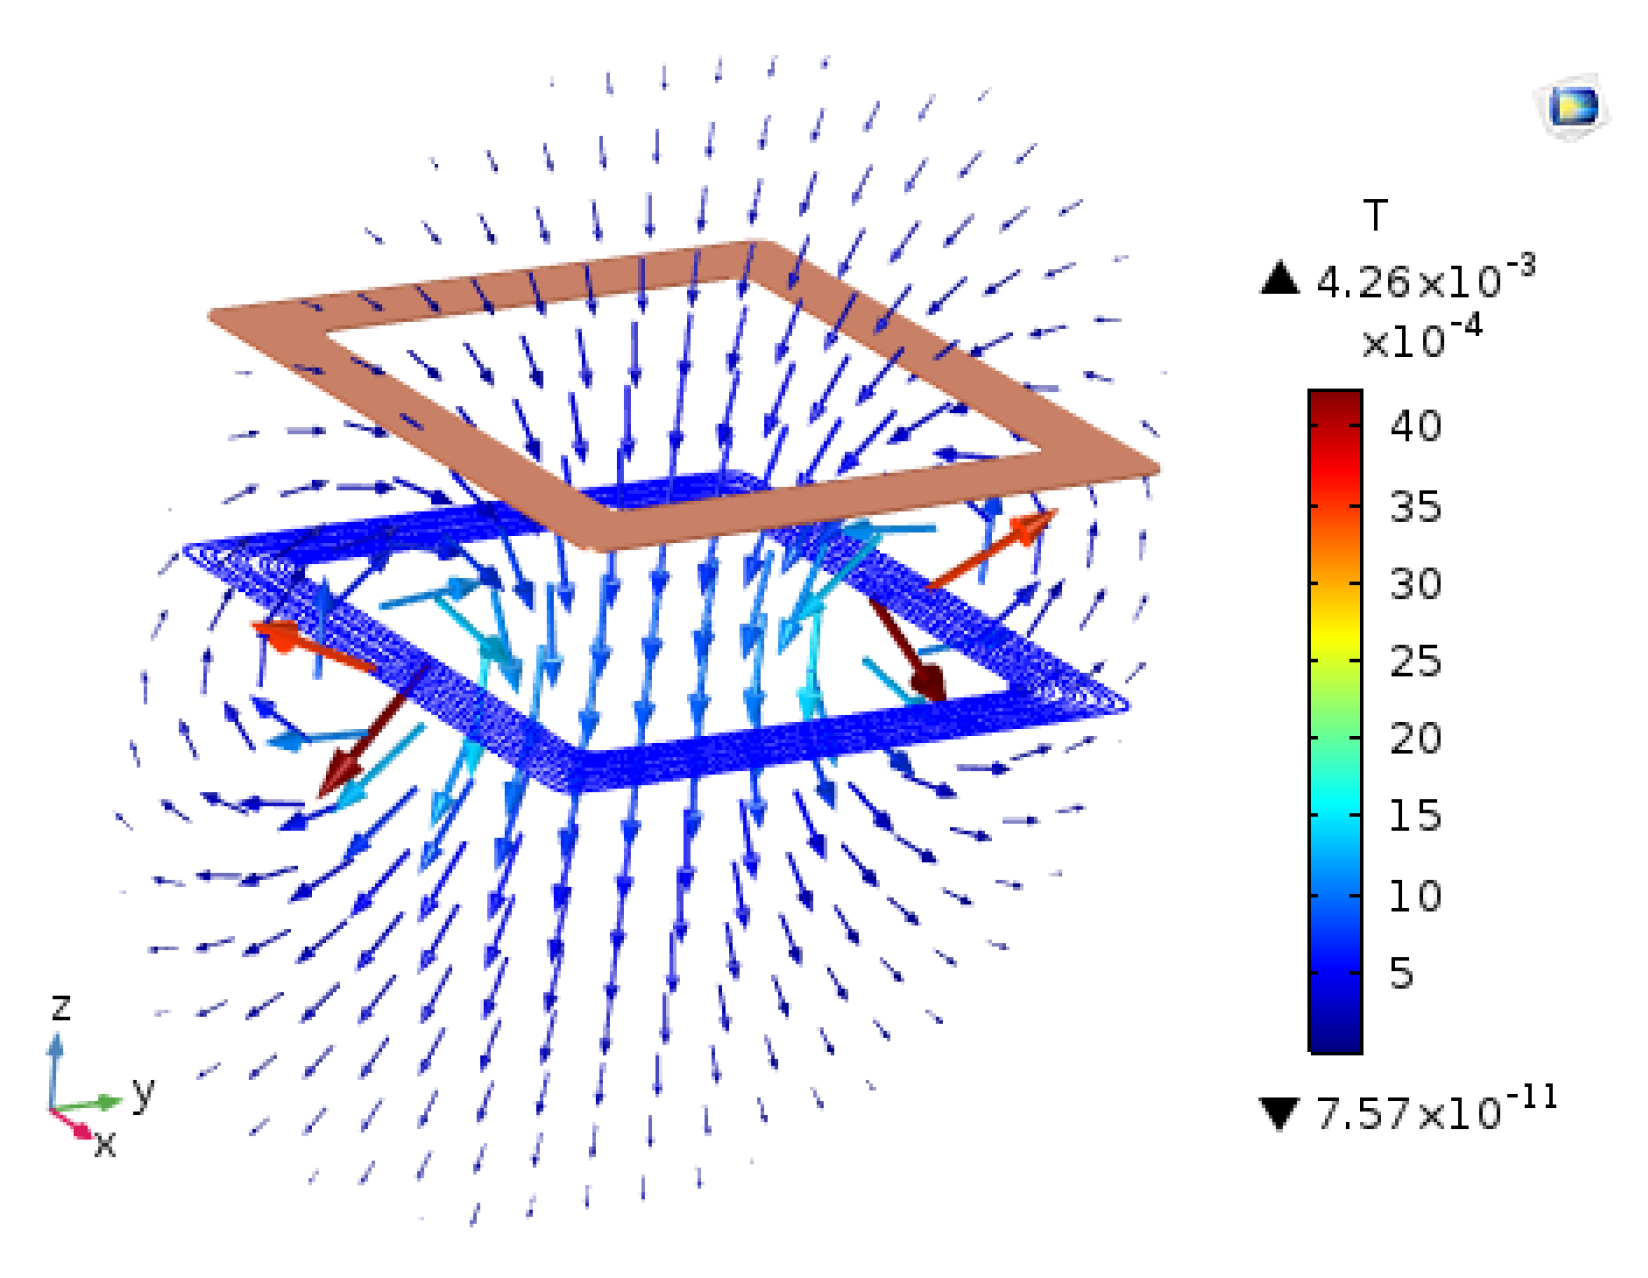
The current distribution in the primary coil and magnetic flux lines in the air are illustrated in Figure 7 in 3D, with maximum and minimum values of flux density. In this situation, the coil below is the primary coil. The current in the primary coil is 10 A and the current in the secondary coil is 0. Figure 8 shows a cross-section view of the 3D vision magnetic flux density distribution.
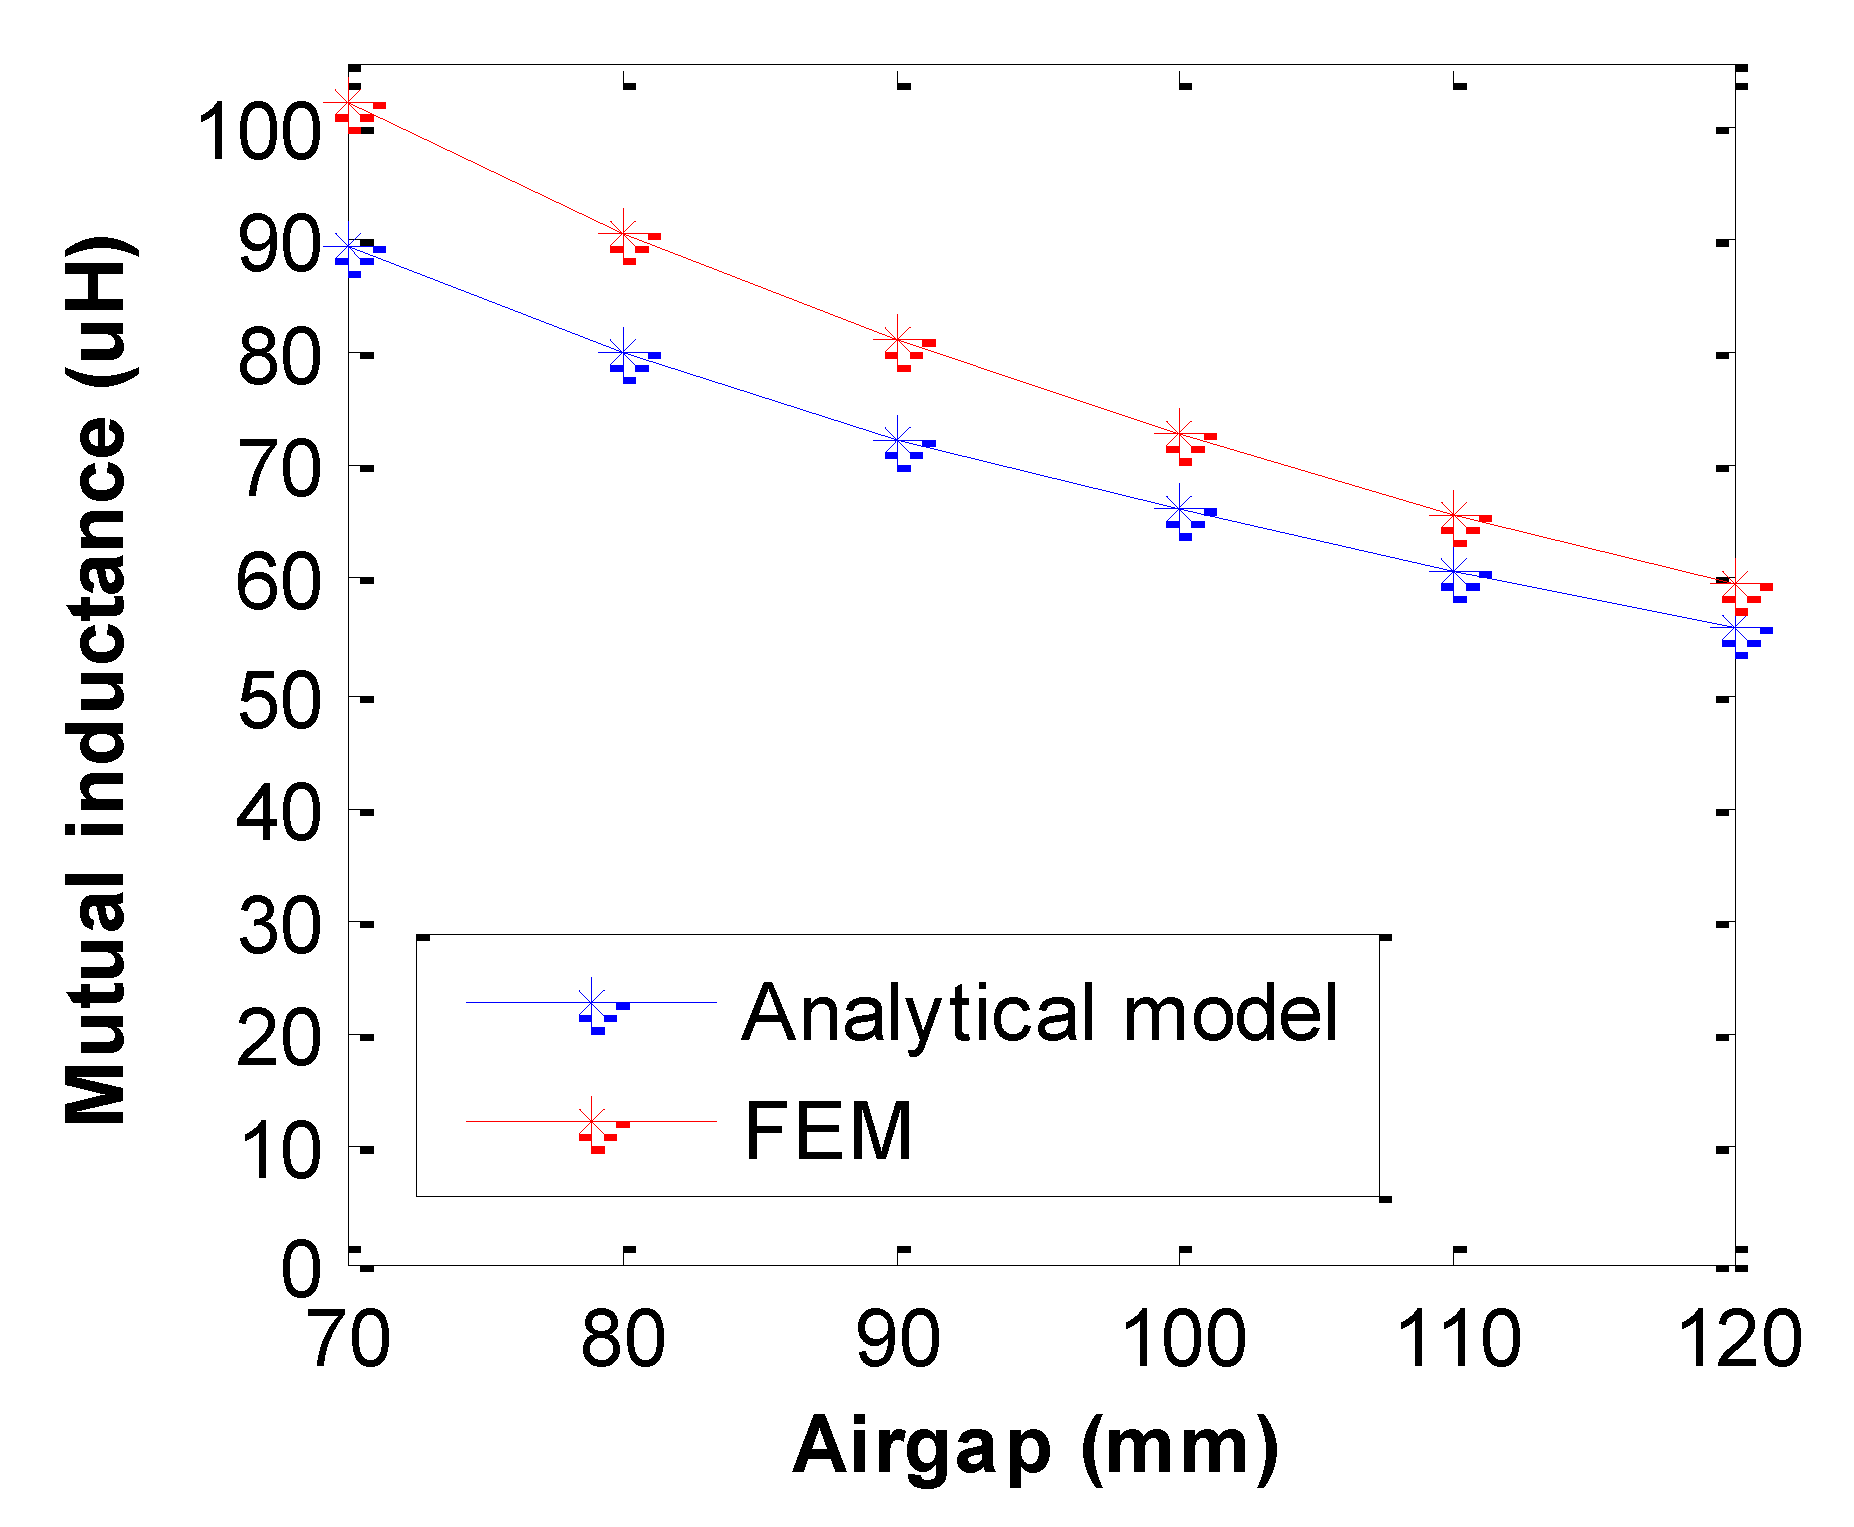
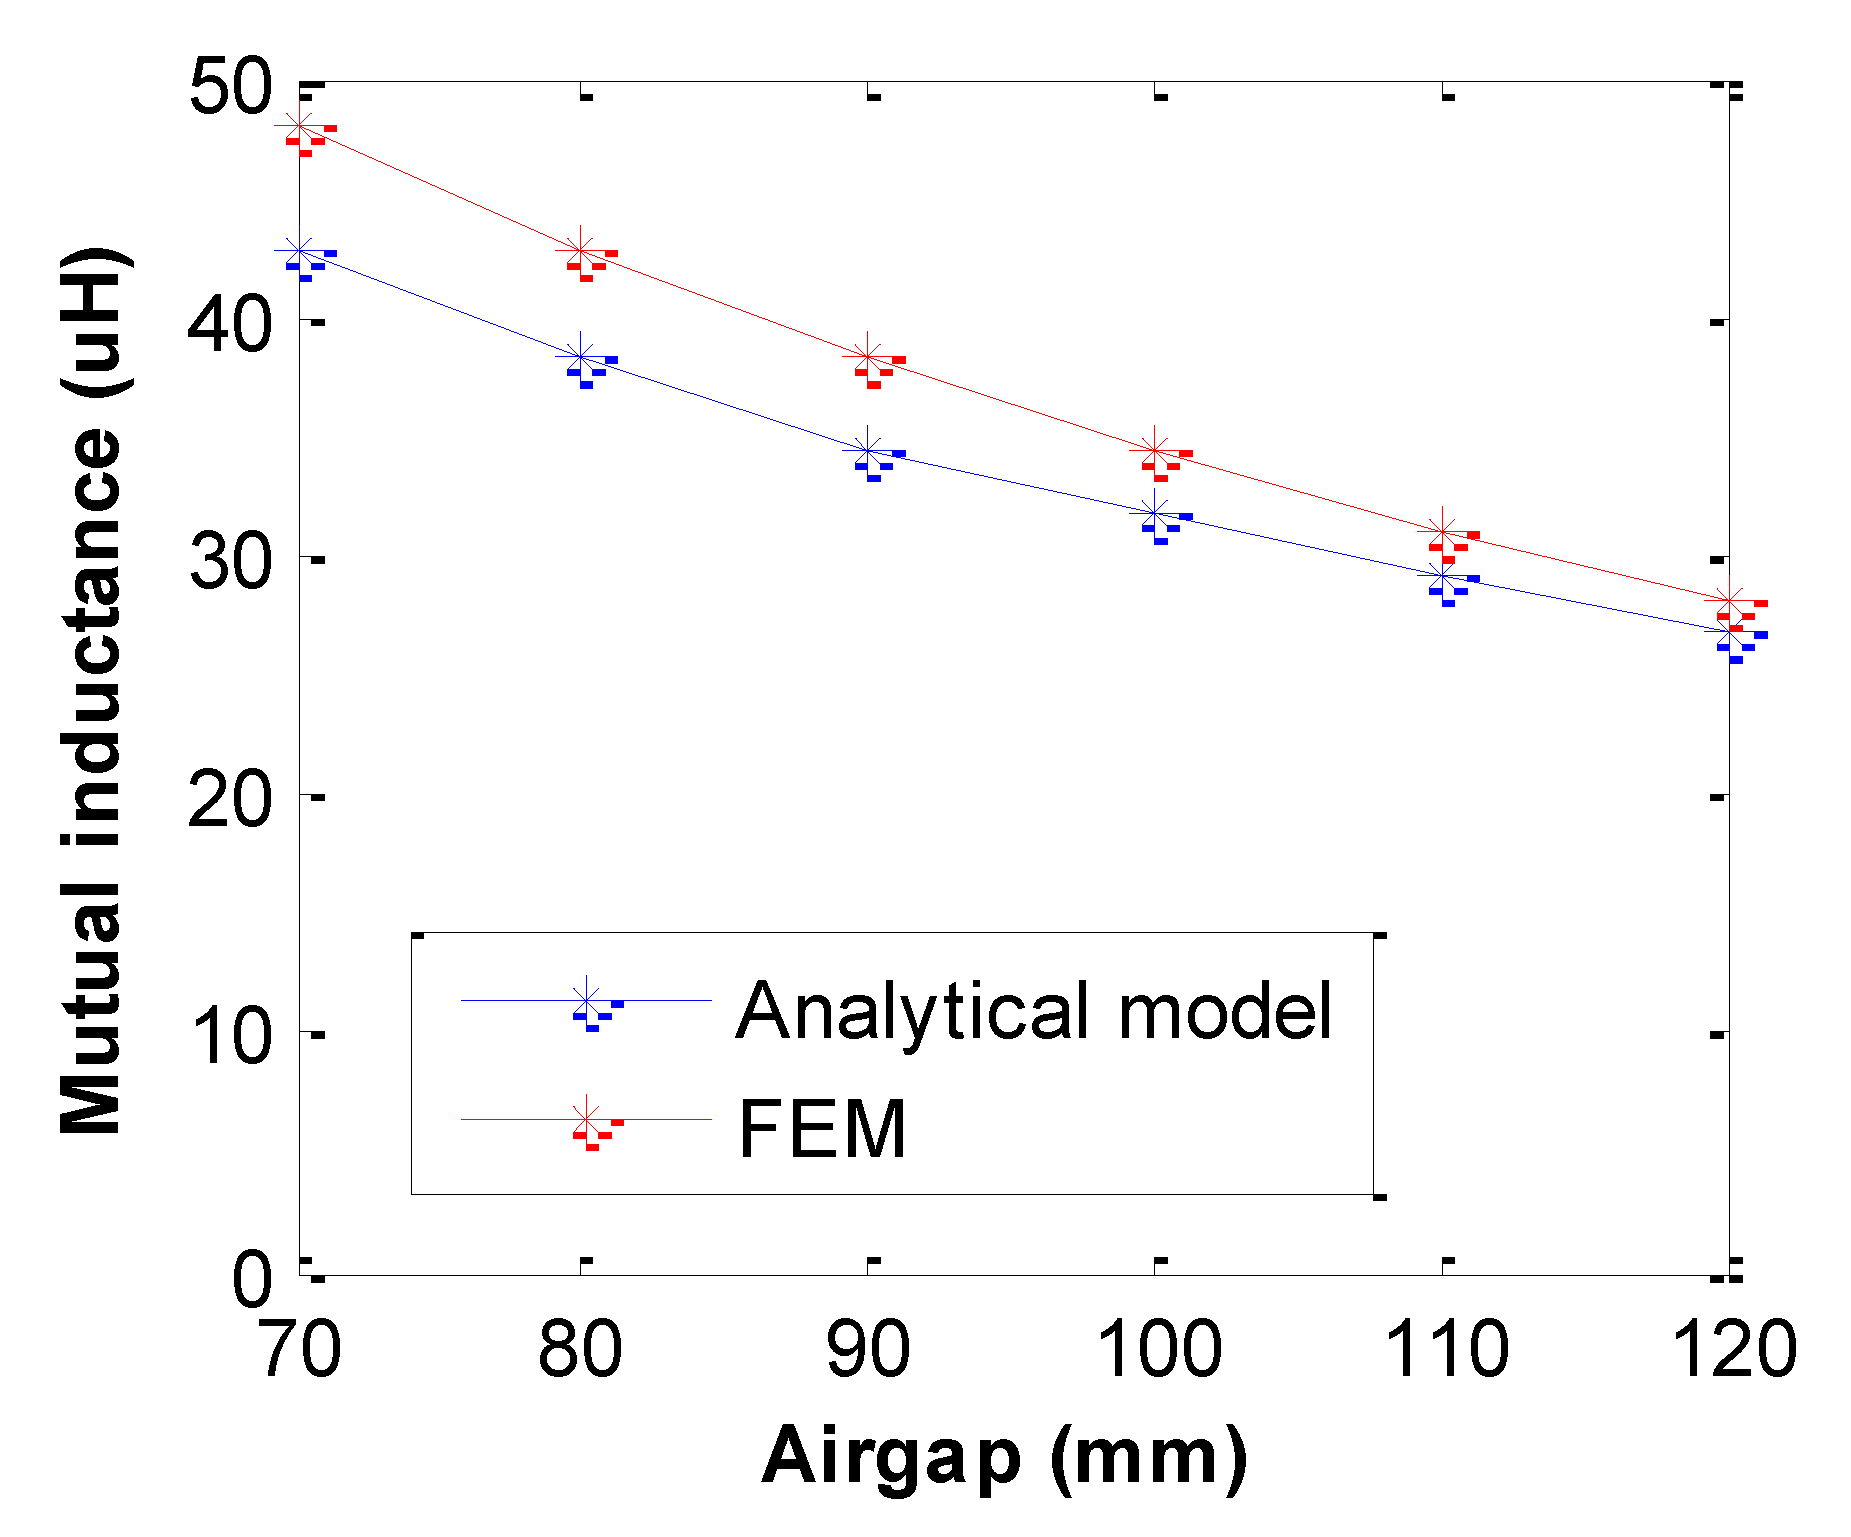
Two systems were verified. They were the 3.7 kW and 7.7 kW systems, in which the air-gaps in both were 100 mm. Self-inductance and mutual inductance were calculated respectively. Table 3 indicates the verification results between the analytical model and the FEM of the 3.7 kW and 7.7 kW WPT systems. The mutual inductance was related to air-gap between primary and secondary coil. The impact of the air-gap on the 3.7 kW and 7.7 kW systems is illustrated in Figure 9 and Figure 10, respectively. In Figure 9 and Figure 10, the mutual inductance is shown to have declined rapidly when the airgap was increased.

5. Design of Control System for a Bidirectional SS WPT System

5.1. WPT System Control for Low-Voltage Battery

Starting from the AC supply, an H-Bridge was used for the active rectification of the grid current, which was operated as a single-phase PWM rectifier when performing in the G2V mode. The ensuring DC-link was supplied by the H-Bridge as single-phase inverter, which operated in square-wave mode at a fixed switching frequency, exciting the primary resonant circuit. The output of the secondary resonant circuit was rectified using the reverse conducting diodes of the H-Bridge at the secondary side. An on-board bidirectional DC-DC converter was used to bring the rectified DC-link voltage to a lower battery pack voltage. This DC-DC converter operated as a conventional Buck converter in G2V mode.
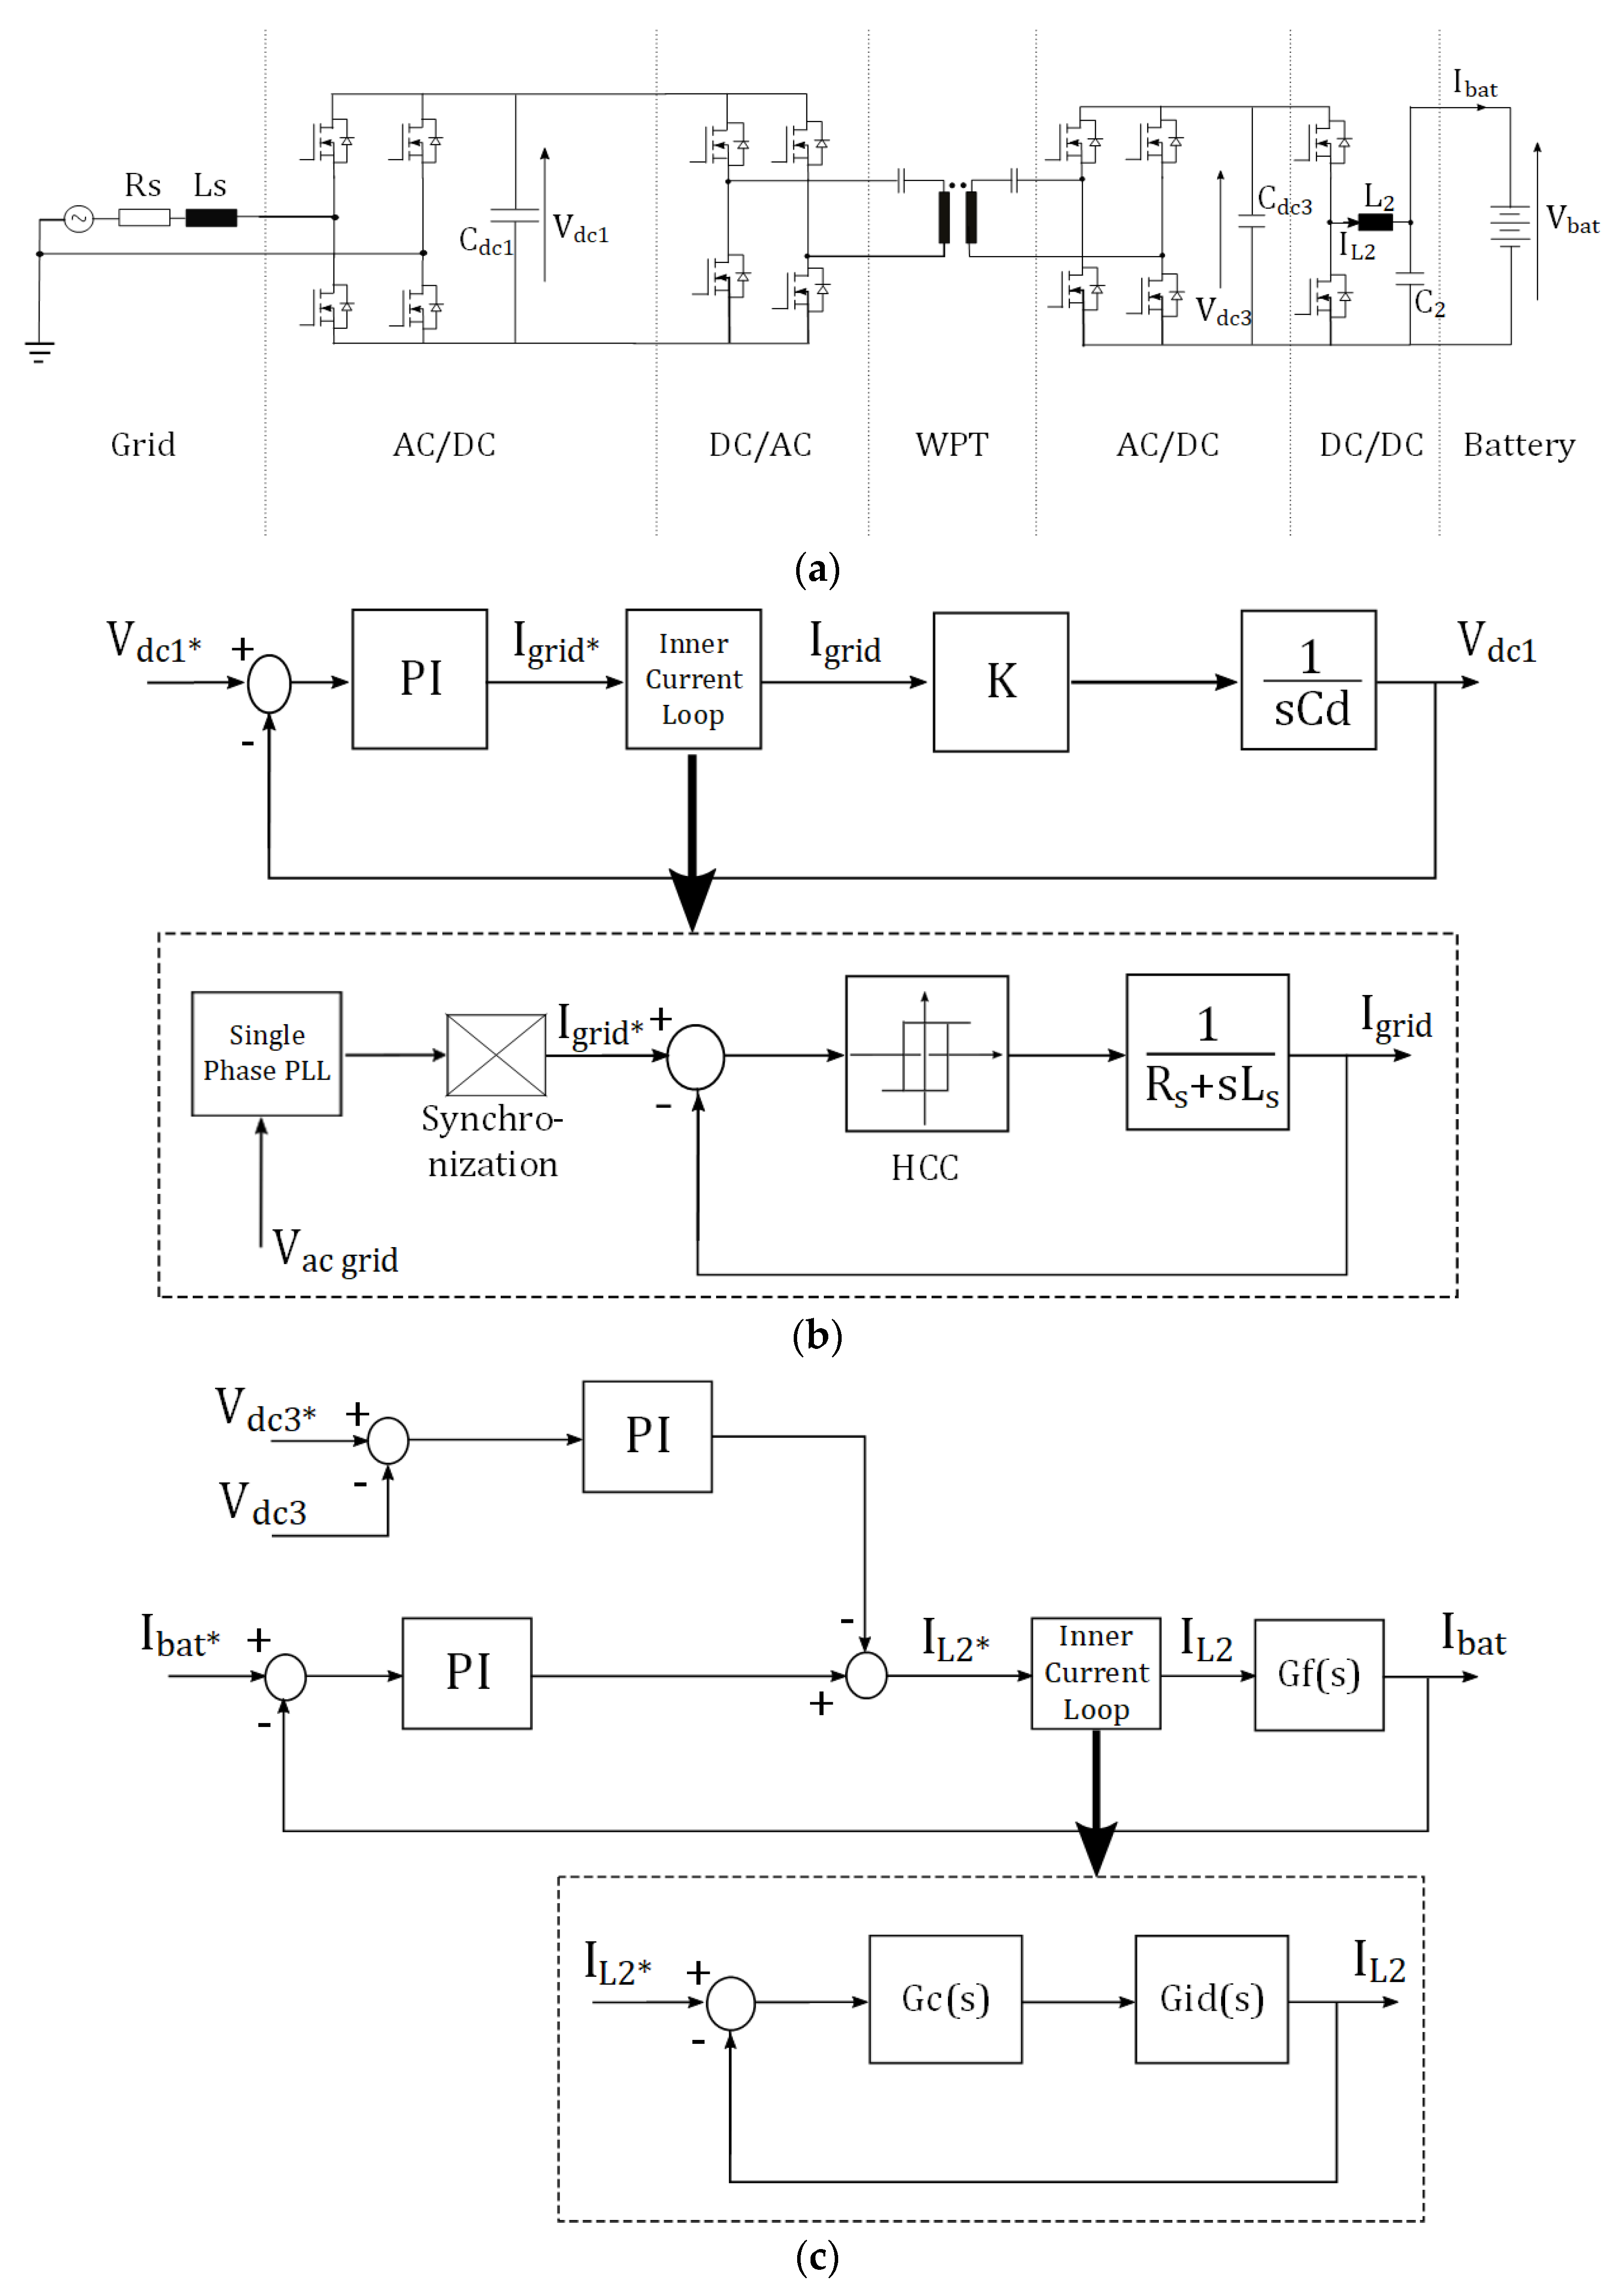
At the grid side, a hysteresis current control (HCC) was used as a current controller. The hysteresis band was set considering Metal-Oxide-Semiconductor Field-Effect Transistors (MOSFETs) as power switches, for which the maximum switching frequency lies around 40 kHz or 85 kHz. The amplitude of the voltage reference value was set by DC-link voltage control in order to maintain a constant DC voltage at 400 V. The H-Bridges exciting the primary and secondary resonant circuits were operated in square-wave operation at fixed switching frequencies. The DC-DC converter was controlled by a cascade of an inner inductor current control loop and an outer voltage battery control loop with DC-link voltage stabilization [41]. The control method block diagram is depicted in Figure 11.

5.2. Simulation Results for 3.7 kW at 40 kHz

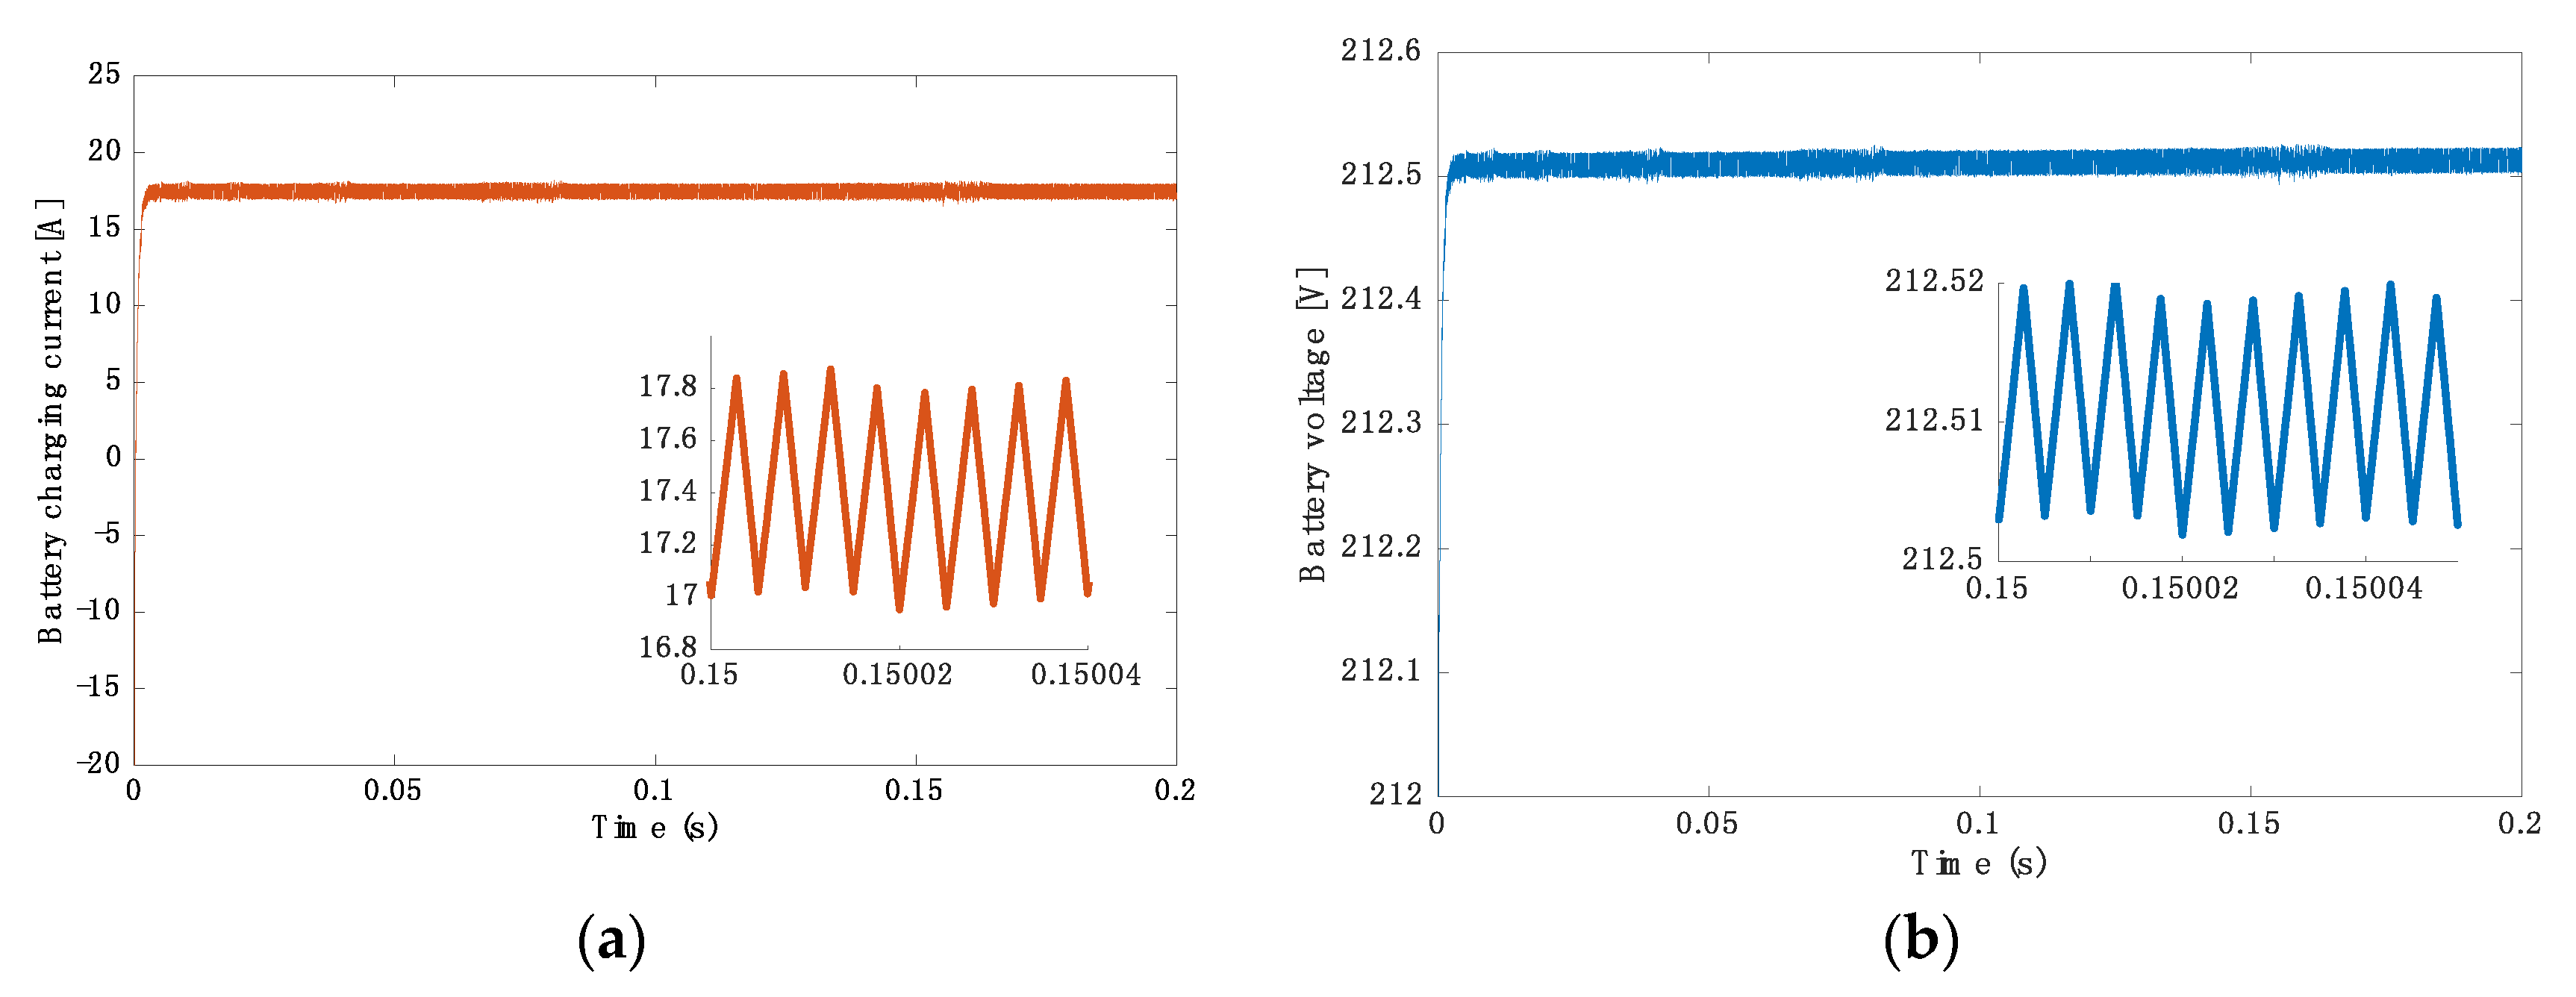
A grid-to-vehicle power transfer system was simulated for the charging of a 200 V lithium-ion battery pack. The charging battery power was set to 3700 W, and the operating frequency was set at 40 kHz. According to Figure 12a, the average battery current of 17.4 A was achieved with a ripple of 0.4 A. As can be seen in Figure 12b, a battery voltage of 212.51 V was given.
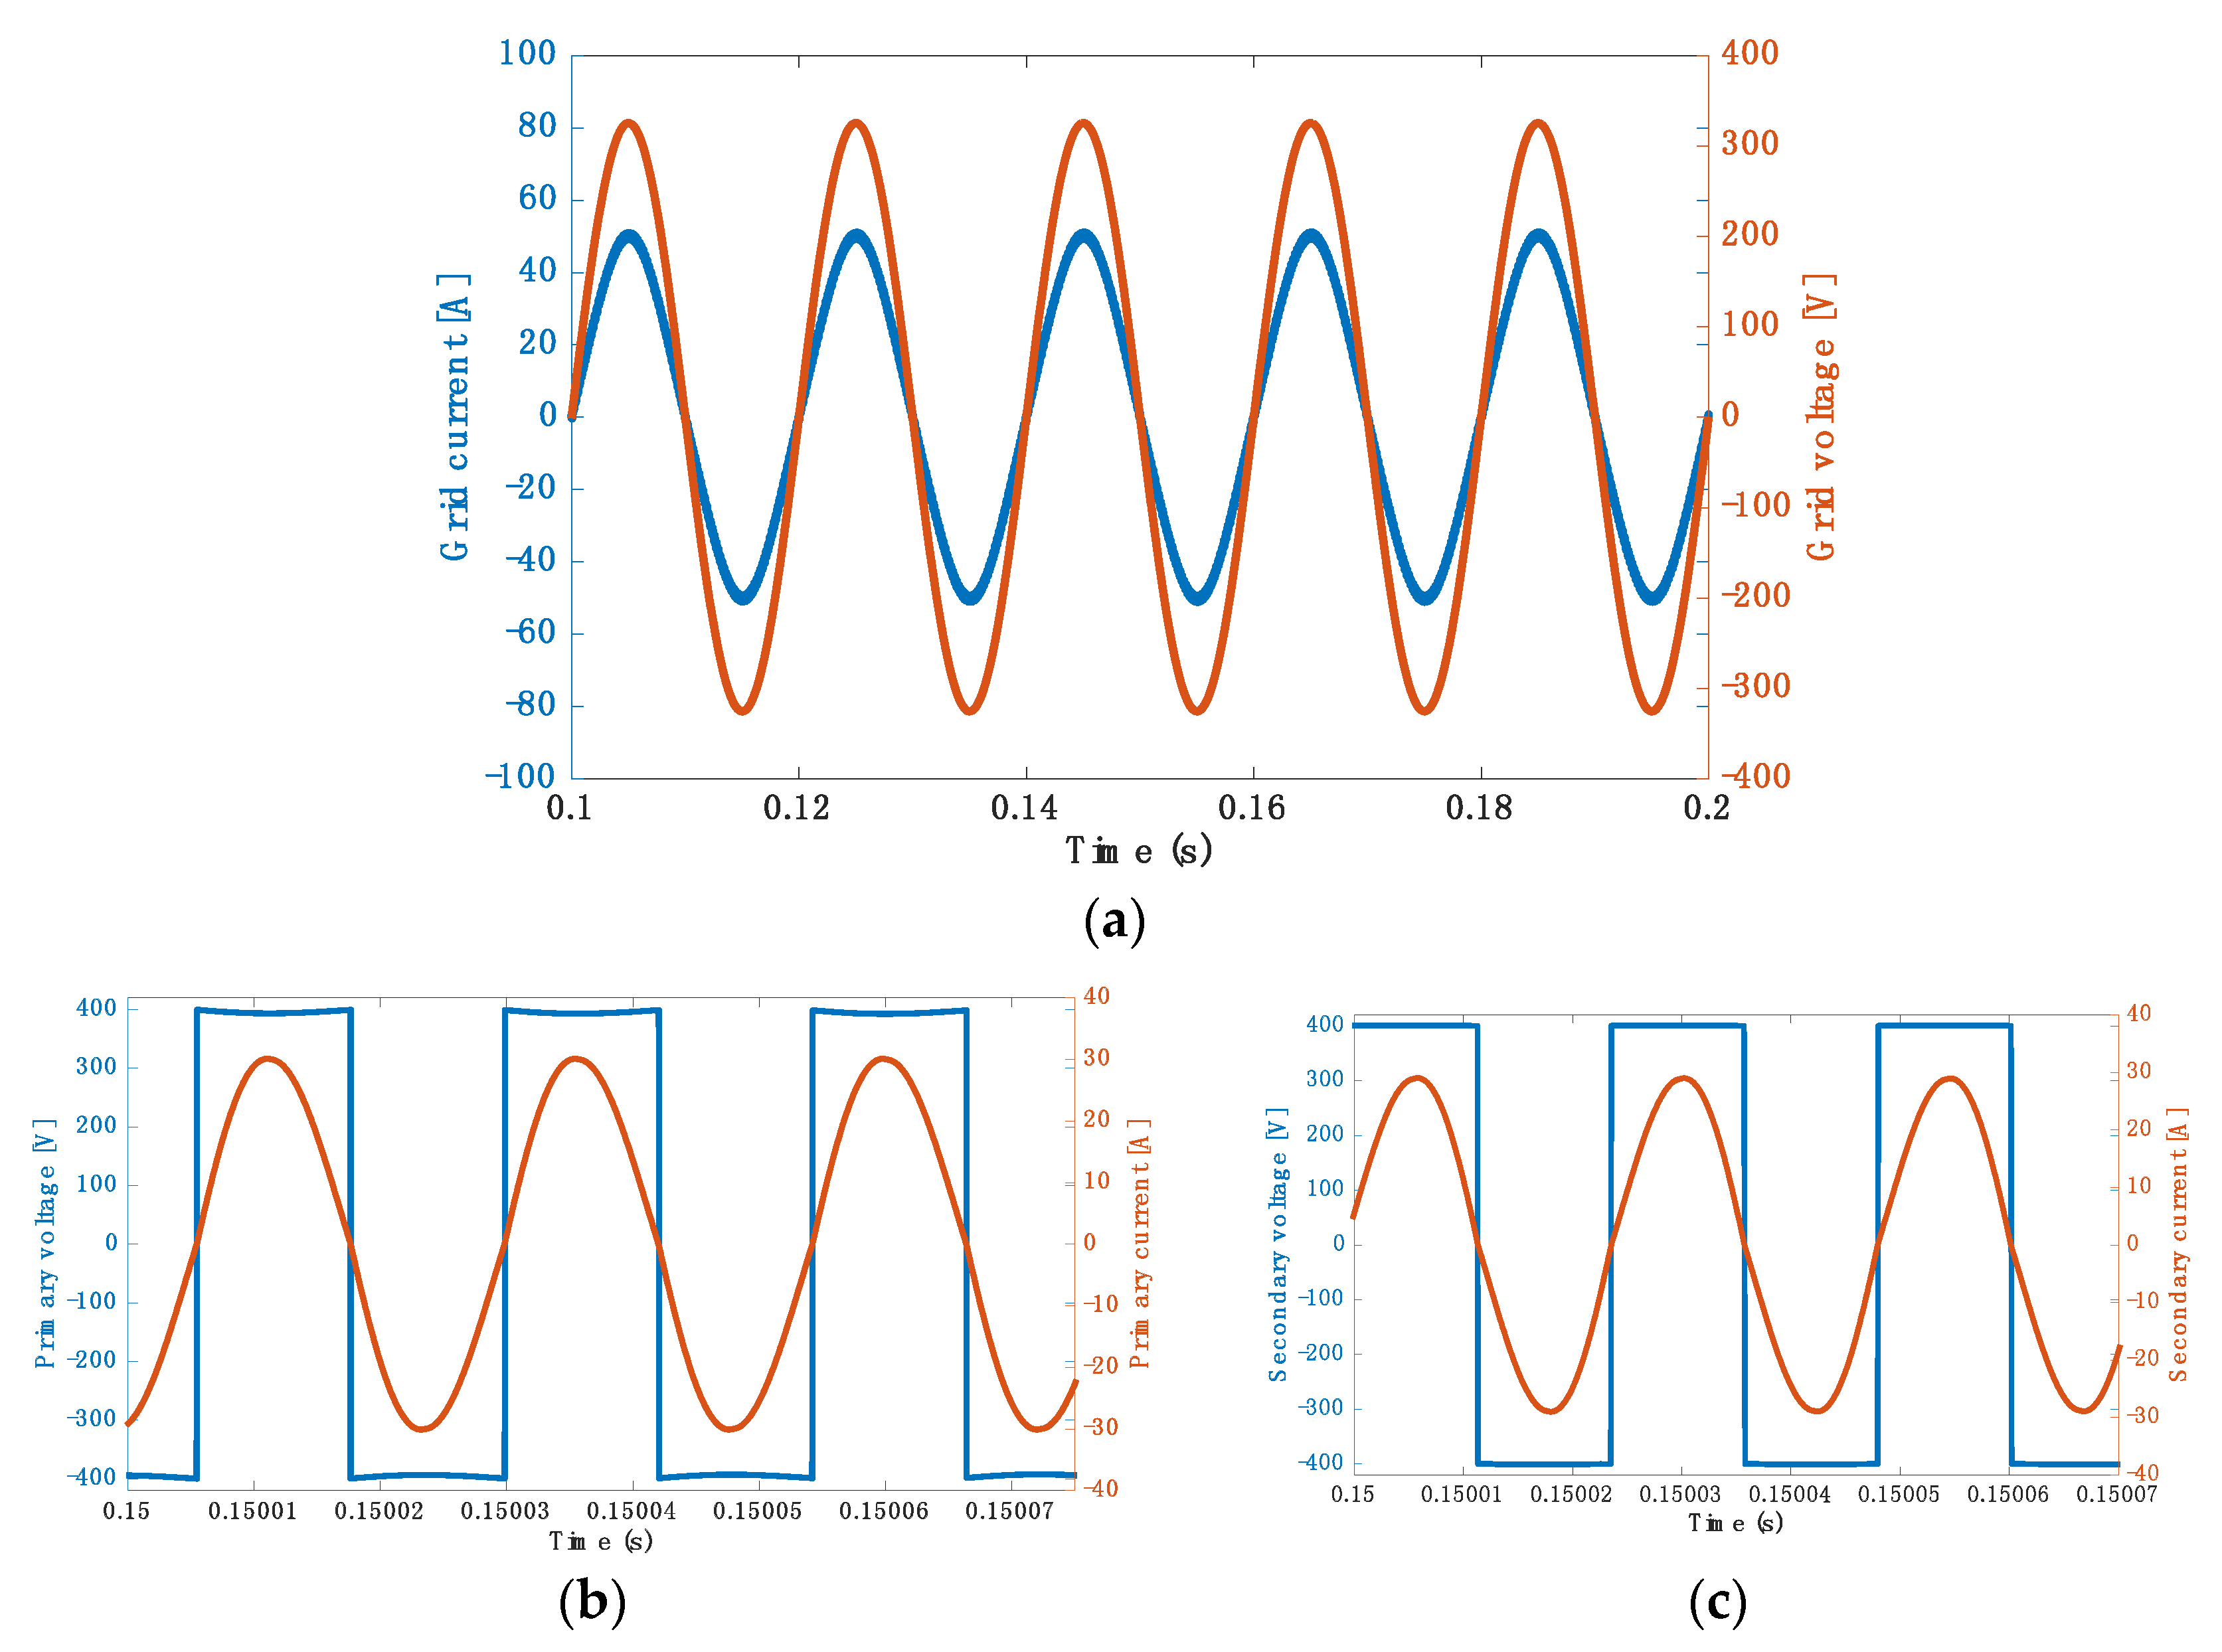
Furthermore, as can be seen in Figure 13a, the unity power factor at the grid side was achieved. Regarding the resonant circuit, Figure 13b,c show that both the primary side and secondary sides of the circuit were in resonance.

5.3. Simulation Results for 3.7 kW at 85 kHz

A grid-to-vehicle power transfer system was simulated for a battery with the identical specification as above—a 200 V lithium-ion battery pack. The battery charging power was set to 3700 W, whereas the operating frequency was set at 85 kHz. A battery discharging current of 17 A was achieved with a ripple of 8 A, as shown in Figure 14a. Figure 14b demonstrates the battery voltage of 212.5 V.
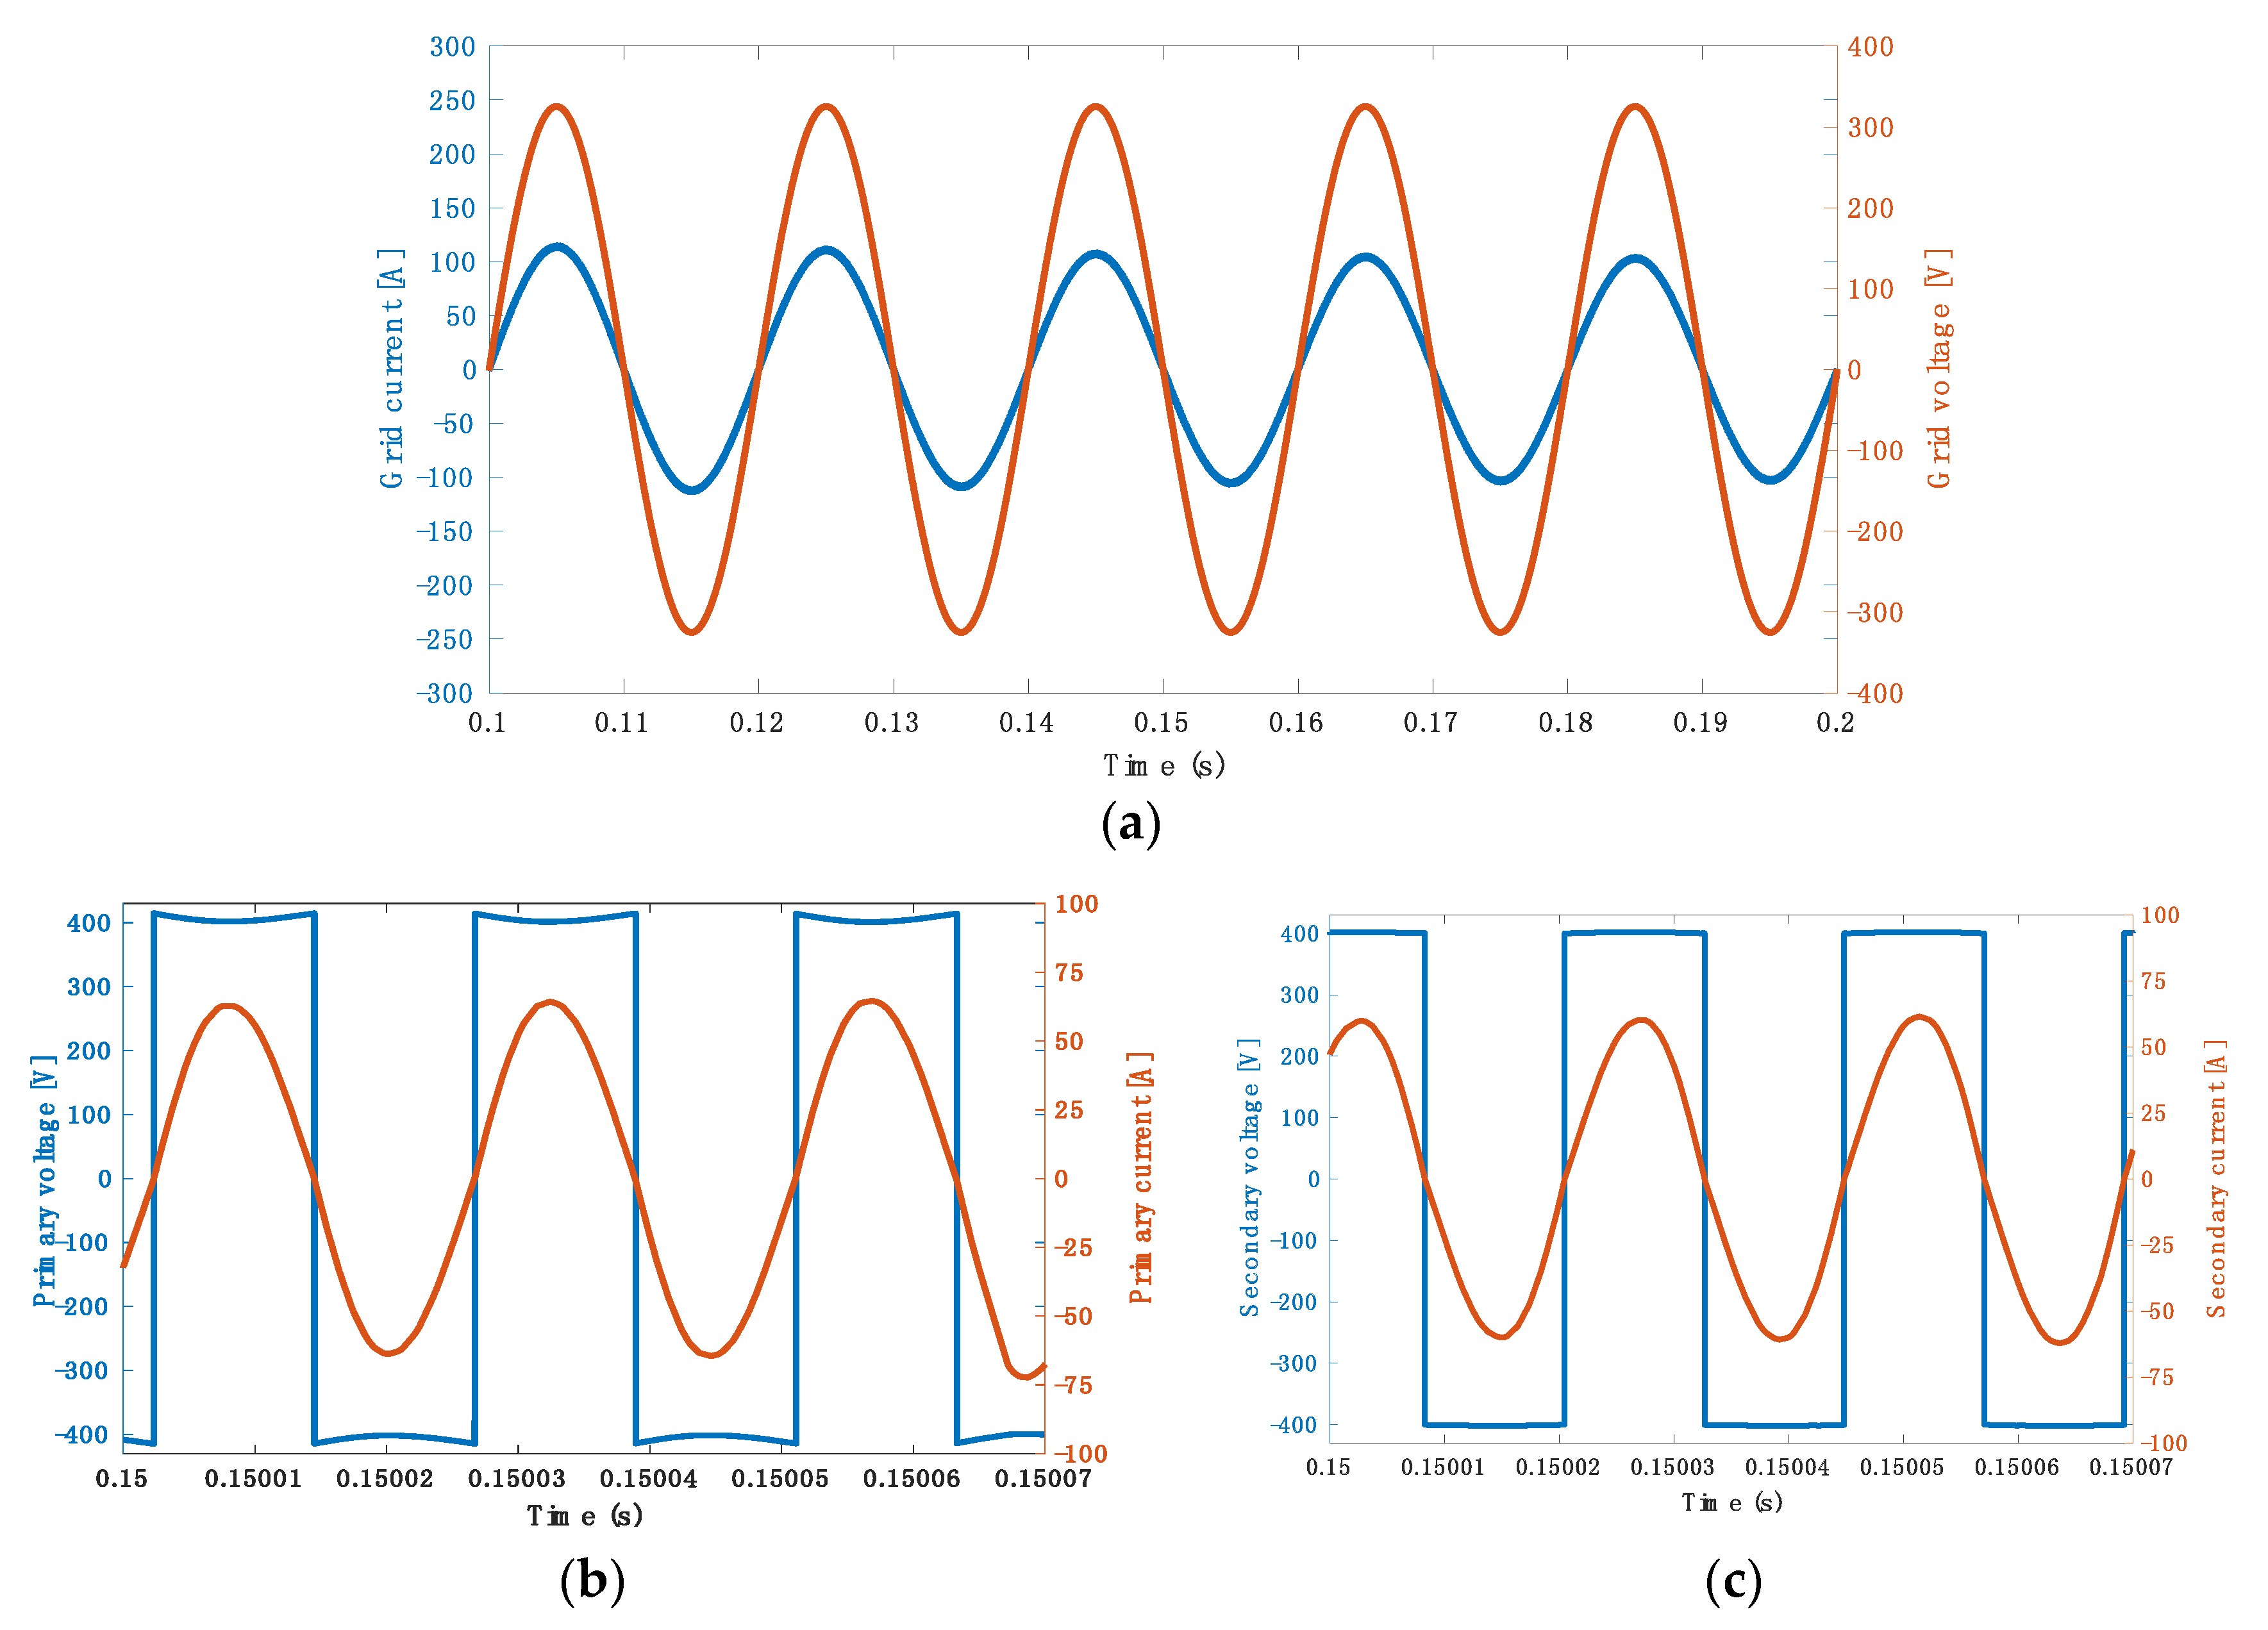
Furthermore, the unity power factor was achieved, as can be seen in Figure 15a. Regarding the resonant circuit, Figure 15b,c show that both the primary and secondary sides of the circuit were in resonance.

5.4. Simulation Results for 7.7 kW at 40 kHz

A grid-to-vehicle power transfer system was simulated for the charging of a 200 V lithium-ion battery pack. The charging power reference was set at 7700 W, while the operating frequency was set at 40 kHz. As shown in Figure 16a, the average battery current of 36 A was achieved with a ripple of 1 A. Figure 16b shows the battery voltage of 212.88 V.
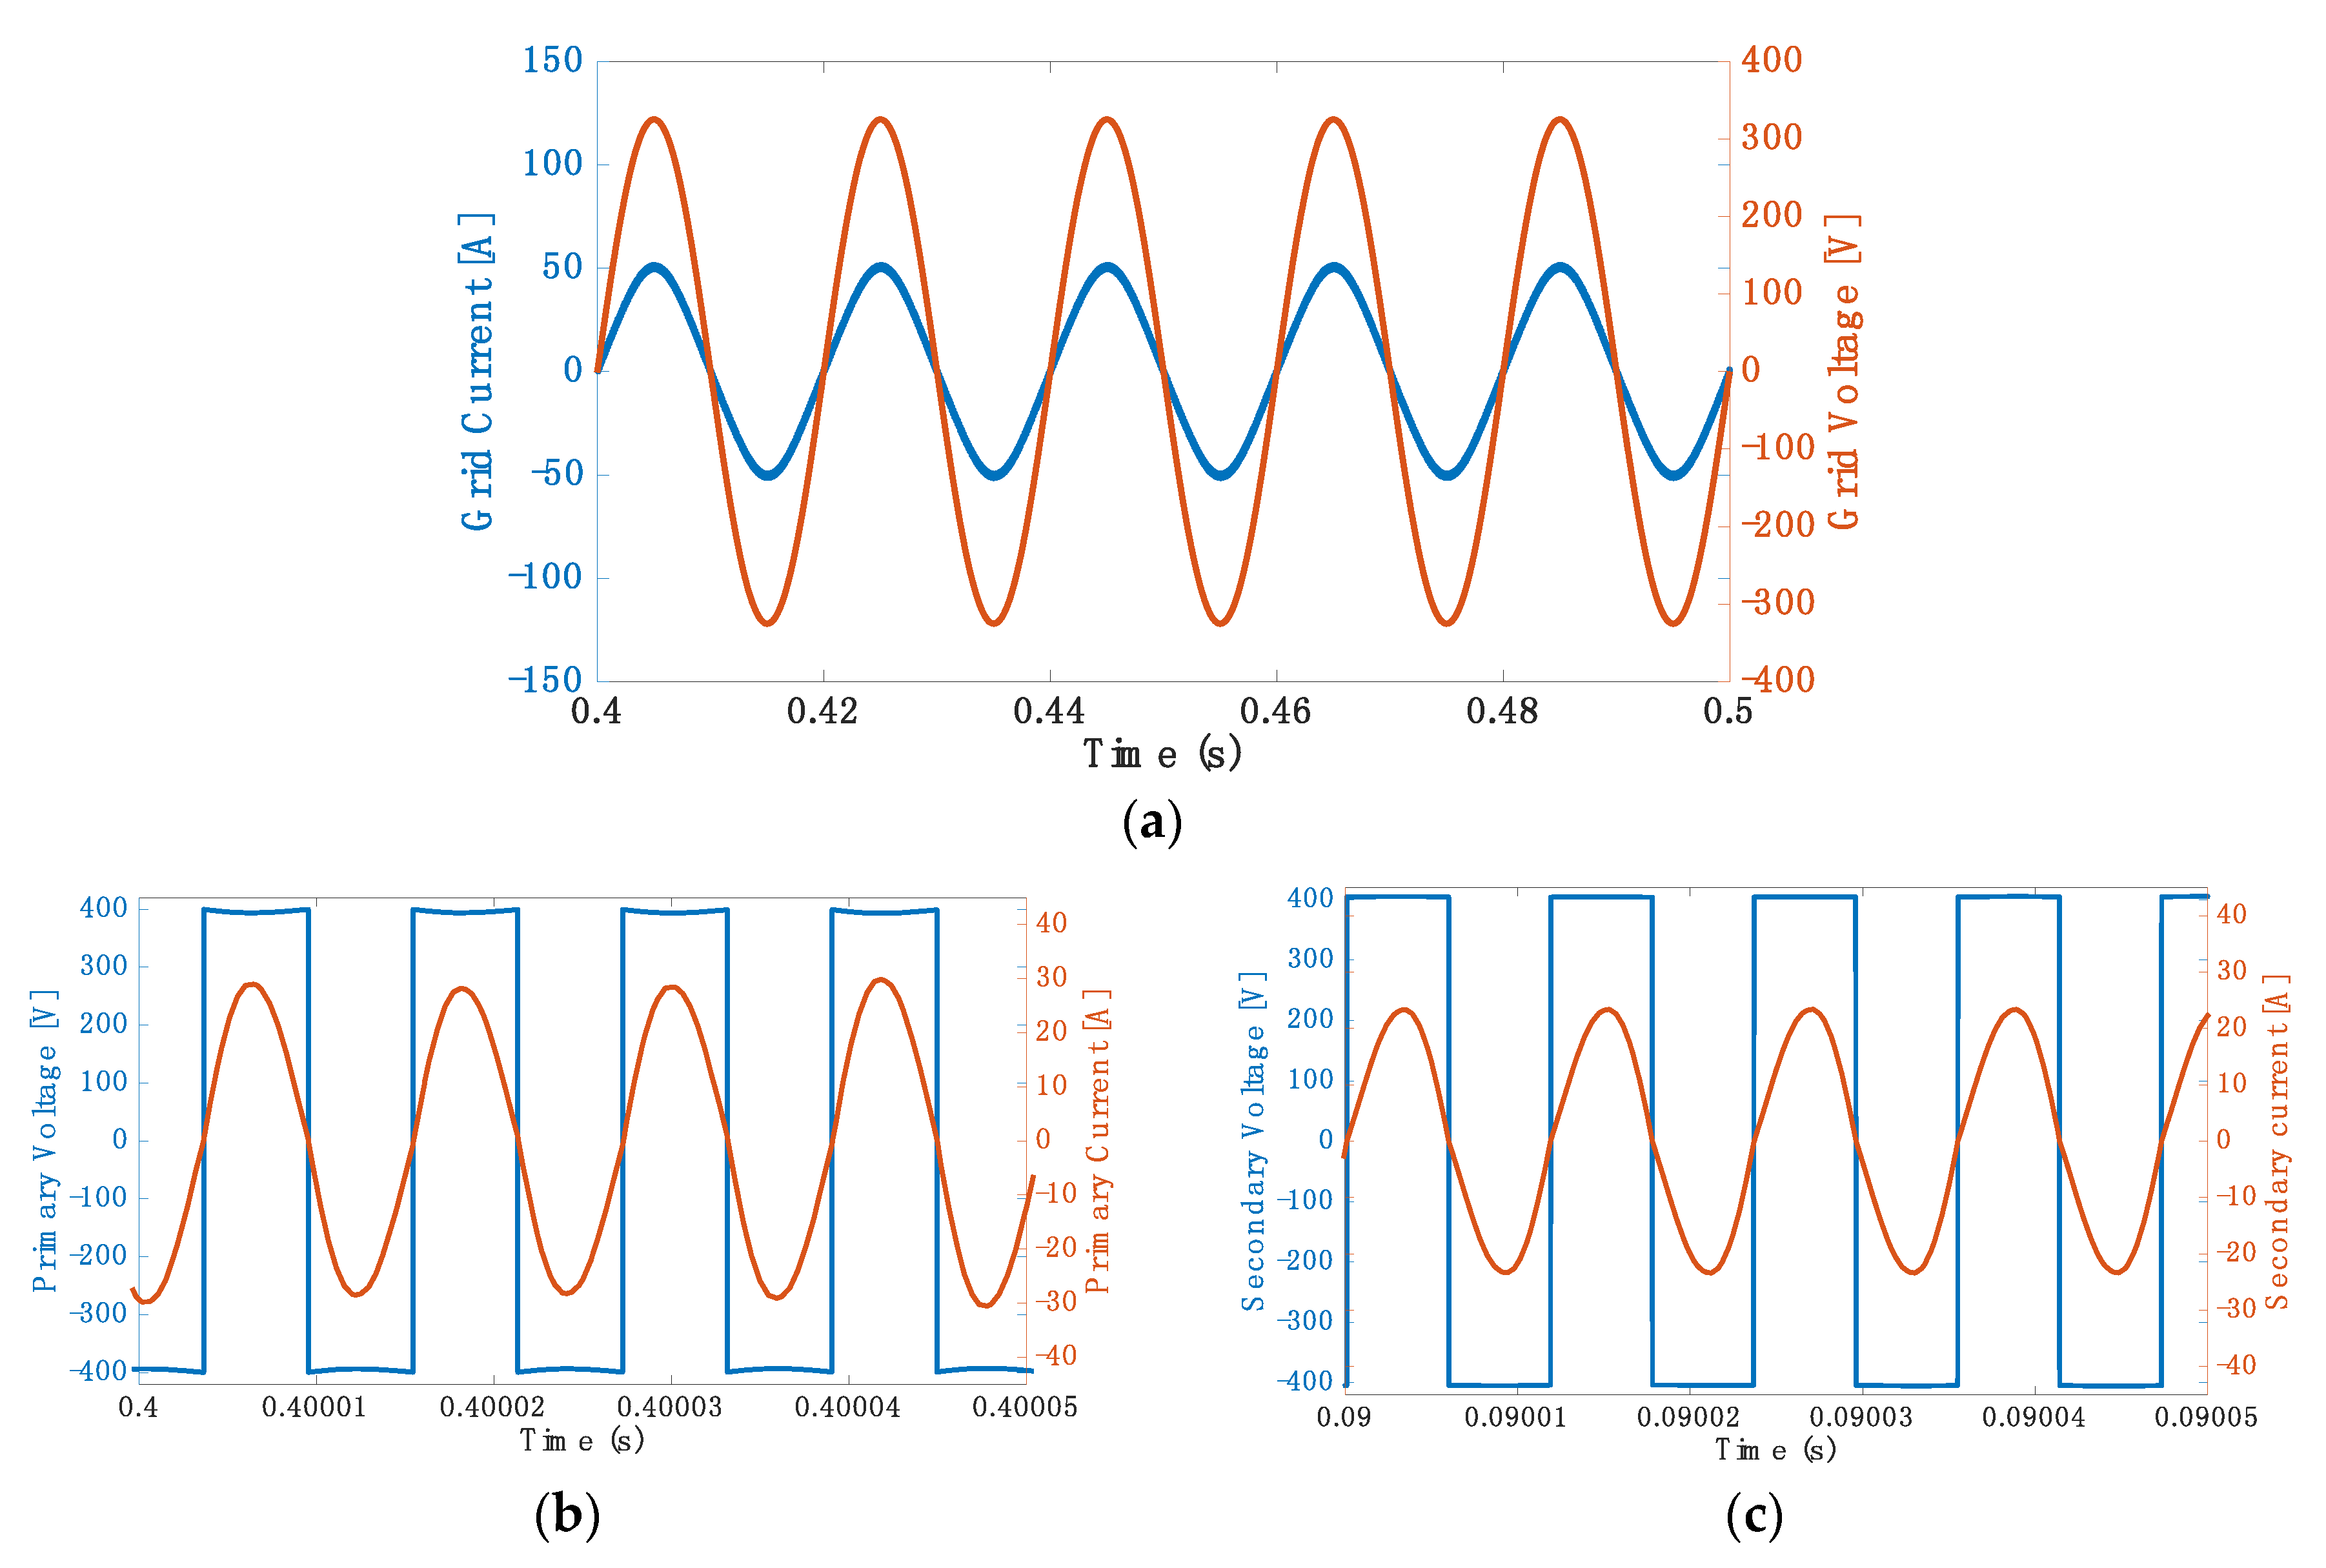
Furthermore, the unity power factor was achieved, as can be seen in Figure 17a. Regarding the resonant circuit, Figure 17b,c demonstrate that both the primary and secondary sides of the circuit were in resonance.

5.5. Simulation Results for 7.7 kW at 85 kHz

A grid-to-vehicle power transfer system was simulated for a battery with a 150 V lithium-ion battery pack. The battery charging power was set at 7700 W, but the operating frequency was set at 85 kHz. Figure 18a shows a battery discharging current of 48 A with a ripple of 6 A. At the battery side, a battery voltage of 159.7 V is shown in Figure 18b.
Furthermore, as can be seen in Figure 19a, the unity power factor was achieved. Regarding the resonant circuit, Figure 19b,c demonstrate that both the primary and secondary sides of the circuit were in resonance.

6. Experimental Validation

To validate the concept of the proposed topology in Figure 20, a prototype of the 3.7 kW WPT system was built and tested in our laboratory, as illustrated in Figure 21. For the experimental testing, the load resistance was adjusted to 8.3 Ω, the switching frequency was set to 37 kHz, while the input single-phase AC voltage from the utility grid was 230 V. Each leg of the H-Bridge was connected with a 1.5 uF snubber capacitor to reduce the spike voltage of SiC MOSFETs. The parameters of the lab measurement and simulation are given in Table 4, and Table 5 shows the components used for the prototype. The 37 kHz switching frequency, which is not the perfect resonance frequency (40 kHz), was experimentally used to minimize the voltage spikes during the SiC MOSFETs switching (at on/off states) and to provide satisfied waveforms of current and voltage in both sides. Meanwhile, it was necessary to consider the efficiency of the WPT system. The main focus was on the realization of the WPT concept and design.
Figure 22 shows the waveforms of the primary and secondary sides (voltage and current).
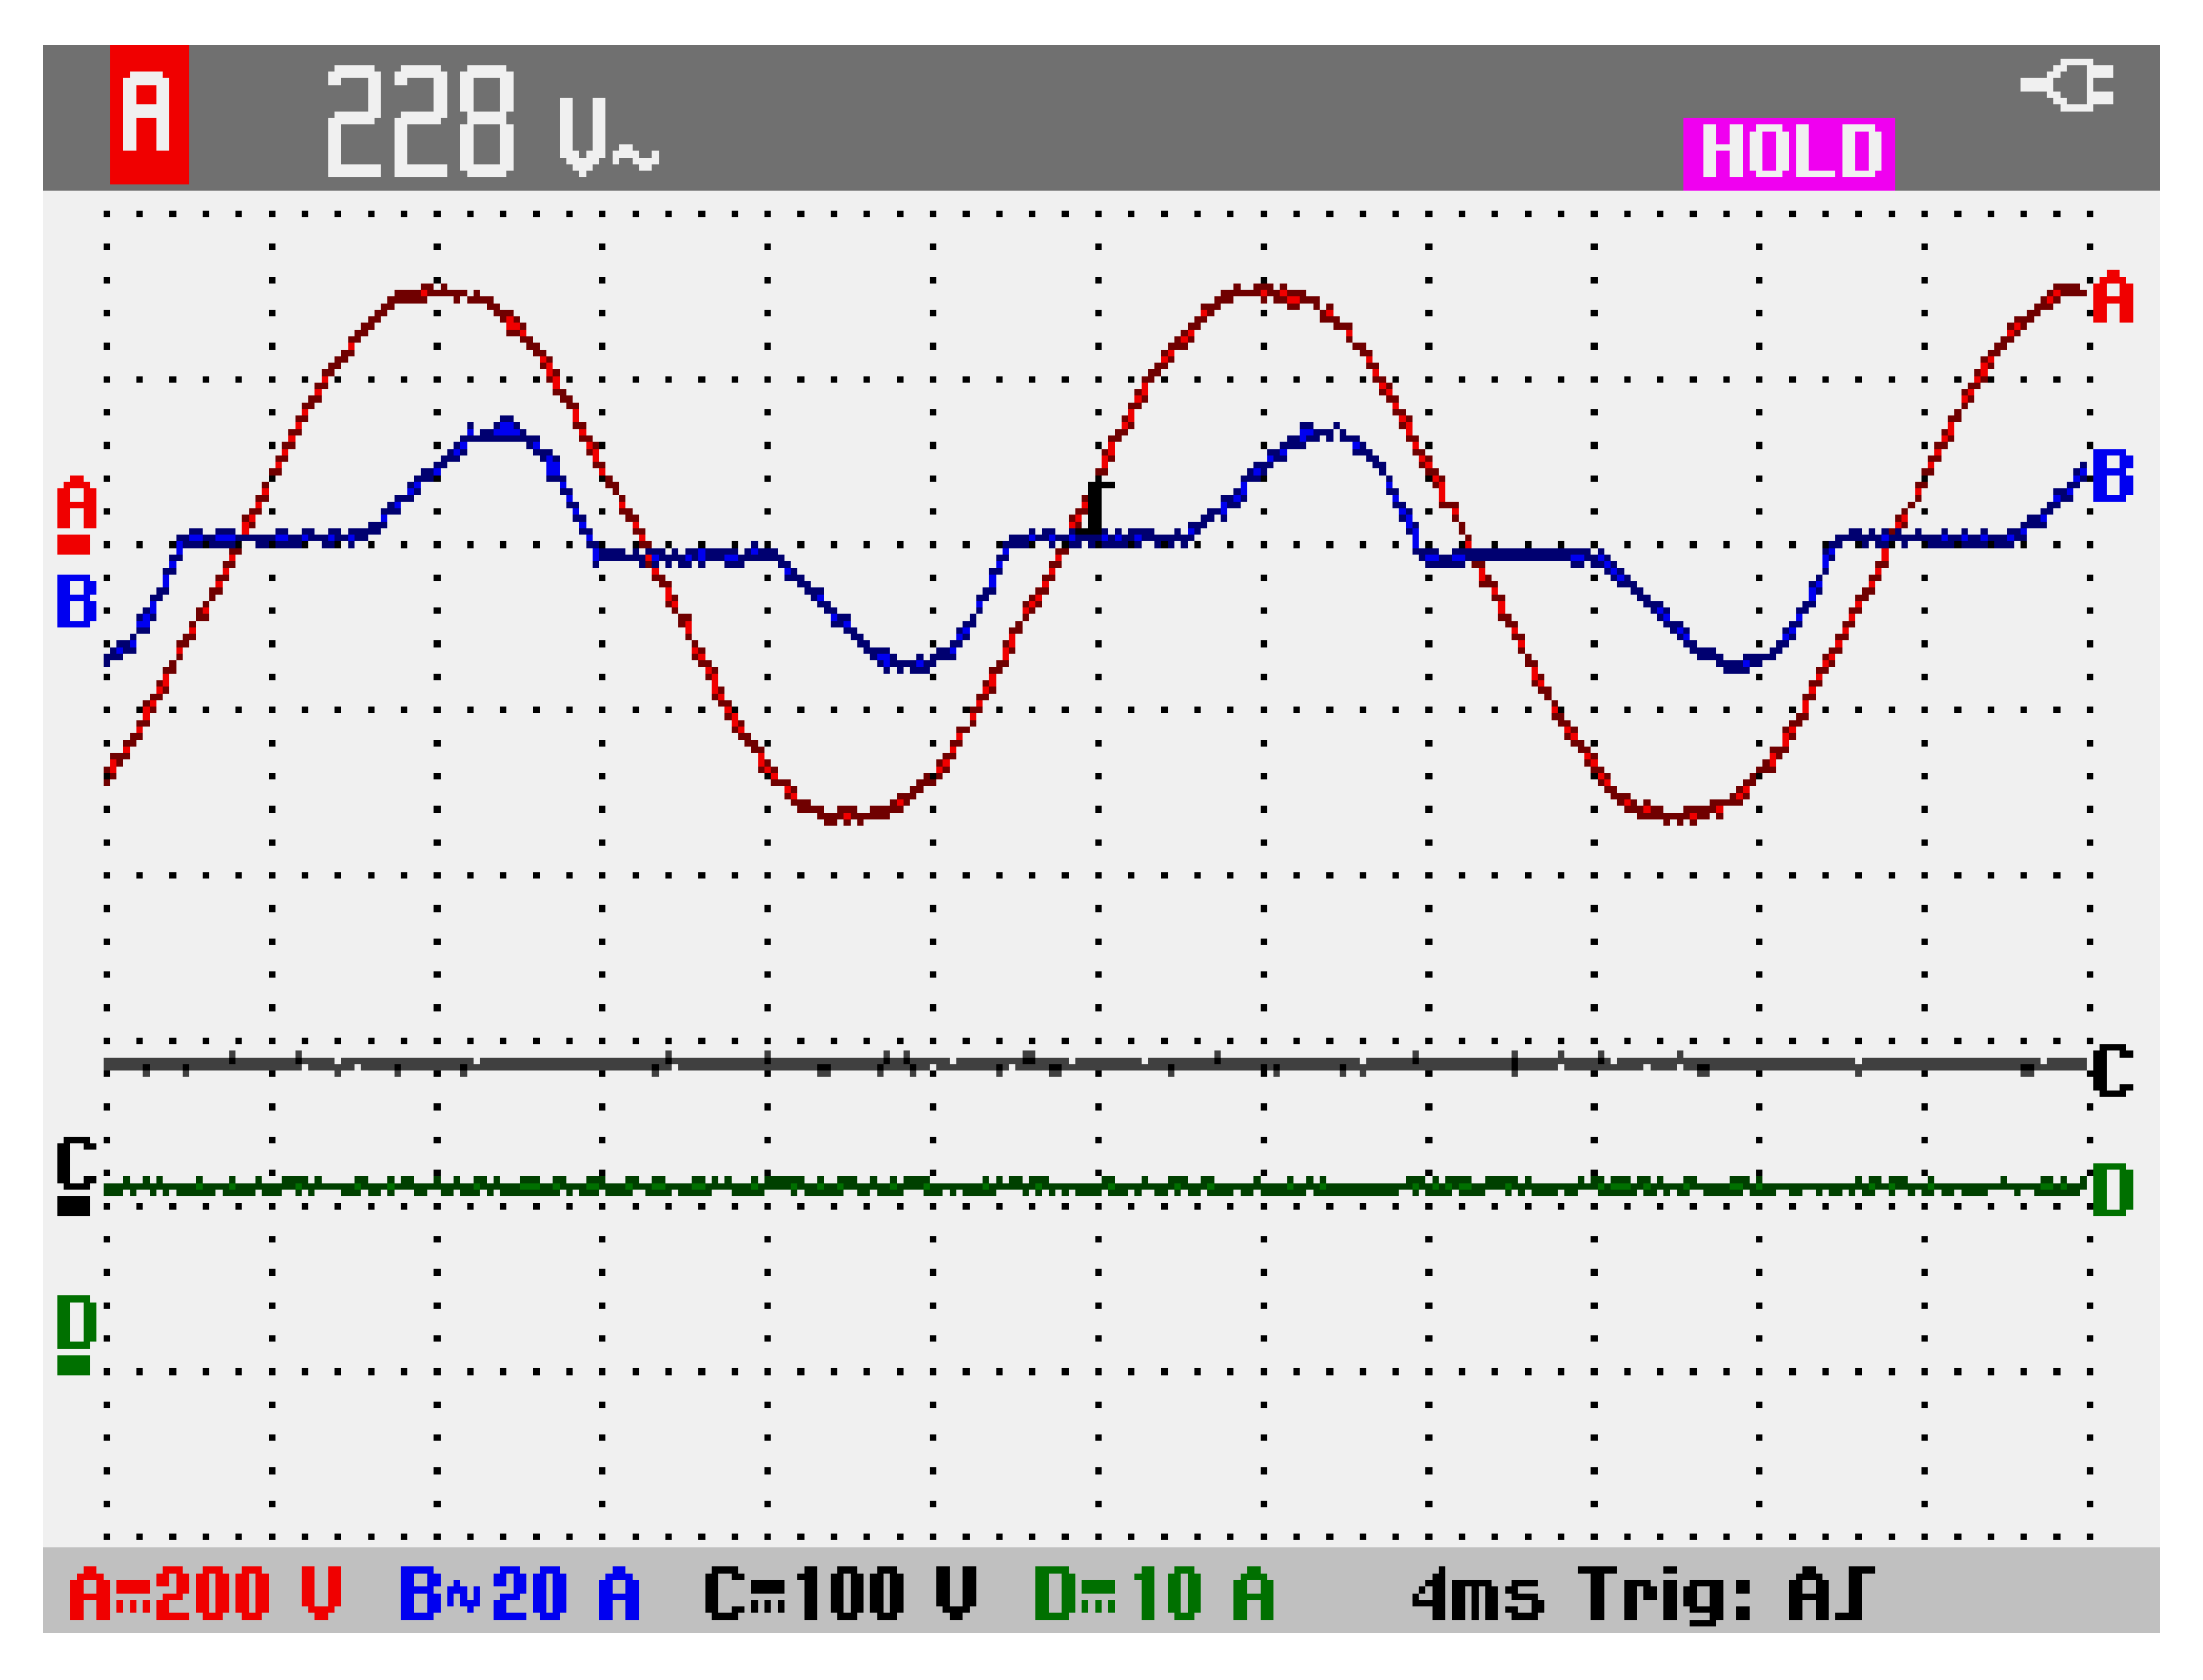
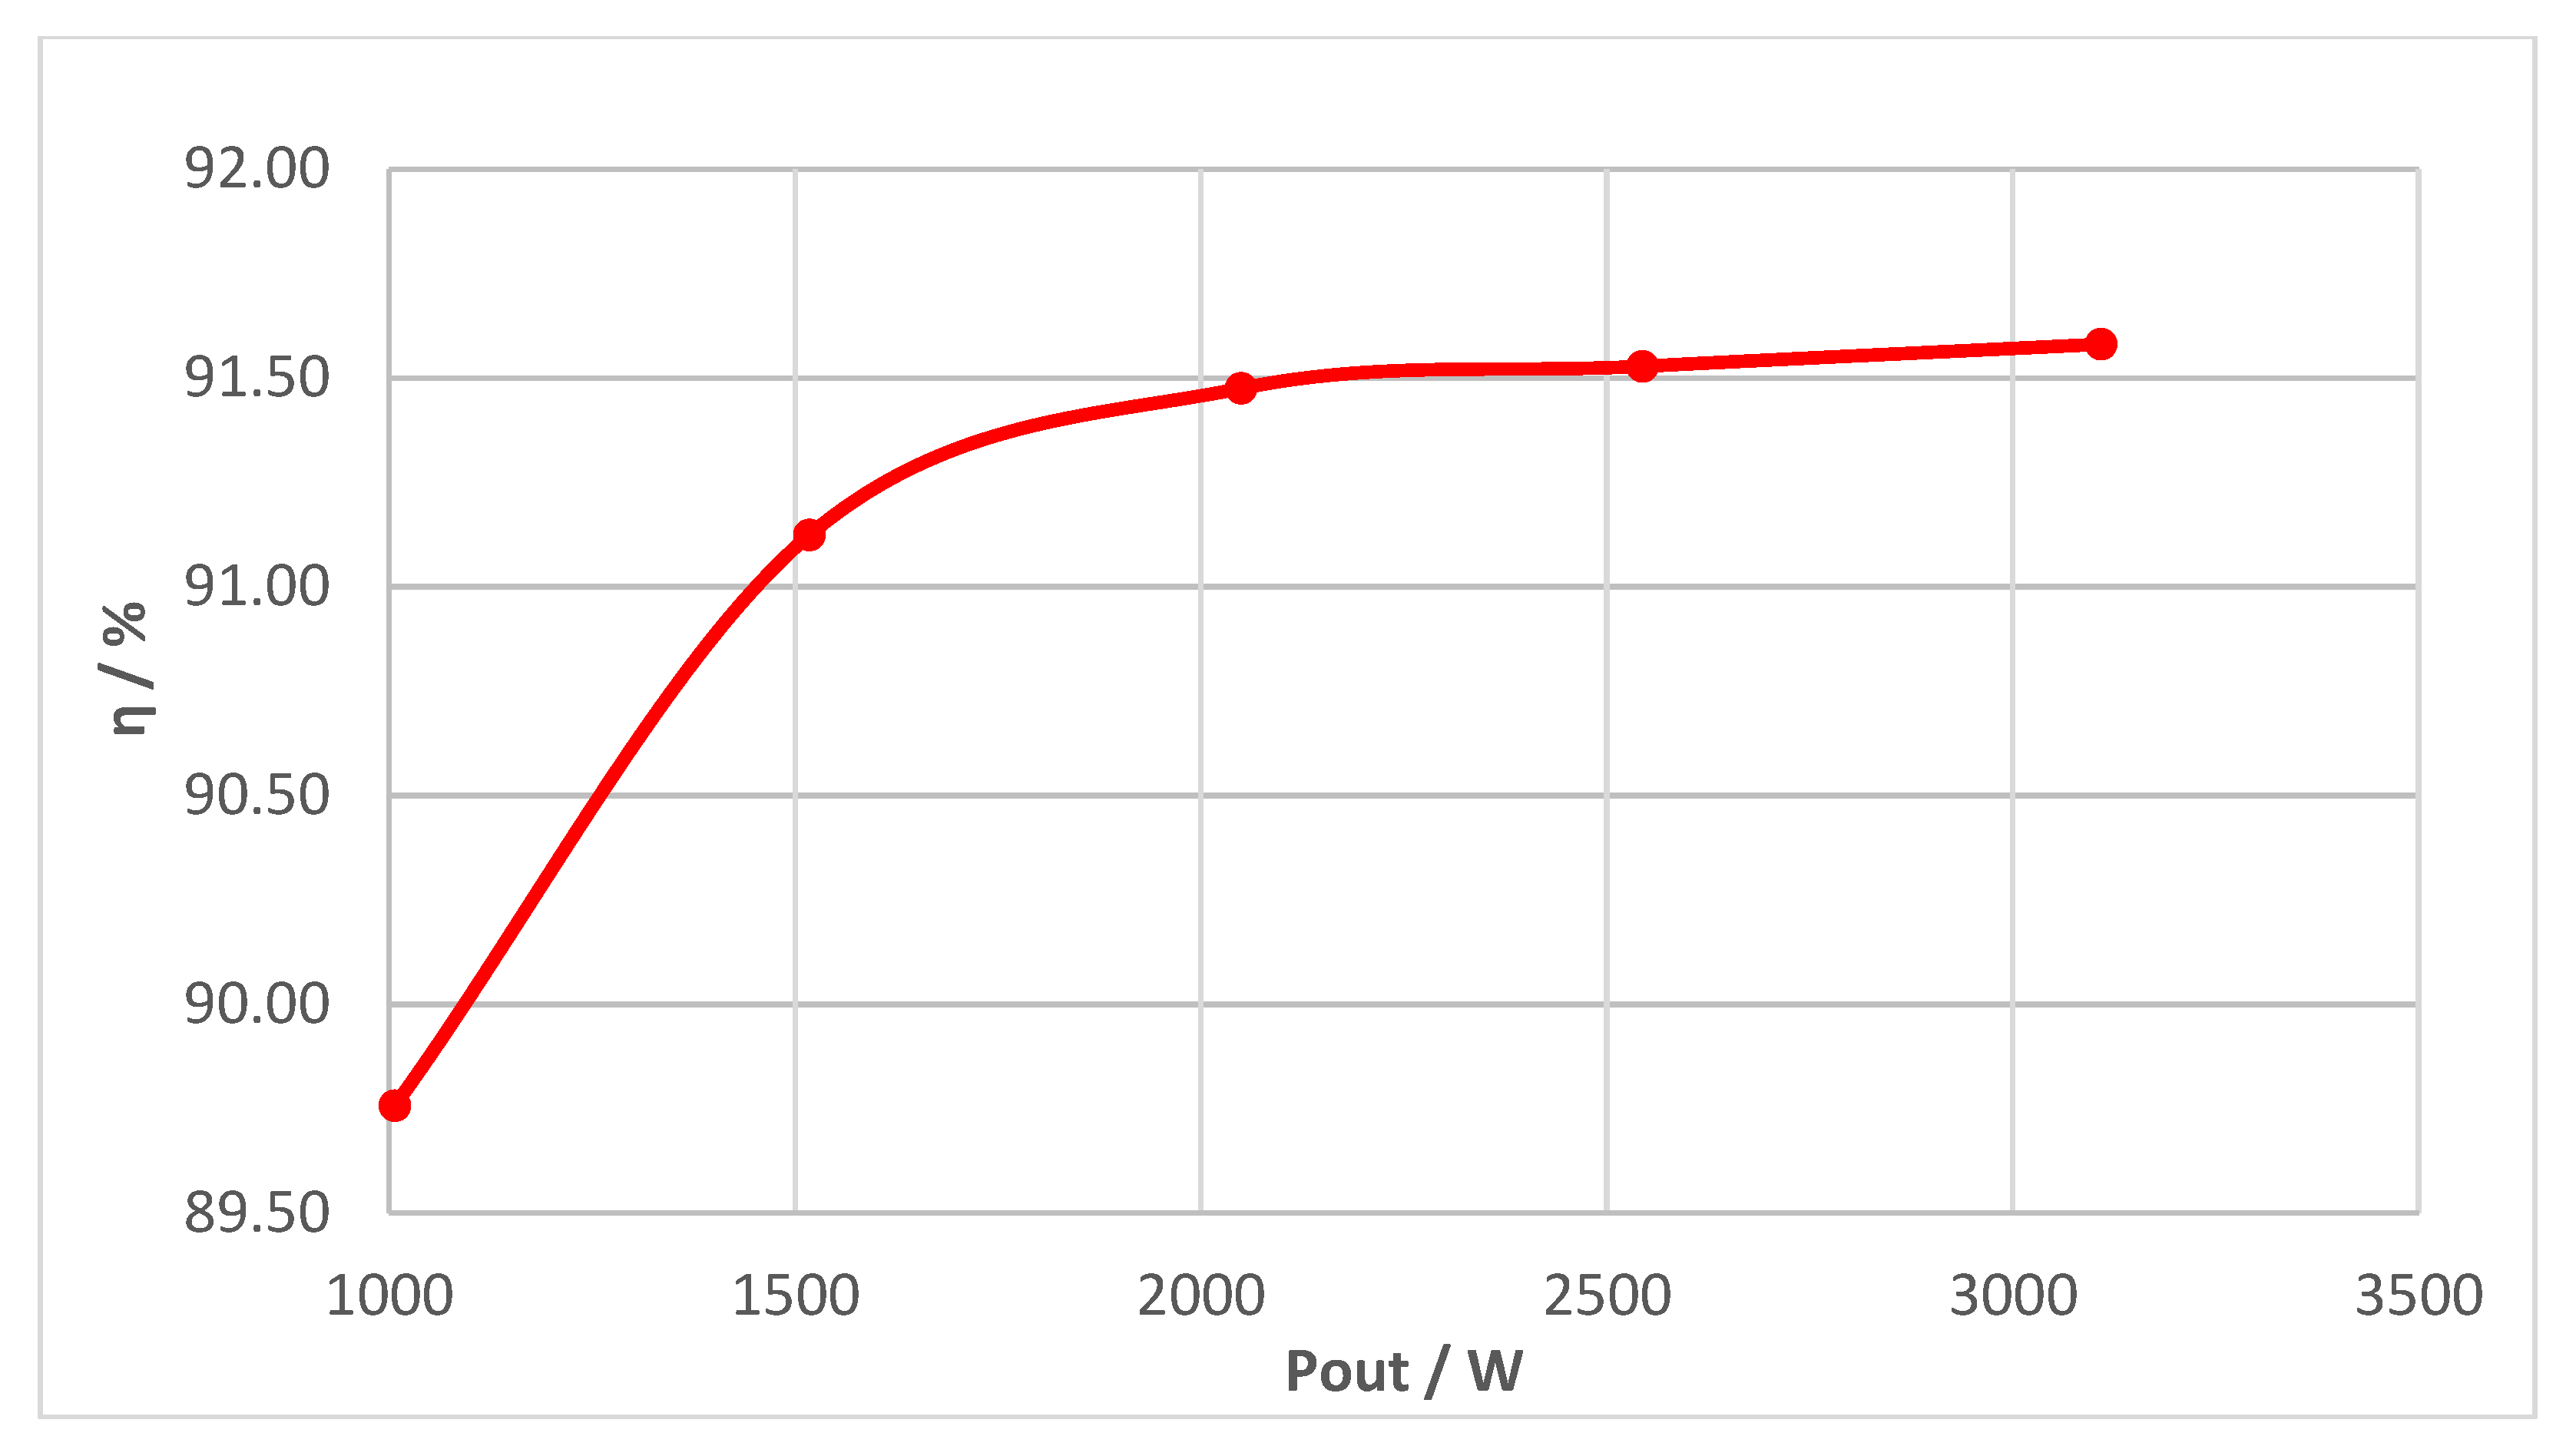
The AC input voltage, the current drawn from the grid, the DC load current, and the voltage of the experimental waveforms are provided in Figure 23. The input voltage and current were measured in connection with a single-phase passive rectifier. The WPT experimental efficiency results are shown in Figure 24. It shows the plotted efficiency map for the SiC MOSFETs switches. The efficiency η was calculated by measuring both DC input power (the input of the high frequency inverter) and DC output power (load power), as seen in Equation (28).
η = P out , DC P in , DC
From the results of Figure 24, it can be seen that the DC/DC efficiency for the lab WPT system was around 91.6% when the output DC power was 3.1 kW and the inverter was used as SiC MOSFETs.

7. Conclusions

In this paper, a design optimization approach was proposed for an SS WPT system. A WPT system with SS compensation topology was designed for 3.7 kW and 7.7 kW charging systems, both operating at 40 kHz and 85 kHz resonant frequency with optimized coil sizes and system efficiency. The primary and secondary coil parameters and dimensions were designed using coil optimization. In addition, the primary and secondary coils were designed to have the maximum coupling coefficient and efficiency. In this paper, control systems were developed and used to incorporate the grid-to-vehicle (G2V) operating modes by implementing unidirectional rectifiers/inverters and DC-DC converters. The simulation results and magnetic verification have shown that a WPT system could be efficiently used in light-duty EV applications. Furthermore, A 3.7 kW WPT system prototype was built and implemented in the lab to preliminarily validate the WPT design and performance.

Author Contributions

Y.Y. performed the modeling, design and the experiments and wrote the original draft and the final version of the paper. M.E.B., Y.L. and Y.B. contributed in the modeling and the review of the paper and editing the revision of paper, and M.E.B. contributed analyzing the simulation results. Y.L. contributed in reviewing and designing the magnetic coils parameters. Y.B. contributed in reviewing and designing the control system for WPT. J.V.M. contributed in analyzing the results and editing the paper. O.H. contributed in designing and control modeling of the WPT system, especially for the experiment in the lab, and he leads this research as a promoter and edits the manuscript.

Funding

This research was funded by Flanders Make and also the China Scholarship Council (CSC) for the support.

Acknowledgments

We acknowledge Flanders Make for the support to our research group. We also acknowledge the China Scholarship Council (CSC) for the support of a grant.

Conflicts of Interest

The authors declare no conflicts of interest.

References

  1. Hegazy, O.; Barrero, R.; Van Mierlo, J.; Lataire, P.; Omar, N.; Coosemans, T. An advanced power electronics interface for electric vehicles applications. IEEE Trans. Power Electron. 2013, 28, 5508–5521. [Google Scholar] [CrossRef]
  2. ACEA—European Automobile Manufacturers’ Association. ACEA Report. Available online: http://www.acea.be/publications (accessed on 12 June 2018).
  3. Miceli, R.; Viola, F. Designing a sustainable university recharge area for electric vehicles: Technical and economic analysis. Energies 2017, 10, 1604. [Google Scholar] [CrossRef]
  4. Brenna, M.; Dolara, A.; Foiadelli, F.; Leva, S.; Longo, M. Urban scale photovoltaic charging stations for electric vehicles. IEEE Trans. Sustain. Energy 2014, 5, 1234–1241. [Google Scholar] [CrossRef]
  5. Longo, M.; Zaninelli, D.; Viola, F.; Romano, P.; Miceli, R.; Caruso, M.; Pellitteri, F. Recharge stations: A review. In Proceedings of the 11th International Conference on Ecological Vehicles and Renewable Energies, EVER 2016, Monte Carlo, Monaco, 6–8 April 2016. [Google Scholar]
  6. Covic, G.A.; Boys, J.T. Inductive Power Transfer. Proc. IEEE 2013, 101, 1276–1289. [Google Scholar] [CrossRef]
  7. Covic, G.A.; Boys, J.T. Modern Trends in Inductive Power Transfer for Transportation Applications. IEEE J. Emerg. Sel. Top. Power Electron. 2013, 1, 28–41. [Google Scholar] [CrossRef]
  8. Kalwar, K.A.; Aamir, M.; Mekhilef, S. Inductively coupled power transfer (ICPT) for electric vehicle charging—A review. Renew. Sustain. Energy Rev. 2015, 47, 462–475. [Google Scholar] [CrossRef]
  9. Bosshard, R.; Kolar, J.W. Inductive Power Transfer for Electric Vehicle Charging: Technical challenges and tradeoffs. IEEE Power Electron. Mag. 2016, 3, 22–30. [Google Scholar] [CrossRef]
  10. Rogge, M.; Wollny, S.; Sauer, D. Fast Charging Battery Buses for the Electrification of Urban Public Transport—A Feasibility Study Focusing on Charging Infrastructure and Energy Storage Requirements. Energies 2015, 8, 4587–4606. [Google Scholar] [CrossRef] [Green Version]
  11. Andersson, M. Energy Storage Solutions for Electric Bus Fast Charging Stations. Master’s Thesis, Uppsala University, Uppsala, Sweden, 2017. [Google Scholar]
  12. Ning, P.; Miller, J.M.; Onar, O.C.; White, C.P. A Compact Wireless Charging System for ElectricVehicles. In Proceedings of the Energy Conversion Congress and Exposition (ECCE), Denver, CO, USA, 15–19 September 2013; IEEE: Piscataway, NJ, USA, 2013; pp. 3629–3634. [Google Scholar]
  13. Garcés Quílez, M.; Abdel-Monem, M.; El Baghdadi, M.; Yang, Y.; Van Mierlo, J.; Hegazy, O. Modelling, Analysis and Performance Evaluation of Power Conversion Unit in G2V/V2G Application—A Review. Energies 2018, 11, 1082. [Google Scholar] [CrossRef]
  14. Miller, J.M.; Jones, P.T.; Li, J.M.; Onar, O.C. ORNL experience and challenges facing dynamic wireless power charging of EV’s. IEEE Circuits Syst. Mag. 2015, 15, 40–53. [Google Scholar] [CrossRef]
  15. Li, S.; Liu, Z.; Zhao, H.; Zhu, L.; Shuai, C.; Chen, Z. Wireless Power Transfer by Electric Field Resonance and Its Application in Dynamic Charging. IEEE Trans. Ind. Electron. 2016, 63, 6602–6612. [Google Scholar] [CrossRef]
  16. Li, W.; Zhao, H.; Deng, J.; Li, S.; Mi, C.C. Comparison Study on SS and double-sided LCC compensation topologies for EV/PHEV Wireless Chargers. IEEE Trans. Veh. Technol. 2016, 65, 4429–4439. [Google Scholar] [CrossRef]
  17. Sohn, Y.H.; Choi, B.H.; Lee, E.S.; Lim, G.C.; Cho, G.H.; Rim, C.T. General Unified Analyses of Two-Capacitor Inductive Power Transfer Systems: Equivalence of Current-Source SS and SP Compensations. IEEE Trans. Power Electron. 2015, 30, 6030–6045. [Google Scholar] [CrossRef]
  18. Aditya, K.; Williamson, S.S. Comparative Study of Series-Series and Series-Parallel Compensation Topologies for Electric Vehicle Charging. In Proceedings of the 2014 IEEE 23rd International Symposium on Industrial Electronics (ISIE), Istanbul, Turkey, 1–4 June 2014; IEEE: Piscataway, NJ, USA, 2014; pp. 426–430. [Google Scholar]
  19. Zhang, W.; Wong, S.C.; Tse, C.K.; Chen, Q. Analysis and comparison of secondary series-and parallel-compensated inductive power transfer systems operating for optimal efficiency and load-independent voltage-transfer ratio. IEEE Trans. Power Electron. 2014, 29, 2979–2990. [Google Scholar] [CrossRef]
  20. Stielau, O.H.; Covic, G.A. Design of loosely coupled inductive power transfer systems. In Proceedings of the 2000 International Conference on Power System Technology, Perth, WA, Australia, 4–7 December 2000; IEEE: Piscataway, NJ, USA, 2000; pp. 85–90. [Google Scholar]
  21. Yuan, X.; Liao, Y. Compensation topology for flat spiral coil inductive power transfer systems. IET Power Electron. 2015, 8, 1893–1901. [Google Scholar] [CrossRef]
  22. Neath, M.J.; Swain, A.K.; Madawala, U.K.; Thrimawithana, D.J. An optimal PID controller for a bidirectional inductive power transfer system using multiobjective genetic algorithm. IEEE Trans. Power Electron. 2014, 29, 1523–1531. [Google Scholar] [CrossRef]
  23. Wu, H.H.; Covic, G.A.; Boys, J.T.; Robertson, D.J. A series-tuned inductive-power-transfer pickup with a controllable AC-voltage output. IEEE Trans. Power Electron. 2011, 26, 98–109. [Google Scholar] [CrossRef]
  24. Zhang, W.; Wong, S.C.; Tse, C.K.; Chen, Q. A study of sectional tracks in roadway inductive power transfer system. In Proceedings of the 2011 IEEE Energy Conversion Congress and Exposition, Phoenix, AZ, USA, 17–22 September 2011; IEEE: Piscataway, NJ, USA, 2011; pp. 822–826. [Google Scholar]
  25. Chopra, S. Contactless Power Transfer for Electric Vehicle Charging Application. Master’s Thesis, Delft University of Technology, Delft, The Netherlands, 2011. [Google Scholar]
  26. Prasanth, V. Wireless Power Transfer for E-Mobility. Master’s Thesis, Delft University of Technology, Delft, The Netherlands, 2012. [Google Scholar]
  27. Chen, L.; Liu, S.; Zhou, Y.C.; Cui, T.J. An optimizable circuit structure for high-efficiency wireless power transfer. IEEE Trans. Ind. Electron. 2013, 60, 339–349. [Google Scholar] [CrossRef]
  28. Villa, J.L.; Sallán, J.; Sanz Osorio, J.F.; Llombart, A. High-misalignment tolerant compensation topology for ICPT systems. IEEE Trans. Ind. Electron. 2012, 59, 945–951. [Google Scholar] [CrossRef]
  29. Bosshard, R.; Kolar, J.W. Fundamentals and Multi-Objective Design of Inductive Power Transfer Systems. In Proceedings of the 30th Applied Power Electronics Conference and Exposition (APEC 2015), Charlotte, NC, USA, 15–19 March 2015. [Google Scholar]
  30. Zheng, C.; Lai, J.S.; Chen, R.; Faraci, W.E.; Zahid, Z.U.; Gu, B.; Zhang, L.; Lisi, G.; Anderson, D. High Efficiency Contactless Power Transfer System for Electric Vehicle Battery Charging Application. IEEE J. Emerg. Sel. Top. Power Electron. 2014, 6777, 1–11. [Google Scholar] [CrossRef]
  31. Ruiz-Rodriguez, F.J.; Hernández, J.C.; Jurado, F. Voltage behaviour in radial distribution systems under the uncertainties of photovoltaic systems and electric vehicle charging loads. Int. Trans. Electr. Energy Syst. 2018, 28, 1–23. [Google Scholar] [CrossRef]
  32. Hernández, J.C.; Ruiz-Rodriguez, F.J.; Jurado, F. Modelling and assessment of the combined technical impact of electric vehicles and photovoltaic generation in radial distribution systems. Energy 2017, 141, 316–332. [Google Scholar] [CrossRef]
  33. Sanchez-Sutil, F.; Hernández, J.C.; Tobajas, C. Overview of electrical protection requirements for integration of a smart DC node with bidirectional electric vehicle charging stations into existing AC and DC railway grids. Electr. Power Syst. Res. 2015, 122, 104–118. [Google Scholar] [CrossRef]
  34. Hernandez, J.C.; Sutil, F.S.; Vidal, P.G. Protection of a multiterminal DC compact node feeding electric vehicles on electric railway systems, secondary distribution networks, and PV systems. Turkish J. Electr. Eng. Comput. Sci. 2016, 24, 3123–3143. [Google Scholar] [CrossRef]
  35. Li, S.; Mi, C. Wireless Power Transfer for Electric Vehicle Applications. IEEE J. Emerg. Sel. Top. Power Electron. 2015, 3, 4–17. [Google Scholar] [CrossRef]
  36. Steigerwald, R.L. Comparison of Half-Bridge Resonant Converter Topologies. IEEE Trans. Power Electron. 1988, 3, 174–182. [Google Scholar] [CrossRef]
  37. Sallan, J.; Villa, J.L.; Llombart, A.; Sanz, J.F. Optimal Design of ICPT Systems Applied to Electric Vehicle Battery Charge. IEEE Trans. Ind. Electron. 2009, 56, 2140–2149. [Google Scholar] [CrossRef]
  38. Aditya, K.; Williamson, S.S. Design considerations for loosely coupled inductive power transfer (IPT) system for electric vehicle battery charging—A comprehensive review. In Proceedings of the 2014 IEEE Transportation Electrification Conference and Expo (ITEC), Dearborn, MI, USA, 15–18 June 2014; IEEE: Piscataway, NJ, USA, 2014; pp. 1–6. [Google Scholar]
  39. Benomar, Y.; El Baghdadi, M.; Hegazy, O.; Yang, Y.; Messagie, M.; Mierlo, J. Van Design and modeling of V2G inductive charging system for light-duty Electric Vehicles. In Proceedings of the 2017 Twelfth International Conference on Ecological Vehicles and Renewable Energies (EVER), Monte Carlo, Monaco, 11–13 April 2017; IEEE: Piscataway, NJ, USA, 2017; pp. 1–7. [Google Scholar]
  40. El Baghdadi, M.; Benomar, Y.; Hegazy, O.; Yang, Y.; Van Mierlo, J. Design approach and interoperability analysis of wireless power transfer systems for vehicular applications. In Proceedings of the 2016 18th European Conference on Power Electronics and Applications (EPE’16 ECCE Europe), Karlsruhe, Germany, 5–9 September 2016; IEEE: Piscataway, NJ, USA, 2016; pp. 1–11. [Google Scholar]
  41. Yang, Y.; Benomar, Y.; El Baghdadi, M.; Hegazy, O.; Van Mierlo, J. Design, Modeling and Control of a Bidirectional Wireless Power Transfer for Light-Duty Vehicles: G2V and V2G Systems. In Proceedings of the 2017 19th European Conference on Power Electronics and Applications (EPE’17 ECCE Europe), Warsaw, Poland, 11–14 September 2017; IEEE: Piscataway, NJ, USA, 2017; pp. 1–12. [Google Scholar]
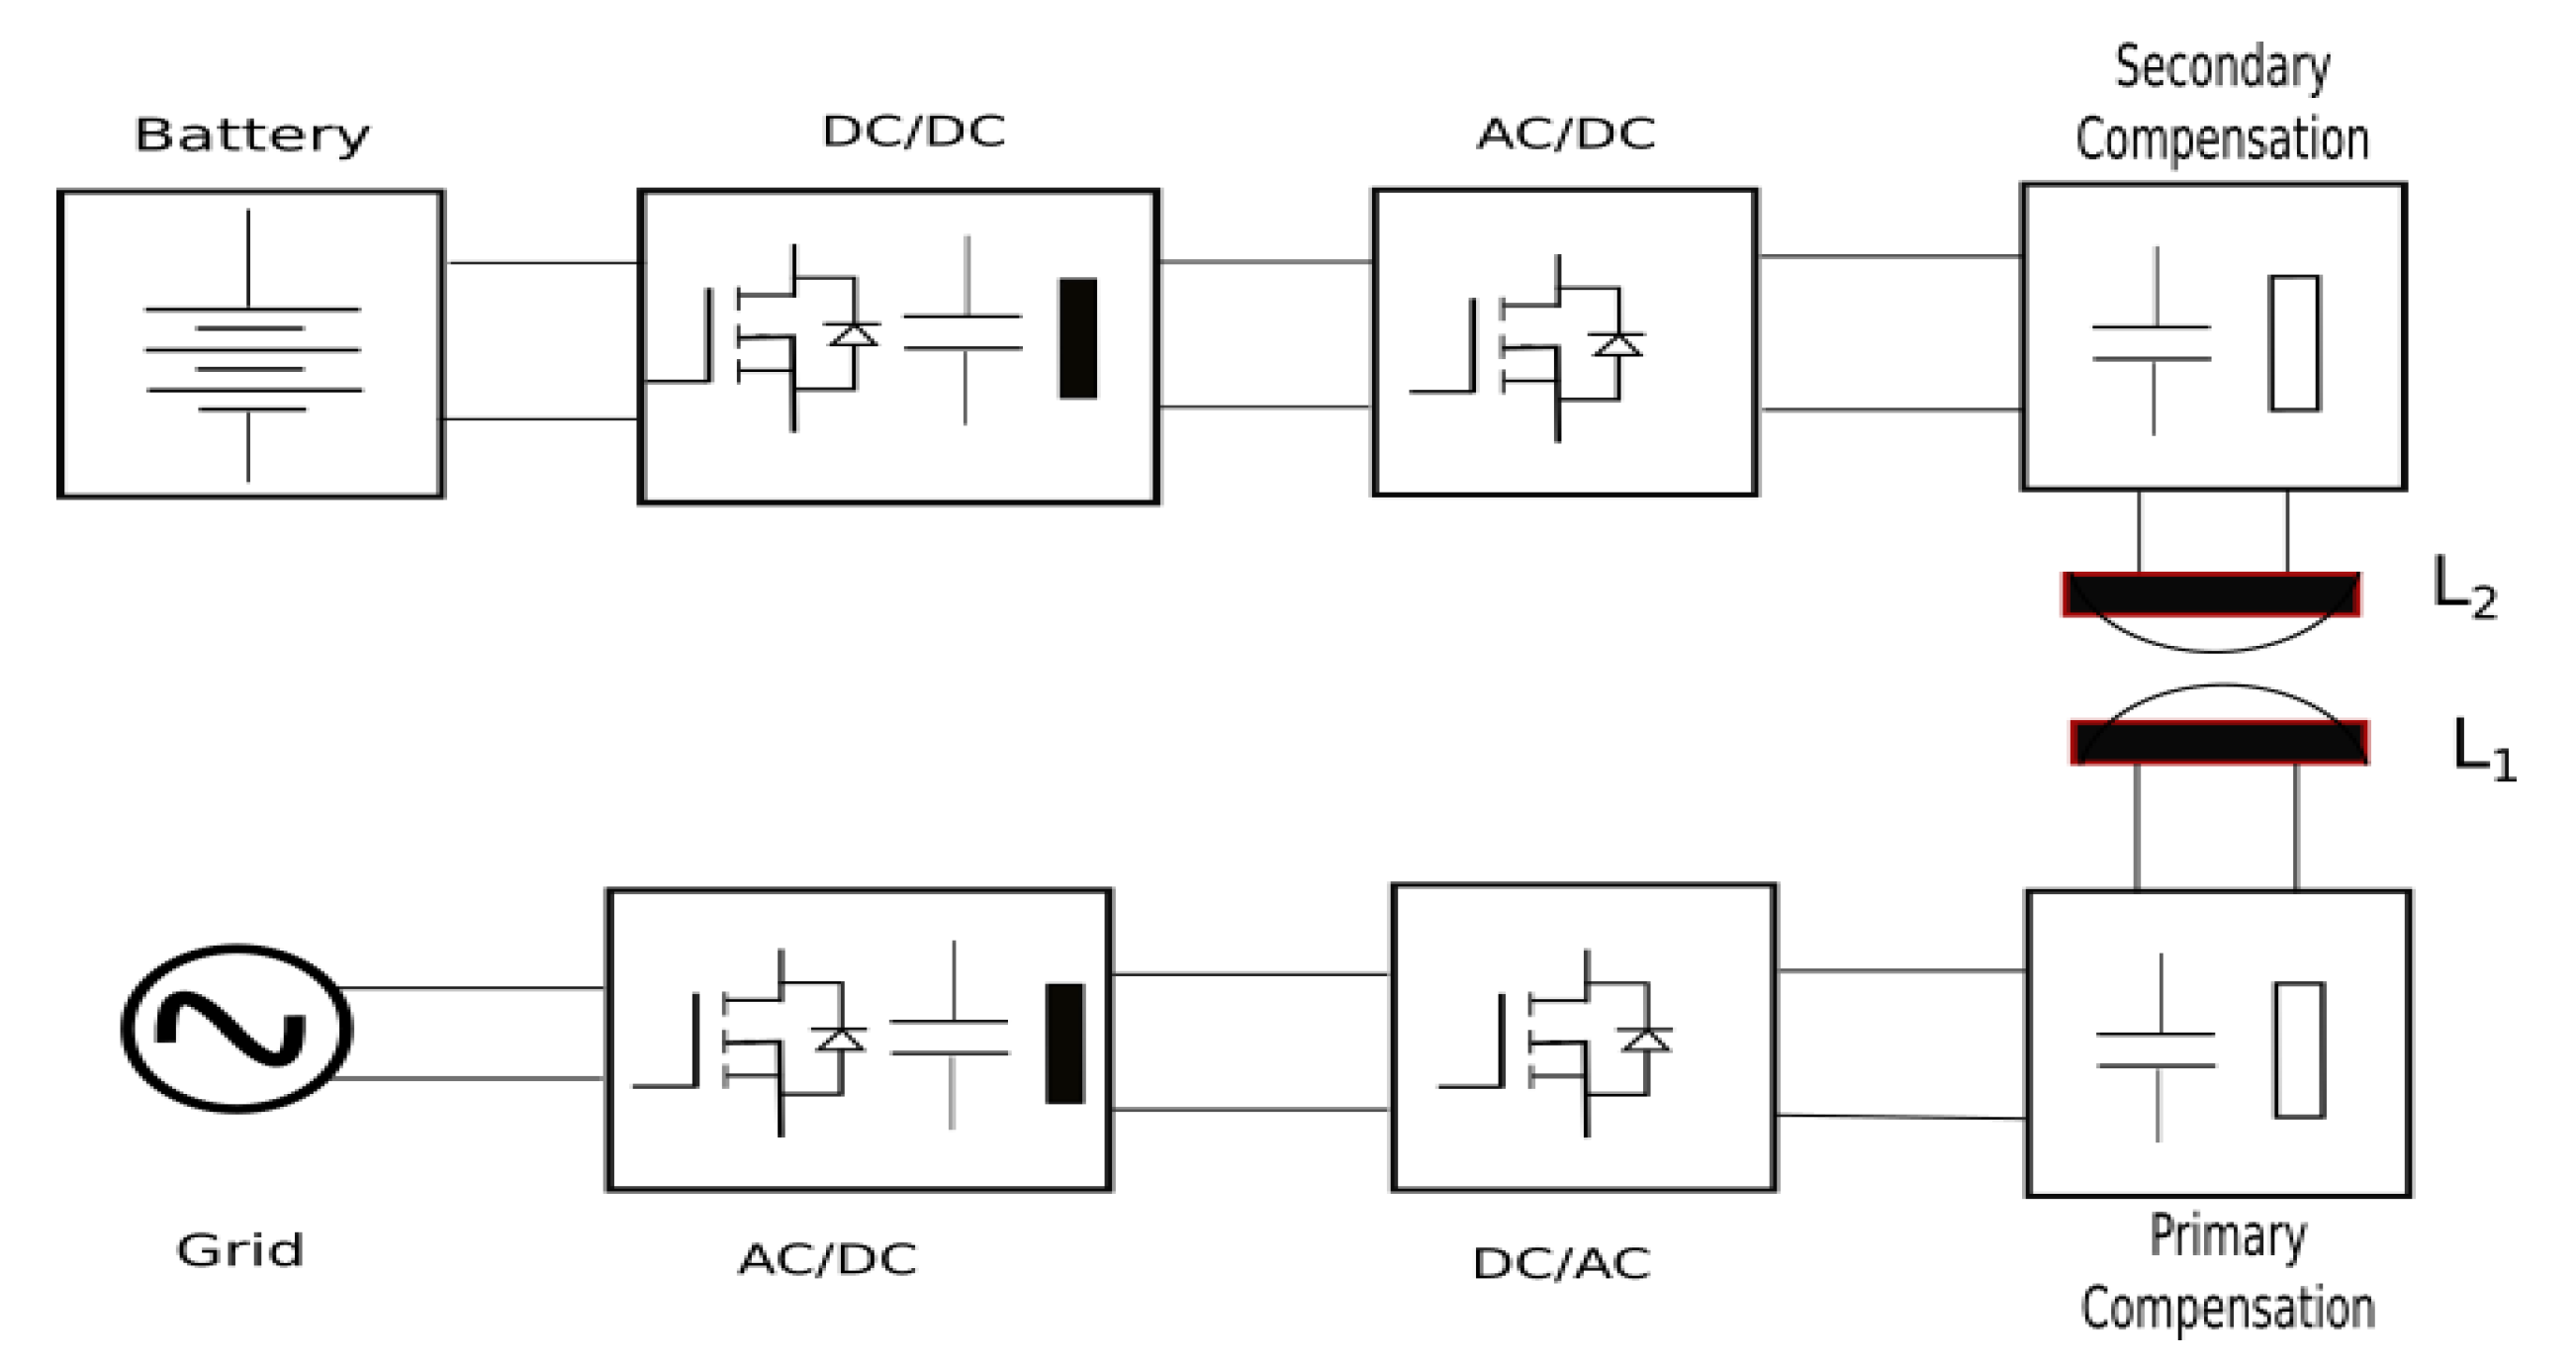
Figure 1. General wireless power transfer block diagram.
Energies 11 01716 g001
Figure 2. The bidirectional wireless system model for SS topology.
Energies 11 01716 g002
Figure 3. Equivalent circuit model for SS topology.
Energies 11 01716 g003
Figure 4. Diagram of the rectangular coils between primary and secondary windings of the WPT system.
Energies 11 01716 g004
Figure 5. Flowchart of coil size optimization.
Energies 11 01716 g005
Figure 6. CAD model of the WPT system.
Energies 11 01716 g006
Figure 7. Current and magnetic flux density distribution in 3D.
Energies 11 01716 g007
Figure 8. Magnetic flux line and distribution in 2D cross-section.
Energies 11 01716 g008
Figure 9. Impact of air-gap on the 3.7 kW system.
Energies 11 01716 g009
Figure 10. Impact of air-gap on the 7.7 kW system.
Energies 11 01716 g010
Figure 11. Control method diagram for the WPT system: (a) Control strategy for a bidirectional WPT charging system; (b) Voltage oriented grid current control; (c) Battery current control.
Energies 11 01716 g011
Figure 12. Grid-to-vehicle (G2V): (a) Battery charging current; (b) Battery voltage.
Energies 11 01716 g012
Figure 13. G2V: (a) Grid voltage and current; (b) Primary resonant voltage and current; (c) Secondary resonant voltage and current.
Energies 11 01716 g013
Figure 14. G2V: (a) Battery charging current; (b) Battery voltage.
Energies 11 01716 g014
Figure 15. G2V: (a) Grid voltage and current; (b) Primary resonant voltage and current; (c) Secondary resonant voltage and current.
Energies 11 01716 g015
Figure 16. G2V: (a) Battery charging current; (b) Battery voltage.
Energies 11 01716 g016
Figure 17. G2V: (a) Grid voltage and current; (b) Primary resonant voltage and current; (c) Secondary resonant voltage and current.
Energies 11 01716 g017
Figure 18. G2V: (a) Battery charging current; (b) Battery voltage.
Energies 11 01716 g018
Figure 19. G2V: (a) Grid voltage and current; (b) Primary resonant voltage and current; (c) Secondary resonant voltage and current.
Energies 11 01716 g019
Figure 20. Experimental topology in the lab.
Energies 11 01716 g020
Figure 21. Laboratory setup of a 3.7 kW WPT system.
Energies 11 01716 g021
Figure 22. Oscilloscope screenshot for waveforms of the primary resonant voltage (A, magenta, 100 V/div), current (B, blue, 10 mV/A), secondary resonant voltage (C, black, 100 V/div), and current (D, green, 10mV/A) measurements for 1 kW output power and 150 V DC input.
Energies 11 01716 g022
Figure 23. Oscilloscope screenshot for waveforms of the AC input voltage (A, magenta, 200 V/div), current (B, blue, 10 mV/A), DC load voltage (C, black, 100 V/div), and load current (D, green, 10mV/A) measurements for 1 kW load power.
Energies 11 01716 g023
Figure 24. Efficiency as a function of output power for SiC MOSFETs.
Energies 11 01716 g024
Table 1. The optimal parameters of coil dimensions for 3.7 kW and 7.7 kW WPT systems.
Frequency (kHz)Power Level (kW)Number of TurnsWinding Cross-Sectional Area (mm2)Primary Coil Outer Size (mm)Secondary Coil Outer Size (mm)
N1N2S1S2 d x 1 o × d y 1 o d x 2 o × d y 2 o
40/853.723222.62.6334 × 334330 × 330
7.716155.45.4364 × 364329 × 329
Table 2. Parameters of SS compensation topology for the 3.7 kW and 7.7 kW WPT systems.
Frequency (kHz)Power Level (kW)L1 (μH)L2 (μH)C1 (nF)C2 (nF)R1 (mΩ)R2 (mΩ)Lg (mm)M (μH)k
403.7332.41302.2447.6352.3720319210068.450.22
7.7160.80140.0698.45113.03686310033.050.22
853.7332.41302.2410.6911.7620319210068.450.22
7.7160.80140.0622.1725.45686310033.050.22
Table 3. Verification parameter of the 3.7 kW and 7.7 kW WPT systems.
3.7 kW7.7 kW
Analytical ModelFEMError (%)Analytical ModelFEMError (%)
L1 (μH)332.41323.653160.80159.621
L2 (μH)302.24298.381140.06138.981
M (μH)68.4572.99733.0534.514
k0.220.23-0.220.23-
Table 4. Parameters of the laboratory testing.
ParameterL1 (μH)L2 (μH)C1 (nF)C2 (nF)Cs1 (uF)Cs2 (uF)Cdc3 (uF)RL (Ω)fsw (kHz)
Simulation332.41302.2447.6352.371.51.547008.340
Lab Measurement336.91299.2847501.51.547008.337
Table 5. Components used in the prototype.
ComponentsManufacturerPart Number
Primary SiC MOSFETROHMSCT3030KL
Diode RectifiesIXYSDSEP2x31-06A
Snubber Film CapacitorsKEMETC4BSPBX4150ZBLJ