Article

Parameter Matching and Instantaneous Power Allocation for the Hybrid Energy Storage System of Pure Electric Vehicles

1
State Key Laboratory of Mechanical Transmission, Chongqing University, Chongqing 400044, China
2
College of Automotive Engineering, Chongqing University, Chongqing 400044, China
*
Author to whom correspondence should be addressed.
Energies 2018, 11(8), 1933; https://doi.org/10.3390/en11081933
Submission received: 26 June 2018 / Revised: 13 July 2018 / Accepted: 19 July 2018 / Published: 24 July 2018

Abstract

:
In order to complete the reasonable parameter matching of the pure electric vehicle (PEV) with a hybrid energy storage system (HESS) consisting of a battery pack and an ultra-capacitor pack, the impact of the selection of the economic index and the control strategy on the parameters matching cannot be ignored. This paper applies a more comprehensive total cost of ownership (TCO) of HESS as the optimal target and proposes an optimal methodology integrating parameters and control strategy for the PEV with HESS. Through the integrated optimal methodology, the application value of HESS is analyzed under various types of driving cycles and the results indicate that the HESS can significantly improve the economic performance of PEVs under both urban and suburban driving cycles. Due to the poor adaptability of traditional control strategies to different driving cycles, a novel extreme learning machine (ELM) based controller is established. Firstly, a dynamic programming (DP) based controller is applied for the offline optimization of the HESS power allocation under several typical driving cycles. Then, an analytical method combining correlation analysis and mean impact value (MIV) is employed to deal with offline sample data from DP and obtain the characteristic variables of the ELM model. Ultimately, the instantaneous power allocation strategy of HESS is acquired by utilizing ELM to learn offline data of HESS. Comparative simulations between the ELM-based controller and the rule-based controller are conducted, and the simulation results show that compared to the rule-based controller (RBC), the ELM-based controller reduces the electricity consumption by 3.78% and battery life loss by 6.51%.

1. Introduction

1.1. Motivation

Pure electric vehicles (PEVs) have broad development prospects due to their zero emission and pollution property [1]. But some problems such as high battery costs, short lifespan, low energy density, and power density limit the further progress of PEVs. The hybrid energy store system (HESS) consisting of a battery pack and an ultra-capacitor pack can almost solve the problems above by combining the advantage of the battery and ultra-capacitor [2], which has caused the HESS to become a hot issue in the research and application area of PEVs. However, the two energy sources of HESS contribute to the great flexibility of the parameter matching and control strategy. In order to enhance the performance of HESS, it is essential to implement the reasonable selection of parameters and the power allocation of HESS. In the following, research related to the parameter matching and control strategy is reviewed.

1.2. Literature Review

In the aspect of parameter matching, the optimal target has a crucial influence on the selection of parameters. In order to minimize the operating cost of the HESS, the Pontryagin’s minimum principle (PMP) was employed to implement the parameter optimization [3]. Additionally, the literature [4] obtained the optimal number of ultra-capacitor cells by utilizing the genetic algorithm (GA) to reduce the manufacturing cost of the battery. Similarly, the Dijkstra algorithm has been applied to minimize the total cost of an electric vehicle under travel [5]. In addition, the total cost of ownership (TCO) and lifespan are of equal importance. It can be observed in the literature [6,7] that the TCO was considered and the battery size was optimized. Multi-objective optimization of lifespan, cost, and size was carried out [8,9,10]. Rather than ignoring the interaction between the parameter and the control strategy as in the above literature, literature [11] put forward a collaboration optimization method to make the HESS operate better. In the existing research of parameter matching, the optimal targets mainly focus on the operating or manufacturing cost of HESS. However, the TCO of HESS is the crucial economic index for HESS, and in the present research on TCO, the replacement cost of the battery, the electricity fee, and the DC/DC converter cost are not included at the same time, which are important indexes of HESS cost. Also, the impact of control strategy on parameters should be considered [11].
As for the control strategy, various control strategies for HESS are illustrated in the research of HESS. The rule-based controller (RBC) [12,13,14] and fuzzy logic controller (FLC) [15,16] are the most common control strategies. The thresholds in RBS and the fuzzy logic rules are predefined without any prior knowledge, but greatly rely on expert experiences. Besides, the filtration principle is also applied to the control strategy of HESS. Filtration-based controllers (FBCs) were put forward in [17,18], respectively, where the ultra-capacitor undertook the high frequency of the output power and the battery bore the low frequency. A comparative work about the three kinds of controller was carried out by [19] and the results showed that the rule-based controller and fuzzy logic controller could achieve similar economic enhancement of HESS with the global optimal control strategy under certain driving cycles. To further enhance the economic performance of HESS, various optimal algorithms were applied to HESS, such as particle swarm optimization (PSO) [20,21], convex programming (CP) [22], and dynamic programming [23,24]. Nevertheless, these optimal algorithms-based controllers (OABCs) possess a strong dependence on driving cycles, which are received in advance. Thus, considering the real-time performance of the control strategy, the model predictive controller (MPC) was put forward to predict the future condition of vehicles [25,26]. In addition, some scholars introduced driving cycle recognition to enhance the adaptability of controllers to driving cycles [27,28]. The data of driving cycles are analyzed and some representative variables of driving cycles are obtained in these studies. From all the research above, it is not hard to discover that the current research about the control strategy of HESS mostly focuses on RBC, FLC, FBC, and OABC. However, these controllers possess poor adaptability to driving cycles. Furthermore, the MPCs can hardly get rid of the inaccurate prediction of vehicle condition and most of them still employ traditional control methods to deal with the information of driving cycles. As for the driving cycle recognition, there are too many representative variables in the recognition model, which leads to a high computational load. For instance, the representative variables in [27,28] are 40 and 10, respectively.

1.3. Original Contributions of This Paper

Therefore, in order to better evaluate the economic performance of HESS, this paper establishes a complete TCO of HESS and proposes an optimal methodology integrating parameters and control strategy for HESS. Then, to improve the adaptability of the control strategy to driving cycles, the DP-based strategy is applied to several typical driving cycles and the offline data of optimal instantaneous power allocation for HESS is obtained, and then the characteristic variables of the extreme learning machine (ELM) model are acquired through the method combining the correlation analysis and the mean impact value (MIV). Finally, by employing the ELM to learn the law between the characteristic variables and the instantaneous power allocation, the online ELM-based controller is received.

1.4. Organization of This Paper

The remainder of this paper is organized as follows. In Section 2, the integrated optimal methodology is proposed. The novel ELM-based controller is discussed in Section 3. Then, Section 4 lists the comparative simulations. Finally, the conclusions are given in Section 5.

2. Optimization Integrating Parameters and Control Strategy

Through comprehensively considering the control difficulty, cost, and efficiency of each structural scheme of HESS, this paper selects a semi-active HESS with DC/DC and ultra-capacitor connection [29], as depicted in Figure 1. The basic parameters of the vehicle are listed in Table 1.

2.1. Capacity Loss Model of Battery

Prolonging battery life is one of the purposes of parameter matching and controlling HESS. To estimate the life of the battery, an accurate capacity loss model of the battery should be established. In this paper, a lithium iron phosphate battery is selected and its basic parameters are illustrated in Table 2.
According to the semi empirical model of capacity loss for the lithium iron phosphate battery in [30] and the improved semi empirical model in literature [31,32], the capacity loss model of the lithium iron phosphate battery is set up, as indicated in Equation (1), and in this model, the influences of the battery discharge depth, operating temperature, battery discharge rate, and discharge time on capacity loss of battery are considered.
Q l o s s = B 1 e 31329.7 R T × ( ( 1.169 e 0.3375 n + 0.146 e 0.1271 n ) × e ( 0.1494 + 0.1494 n ) 0.55 × A h n ) 0.55
where Q l o s s denotes the capacity loss of battery. R is the ideal gas constant and T presents the Kelvin temperature of the battery operating, K. A h n is the Ah-throughput, Ah. n represents the charge rate and B 1 is the pre-exponential factor.
Generally, when the battery capacity reaches 20% of its initial capacity, it can be considered that the life of the battery is terminated. The life loss of the battery L l o s s is defined as the Equation (2).
L l o s s = A h n A h n ( 20 % )
where A h n ( 20 % ) is the Ah-throughput when the battery capacity arrives at 20%.

2.2. Optimal Parameter Matching

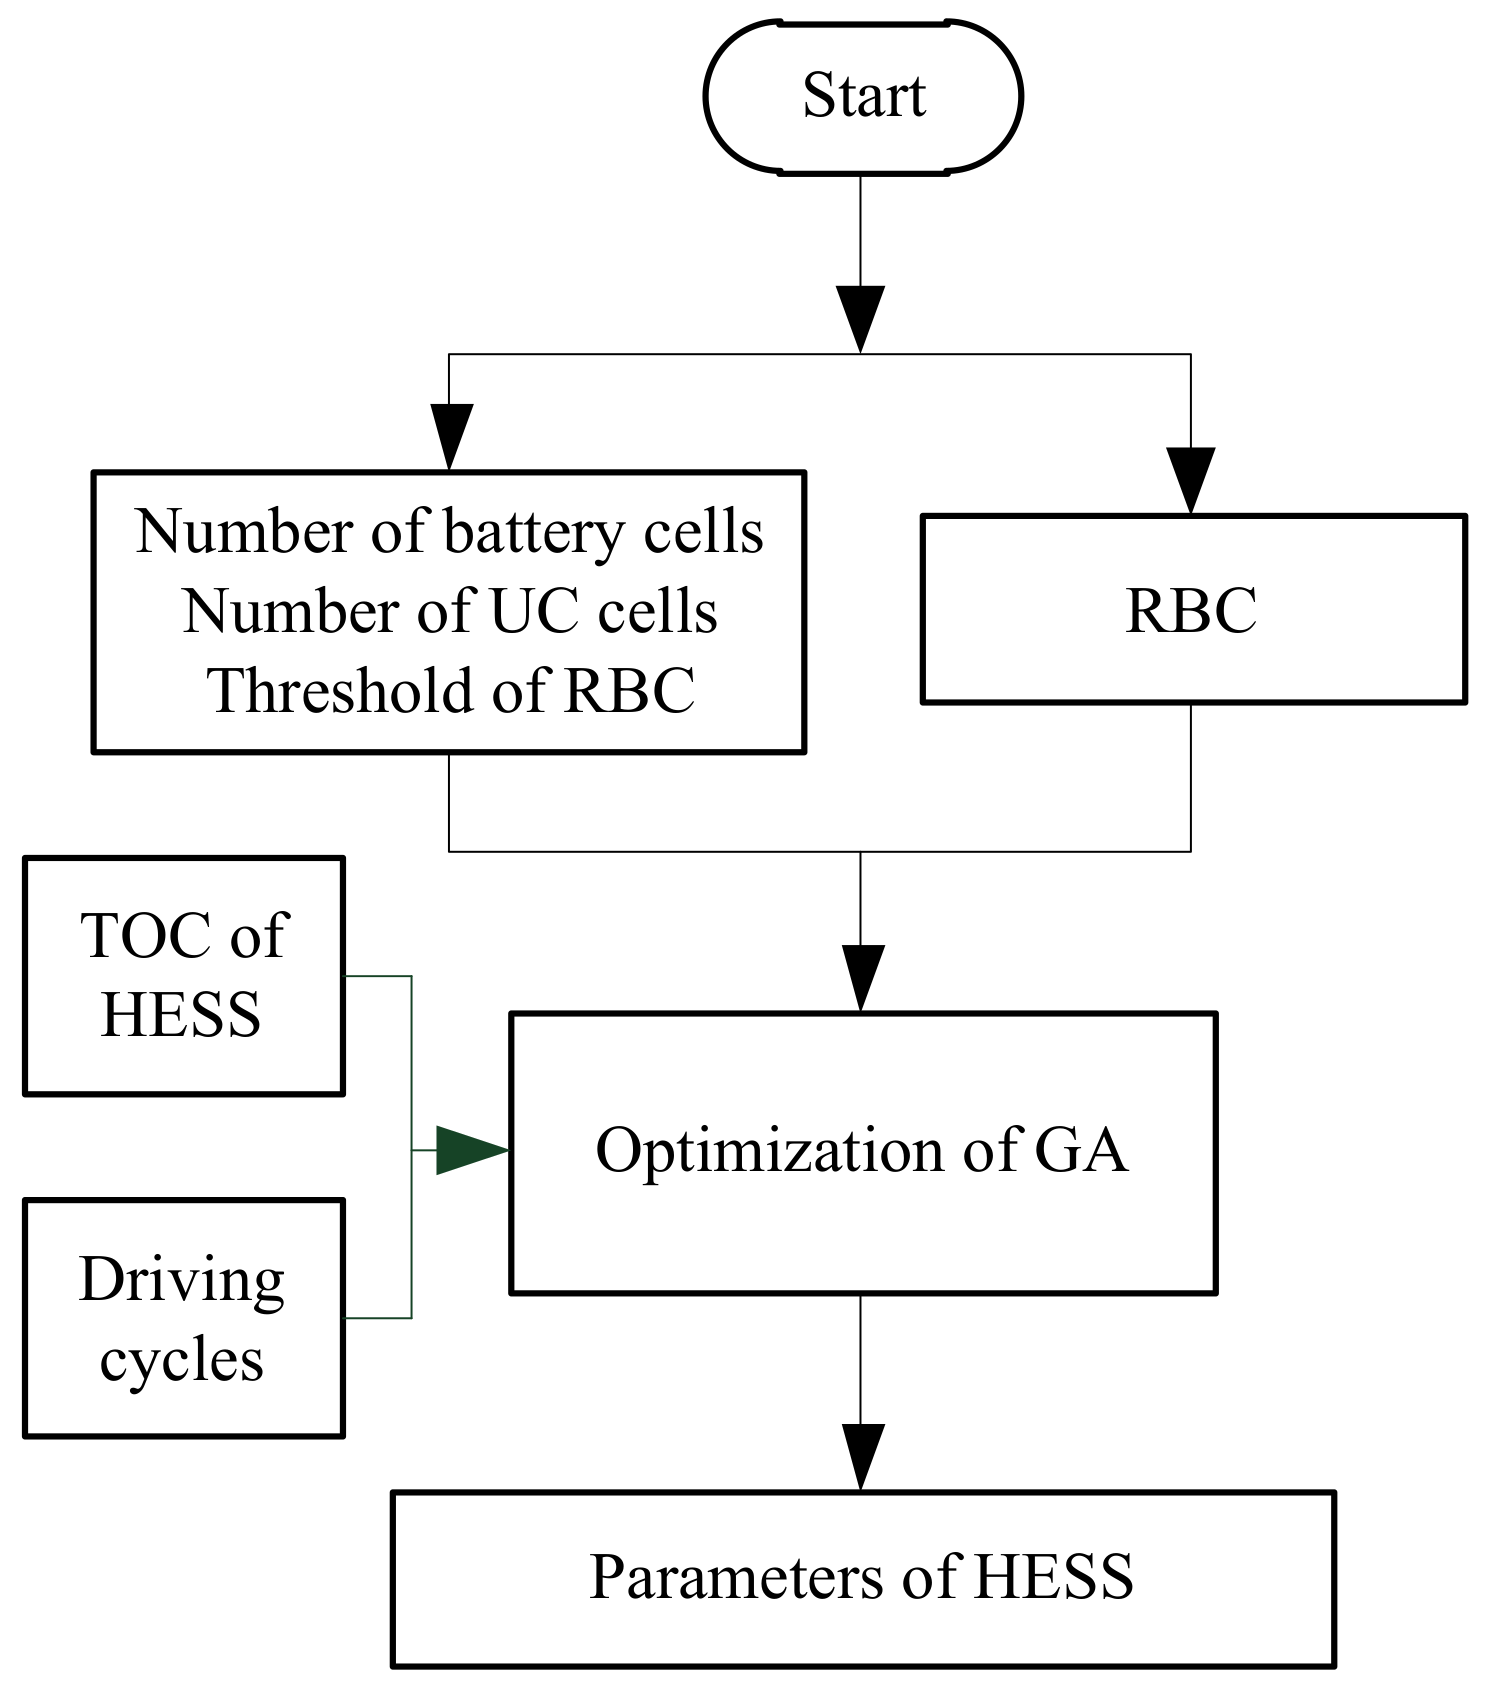
In order to minimize the TCO of HESS and consider the impact of the control strategy on parameter matching, an optimal methodology integrating parameters and control strategy is designed. In this method, the number of the battery cells, the number of ultra-capacitor cells, and the threshold of the rule-based strategy are selected as the optimal variables, and the optimal target is the life cycle cost of HESS.

2.2.1. Restrictions of Optimal Variables and Target

Minimum number of battery cells

The driving mileage of PEV determines the minimum battery capacity. A PEV should possess more than a 200 km driving mileage when the vehicle runs at a constant speed of 60 km/h [33]. It should be noted that the discharge depth of a battery needs to be at near 80%. Thus, the minimum number of battery cells can be computed by:
N b a t 1000 S P r e q v C b a t . s i g U b a t . s i g η d o d
in which N b a t illustrates the number of battery cells. S is the driving mileage, km. P r e q presents the power requirement of running at 60 km/h, kW. v represents the driving speed, km/h. C b a t . s i g and U b a t . s i g denote the capacity (Ah) and nominal voltage (V) of a single battery cell and the nominal voltage, respectively. η d o d is the depth of discharge, whose value is 80%.

Maximum number of battery cells

In this paper, the battery cells undertake the power requirement of an average motor. While the discharge termination voltage of the battery cells is 2 V and the discharge rate is 1 C, the safety of the short-term peak discharge of the battery cells is guaranteed [34]. Thus, the maximum number of battery cells can be obtained by Equation (4). To take into account the economic impact of the battery mass, the mass of 425 battery cells is regarded as the basic battery mass and 0.514 kg is added to the basic battery mass when a single battery cell is incremented.
N b a t 1000 P m a x V b a t . s i g A b a t . s i g
where P m a x is the maximum power of load; and V b a t . s i g and A b a t . s i g display the voltage and the current of the battery cells, respectively.

Minimum number of ultra-capacitor cells

As the non-essential energy sources in PEV, the minimum number of ultra-capacitor cells can be 0.

Maximum number of ultra-capacitor cells

The ultra-capacitor cells should be able to absorb the maximum continuous regenerative braking energy and provide the maximum continuous positive power requirement.
N u c 1 = E b r a E u c . s i g
N u c 2 = E d r i E u c . s i g
N u c _ m a x = max ( N u c 1 , N u c 2 )
In Equations (5)–(7), N u c i is the number of the ultra-capacitor. E b r a and E d r i are the maximum continuous regenerative braking energy and the maximum continuous driving energy, respectively. E u c . s i g denotes the energy of a single ultra-capacitor cell. N u c _ m a x represents the maximum number of ultra-capacitor cells. The selection of the ultra-capacitor is the 3 V, 3000 F model from the Maxwell company (San Diego, CA, USA).
1.
Optimal target
The TCO of HESS C H E S S is chosen as the optimal target, which consists of the initial cost of battery packs C b a t . i n i t , ultra-capacitor packs C u c , and the DC/DC converter C D C / D C ; the replacement cost of battery packs C b a t . r e p ; and the total electricity fee C e l e c . These costs can be described by Equations (8)–(13). The Urban Dynamometer Driving Schedule (UDDS), adopted by US Environmental Protection Agency (EPA), is chosen as the testing driving cycle [35]. Owing to the fact that the total mileage of a vehicle during a life cycle is generally 150,000 to 300,000 km according to some automotive manufacturers and relevant research institutions [36], the PEV in this paper runs five UDDS driving cycles each day, and the vehicle operates 300 days per year for a total of 10 years.
C b a t . i n i t = N b a t E b a t . s i g p r i c e b a t
C b a t . i n i t = { 0 N b a t E b a t . s i g p r i c e b a t L l o s s < 1 L l o s s 1
C u c = N u c E u c . s i g p r i c e u c
C D C / D C = ( P u c . m a x × 110 % ) p r i c e D C / D C
C e l e = ( P b a t d t + P u c d t ) η e l e c p r i c e e l e c 3600
C H E S S = C b a t . i n i t + C b a t . r e p + C u c + C D C / D C + C e l e c
In Equations (8)–(13), P u c . m a x presents the maximum output power of ultra-capacitor packs. P b a t denotes the battery power. P u c is the instantaneous power of the ultra-capacitor. η e l e c is the charge efficiency from the grid and its value is 98%. E b a t . s i g and E u c . s i g are the energy of a single battery cell and single ultra-capacitor cell, respectively. p r i c e b a t , p r i c e u c , p r i c e D C / D C , and p r i c e e l e c are the price of the battery, ultra-capacitor, DC/DC converter, and electricity, respectively, and the values of these prices are 2.5 yuan/Wh, 78 yuan/Wh, 370 yuan/kW, and 0.68 yuan/kWh, respectively.

2.2.2. Rule-Based Controller

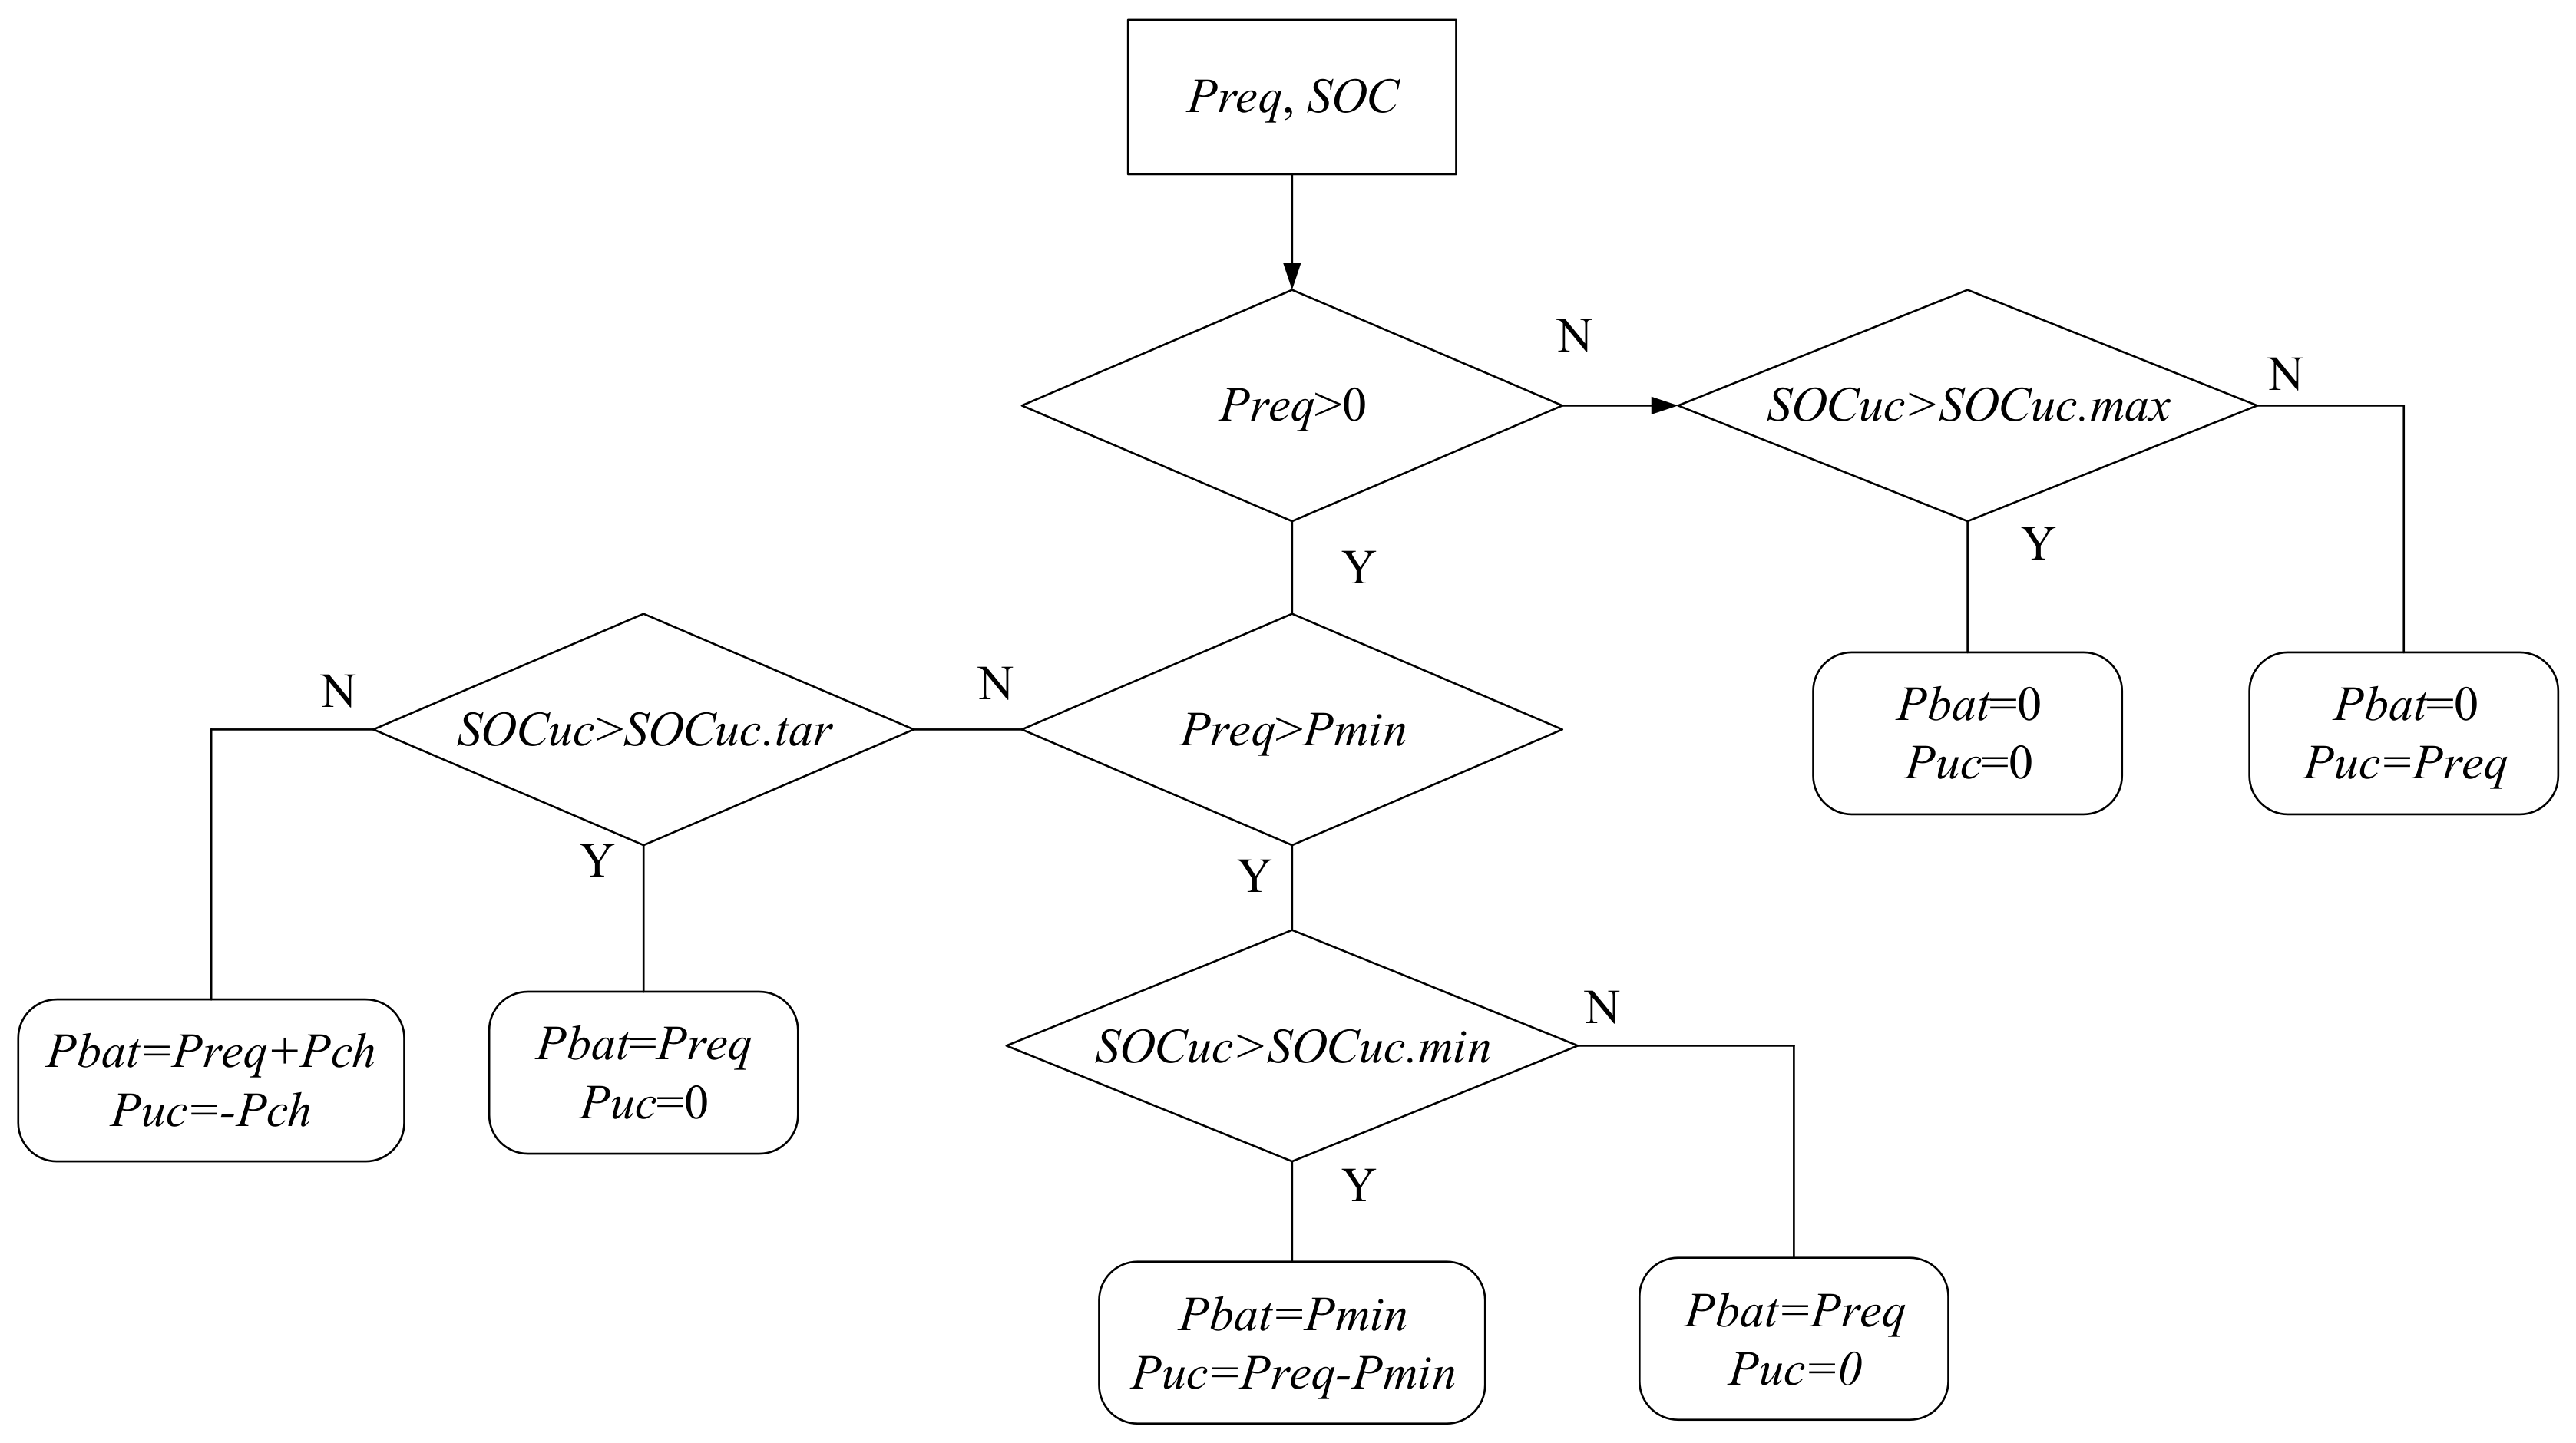
The RBC is simple and convenient, and possesses an excellent performance when compared with the FLC, FBC, and MPC [19]. Thus, this paper chooses the RBC as the control strategy and the rule-based controller is formulated in Figure 2. The rule-based controller determines the output power of battery P b a t and ultra-capacitor P u c referring to the power requirement of motor P r e q and the threshold of battery output power P m i n . The state of charge (SOC) of the ultra-capacitor S O C u c should remain between the maximum limit S O C u c . m a x and the minimum limit S O C u c . m i n , and tries to follow the target value S O C u c . t a g .
The target value of the ultra-capacitor S O C u c . t a g needs to satisfy Equation (14) and the charge power of the ultra-capacitor P c h should meet Equation (15), which are according to the principle of the maximum recovery of braking energy.
S O C u c . t a g = S O C u c . m a x v c 2 v m a x 2 ( S O C u c . m a x S O C u c . m i n )
P c h = P b a t . m a x × S O C u c . t a g S O C u c ( S O C u c . m a x S O C u c . m i n ) / 2
where v c is the current speed of the vehicle and v m a x is the maximum speed of the vehicle. P b a t . m a x depicts the maximum output power of the battery.

2.2.3. Optimization Results

After defining the optimal variables, target, and control strategy, the genetic algorithm (GA) is selected to conduct the optimization integrating parameters and control strategy. The details of the parameters optimization are shown in Figure 3.
The results of parameter matching are as follows: the number of battery cells and ultra-capacitor cells is 594 and 67, respectively; the threshold of battery output power is 13.34 kW; and the TCO of HESS is 147.1 thousand yuan. The series and parallel number of battery cells can be 99 and 6, respectively. Furthermore, the series and parallel number of the ultra-capacitor can be 67 and 1, respectively. To verify the effectiveness of the proposed method in this paper, a comparison between three methods is conducted in Table 3. Method I denotes the method put forward in this paper. In method II, a PEV with a battery energy store system (BESS) possessing the same driving mileage as the PEV with HESS is selected as the object for parameter matching, and method III employs a PEV with BESS owning the same driving range to the PEV with HESS. As listed in Table 3, compared to the PEV with BESS, the PEV with HESS possessing the same driving mileage reduces TOC by about 3.22% and improves the driving range by 39.9%. Furthermore, the PEV with HESS owning the same driving range reduces about TOC by 28.77%.
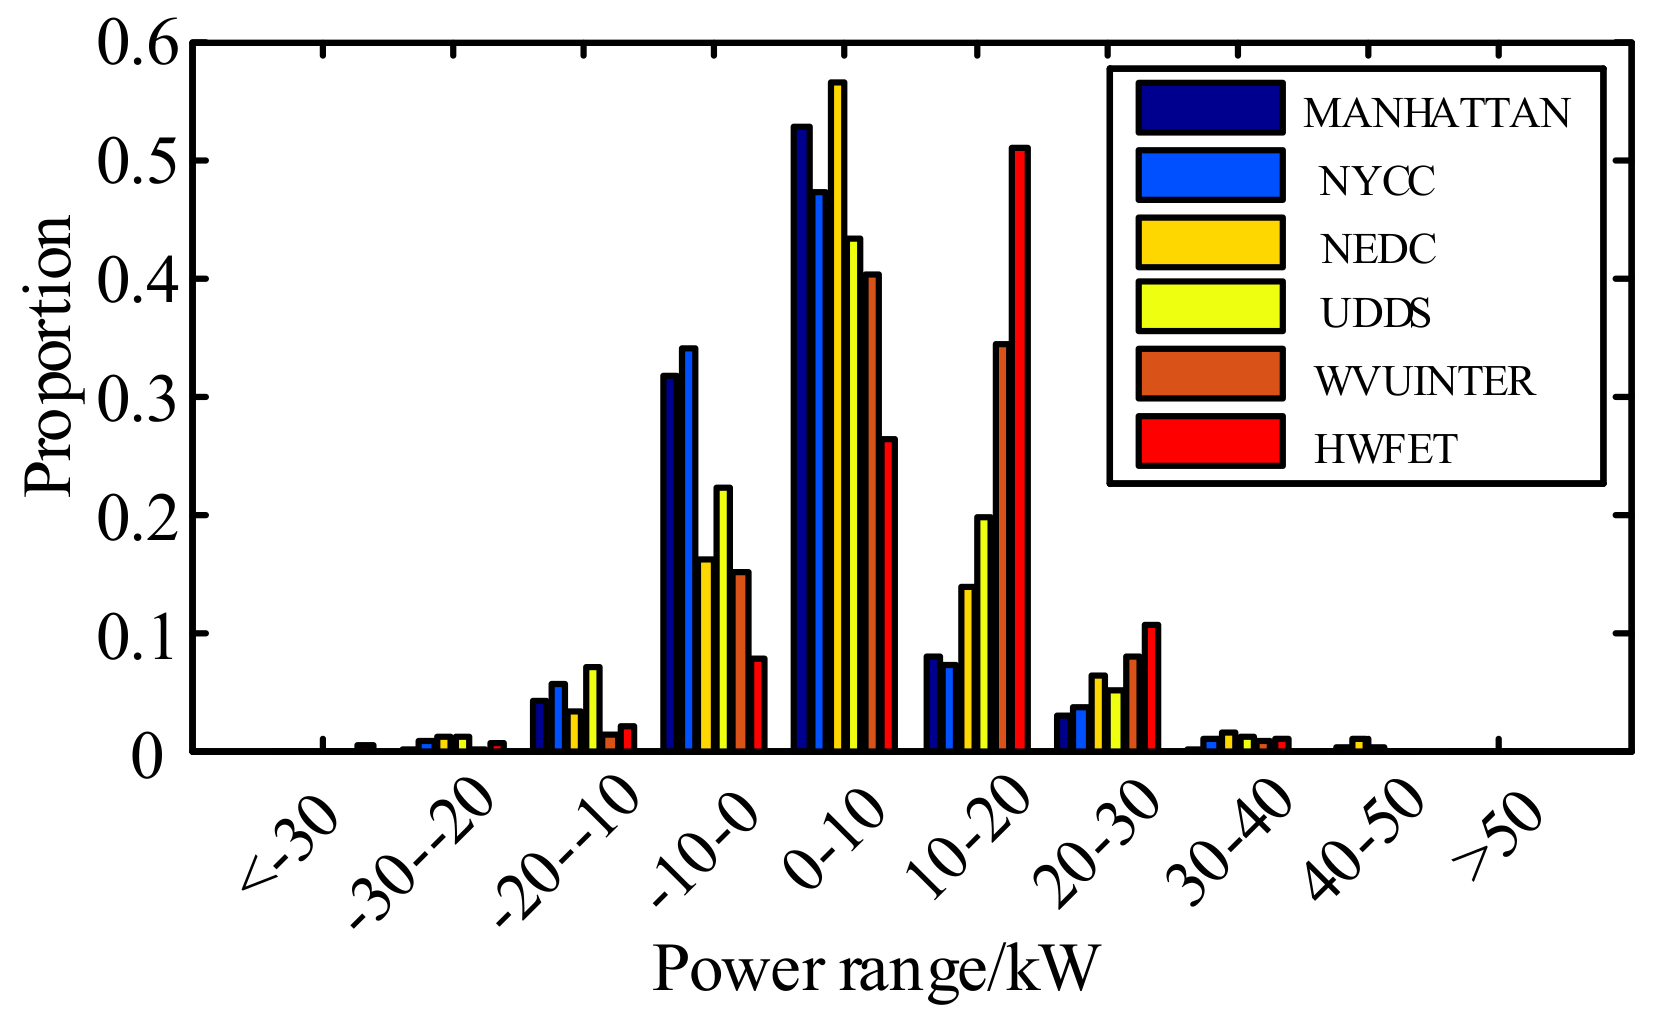
In order to specify the application value of HESS under different types of driving cycles, a minimum driving range of 200 km and mileage of 180,000 km are taken as the constraints, and the integrated optimal methodology is applied to the PEV with HESS and the PEV with the battery energy store system (BESS) under various driving cycles. The optimal parameter matching is obtained under MANHATTAN, NYCC, NEDC, UDDS, WVUINTER, and HWFET driving cycles and the optimization of TCO for HESS and BESS is shown in Figure 4. Figure 5 depicts the distribution of power requirement under the six driving cycles.
It can be observed in Figure 4 that compared to the BESS, the TCOs of HESS decrease by 35.2%, 46.59%, 7.59%, and 3.22%, respectively, under MANHATTAN, NYCC, NEDC, and UDDS driving cycles. This is because under urban and suburban driving cycles, there is frequent acceleration and braking, which is conducive for the ultra-capacitor to absorb braking energy and utilize the energy to smooth the large driving power. Then, the battery life is prolonged and the replacement of the battery may be avoided during a vehicle life cycle. Moreover, under WVUINTER and HWFET driving cycles, the optimal results of HESS are almost the same as BESS, which means that HESS will not bring evident economic enhancement under expressway conditions compared to BESS.

3. Instantaneous Power Allocation Strategy

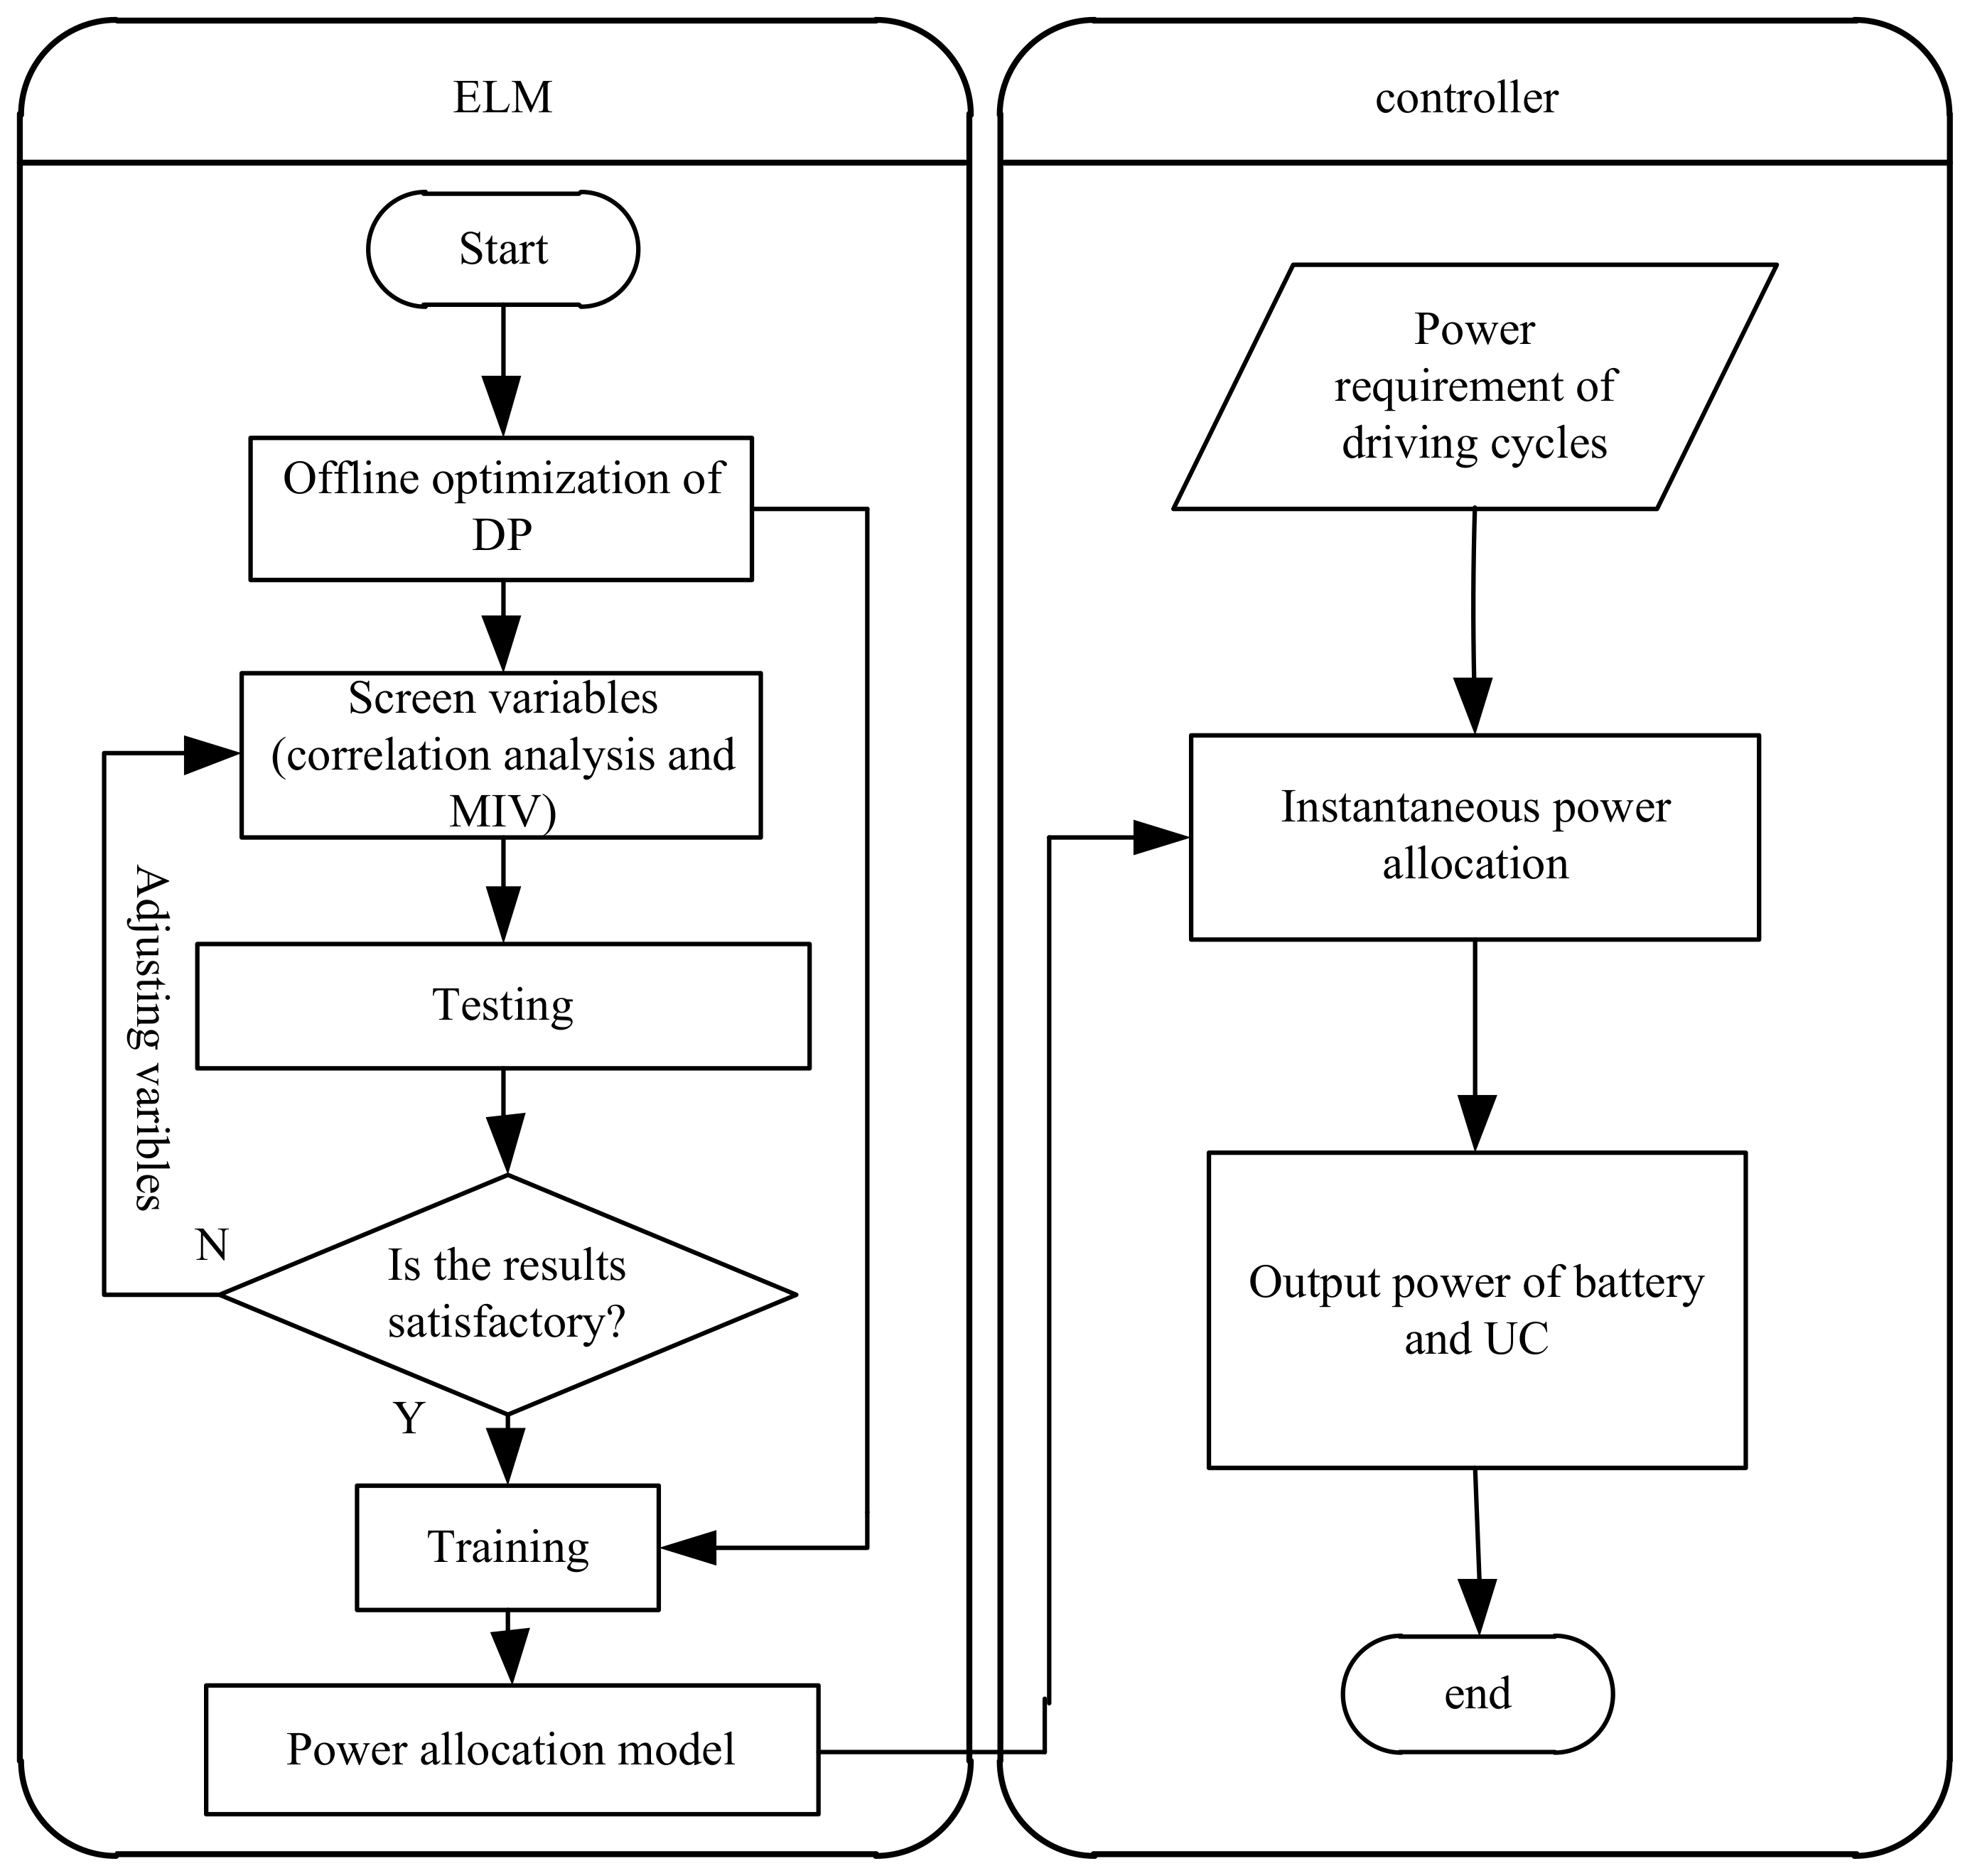
In Section 2, the RBC achieves a good control effect under specific driving cycles. However, poor adaptability of RBC to various types of driving cycles contributes to limited performance improvement when applied to reality. Therefore, in this paper, to enhance the adaptability of the control strategy to driving cycles and explore the economic potential of HESS, a novel ELM-based controller is designed. The design process is displayed in Figure 6. At first, the offline optimization of DP is applied to some typical driving cycles to acquire the data of optimal instantaneous power allocation of HESS. Then, in order to improve the accuracy of ELM and decrease the training time of ELM, the characteristic variables of ELM are screened through correlation analysis and mean impact value (MIV). Finally, instantaneous power allocation laws of different driving cycles are received by means of adopting the ELM to learn offline data from DP, and then the online power allocation strategy is obtained.

3.1. Offline Optimization of Dynamic Programming

The control strategy based on DP is established in this section. In this paper, the power of the battery is selected as the control variable, as described in Equation (19), and the state variables are the SOC of the battery and ultra-capacitor, which are shown in Equation (17). The capacity loss of the battery is calculated by Equations (18) and (19) determines the electricity depletionn of the battery. Due to the fact that the discrete step d t and the nominal capacity of battery Q r a t e are specified under a certain state, Equation (18) or Equation (19) are equivalent to the cost function and any one of the two equations is suitable.
u = { P b a t ( t ) }
x = { S O C b a t , S O C u c }
C = I b a t Q r a t e
S O C = I b a t × d t 3600 Q r a t e
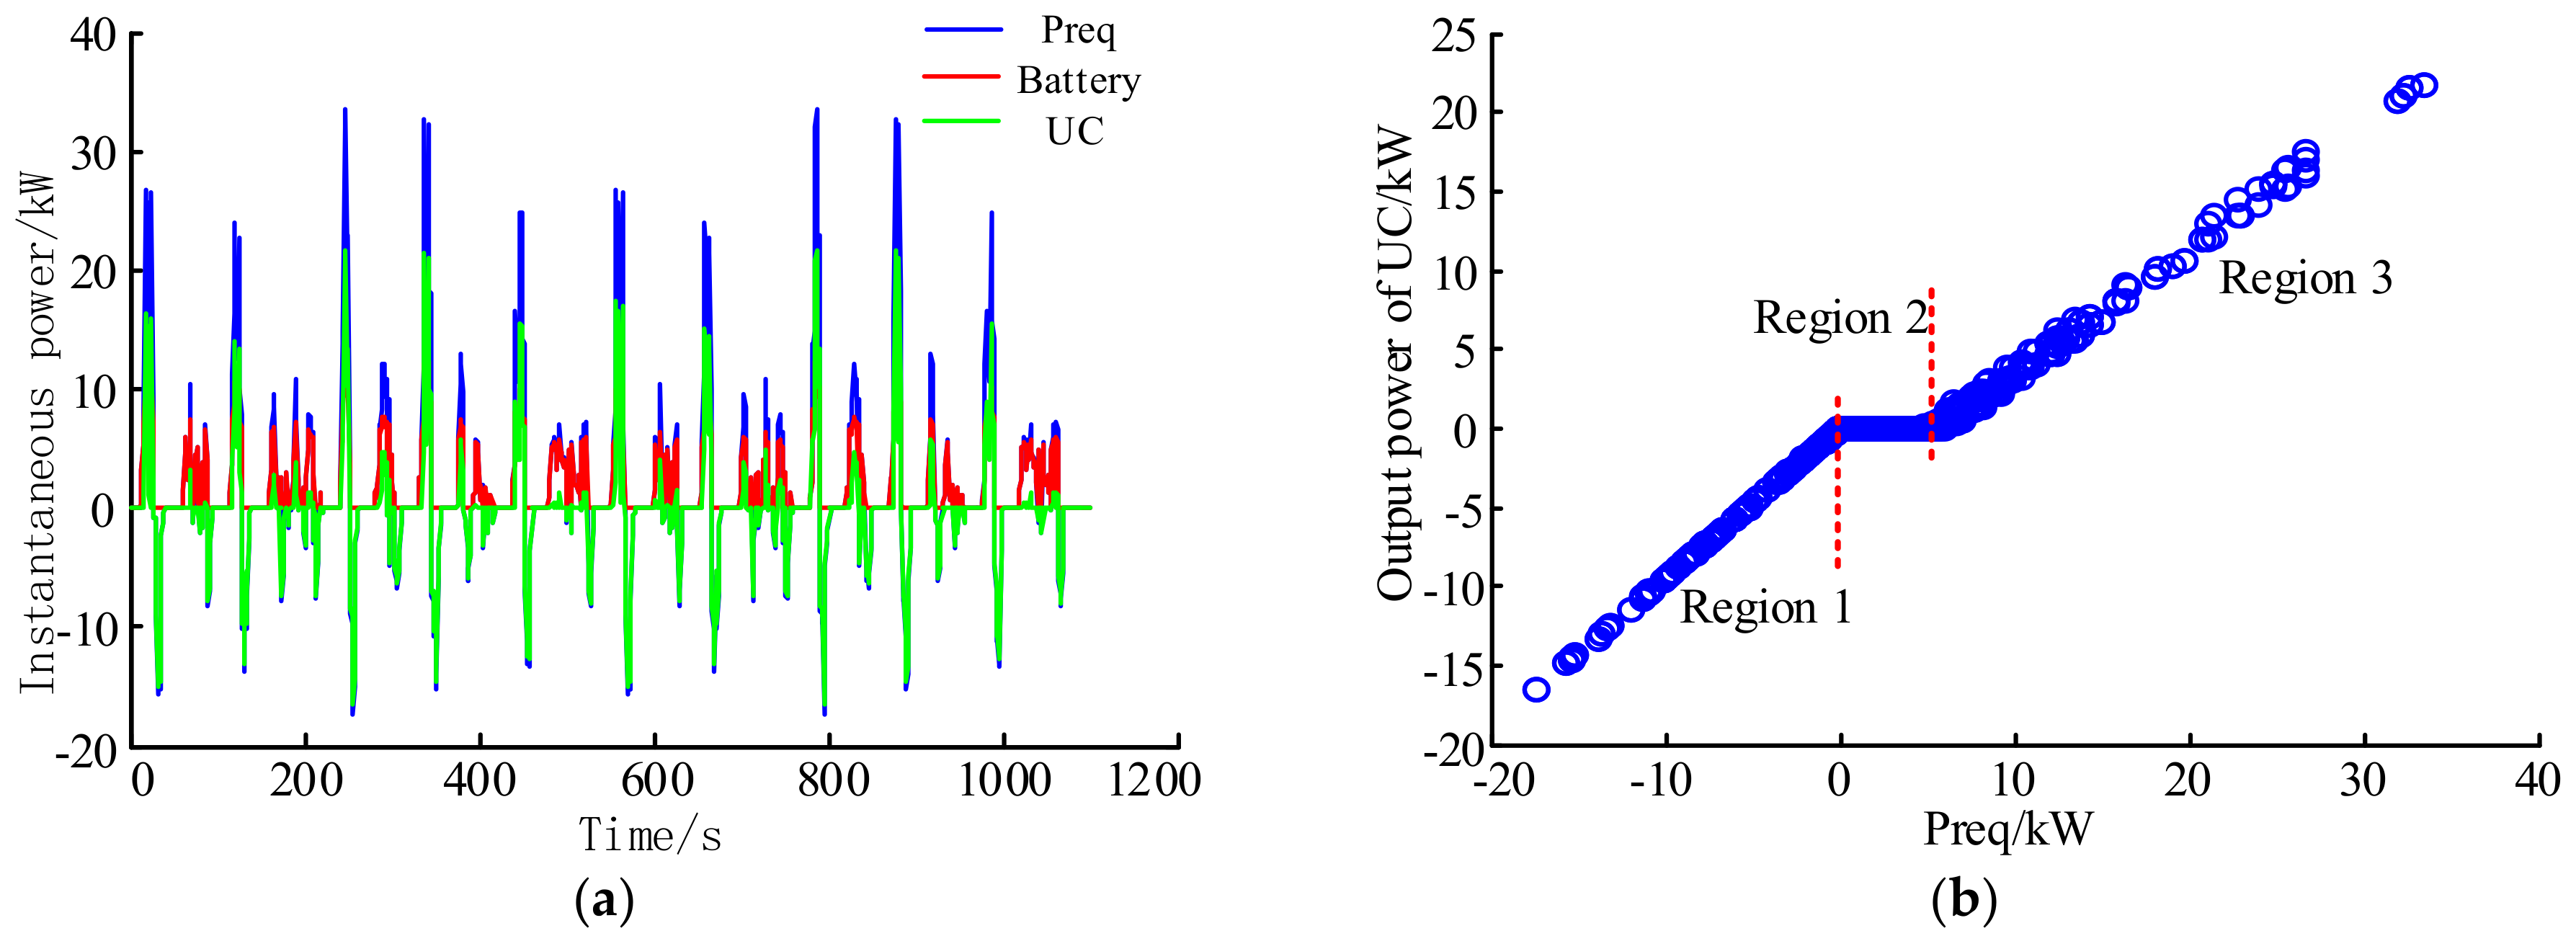
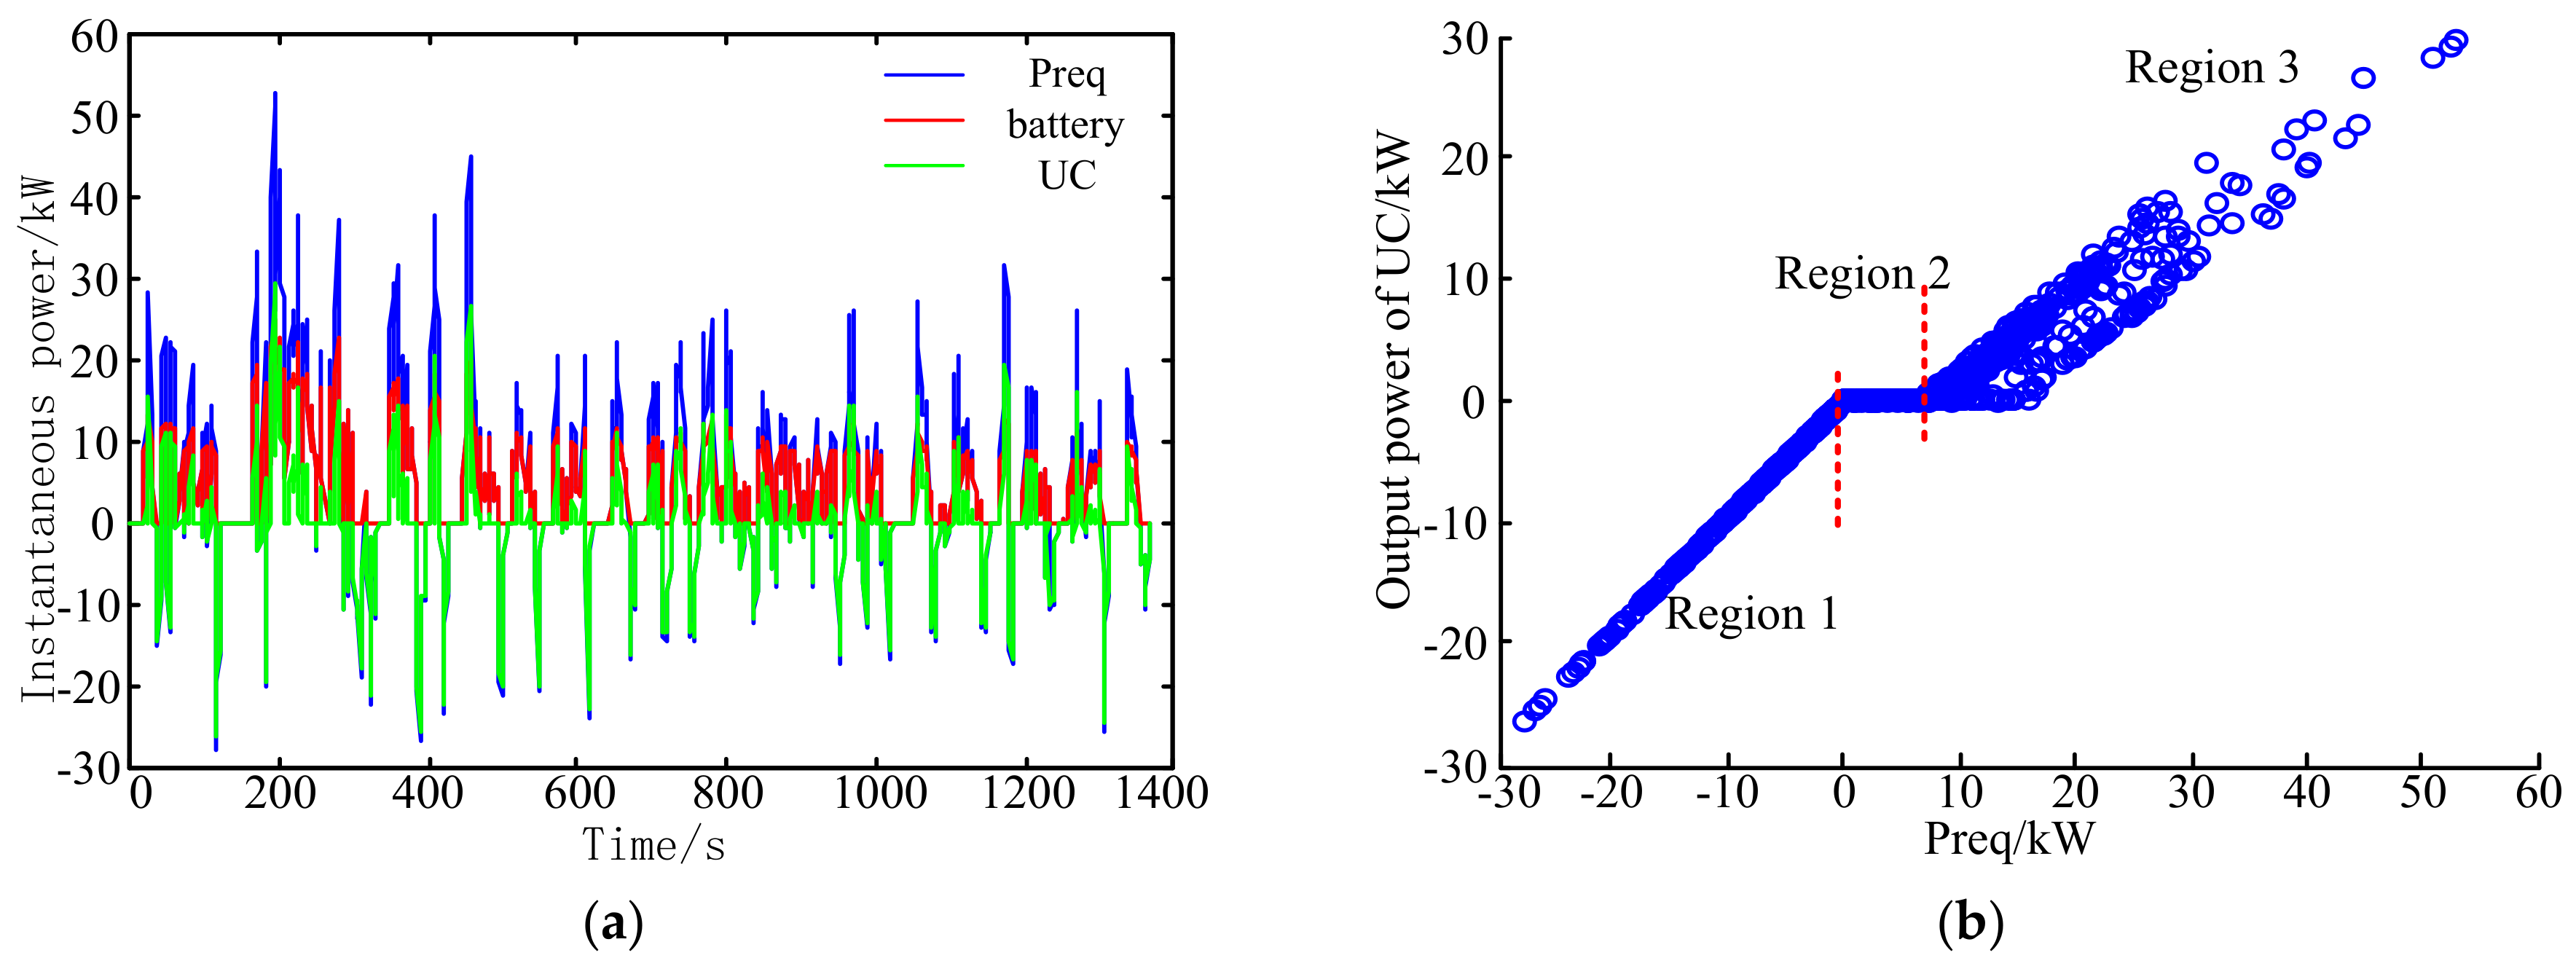
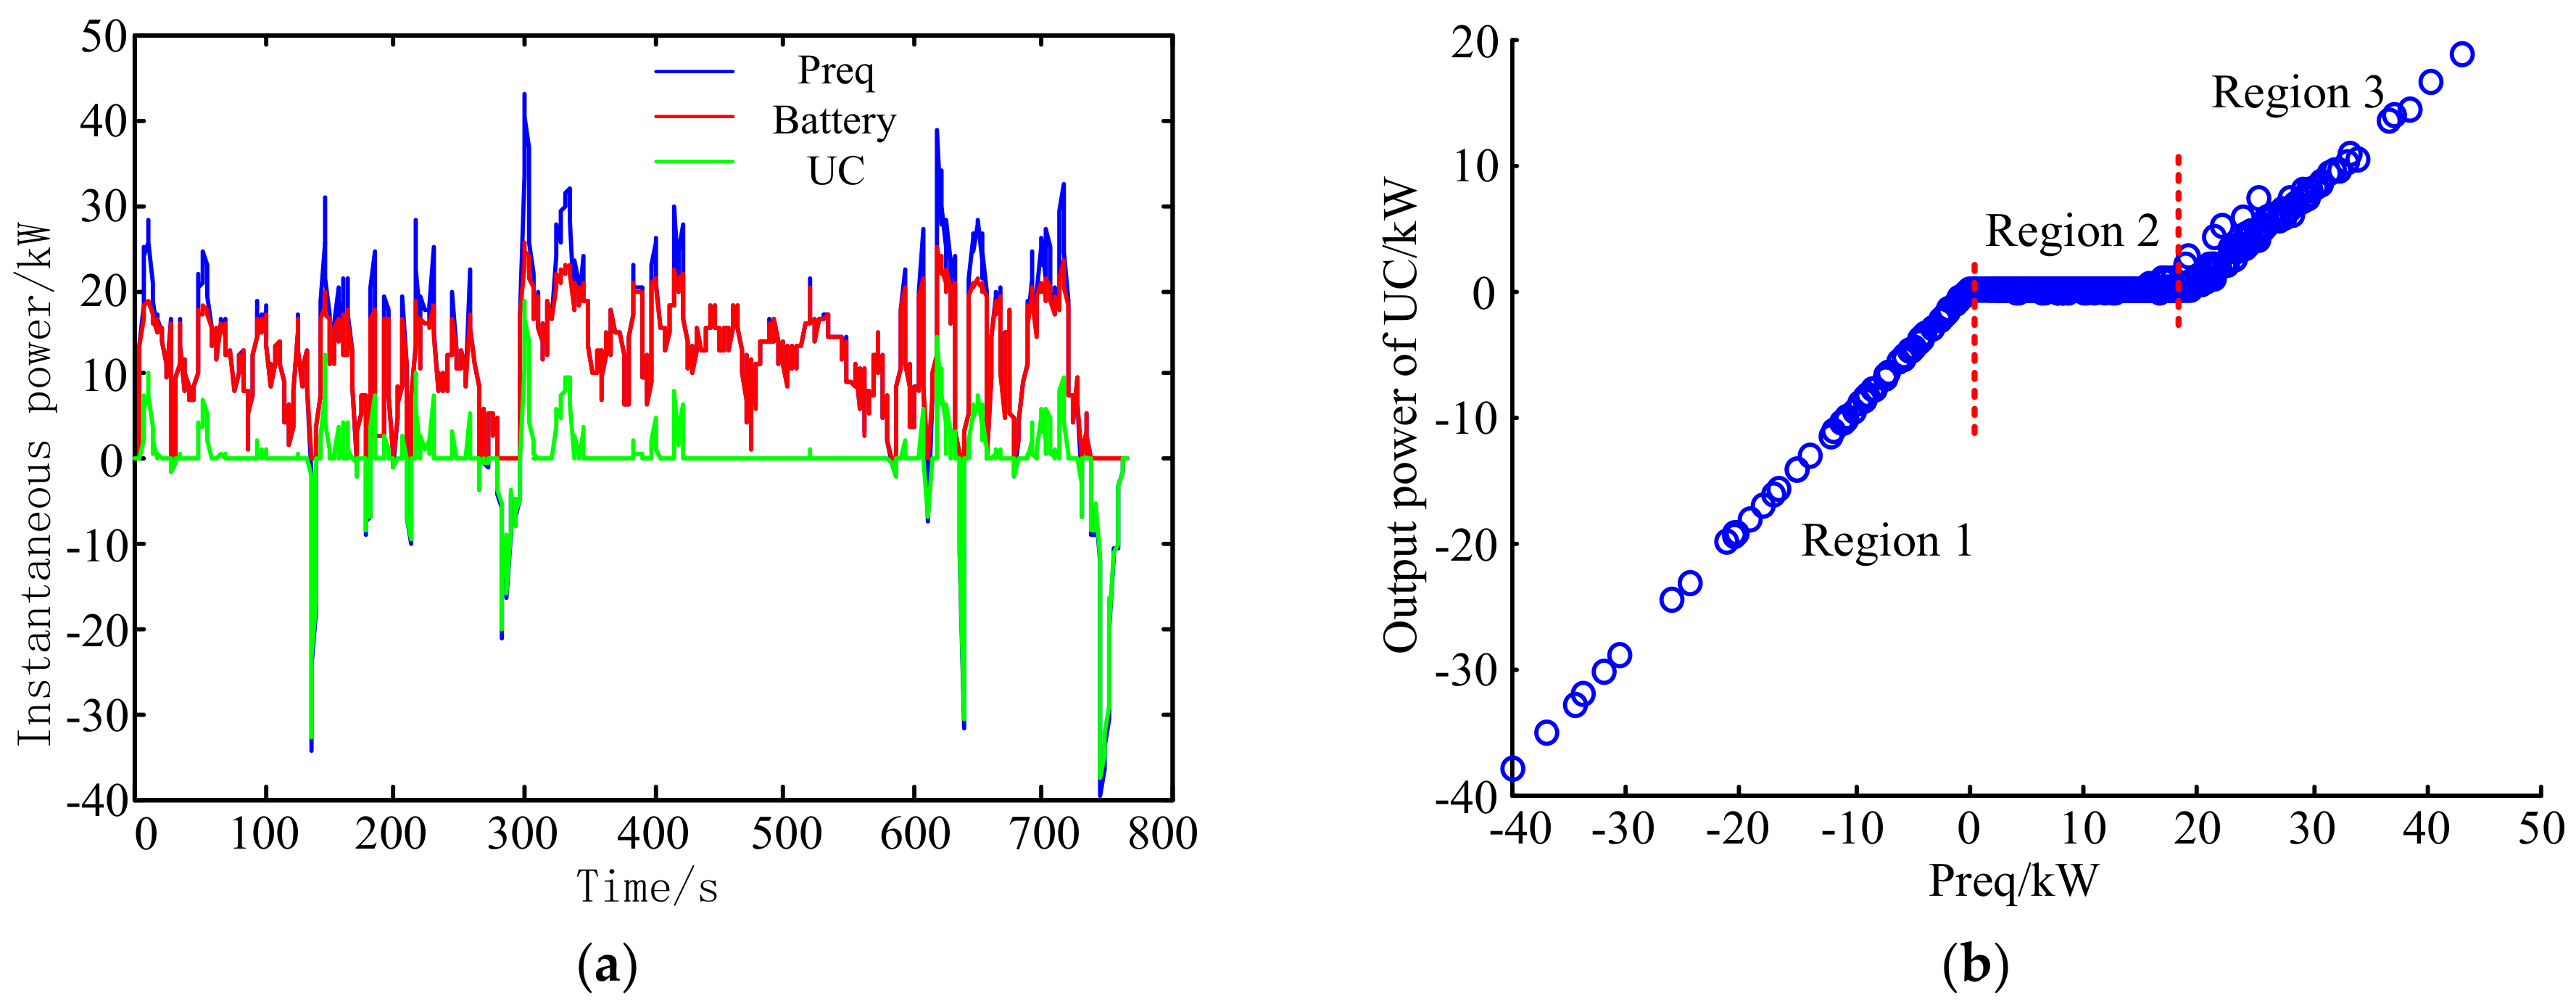
UKBUS6, MANHATTN, NYCC, UDDS, New York Bus, INDIAHWY, EUDC_LOW, and HWFET, which contain urban, suburban, and highway conditions, are selected as the driving cycles for the offline optimization of DP. The discrete step of DP is 1 s and 9003 control points are acquired from the eight driving cycles. In this paper, only the power relationships of MANHATTN, UDDS, and HWFET driving cycles are given, as indicated in Figure 7, Figure 8 and Figure 9. It is not hard to discover that the power of the ultra-capacitor under various driving cycles can be divided into three regions. Additionally, there is an approximately linear relationship in each region. Region 1 represents that the ultra-capacitor absorbs all of the braking energy at a certain time. It can be seen from region 2 that when the power requirement of the motor is positive and less than a certain threshold, the ultra-capacitor does not provide the output power. In region 3, the output power of the ultra-capacitor increases with the power requirement when the power requirement is greater than the threshold. In view of the obvious regularity of instantaneous power allocation, it is significantly possible to discover the law of power allocation through a learning algorithm and improve the performance of HESS. Thus, this paper plans to employ ELM to learn offline data from DP and obtain the novel power allocation strategy.

3.2. Screening of Characteristic Variables

ELM is an algorithm for solving a single hidden layer neural network (SHLNN). Compared to the traditional neural network (NN), ELM possesses the advantages of a fast learning speed and high accuracy [37]. Thus, ELM is selected as the learning algorithm for offline data.
The training samples are the offline data of power allocation from DP obtained in Section 3.1. The initial input variables of training net are the current speed v , the speed of the previous moment v p r e , the current acceleration a , the acceleration of the previous moment a p r e , the current power requirement of the motor P r e q , the motor power requirement of the previous moment P r e q . p r e , the battery output power of the previous moment P b a t . p r e , the ultra-capacitor output power of the previous moment P u c . p r e , and the current SOC of the ultra-capacitor S O C u c . Furthermore, the output power of the ultra-capacitor P u c is the output variable of the training net. The mean square error E and coefficient of determination R 2 are selected to evaluate the effect of the training net.
The mean square error E can be computed by:
E = 1 l i = 1 l ( y ^ i y i ) 2
where l is the number of training samples. y ^ i presents the predicted value of the i th sample, and the real value of the i th sample is labeled by y i .
The coefficient of determination R 2 can be obtained by:
R 2 = ( l i = 1 l y ^ i y i i = 1 l y ^ i i = 1 l y i ) 2 ( l i = 1 l y ^ i 2 ( i = 1 l y ^ i ) 2 ) ( l i = 1 l y i 2 ( i = 1 l y i ) 2 )
The coefficient of determination is in the range [0, 1], and the closer its value is to 1, the better the performance of the model is. On the contrary, the poorer the performance model is, the closer its value is to 0.
To enhance the learning efficiency and establish a more accurate model of ELM, it is essential to delete some unimportant characteristic variables and obtain crucial characteristic variables. Correlation analysis is a statistical method of studying the correlation between variables. It can analyze the correlation between the objects of study and express the extent of the correlation. Moreover, MIV [38] is the index reflecting the influence of input neurons on output neurons, and it is used to screen the characteristic parameters of the neural network. In the two methods above, the correlation analysis is simpler and applied more widely, and MIV is regarded as one of the best indexes evaluating the correlation between characteristic variables in the neural network. Thus, in this section, the correlation analysis is employed to complete the initial screening of variables, and then the further optimal selection of variables is conducted by MIV.

3.2.1. Initial Screening of Correlation Analysis

The pearson correlation coefficient is adopted to explore the correlation degree among the characteristic variables, as shown in Equation (22).
r = i = 1 n ( x i x ¯ ) ( y i y ¯ ) i = 1 n ( x i x ¯ ) 2 i = 1 n ( y i y ¯ ) 2
in which n presents the sample size. x i and y i denote te sample data of sample size n, respectively. x ¯ and y ¯ are the average values of sample data, respectively.
The correlation coefficients between characteristic variables are obtained through the correlation analysis of input variables, as listed in Table 4.
When the correlation coefficients between two variables is greater than 0.8, the two variables are considered to be highly correlated and they can be substituted with each other. After screening group 1 of characteristic variables, group 2 is obtained.
  • Group 1: v , v p r e , a , a p r e , P r e q , P r e q . p r e , P b a t . p r e , P u c . p r e , S O C u c
  • Group 2: v , a , P r e q , P u c . p r e
Mean square error E and coefficient of determination R 2 are calculated in the training of ELM ten times, as displayed in Figure 10. Compared to variable group 1, the training results of variable group 2 possess a smaller mean square error and greater coefficient of determination, which means a higher accuracy of the ELM model. Besides, from the training trend of two variable groups, it is not hard to discover that group 2 has a lower training time.

3.2.2. Mean Impact Value

MIV can reflect the alternation of the weight matrix in the neural network and is mainly applied to the modification of the neural network model. The concrete process of MIV is as follows:
(1) X is set as the input of the training sample. The i th variable in X is added and reduced by 10% to form a new input of training samples X i ( 1 ) and X i ( 2 ) , as shown in Equations (23)–(25).
X = [ x 11 x 12 x 1 m x 21 x 22 x 2 m x n 1 x n 2 x n m ]
X i ( 1 ) = [ x 11 x 12 x 1 i ( 1 + 10 % ) x 1 m x 21 x 22 x i 2 ( 1 + 10 % ) x 2 m x n 1 x n 2 x n i ( 1 + 10 % ) x n m ]
X i ( 2 ) = [ x 11 x 12 x 1 i ( 1 10 % ) x 1 m x 21 x 22 x i 2 ( 1 10 % ) x 2 m x n 1 x n 2 x n i ( 1 10 % ) x n m ]
where m is the number of characteristic variables and n presents the number of training samples.
(2) X i ( 1 ) and X i ( 2 ) are taken as the new inputs of the training sample to the NN model and the outputs are Y i ( 1 ) and Y i ( 2 ) , as depicted in Equations (26) and (27). The difference value between Y i ( 1 ) and Y i ( 2 ) is the impact value (IV) of the input variable on the output, which is shown in Equation (28).
Y i ( 1 ) = [ y i 1 ( 1 ) y i 2 ( 1 ) y i n ( 1 ) ] T
Y i ( 2 ) = [ y i 1 ( 2 ) y i 2 ( 2 ) y i n ( 2 ) ] T
IV i = Y i ( 1 ) Y i ( 2 )
(3) MIV of characteristic variables can be computed by the average value of IV, as displayed in Equation (29).
MIV i = 1 n j = 1 n IV i ( j ) ,   i = 1 , 2 , , m
(4) According to the process above, the MIV of each input variable can be obtained. The positive or negative MIV denotes the direction of correlation, and the absolute value of MIV represents the degree of correlation.
After the correlation analysis in Section 3.2.1, MIV is applied to the four input variables in variable group 2. The results are listed in Table 5.
From Table 5, the influences of characteristic variables on output are sorted from large to small as: a , P r e q , v , and P u c . p r e . Then, the deletion of variables is started from the variable possessing the least influence on the output, and when the performance of the ELM model becomes poorer, the deletion of variables will stop. The groups of variables are listed below:
  • Group 2: a , P r e q , v , P u c . p r e
  • Group 3: a , P r e q , v
  • Group 4: a , P r e q
Figure 11 describes the mean square error E and coefficient of determination R 2 in the ten training sets of ELM. Group 3 results in the least mean square error, highest model accuracy, and a fast learning rate. Thus, the variables in group 3 are selected as the characteristic variables for ELM.

3.3. Instantaneous Power Allocation

After obtaining the characteristic variables of ELM in Section 3.2, the online instantaneous power allocation strategy is formulated by adopting ELM to learn the offline data from DP in this section.

4. Results and Analysis

To test the control effect of the ELM-based controller, a comprehensive driving cycle consisting of 10–15, WVUSUB, INDIAURBAN, IM240, and WVUINTER is set up, as shown in Figure 12, which contains the conditions of urban congestion, suburb, and expressway. Comparative simulations are carried out between the RBC in Section 2 and the ELM-based controller under the comprehensive cycles. It should be noted that the threshold of RBC is optimized by GA.
In addition, at the end of the driving cycle, in order to avoid the comparison error caused by the unequal SOC of the ultra-capacitor in two controllers, the SOC of the ultra-capacitor is compensated by the battery, as indicated in Equation (30).
S O C b a t = S O C u c × E u c × η S O C u c . m a x × U b a t × Q r a t e
in which, S O C b a t is the SOC that the battery compensates for the ultra-capacitor. S O C u c is the difference value of final SOC to initial SOC. E u c is the total energy of the ultra-capacitor. η presents the efficiency of the DC/DC converter and U b a t denotes the voltage of the battery.
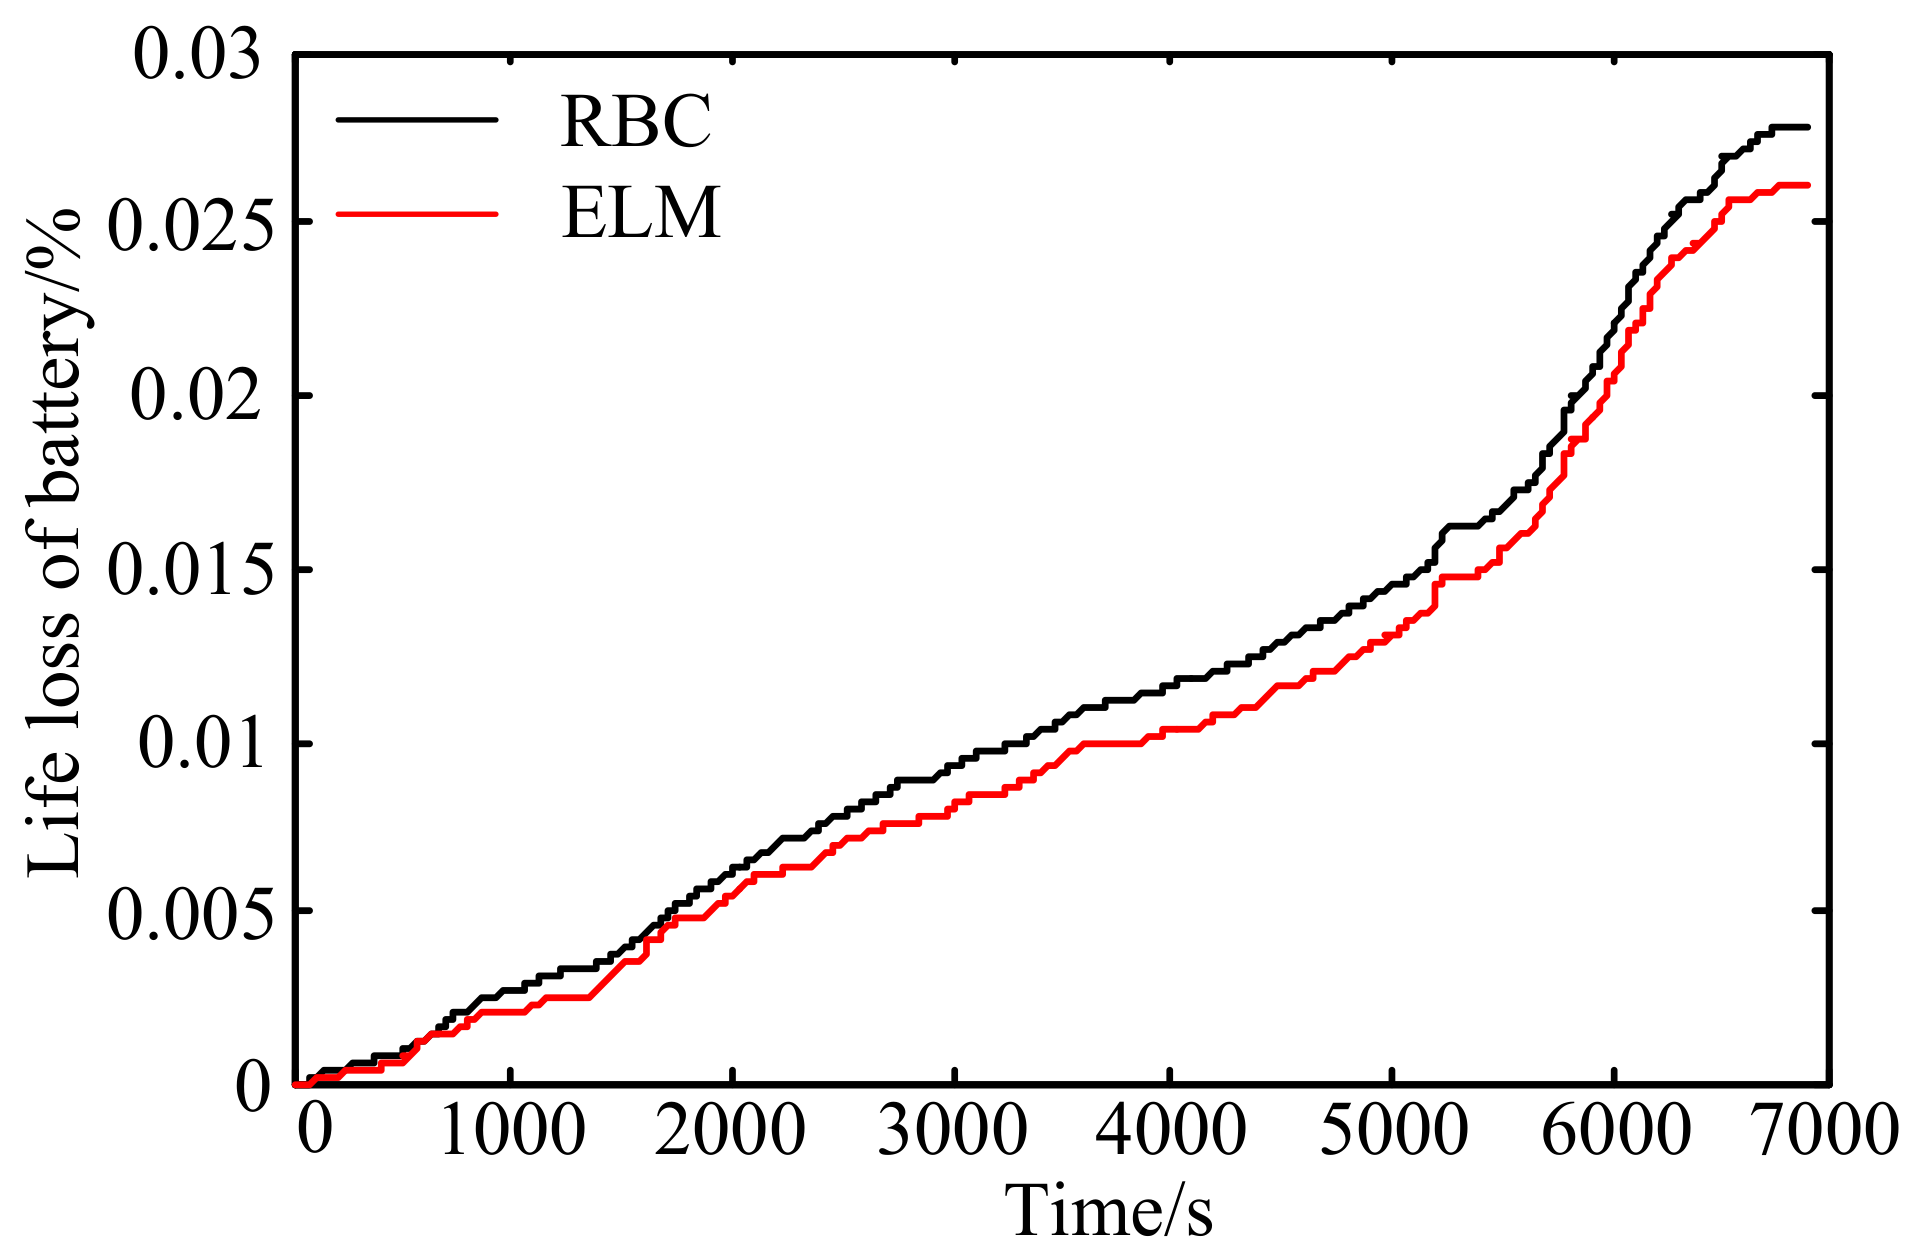
The simulation results of the two controllers are listed in Table 6. The equivalent SOC of battery S O C b a t . e q u a can be calculated by Equation (31). Figure 13 illustrates the battery SOC and the life loss of the battery is displayed in Figure 14.
S O C b a t . e q u a = S O C b a t + S O C b a t
Through the S O C b a t . e q u a comparison of the two controllers, it is not hard to discover that the ELM-based controller possesses a more superior economy and reduces the electricity consumption by 3.78% compared to RBC. Besides, the battery life loss of the ELM-based controller decreases by 6.51% in comparison with RBC.
Owing to the fact that there are too many time points under the comprehensive driving cycle, a part of the whole cycle is selected for analysis. Table 7 lists the using times and average power of the battery in the two controllers. The battery output power of 2300–2800 s is picked out, as depicted in Figure 15. For the RBC, the circumstance that the battery charges the ultra-capacitor by means of low power frequently happens, which decreases the system efficiency. What is more, the frequent employment of the battery contributes to extra life loss of the battery. In contrast, the battery operating in the ELM-based controller reduces the number of times the battery is used by about 26.23% in comparison with RBC. Owing to the poor power constraint for the battery in the ELM-based controller, the excessive output power of the battery happens occasionally, which is not good for the battery life. However, compared to the RBC, the lower number of times that it is used and the occasional high output power of the battery mean that the ELM-based controller reduces the average power of the battery by about 4.79%.

5. Conclusions

In this paper, TCO of HESS considering the replacement cost of the battery and electricity fee is proposed and an optimal methodology integrating the parameters and control strategy for PEV with HESS is investigated. On the basis of the TCO and the optimal method, the evaluation of the application value of HESS is carried out under various driving cycles. Then, in order to enhance the poor adaptability of traditional controllers to different driving cycles, the ELM-based controller is put forward. Additionally, to guarantee the accuracy and improve the learning efficiency of the ELM model, this paper utilizes the method which combines correlation analysis and MIV to obtain characteristic variables of the ELM model. Moreover, a comparative simulation between the ELM-based controller and RBC is conducted. In conclusion, the following important points are achieved.
(1)
Compared to the PEV with BESS, the PEV with HESS is more applicable to urban and suburban conditions, but possesses no obvious advantage under other conditions.
(2)
The comparative results indicate that the ELM-based controller proposed in this paper possesses a superior economic performance compared to the optimized RBC under a comprehensive driving cycle.
In future work, the traffic information, such as the traffic condition and the road grade, will be considered in the controller.

Author Contributions

X.J. wrote the first draft of the manuscript, completed the parameter matching, and developed the novel power allocation strategy. J.H. defined the primary simulation framework and carried out the simulation. M.J. and Y.Z. provided insights and additional ideas on presentation. All authors revised and approved the manuscript.

Funding

This work was supported by the Chongqing Natural Science Foundation (Project No. cstc2015jcyjA60005), the Fundamental Research Funds for the Central Universities (Project No. 106112016CDJXZ338825), and the National Key Research and Development Program of China (Project No. 2016YFB0101402). These projects offered all the costs of this series of researches. The authors appreciate their supports on these researches.

Conflicts of Interest

The authors declare no conflict of interest.

References

  1. Gong, H.; Zou, Y.; Yang, Q.; Fan, J.; Sun, F. Generation of a driving cycle for battery electric vehicles:A case study of Beijing. Energy 2018, 150, 901–912. [Google Scholar] [CrossRef]
  2. Cheng, L.; Wang, W.; Wei, S.; Lin, H.; Jia, Z. An improved energy management strategy for hybrid energy storage system in light rail vehicles. Energies 2018, 11, 423. [Google Scholar] [CrossRef]
  3. Song, Z.; Zhang, X.; Li, J.; Hofmann, H.; Ouyang, M.; Du, J. Component sizing optimization of plug-in hybrid electric vehicles with the hybrid energy storage system. Energy 2018, 144, 393–403. [Google Scholar] [CrossRef]
  4. Masih-Tehrani, M.; Ha’Iri-Yazdi, M.R.; Esfahanian, V.; Safaei, A. Optimum sizing and optimum energy management of a hybrid energy storage system for lithium battery life improvement. J. Power Sources 2013, 244, 2–10. [Google Scholar] [CrossRef]
  5. Amini, M.H.; Karabasoglu, O. Optimal operation of interdependent power systems and electrified transportation networks. Energies 2018, 11, 196. [Google Scholar] [CrossRef]
  6. Song, Z.; Hofmann, H.; Li, J.; Han, X.; Ouyang, M. Optimization for a hybrid energy storage system in electric vehicles using dynamic programing approach. Appl. Energy 2015, 139, 151–162. [Google Scholar] [CrossRef]
  7. Simpson, A.G.; Walker, G.R. Lifecycle costs of ultracapacitors in electric vehicle applications. In Proceedings of the 2002 IEEE 33rd Annual IEEE Power Electronics Specialists Conference (Cat. No. 02CH37289), Cairns, QLD, Australia, 23–27 June 2002; pp. 1015–1020. [Google Scholar]
  8. Wang, Q.; Qu, X.; Yu, Y. Research on power matching strategy of hybrid electric bus with hybrid energy storage system. Automob. Eng. 2014, 36, 389–393. [Google Scholar]
  9. Qu, X. Research on Hybrid Power Supply Matching and Control Theory for Hybrid Vehicles; Jilin University: Changchun, China, 2014. [Google Scholar]
  10. Shen, J.; Dusmez, S.; Khaligh, A. Optimization of sizing and battery cycle life in battery/ultracapacitor hybrid energy storage systems for electric vehicle applications. Ind. Inf. IEEE Trans. 2014, 10, 2112–2121. [Google Scholar] [CrossRef]
  11. Wang, Y.; Yang, Z.; Lin, F. Optimization of energy management strategy and sizing in hybrid storage system for tram. Energies 2018, 11, 752. [Google Scholar] [CrossRef]
  12. Fu, Z.M.; Wang, B.; Zhou, P.G. An improved logic threshold approach of energy management for a power-split hybrid electric vehicle. In Proceedings of the 2013 International Conference on Advanced Mechatronic Systems, Luoyang, China, 25–27 September 2013; pp. 244–248. [Google Scholar]
  13. Hu, J.-J.; Zheng, Y.; Hu, Z.-H.; Xiao, J. Parameter matching and control strategy for the electric vehicle with hybrid energy storage system. China J. Highw. Transp. 2018, 31, 142–150. [Google Scholar]
  14. Xiang, C.; Wang, Y.; Hu, S.; Wang, W. A new topology and control strategy for a hybrid battery-ultracapacitor energy storage system. Energies 2014, 7, 2874–2896. [Google Scholar] [CrossRef]
  15. Wang, Y.; Wang, W.; Zhao, Y.; Yang, L.; Chen, W. A fuzzy-logic power management strategy based on markov random prediction for hybrid energy storage systems. Energies 2016, 9, 25. [Google Scholar] [CrossRef]
  16. Ferreira, A.A.; Pomilio, J.A.; Spiazzi, G.; Silva, L.D.A. Energy management fuzzy logic supervisory for electric vehicle power supplies system. IEEE Trans. Power Electron. 2008, 23, 107–115. [Google Scholar] [CrossRef]
  17. Jaafar, A.; Akli, C.R.; Sareni, B.; Roboam, X.; Jeunesse, A. Sizing and energy management of a hybrid locomotive based on flywheel and accumulators. IEEE Trans. Veh. Technol. 2009, 58, 3947–3958. [Google Scholar] [CrossRef] [Green Version]
  18. Hredzak, B.; Agelidis, V.G.; Demetriades, G. A low complexity control system for a hybrid battery-ultracapacitor power source. In Proceedings of the 2013 IEEE ECCE Asia Downunder, Melbourne, VIC, Australia, 3–6 June 2013; pp. 770–775. [Google Scholar]
  19. Song, Z.; Hofmann, H.; Li, J.; Hou, J.; Han, X.; Ouyang, M. Energy management strategies comparison for electric vehicles with hybrid energy storage system. Appl. Energy 2014, 134, 321–331. [Google Scholar] [CrossRef]
  20. Chen, S.Y.; Hung, Y.H.; Wu, C.H.; Huang, S.T. Optimal energy management of a hybrid electric powertrain system using improved particle swarm optimization. Appl. Energy 2015, 160, 132–145. [Google Scholar] [CrossRef]
  21. Chen, Z.; Xiong, R.; Cao, J.; Lund, H.; Kaiser, M.J. Particle swarm optimization-based optimal power management of plug-in hybrid electric vehicles considering uncertain driving conditions. Energy 2016, 96, 197–208. [Google Scholar] [CrossRef]
  22. Hu, X.; Moura, S.J.; Murgovski, N.; Bo, E.; Cao, D. Integrated optimization of battery sizing, charging, and power management in plug-in hybrid electric vehicles. IEEE Trans. Control Syst. Technol. 2016, 24, 1036–1043. [Google Scholar] [CrossRef]
  23. Santucci, A.; Sorniotti, A.; Lekakou, C. Power split strategies for hybrid energy storage systems for vehicular applications. J. Power Sources 2014, 258, 395–407. [Google Scholar] [CrossRef]
  24. Chen, B.C.; Wu, Y.Y.; Tsai, H.C. Design and analysis of power management strategy for range extended electric vehicle using dynamic programming. Appl. Energy 2014, 113, 1764–1774. [Google Scholar] [CrossRef]
  25. Zhou, F.; Xiao, F.; Chang, C.; Shao, Y.; Song, C. Adaptive model predictive control-based energy management for semi-active hybrid energy storage systems on electric vehicles. Energies 2017, 10, 1063. [Google Scholar] [CrossRef]
  26. Zhang, S.; Xiong, R.; Sun, F. Model predictive control for power management in a plug-in hybrid electric vehicle with a hybrid energy storage system. Appl. Energy 2017, 185, 1654–1662. [Google Scholar] [CrossRef]
  27. Salmasi, F.R. Control strategies for hybrid electric vehicles: Evolution, classification, comparison, and future trends. IEEE Trans. Veh. Technol. 2007, 56, 2393–2404. [Google Scholar] [CrossRef]
  28. Lei, Z.; Qin, D.; Liu, Y.; Peng, Z.; Lu, L. Dynamic energy management for a novel hybrid electric system based on driving pattern recognition. Appl. Math. Model. 2017, 45, 940–954. [Google Scholar] [CrossRef]
  29. Song, Z.; Hofmann, H.; Li, J.; Han, X.; Zhang, X.; Ouyang, M. A comparison study of different semi-active hybrid energy storage system topologies for electric vehicles. J. Power Sources 2015, 274, 400–411. [Google Scholar] [CrossRef]
  30. Wang, J.; Liu, P.; Hicks-Garner, J.; Sherman, E.; Soukiazian, S.; Verbrugge, M.; Tataria, H.; Musser, J.; Finamore, P. Cycle-life model for graphite-LiFePO 4 cells. J. Power Sources 2011, 196, 3942–3948. [Google Scholar] [CrossRef]
  31. Luo, Y.; Wang, F.; Yu, H. Research on LiFePO4 battery life model based on driving cycle. Autom. Eng. 2015, 37, 881–885. [Google Scholar]
  32. Luo, Y.; Liu, X.; Liang, W. Design of hybrid energy storage system for electric vehicles to extend the life of lithium ion batteries. J. S. China Univ. Technol. 2016, 44, 51–59. [Google Scholar]
  33. Standardization Administration of the People’s Republic of China. Whole Vehicle Performance Testing Bench of Distributed Multi-System Electric Vehicle; GB/T18386-2005; Standardization Administration of the People’s Republic of China: Beijing, China, 2013.
  34. Wang, Y. Research on Design and Power Allocation Strategy of Hybrid Energy Storage System; Beijing Institute of Technology: Beijing, China, 2016. [Google Scholar]
  35. Zhou, X.; Qin, D.; Hu, J.; Zhou, X.; Qin, D.; Hu, J. Multi-objective optimization design and performance evaluation for plug-in hybrid electric vehicle powertrains. Appl. Energy 2017, 208, 1608–1625. [Google Scholar] [CrossRef]
  36. Li, S. Life Cycle Analysis and Environmental Benefit Evaluation of Electric Vehicle; Jinlin University: Changchun, China, 2014. [Google Scholar]
  37. Huang, G.B.; Chen, L.; Siew, C.K. Universal approximation using incremental constructive feedforward networks with random hidden nodes. IEEE Trans. Neural Netw. 2006, 17, 879–892. [Google Scholar] [CrossRef] [PubMed]
  38. Dombi, G.W.; Nandi, P.; Saxe, J.M.; Ledgerwood, A.M.; Lucas, C.E. Prediction of rib fracture injury outcome by an artificial neural network. J. Trauma 1995, 39, 915–921. [Google Scholar] [CrossRef] [PubMed]
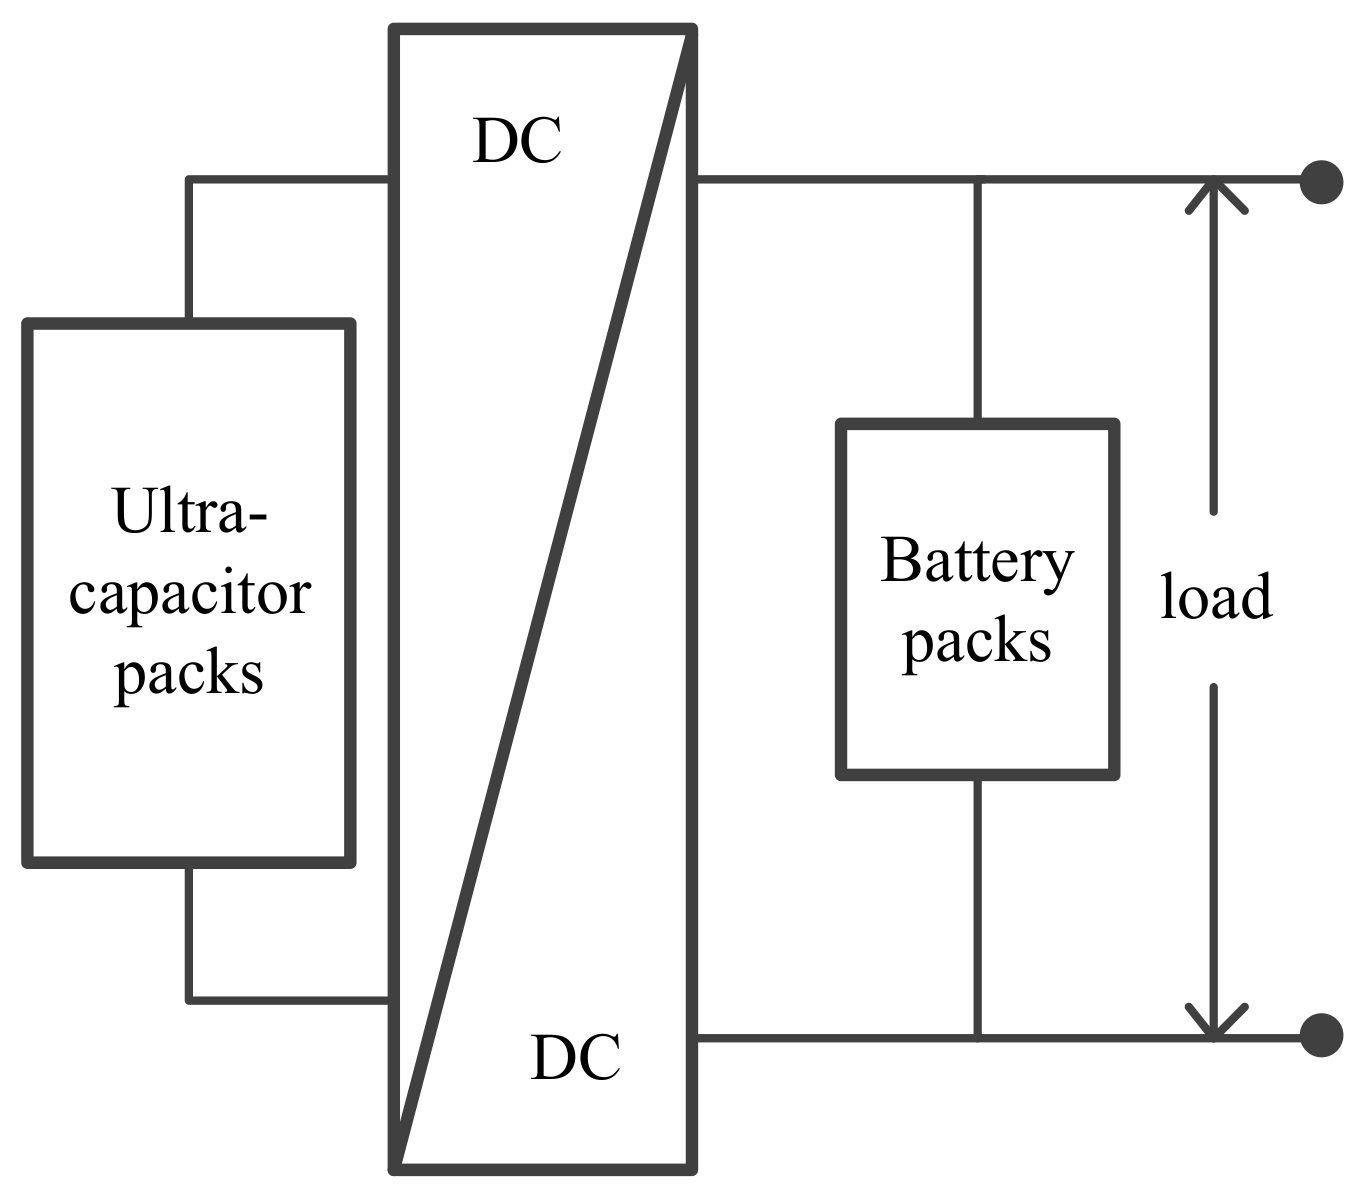
Figure 1. Semi-active with DC/DC and ultra-capacitor connection.
Energies 11 01933 g001
Figure 2. Diagram of the rule-based controller.
Energies 11 01933 g002
Figure 3. Diagram of parameters optimization.
Energies 11 01933 g003
Figure 4. Optimal economic results of hybrid energy storage system (HESS) and battery energy store system (BESS).
Energies 11 01933 g004
Figure 5. Power distributions under various driving cycles.
Energies 11 01933 g005
Figure 6. Design process of the ELM-based controller.
Energies 11 01933 g006
Figure 7. MANHATTAN driving cycle. UC: ultra-capacitor; Preq: power requirement of the motor. (a) Instantaneous power allocation; (b) Power relationship.
Energies 11 01933 g007
Figure 8. The Urban Dynamometer Driving Schedule (UDDS) driving cycle. (a) Instantaneous power allocation; (b) Power relationship.
Energies 11 01933 g008
Figure 9. HWFET driving cycle. (a) Instantaneous power allocation; (b) Power relationship.
Energies 11 01933 g009
Figure 10. Model performance comparisons of two groups of characteristic variables.
Energies 11 01933 g010
Figure 11. Model performance comparisons of three input variable groups. (a) Mean square error; (b) Coefficient of determination.
Energies 11 01933 g011
Figure 12. Comprehensive driving cycle.
Energies 11 01933 g012
Figure 13. Battery state of charge (SOC). ELM: ELM-based controller.
Energies 11 01933 g013
Figure 14. Life loss of the battery.
Energies 11 01933 g014
Figure 15. Output power of the battery.
Energies 11 01933 g015
Table 1. Basic parameters of the vehicle.
ParameterValue
Total weight/kg1900
Curb weight/kg1500
Front section/m22.3
Aerodynamic drag factor0.29
Rolling resistance0.012
Wheel radius/m0.307
Motor rated power/kW80
Motor peak power/kW105
Motor voltage class/V≤360
Table 2. Basic parameters of the lithium iron phosphate battery.
IndexValue
Nominal capacity/Ah20
Nominal voltage/V3.2
Internal resistance/mΩ≤6
Weight/g514 ± 10
Charge voltage/V3.65 ± 0.05
Discharge termination voltage/V2.0
Operating temperature/°C−20–60
Table 3. Results comparison of three parameters matching methods.
Methods of Parameters Matching C b a t . i n i t C b a t . r e p C u c C D C / D C C e l e c TOCDriving Range
Method I9.51.951.461.8014.71279.2
Method II6.86.81.6015.20200
Method III9.59.51.6520.65279.2
Table 4. Correlation coefficients between characteristic variables.
r v v p r e a a p r e P r e q P r e q . p r e P b a t . p r e P u c . p r e S O C u c
v 1.0000.9970.0350.0950.4570.5000.6310.113−0.834
v p r e 0.9971.0000.0360.0350.4050.4570.5980.065−0.837
a 0.0350.0361.0000.8330.7170.6030.4550.6680.046
a p r e 0.0950.0350.8331.0000.6380.7170.5530.7680.006
P r e q 0.4570.4050.7170.6381.0000.8900.8180.745−0.305
P r e q . p r e 0.5000.4570.6030.7170.8901.0000.9010.866−0.351
P b a t . p r e 0.6310.5980.4550.5530.8180.9011.0000.639−0.468
P u c . p r e 0.1130.0650.6680.7680.7450.8660.6391.000−0.029
S O C u c −0.834−0.8370.0460.006−0.305−0.351−0.468−0.0291.000
Table 5. Mean impact value (MIV) of each characteristic variable.
Input Variables v a P r e q P u c . p r e
MIV−18.792326.8124.987−0.0138
Table 6. Simulation results of two control strategies.
Controller S O C b a t S O C u c S O C b a t . e q u a Life Loss/%
Rule based0.67750.94970.67770.02779
ELM0.68840.37730.68610.02598
Table 7. Results of the battery in the rule-based controller (RBC) and extreme learning machine (ELM).
Use of BatteryRBCELM
Battery using times48,58535,842
Average power of battery/kW4.5144.298