Article

Experimental and Numerical Thermal Analysis of Multi-Layered Microchannel Heat Sink for Concentrating Photovoltaic Application

Environment and Sustainability Institute, University of Exeter, Penryn Campus, Cornwall TR109FE, UK
*
Author to whom correspondence should be addressed.
Energies 2019, 12(1), 122; https://doi.org/10.3390/en12010122
Submission received: 3 December 2018 / Revised: 23 December 2018 / Accepted: 24 December 2018 / Published: 30 December 2018
(This article belongs to the Section J: Thermal Management)

Abstract

:
Concentrating photovoltaic has a major challenge due to the high temperature raised during the process which reduces the efficiency of the solar cell. A multi-layered microchannel heat sink technique is considered more efficient in terms of heat removal and pumping power among many other cooling techniques. Thus, in the current work, multi-layered microchannel heat sink is used for concentrating photovoltaic cooling. The thermal behavior of the system is experimentally and numerically investigated. The results show that in extreme heating load of 30 W/cm2 with heat transfer fluid flow rate of 30 mL/min, increasing the number of layers from one to four reduces the heat source temperature from 88.55 to 73.57 °C. In addition, the single layered MLM heat sink suffers from the highest non-uniformity in the heat source temperature compared to the heat sinks with the higher number of layers. Additionally, the results show that increasing the number of layers from one to four reduces the pressure drop from 162.79 to 32.75 Pa.

1. Introduction

Concentrating photovoltaic (CPV) technology has gained much more attention than the conventional photovoltaic due its competitive cost [1]. Eighty percent of the concentrated sunlight is absorbed by the solar cell, only a small portion is converted to electrical energy, and the remaining is converted to thermal energy which causes an increase of the solar cell temperature [2,3]. A study showed that the solar cell temperature could reach 1400 °C under 500 concentration ratio if it is fully insulated [4]. Studies show that the temperature effect on the solar cell efficiency depends on its type for instance the output power declines in an order of 0.65%/°C, 0.4%/°C and 0.248%/°C for crystalline solar cells, thin-film cell and triple-junction solar cells respectively [5]. Additionally, the excessive temperature causes a long-term degradation of the solar cell if it exceeds the maximum limit [6]. Temperature distribution on the surface of a solar cell due to the non-uniform illumination on the surface is another parameter that affects the solar cell efficiency [7]. This implies the importance of removing the generated heat efficiently.
Solar cells are classified according to arrangement as single-cell, linear and densely packed cells [8]. In a single solar cell receiver, the heat is concentrated at the center of the receiver. This implies that the heat needs to be transferred to the base layers with lowest thermal resistance and equally to achieve the reduction of the solar cell maximum temperature and the temperature uniformity. Theristis and O’Donovan [9] found that CPV single solar cells can be cooled using a passive approach having thermal resistance of 1.7 K/W but in extreme outdoor conditions, lower thermal resistance (1.4 K/W) is needed which means an active cooling system is required. On the other hand, Aldossary et al. [10] have examined experimentally and numerically different cooling techniques for CPV in a harsh environment. The simulations show that the round pin and straight fins heat sinks are not sufficient to maintain the single solar cell below the operational temperature limit of 80 °C. Additionally, the study experimentally investigated the thermal behavior of a 1 cm2 single solar cell receiver under high concentration attached to a water cooled heat sink using a rectangular cooling channel with 10 mm height. The results show that the solar cell maximum surface temperature was maintained at 60 °C for water velocity of 0.01 m/s with a heat transfer coefficient of 1645 W/(m2K).
A multi-layered microchannel (MLM) heat sink technique is considered more efficient in terms of pumping power and heat removal capability among many other cooling techniques [11]. Vafai and Zhus [12] were the first to propose the concept of multi-layered microchannel heat sink (MLM) in electronic cooling applications. They numerically studied the performance of two layers for a counter flow and a uniform heat source and found, interestingly, that the pressure drop and temperature rise on the base surface were reduced compared to the conventional one layered heat sink. In later years, many studies have been published investigating the multi-layered techniques of different channel shapes, materials, flow and fluids. The optimum number of layers was investigated by Wei and Joshi [13] where the number of layers varied between one and six. The analysis shows a significant effect of the number of layers on the thermal resistance and pumping power, and the optimum number of layers was found to be three. In addition, studies have proposed different materials of layers such as silicon [14,15,16], copper [17,18], aluminum [19], steel and diamond [11]. Additionally, the studies have investigated different fluid flow patterns such as parallel flow [20,21,22], counter flow [23,24,25,26] and both flows comparison [27,28,29]. Different coolants have been tested for the MLM heat sink applications such as water [30], air [31,32], nanofluids [33,34], deionized water and ethylene glycol [35]. The MLM heat sink investigations have also studied the effect of channel shape such as rectangle [36,37,38], square [39,40], triangle [19] and wavy [41]. Table 1 summarizes the MLM heat sink studies and their important findings.
The majority of the studies conducted for MLM heat sink have considered a uniform heat source and very few have considered the non-uniform heat source. Wei et al. [42] have compared the behavior of MLM heat sink under uniform and partial heat source numerically and experimentally. The experiments have used several heaters to simulate the partial heating scenario. The results show that the heat sink for partial heating has higher total thermal resistance than the full heating due to localized heating. Additionally, the partial heating effect increases as flow rate increases. The authors have pointed out the importance of the location of the heat source to minimize the localized heating effect. In addition, the flow directions (counter flow and parallel flow) have been explored. The results show that double layered heat sinks experience similar thermal resistance of 0.09 °C/(W/cm2) for both flow patterns. However, the heat sink temperature in the counter flow pattern has 40% less temperature non-uniformity than parallel flow. Recently, Ansari and Kim [43] have explored, numerically, the performance of a double-layered heat sink under non-uniform heating conditions with a random hotspot for microprocessor cooling applications. However, the study showed the effect of the flow pattern without any comparison with a single layered heat sink.
Applying an MLM heat sink in a CPV cooling application requires attention due to the rapid temperature increase in the CPV module and the importance of solar cell temperature uniformity. Few studies have been found that apply this cooling technique in the CPV applications [45,46]. Al Siyabi et al. [45,47] have numerically conducted a thermal analysis using an MLM heat sink in a single solar cell receiver. They considered a non-uniform heat source for the MLM heat sink. The results show a significant temperature reduction of the solar cell when the number of layers increased from single layer to four-layers by 15 °C. In addition, the pressure drop decreased by more than 50% when using a four-layers heat sink and reduced the temperature non-uniformity of the solar cell.
As stated above, few studies investigated the MLM heat sink technique in CPV applications. The main objective of this study is to experimentally examine the behavior of the MLM heat sink integrated with CPV assembly. Therefore, experiments have been conducted to evaluate the thermal performance of an MLM heat sink for different numbers of layers, different heat transfer fluid (HTF) flow rates and heating power rates. A heat source of electrical resistance heater (ERH) has been considered to represent the CPV assembly. In addition, a numerical model has been developed to further analyze the heat sink behavior for measurements that cannot be obtained using the experimental approach.

2. Experimental Setup and Procedure

2.1. Test Loop

A schematic and a photograph of the experimental setup is shown in Figure 1. The experimental setup consists of a heat sink testing module, HTF circulation bath with a built-in pump (MultiTemp® III, Pharmacia Biotech AB, Uppsala, Sweden), a variable area glass flowmeter (NFX-1/4”-25-B, Nixon flowmeters, Cheltenham, UK), differential pressure meter (Digitron 2080P, Rototherm group, Swansea, UK), K-type thermocouples, data logger (Keithley 2700, Keithley Instruments, Inc., Cleveland, OH, USA) and a desktop computer. An HTF with constant flow rate and temperature is supplied using the circulation bath at a temperature of 24 °C. The HTF volume flow rate is measured using the variable area flowmeter and controlled using a built-in needle valve. The cold HTF picks up the heat from the MLM heat sink and passes to the circulation bath. K-type thermocouples are placed in the inlet, outlet and within the test module in different locations. The temperature is recorded with an interval of 10 s until the steady state is reached.

2.2. Test Module

The test module, illustrated in Figure 2, was designed to stack layers between one and four. The case was made of a transparent acrylic and consists of two pieces, top and bottom. Bolts were used to join the case pieces and to stand any forces. A rubber sealing was placed between the top and bottom parts to prevent any leakage issues. The HTF inlet and outlet ports were at the side of the case using an 8 mm diameter copper connector. The area in-between the inlet and the MLM entrance were kept to develop a uniform flow of the HTF. The HTF inlet and outlet temperatures were measured using a 1 mm K type thermocouple stainless steel, which was inserted just after the inlet and just before the outlet ports. The pressure drop across the MLM heat sink was captured using two pressure ports using the 8 mm copper connectors. A 0.5 mm K type thermocouple stainless steel was inserted in the middle channel of the first layer middle channel to measure the temperature at this location. Other thermocouple locations were distributed in the middle of the top surface of the heat source to capture the temperature uniformity.
A CPV assembly (3C44A, AZUR SPACE Solar Power GmbH, Heilbronn, Germany) is used in this study. The assembly consists of a triple junction (TP) solar cell of size 10 mm × 10 mm as shown in Figure 3a. As shown in Figure 3b, the CPV assembly is composed of a solar cell located under a conductive layer made of copper. For the electrical insulation, a ceramic layer was placed under the copper layer. Finally, the full arrangement was placed in a second copper layer for thermal conduction purposes. The assembly also consisted of two by-pass diodes and two electrical terminals. As pointed out, this study was dealing with thermal behavior of the MLM heat sink in cooling the CPV and, for simplicity, the solar cell in the CPV assembly was replaced by the electrical resistance heater (ERH) (PWR263S-35, Bourns, Inc., Bedford, UK) to simulate the heat load generated by the CPV. Therefore, the solar cell was removed by placing the CPV assembly on a preheated hot plate. Then, the solar cell was pulled and the ERH was placed in the same location. The ERH power rating was 30 W rating of a size of 10 × 10 mm and was operated using a DC power supply.
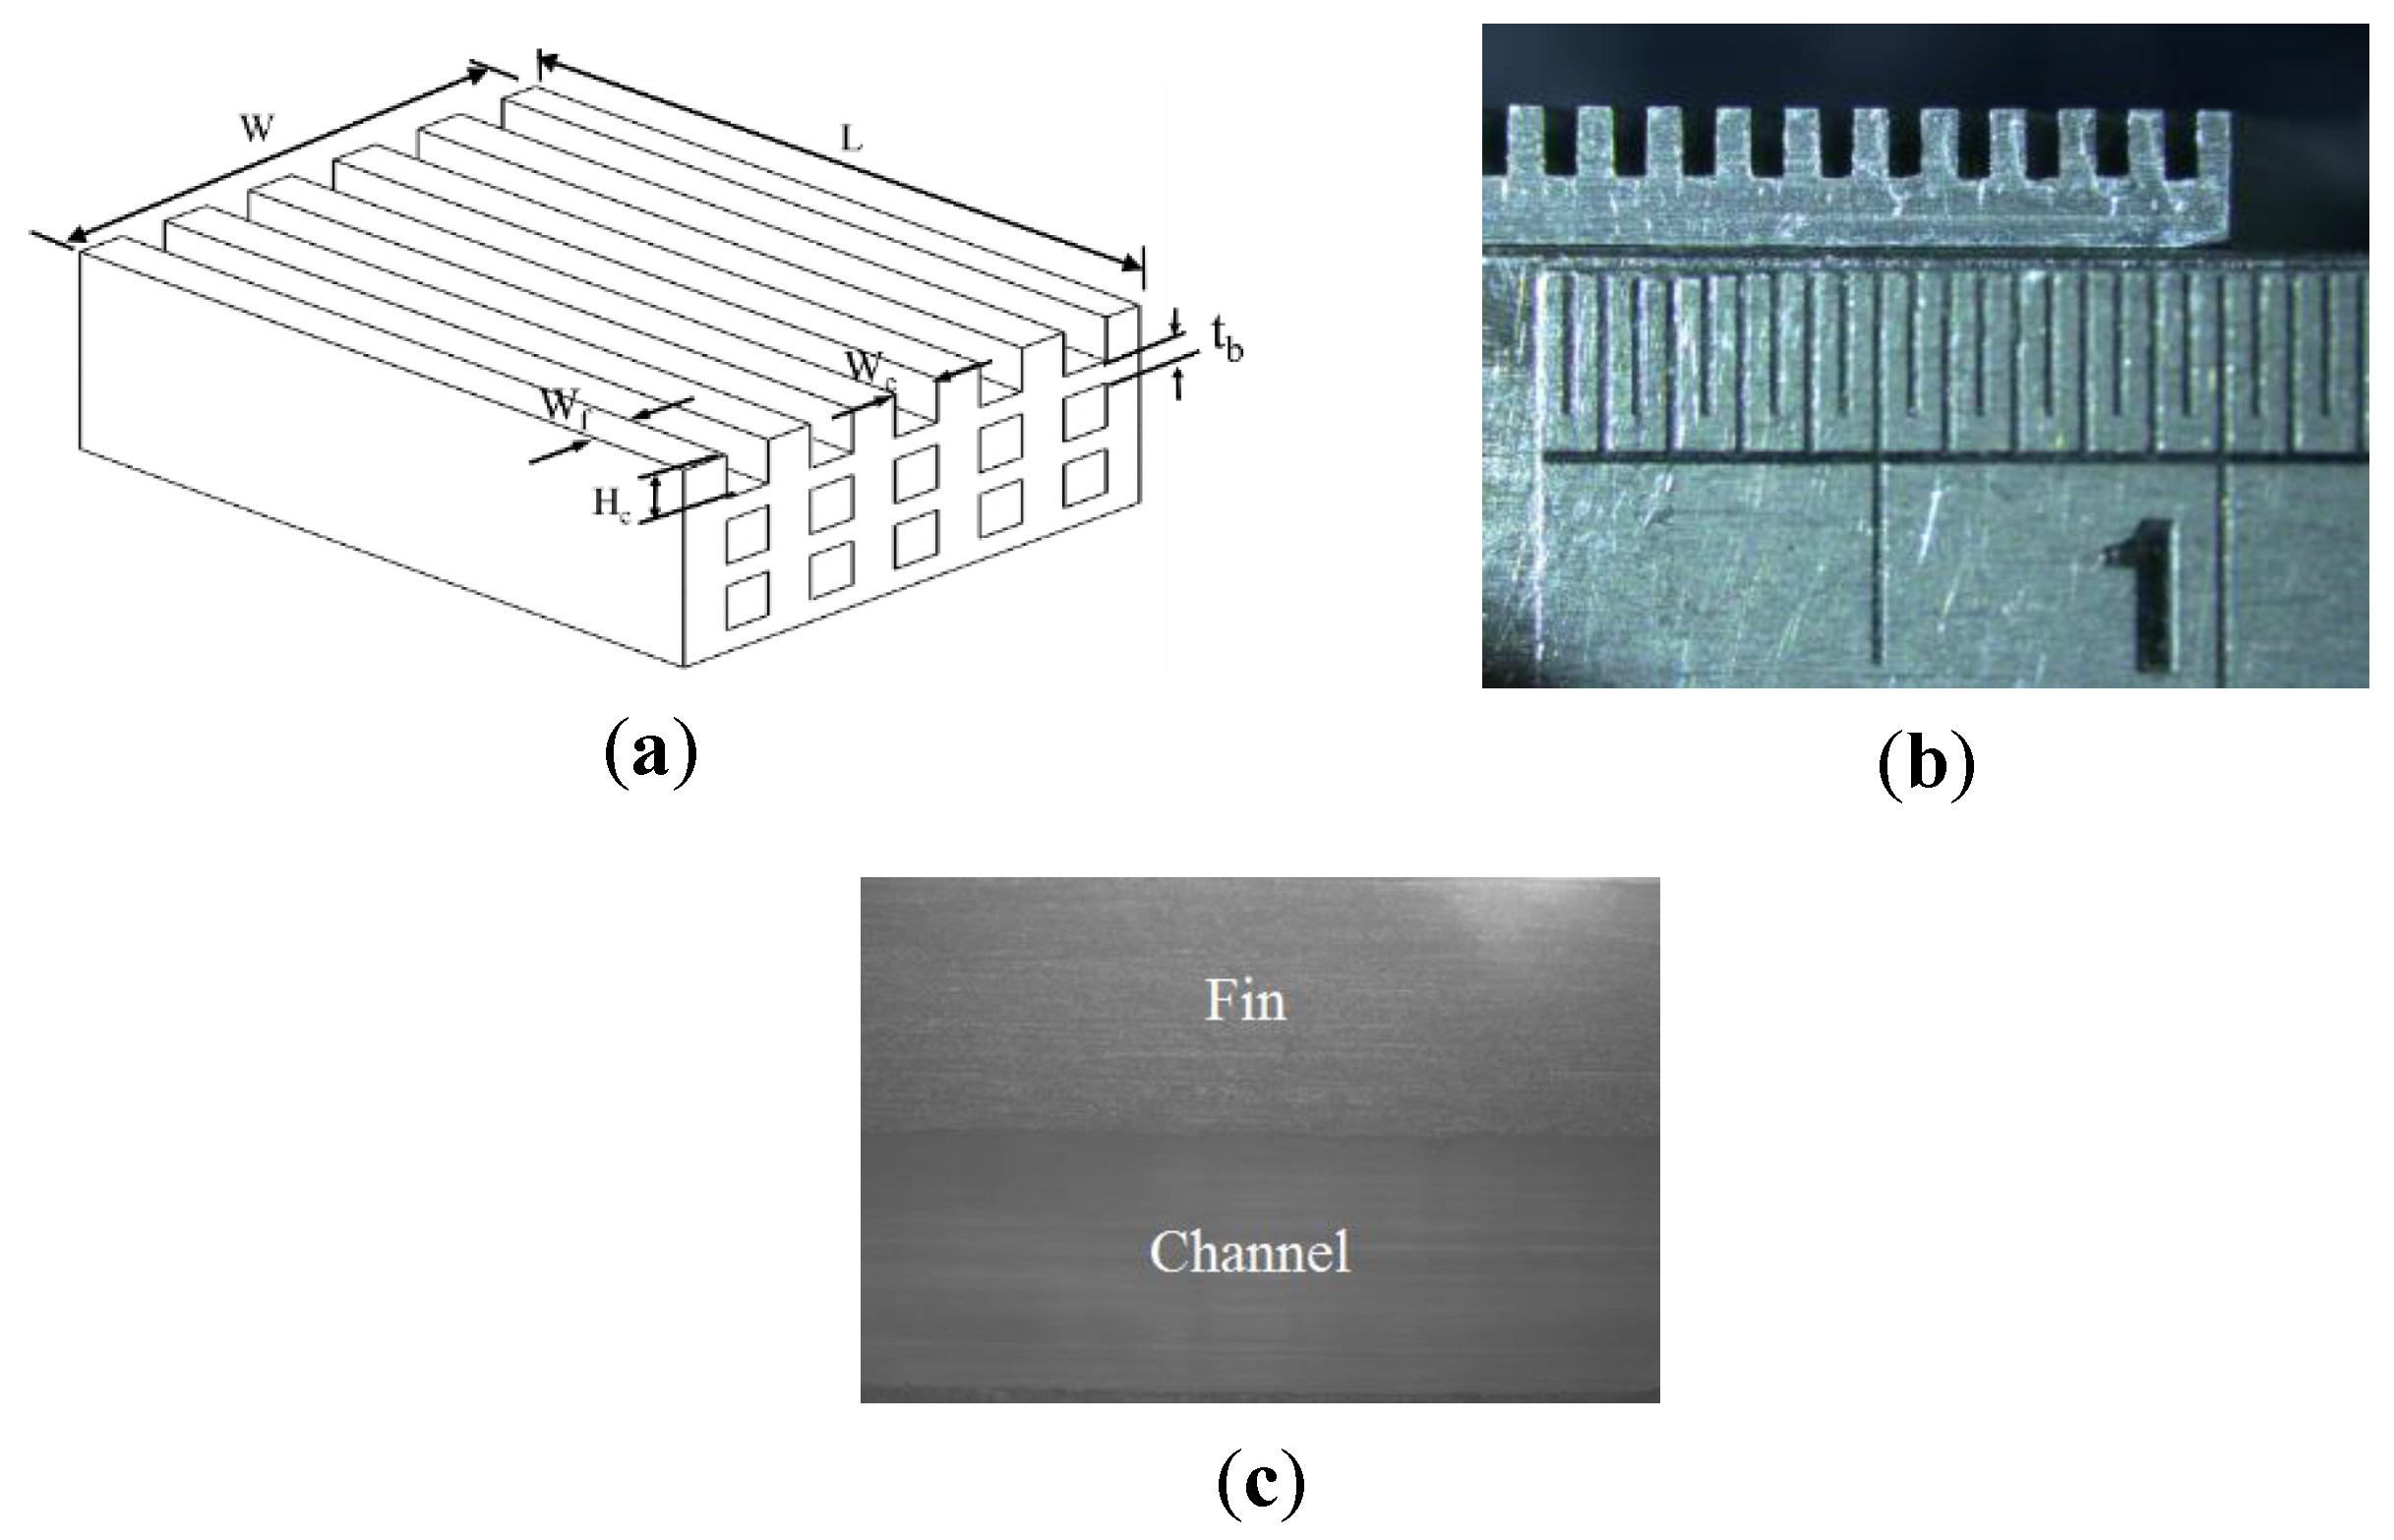
The microchannel plates were made from aluminum and the width (W) and length (L) were 32 × 30 mm, respectively. The other microchannel dimensions are shown in Figure 4a and Table 2. Micro-sawing technique was used to fabricate the rectangular channels machining. Micro-sawing is a low cost microchannel fabrication method and offers a better surface finish compared to other techniques [48]. A scan microscope was used to inspect the channels’ shape and to ensure that the sides of the channels are straight and within the accuracy range. As can be seen in Figure 4b, the verticality of the walls was properly achieved, and no significant inclination is visible. Moreover, the bottom surfaces of the channels are relatively smooth.

2.3. Test Procedures and Uncertainty Analysis

A typical test run was started when the test module was assembled and all instruments were connected. The modified CPV assembly was attached to the top layer of the heat sink and a thin layer of silicone thermal transfer paste was applied for better thermal conductivity between the two plates. Water was used here as HTF throughout all experiments. Before starting any test, water was circulated from the right to left direction at a temperature of 24 °C and to the desired flow rate for 1 h to ensure the temperature of the heat sink was uniform and at its initial conditions, and also to remove the trapped air bubbles from the loop. Throughout the experiments, the water inlet temperature was allowed to vary between 24.1 and 23.9 °C. The experiments were started by switching on the DC power supply and the data logger. Then, the experiment was monitored for reaching the temperature steady state condition. The steady state was achieved when the temperature variations in all thermocouple measurement were less than 0.1 °C. The pressure drop measurements were recorded manually.
A list of controlling parameters are shown in Table 3. It shows that the number of the stacked layers in the heat sink is varied from one to four layers. For a fixed layer, the heating power is varied in a range between 5 and 30 W and the HTF flow rate varied from 30 to 60 mL/min.
The volume flow measurements were verified manually using a conventional glass water column and stop watch method. Table 4 shows the measurements variations between the two methods. In addition, the mass flow rate was measured using a weight scale. The table shows the maximum variation between the flow meter and the water column of 3.33%.
Two structures of thermocouples were used; a wired and a prop type thermocouple base on the measuring location. The prop thermocouples type was used to measure the temperature of fluid flowing inside the tubes, the inlet and the outlet temperature at the test section. The tip of the thermocouple was the place of taking measurements and this was ensured to be in full contact with the fluid. The calibrated props type thermocouples for the inline fluid flow temperature measurements in the HTF inlet and outlet temperature in the heat sink and the middle microchannel temperature was allowed to be permanently fixed in its locations for all experiments.
Wire thermocouples were produced from a roll of thermocouple to be cut according to the desired length. The tips of the thermocouples were made on our own using a thermocouple welder using the L60 thermocouple welder. Three important factors affected the measurements accuracy while making the tips of the thermocouples; the tip length, perfect connection and free of any oxide particles. Therefore, the tips were made as short as possible. Visual inspection using an eye magnifier was used to check the tips’ perfection and if it was free from any oxide particles. A voltmeter was used to check the connection of the thermocouples. The thermocouples and the data acquisition system were calibrated using two points of temperatures; boiling water and liquid-ice water mixture against a precision mercury thermometer to an uncertainty of ±0.1 °C.
The power dissipation by the ERH was determined from the product of the voltage and current measured at the electrical terminals. The measured voltage and current ranged between 8 and 21.5 volts and current of ranged between 570 and 1450 mA, respectively. Uncertainties for direct voltage measurement were negligible due to the low voltage drop between the measured terminals. In this experiment, voltage input for the heaters were measured across the ERH and the current meter with 0.1 Ω shunt resistance. For the current settings we had, this caused 0.1 volts loss in the actual ERH. For a 21.5 volts case, this results in ±0.46% uncertainty in voltage measurement. As per the product manual, the current measurement has an uncertainty of ±0.1%. These uncertainties caused a ±0.56% in power input measurement.

3. Numerical Study

The MLM heat sink was taken further to be analyzed numerically for better understanding of the heat sink thermal performance. COMSOL Multiphysics (version 5.2 COMSOL Inc., Stockholm, Sweden) was used to simulate the model using the equations of conservation of mass, momentum and energy for single-phase laminar flow [49].

3.1. Model Description and Mathematical Formulation

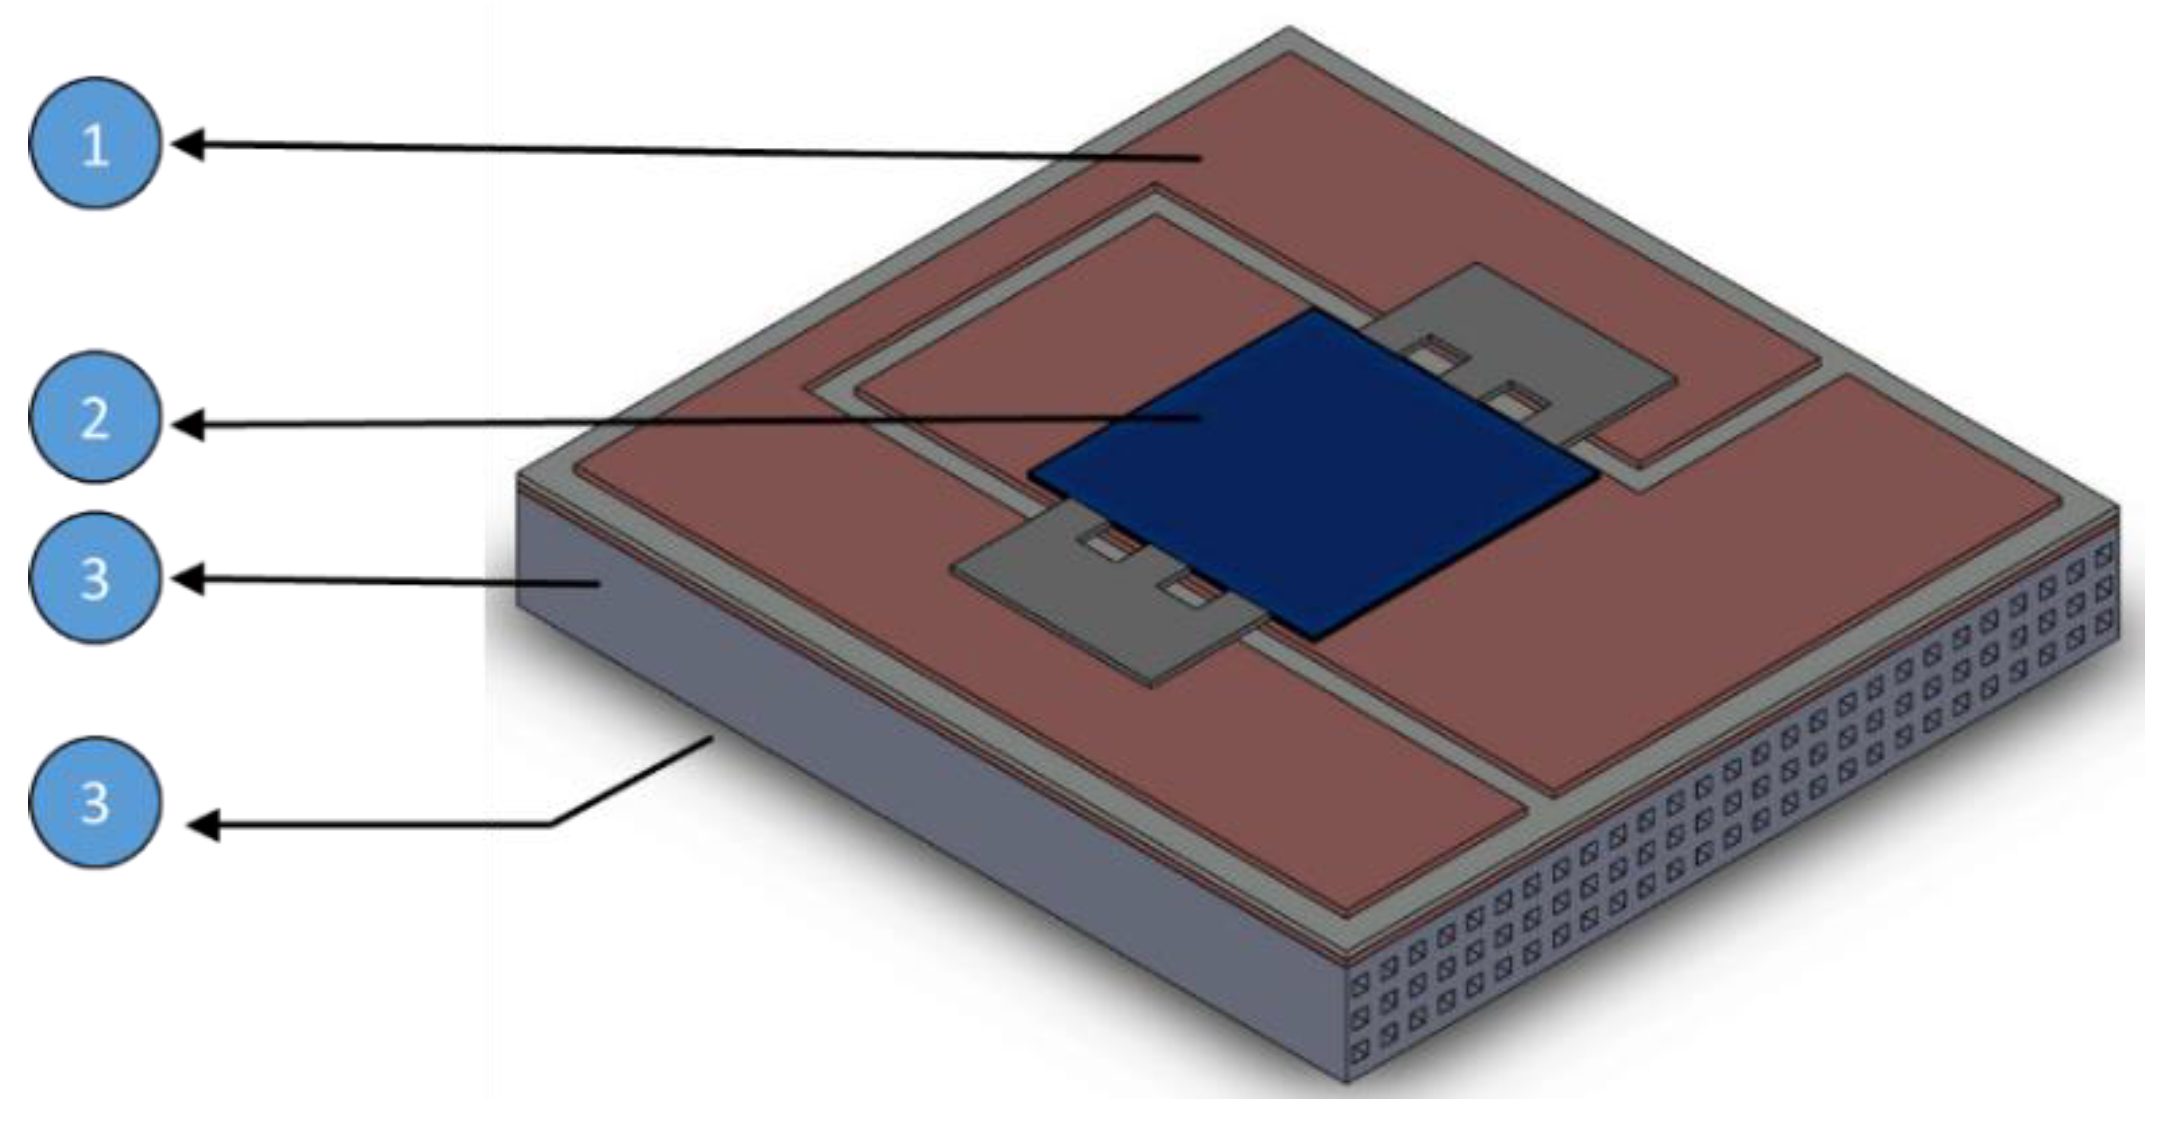
The modeled system is illustrated in Figure 5. The CPV solar cell was replaced by the ERH. Table 5 shows the CPV assembly dimensions, thickness and materials [10]. The two by-pass diodes and two electrical terminals were not considered in the model for simplicity.
The thermal boundary conditions of the studied model are shown in Figure 6 and listed in Table 6. As can be seen that the top surfaces of the assembly are exposed to the ambient temperature at a heat transfer coefficient of 15 W/m2K. The ERH is assumed to be a heat source object. The surfaces at the bottom and sides are assumed to be thermally insulated. Additionally, the following assumptions were considered:
  • The heat source is uniform.
  • The ambient temperature is 25 °C.
  • Water is used as the HTF and its properties varies with temperature [50,51]. The water inlet temperature is 24 °C.
  • HTF varies between 30 and 60 mL/min which corresponds to a low Reynolds numbers. The flow is assumed to be steady, laminar and fully developed in each channel.
The simulations were conducted in steady state study conditions. The electrical power (Qele) supplied to the ERH was assumed to be converted to heat and was calculated by [10]:
Q t h = Q e l e = V · I .
All the top surfaces of the copper plate and the heat source surfaces release heat to the outer environment using natural convection mode and its heat transfer rate (qconv) is represented by:
q c o n v = h · A · Δ · T ,
where h is the convection heat transfer coefficient (W/m2K), A is the surface area exposed to the outer environment (m2) and ∆T is the temperature difference between the object surface and the outer environment (K). In addition, the heat is transferred to the environment using radiation mode and its transfer rate (W) is expressed by [52]:
q r a d = ε · σ · A · ( T a m b 4 T s u r 4 ) ,
where ε is the emissivity of the materials, σ is Stefan-Boltzmann constant, A is the radiated surface area, Tsurf is the surface area and Tamb is the ambient temperature. The coolant fluid flows through the channels at mass flow rate (kg/s).
The governing equations for this 3-D conjugated heat transfer are as following [33,34]:
Continuity equation for the HTF:
u x + v y + w z = 0 ,
where u , v and w are the velocity components in the x, y and z directions, respectively. Momentum equation for the HTF:
ρ f ( u u x + v u y + w u z ) = p x + μ f ( 2 u x 2 + 2 u y 2 + 2 u z 2 ) ,
ρ f ( u v x + v v y + w v z ) = p y + μ f ( 2 v x 2 + 2 v y 2 + 2 v z 2 ) ,
ρ f ( u w x + v w y + w w z ) = p z + μ f ( 2 w x 2 + 2 w y 2 + 2 w z 2 ) ,
where p is the HTF pressure, ρ f and μ f are the density and dynamic viscosity of the HTF, respectively, and velocity components in the x, y and z directions, respectively. The energy equation for the HTF:
ρ f C p , f ( u T f x + v T f y + w T f z ) = k f ( 2 T f x 2 + 2 T f y 2 + 2 T f z 2 ) ,
where T f , C p , f and k f are the temperature, specific heat and thermal conductivity of the HTF, respectively. The energy equation for the solid domain:
0 = k s ( 2 T s x 2 + 2 T s y 2 + 2 T s z 2 ) ,
where T s and k s are the temperature and thermal conductivity of the solid domain. The associated boundary conditions for the governing equations for the channels in all surfaces as follows:
HTF inlet:
u x = 0 = u i n ,    v x = 0 = 0 ,    w x = 0 = 0 ,    T x = 0 = T i n .
HTF outlet:
p x = l x = p a t m .
HTF-solid interface:
u = v = w = 0 ,    T f = T s ,    T f = T s ,    k e f f T f n = k s T s n .
The correlations of the HTF density ( ρ f ) , specific heat ( C p , f ) , thermal conductivity ( k f ) , and dynamic viscosity ( u f ) , as functions of HTF temperature are described as follows [43,51]:
ρ f ( T f ) = 838.46 + 1.40 T f 3.01 × 10 3 T f 2 + 3.71 × 10 7 T f 3 ,
C p , f ( T f ) = 12010.14 80.40 T f + 30.98 × 10 2 T f 2 5.38 × 10 4 T f 3 + 3.62 × 10 7 T f 4 ,
k f ( T f ) = 86.90 × 10 2 + 8.94 × 10 2 T f 1.58 × 10 5 T f 2 + 7.97 × 10 9 T f 3 ,
u f ( T f ) = 1.37 21.22 × 10 3   T f + 1.36 × 10 4   T f 2 4.64 × 10 7   T f 3 + 8.90 × 10 10   T f 4 9.07 × 10 13   T f 5 + 3.84 × 10 16   T f 6 ,
where, T f is the temperature in Kelvin (K).
As mentioned earlier, the electrical performance of solar cell is dependent on its temperature. Therefore, the temperature measurement of heat source (ERH) represents an important parameter. The total amount of heat absorbed by water (Qout) in the MLM heat sink is found by
Q o u t = m ˙ · C p · ( T o u t T i n )
where, m ˙ is the HTF mass flow rate which is found by m ˙ = ρ · V ˙ , Cp is the specific heat of the HTF, T i n and T o u t are water inlet and outlet temperature, respectively. Therefore, the total heat lost to the environment Q l o s s is found by
Q l o s s = Q t h Q o u t .
Thermal resistance of the heat sink is another important parameter to quantify the thermal performance of the heat sinks. The total thermal resistance ( R t o t ) of the heat sink is the ratio between the maximum temperature difference and the heat source flux and calculated by:
R t o t = Δ T m a x q A s ,
where ∆Tmax is the temperature difference between the maximum surface temperature of the ERH ( T s , m a x ) and the temperature of water at the inlet ( T f , i n ) q is the heat flux per unit area, As is the heat sink surface area. The temperature uniformity within the heat source is measured using the on-chip thermal resistance ( R c h i p ) and is calculated by [13]:
R c h i p = T j , m a x T j , m i n q A s ,
where T j , m a x and T j , m i n are the maximum and the minimum temperatures within the heat source, respectively. Water pressure drop across the heat sink is another criteria to evaluate the heat sink in terms of the fluid flow as this is used to determine the required power to pump the coolant [41]. The pumping power (P) is calculated by
P = V ˙ · Δ p η p ,
where V ˙ is the volume flow rate, Δ p is the difference between the inlet pressure p i n and the outlet pressure p o u t and η p is the pump efficiency. The Reynolds number is used to characterize the flow inside the microchannel and is calculated by
R e = ρ · D h · V a v g μ ,
where ρ and μ are the density and viscosity of the fluid respectively and are evaluated at the mean water temperature [17]. V a v g is the average velocity of the fluid and is calculated by
V a v g = V ˙ N c · A c ,
where, N c is the total number of channels in the heat sink, and A c is the microchannel cross-sectional area. The average heat transfer coefficient by convection is calculated by [19]:
h a v g = m ˙ · C p · ( T o u t T i n ) A · ( T s T f ) .
The Nusselt number (Nu) is calculated by [53]:
N u a v g = h a v g · D h k ,
where D h is the hydraulic diameter and k is the fluid thermal conductivity.

3.2. Grid Independence Study

The computational domain was meshed using a free tetrahedral grid system. Different mesh sizes were used to the model in order to confirm that the solution is independent of the size of the mesh for each case. Table 7 shows the variation of the maximum heat source temperature and HTF outlet temperature with the number of elements (NoE). The number of elements was varied between 560,765 and 1,669,580. The maximum heat source temperature remained unchanged for the number of elements between 1,510,497 and 1,669,580. On the other hand, it no change of the HTF outlet temperature was noticed when using the NoE between 879,992 and 1,669,580. Therefore, the mesh of NoE with 1,510,497 was selected for numerical analysis.

3.3. Model Validation

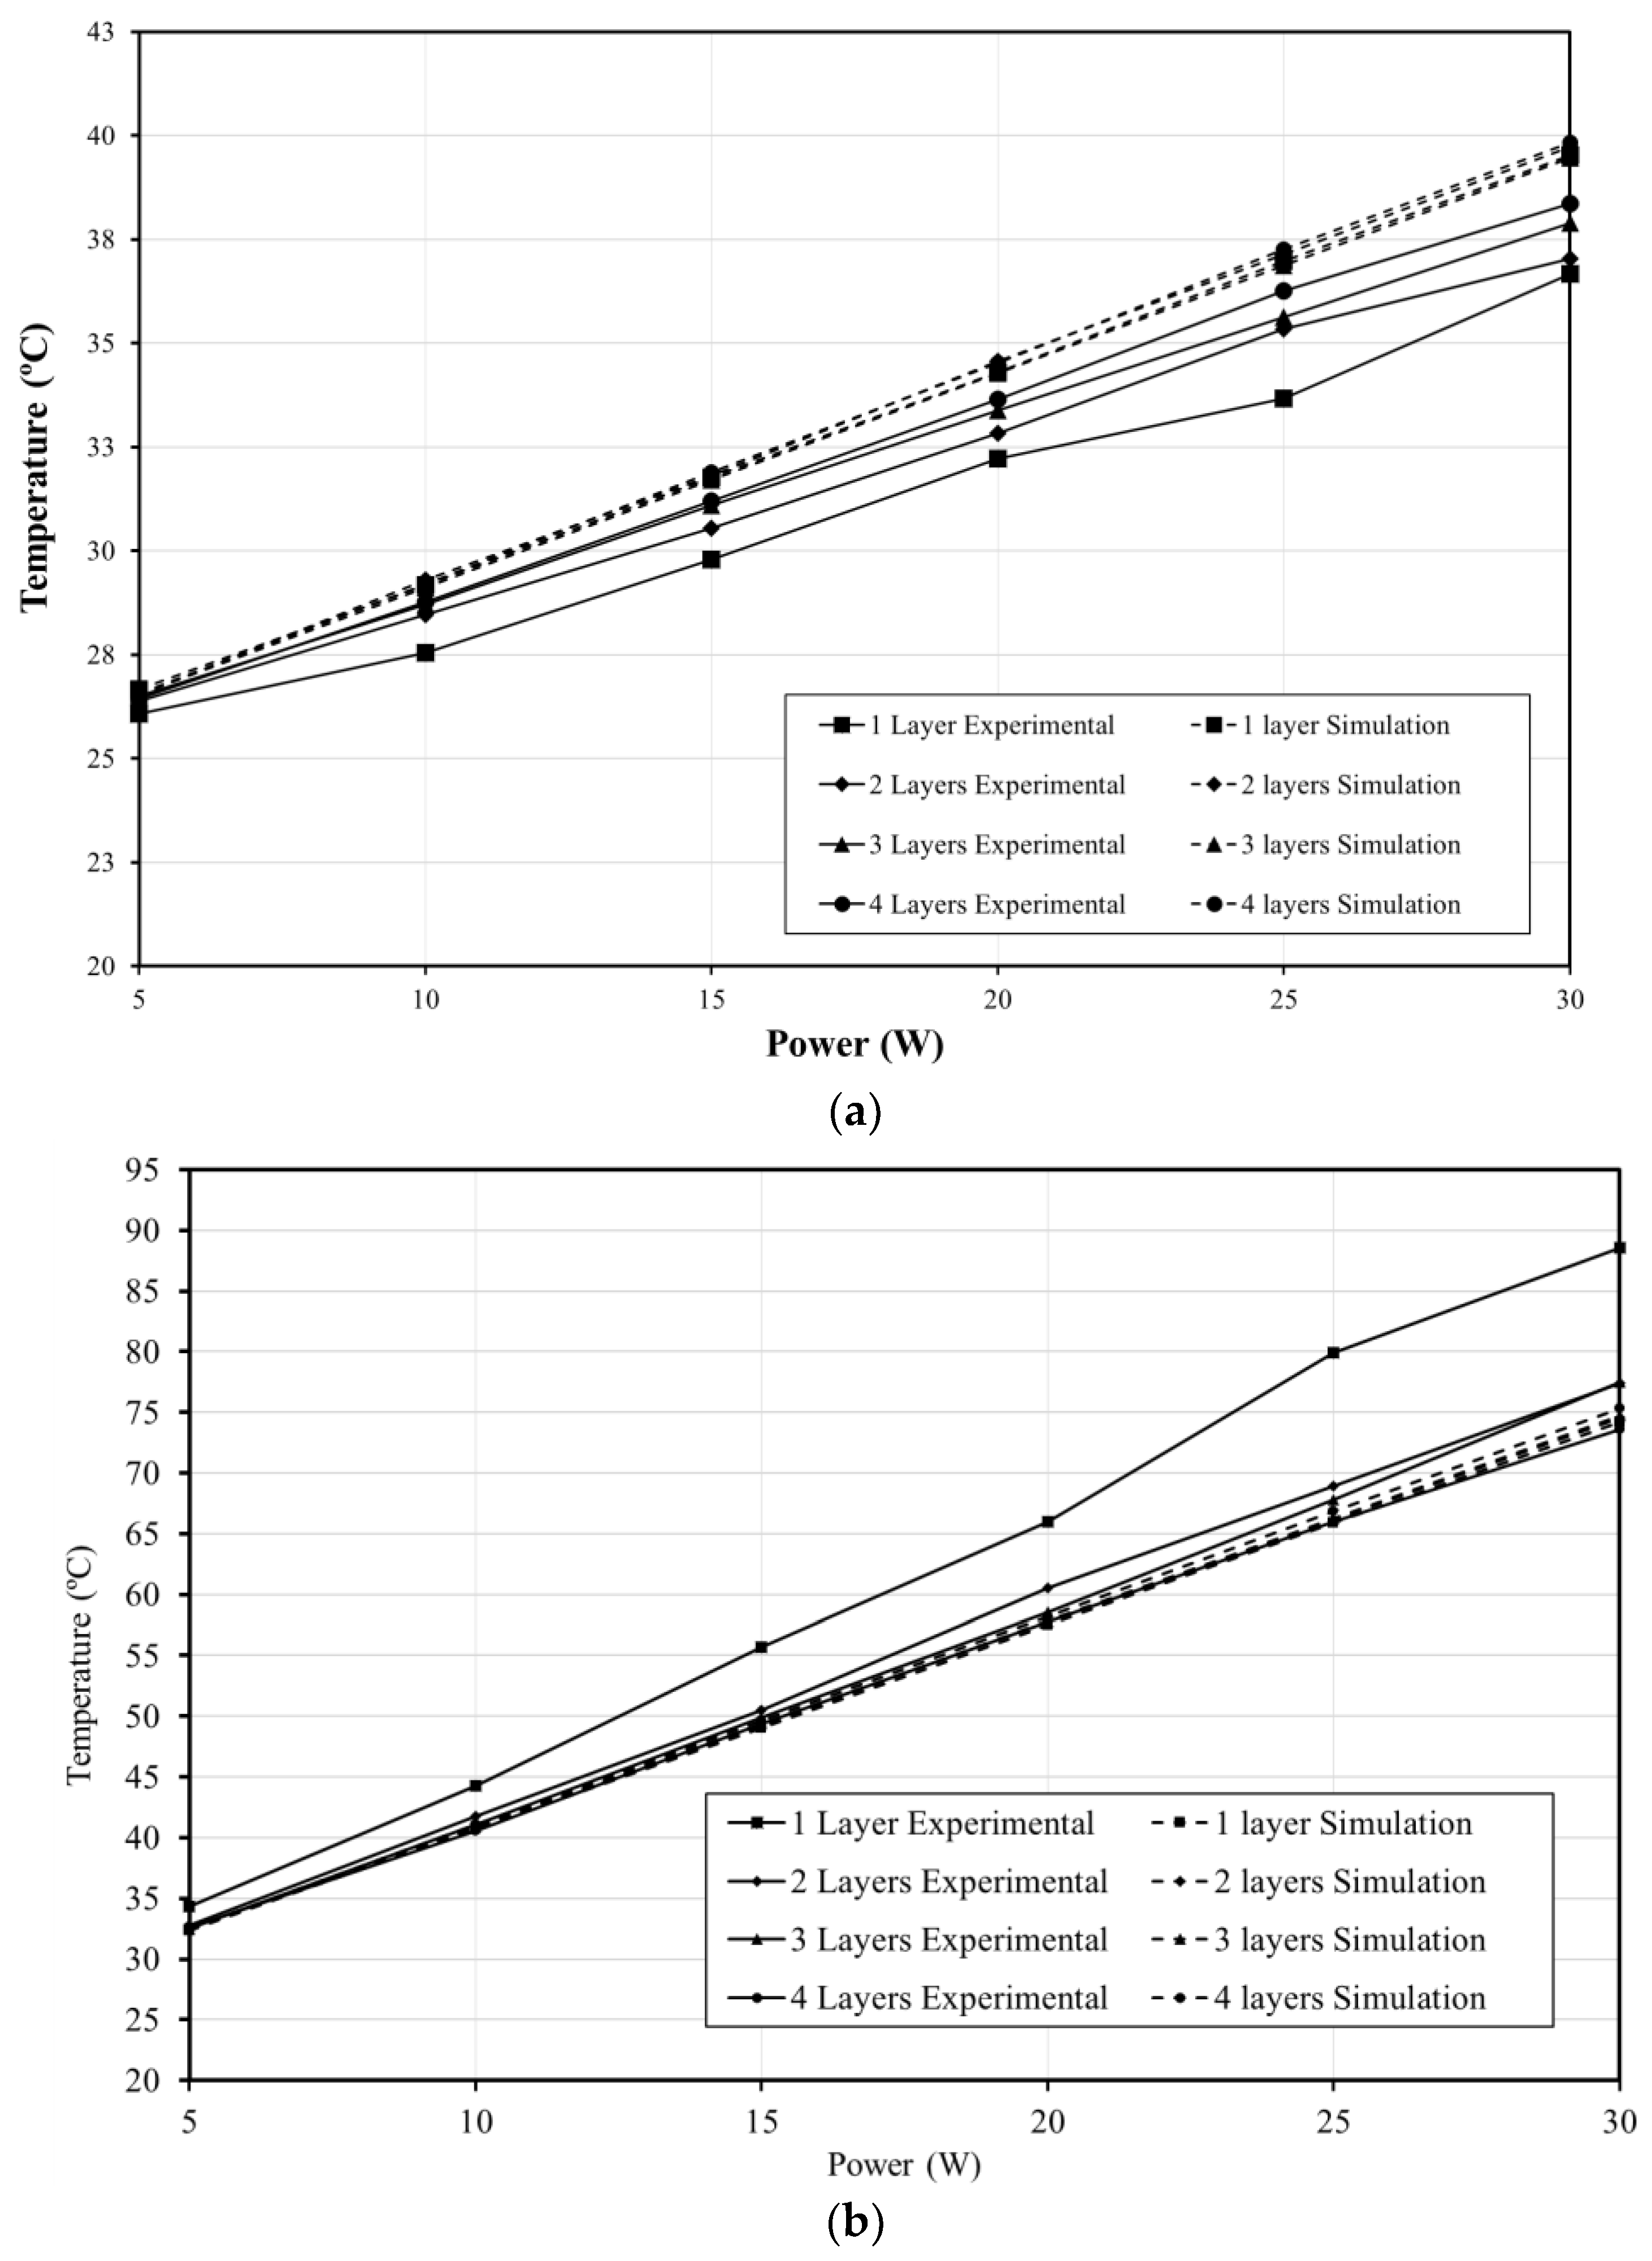
The CFD model was validated using experimental results of the same parameters. The HTF outlet temperature and the resistor temperature for the heat source was used for the validation for all the layers arrangements and of heat powers ranging from 5 to 30 W. Figure 7 compares the experimental and simulation of the heat source and HTF outlet temperatures for a heat sink layers ranging between one and four-layers and of a HTF volume flow rate of 30 mL/min and HTF inlet temperature of 24 °C. The average difference between the numerical and experimental of the HTF outlet temperature is 1.25 °C and a maximum difference of 3.30 °C occurred at 25 W of the three-layers MLM heat sink. However, a more average difference of the heat source temperature between the numerical and experimental is found of 2.58 °C. This shows a good estimation of the numerical model and will be used to explore the thermal characteristics of the system.

4. Results and Discussion

4.1. Effects of Number of Layers

The effect of number of layers on the performance of the MLM heat sink is investigated in this section for a variable number of layers ranging between one and four. Figure 8 shows the thermal resistance of the MLM heat sink and heat source surface temperature for different numbers of layers of a HTF flow rate of 30 mL/min and 15 W power rate. The thermal resistance decreases by 17% as the number of layers increases from one-layer to two-layers. However, a slight decrease of the thermal resistance of 2% is noticed when the number of layers increased to three-layers and four-layers. In addition, the figure shows the heat source surface temperature for the various number of layers arrangement. The temperature decreases as the number of layers increases from one-layer to two-layers by 5.21 °C and less temperature reduction is noticed when increasing the number of layers from three to four.
Further investigation on the temperature uniformity on the heat source top surface temperature was conducted. Figure 9 shows the measured temperature distributions of the surface of the heat source in nine sections for the different number of layers heat sinks. The results show that the average and the standard deviation of the measured temperatures decreases as the number of layers decreases. It can be clearly noticed that the center of the heat source (section 1) suffers the maximum temperature of all the other sections and a wide difference between this temperature and the other locations within the heat source of a maximum difference of 12.01 °C in the two-layers MLM heat sink. This temperature difference causes an increase of temperature non-uniformity across the heat source surface and hence the standard deviation. Despite the maximum temperature value (section 1), the single layer MLM heat sink is considered to be the most temperature variable around the heat source (sections 2–9) with a standard deviation of 4.30 °C. Interestingly, two-layers MLM heat sinks experiences less temperature non-uniformity compared to the three-layers MLM heat sink with a standard deviation of 3.86 and 4.05 °C, respectively.
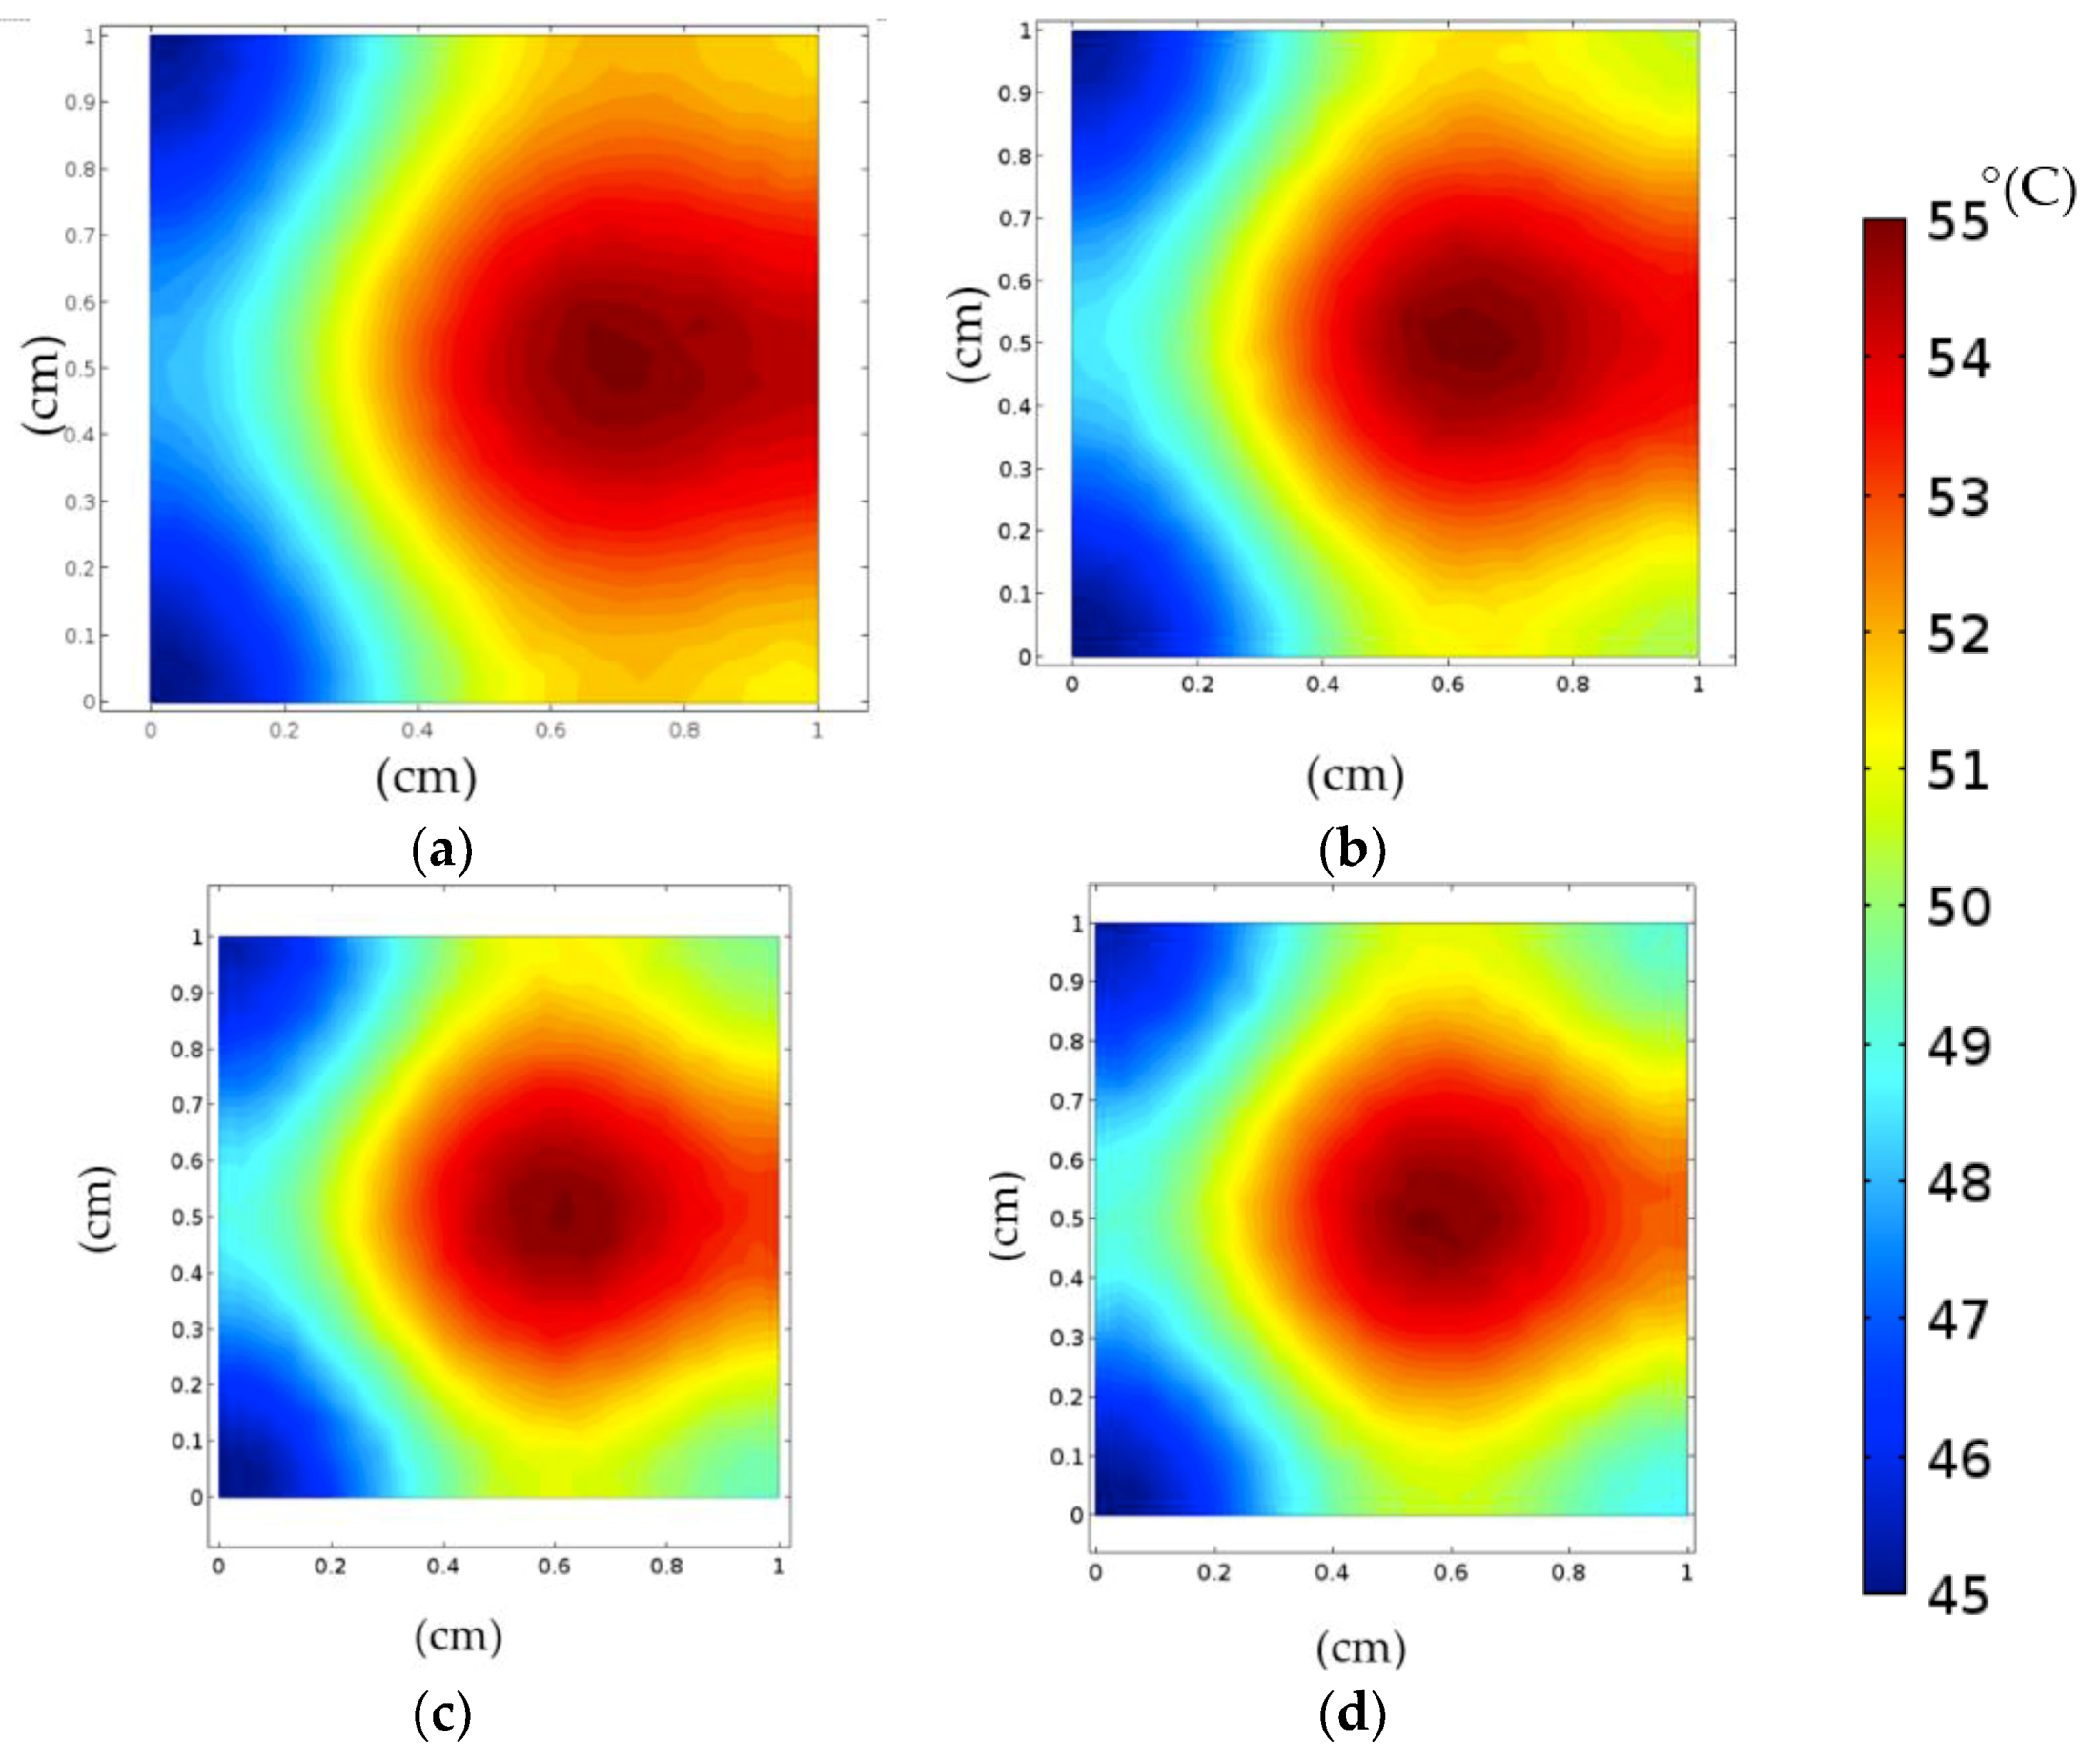
A close look into the temperature distribution across the heat source surface was obtained using the contour representation from the numerical solution and is shown in Figure 10. It can be noticed that the hot spot shifted to the center of the heat source as the number of layers increases. In addition, the temperature distribution of the heat source edge near to the downstream becomes more uniform as the number of layers increased. There is little visible difference between the three-layers and four-layers heat sinks in terms of the hot spot distribution and the temperature uniformity.
An isotherm of the full heat sink module for the different layer heat sinks is shown in Figure 11. It can be noticed that less temperature is experienced by the microchannel plates especially at the edges. This implies an opportunity of using the MLM heat sink in the CPV applications by decreasing the CPV receiver assembly to a smaller size so that fewer heat sinks materials are used and less fluid flow.
The thermal efficiency of the MLM heat sink and the HTF outlet temperature are shown in Figure 12. As seen from the figure, the thermal efficiency has been improved significantly by 20% when the number of layers increases from one- to three-layers. This is due to the increase of the HTF outlet temperature from 29.7 to 31.1 °C for the one-layer and three-layers MLM heat sinks, respectively. However, no effect on the thermal efficiency and the HTF outlet temperature was noticed when the number of layers increased from three- to four-layers.
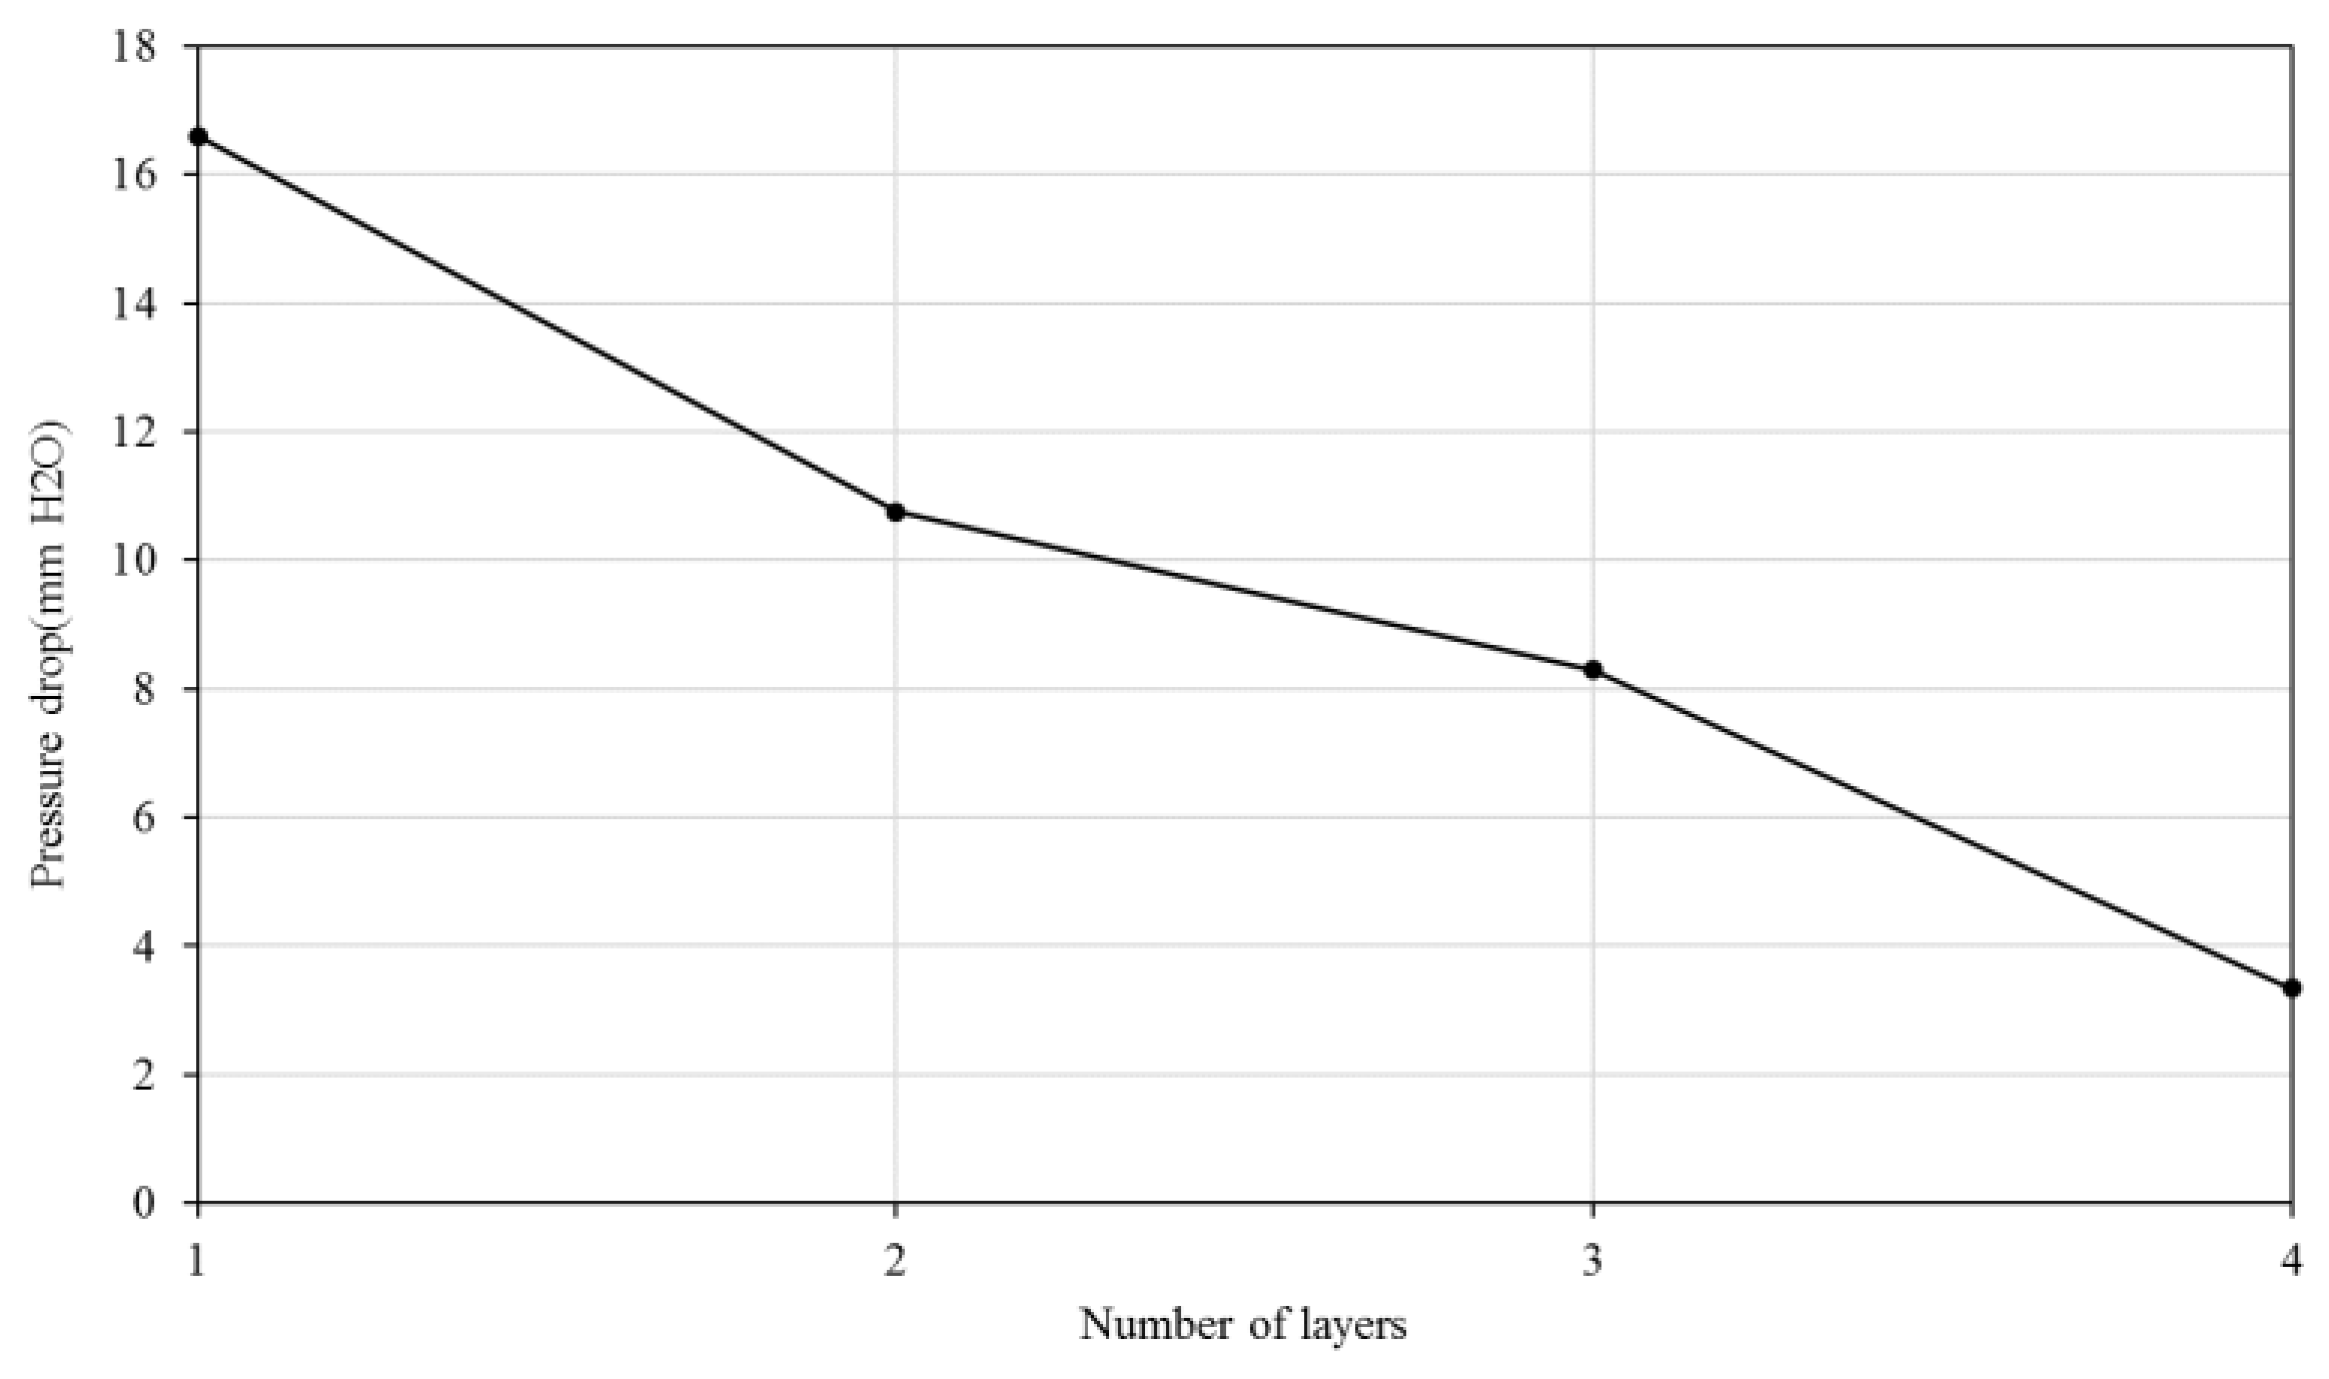
The hydrodynamic characteristics are as important as the thermal performance in evaluating the effect of the number of layers in the MLM heat sink. Pressure drop across the heat sink is one of the characteristics that effects the pumping power. Figure 13 shows the effect of layers in the pressure drop. It can be noticed that the pressure drop decreased as the number of layers increased. An approximate 39.22 Pa pressure drop reduction occurred with the increase of each layer, where the pressure for the MLM heat sink of one-layer and three-layers are 162.79 and 81.30 Pa, respectively.

4.2. Effects of Power Rates

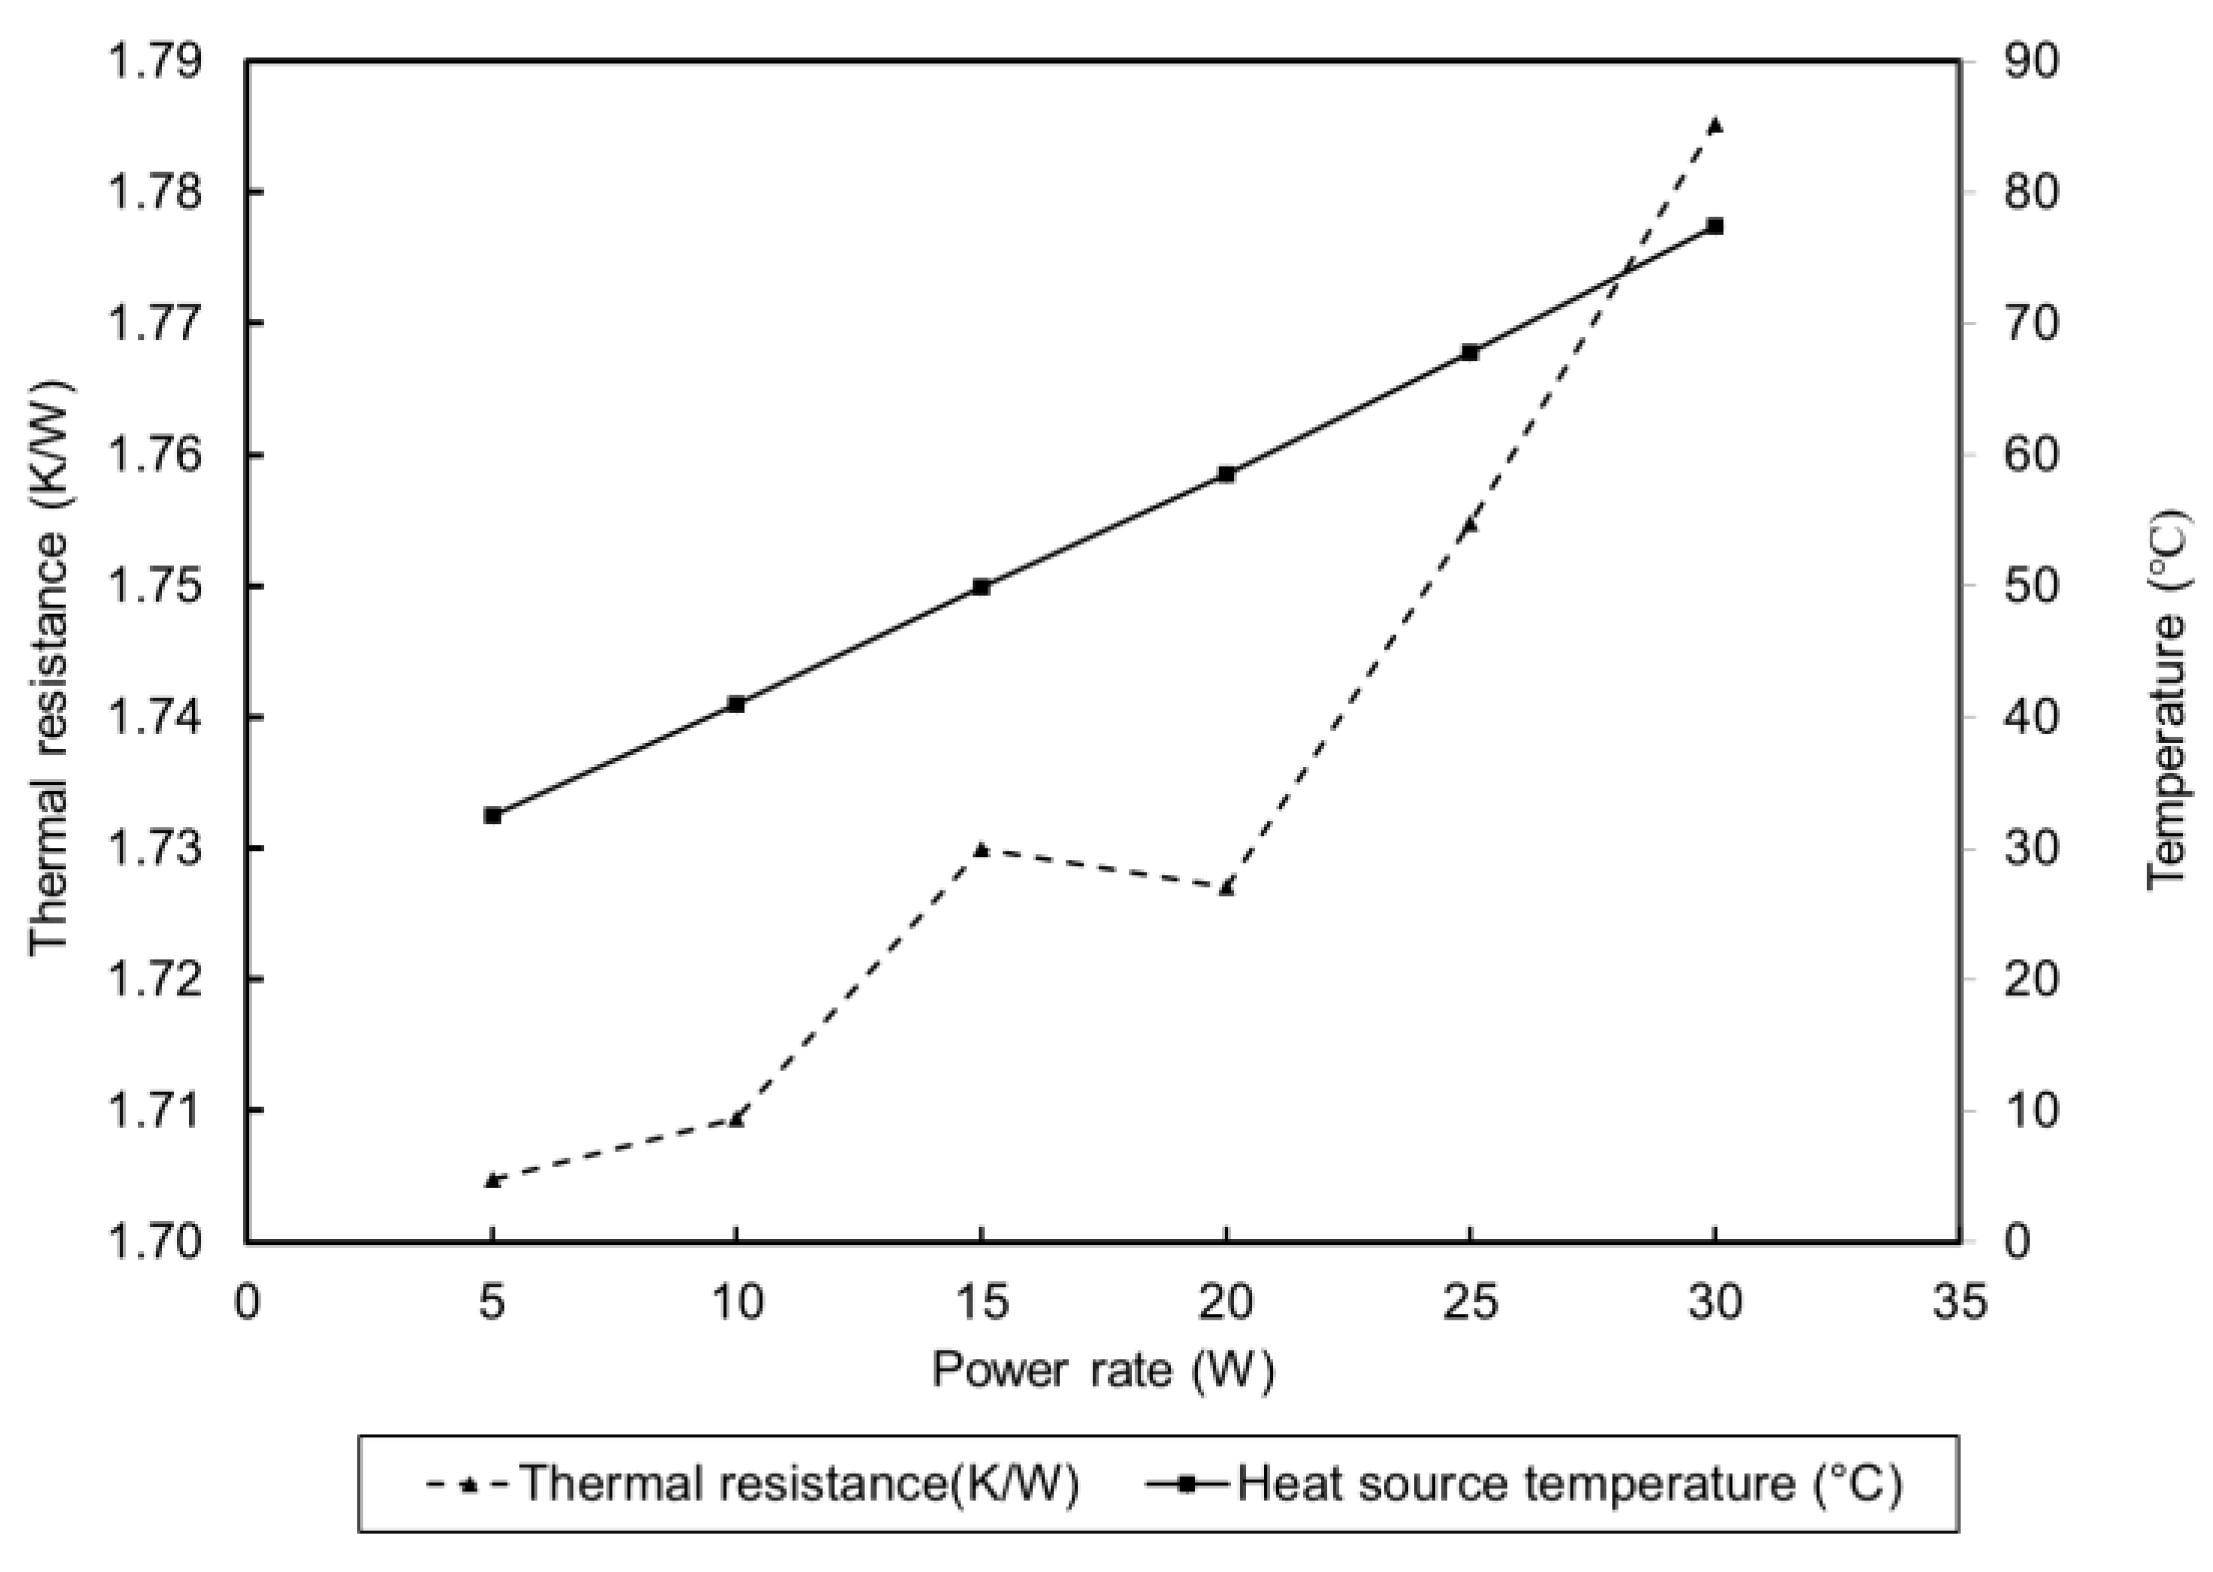
Total thermal resistances for different power input rate for the three-layers MLM heat sink with 30 mL/min flow rate are shown in Figure 14. As can see from the figure, the total thermal resistance of the heat sink increases slightly with increasing the power rate from 5 to 30 W for the same HTF flow rate of a difference of 0.08 K/W. This shows the ability of the heat sink to undertake a wide range of power rates with a slight change in the thermal resistance.
As expected, the heat source temperature increases significantly as heat source power rate increases from 5 to 30 W for the same HTF flow rate. The temperature of the heat source is doubled when the power rate increases from 5 to 30 W, with a difference of 45 °C. However, the heat source temperature on the worst case at 30 W is 77.48 °C, which is within the recommended temperature of the solar cell manufacturer (80 °C).
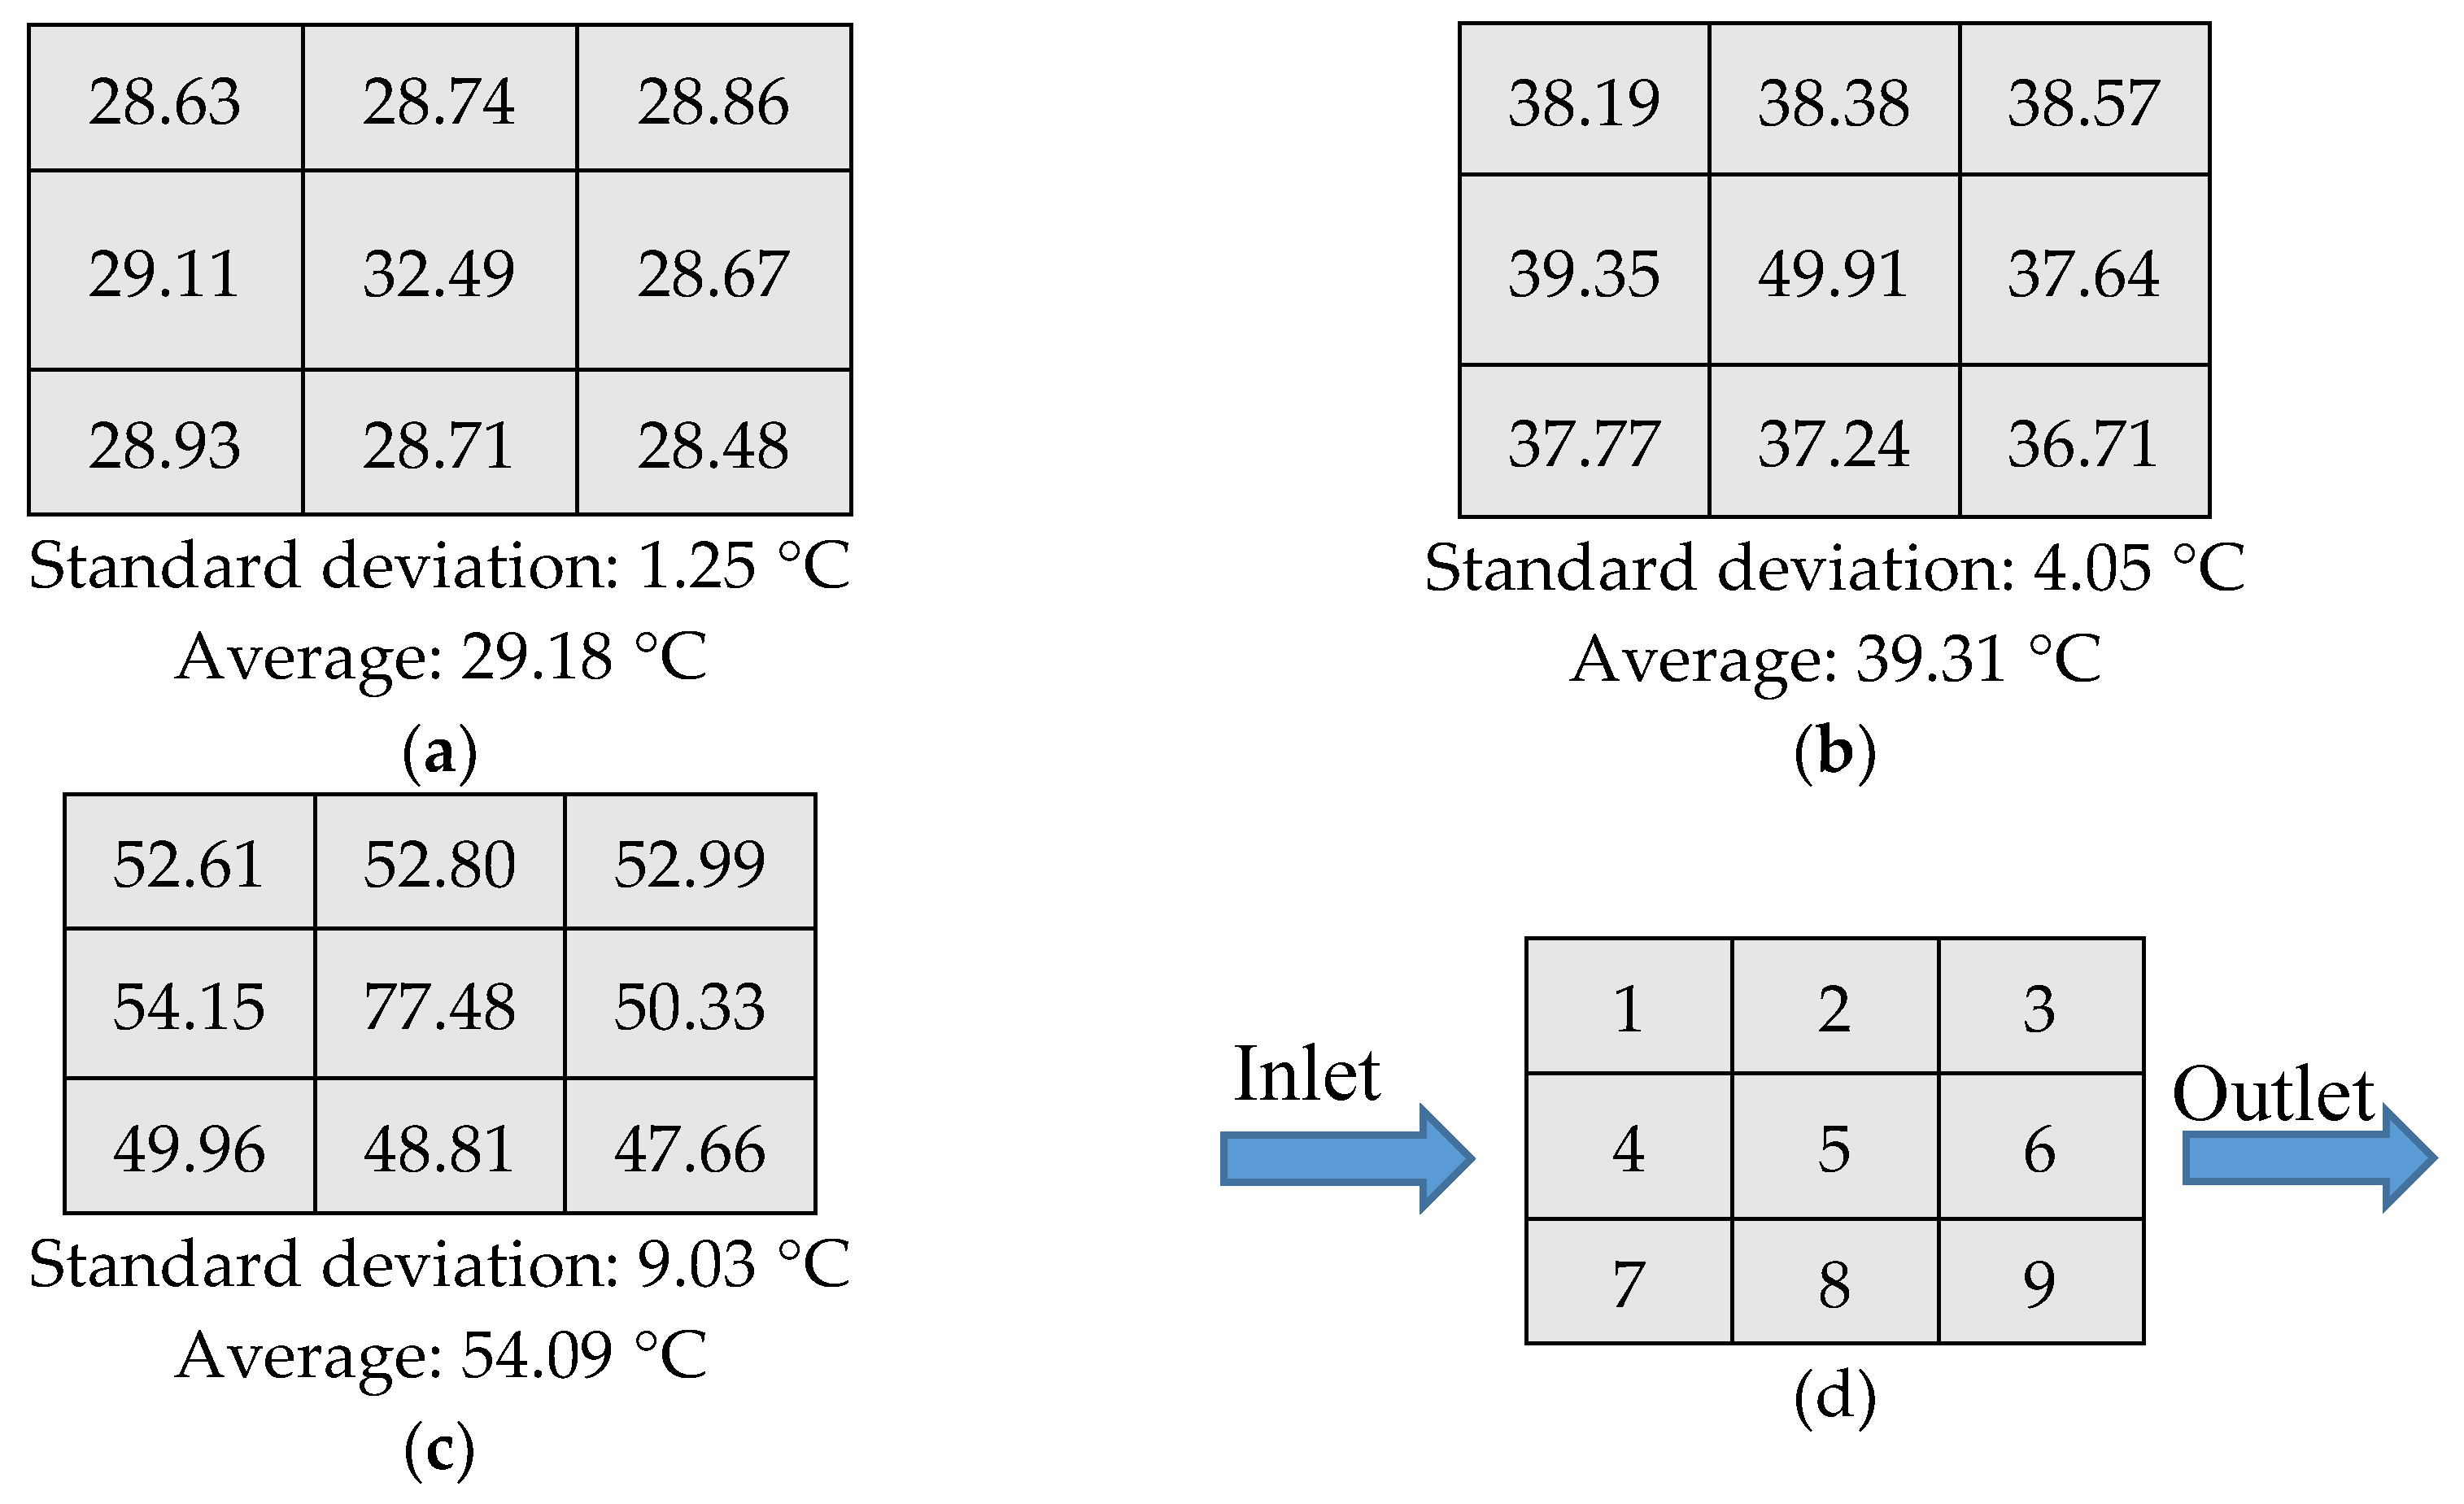
Figure 15 shows the temperature distributions on the surface of the heat source, average temperature and standard deviation for the three-layers MLM heat sink of 30 mL/min HTF flow rate for various power rates. The results show an increase of the temperature non-uniformity within the heat source as the power rate increases and this is the same for the standard deviation. For the 5 W power rate, the temperature varies with a standard deviation of 1.25 °C and with an average temperature of 29.18 °C. A significant increase of the standard deviation in the 30 W power rate of 9.03 °C in the 30 W power rate and of an average temperature of 54.09 °C.
The thermal efficiency of the heat sink and the HTF outlet temperature for various power rates for the three-layers MLM heat sink of 30 mL/min HTF flow rate are shown in Figure 16. As can be seen from the figure, the thermal efficiency drops significantly by 6% when the power rate increases from 5 to 10 W. However, the thermal efficiency decreases slightly when the power rate increases from 10 to 30 W and reaches 90% for the 30 W power rate. Additionally, the HTF outlet temperature increases as the power rate increases from 5 to 30 W of 26.45 to 37.88 °C. This shows a higher heat dissipation of a higher power rate.

4.3. Effects of HTF Flow Rates

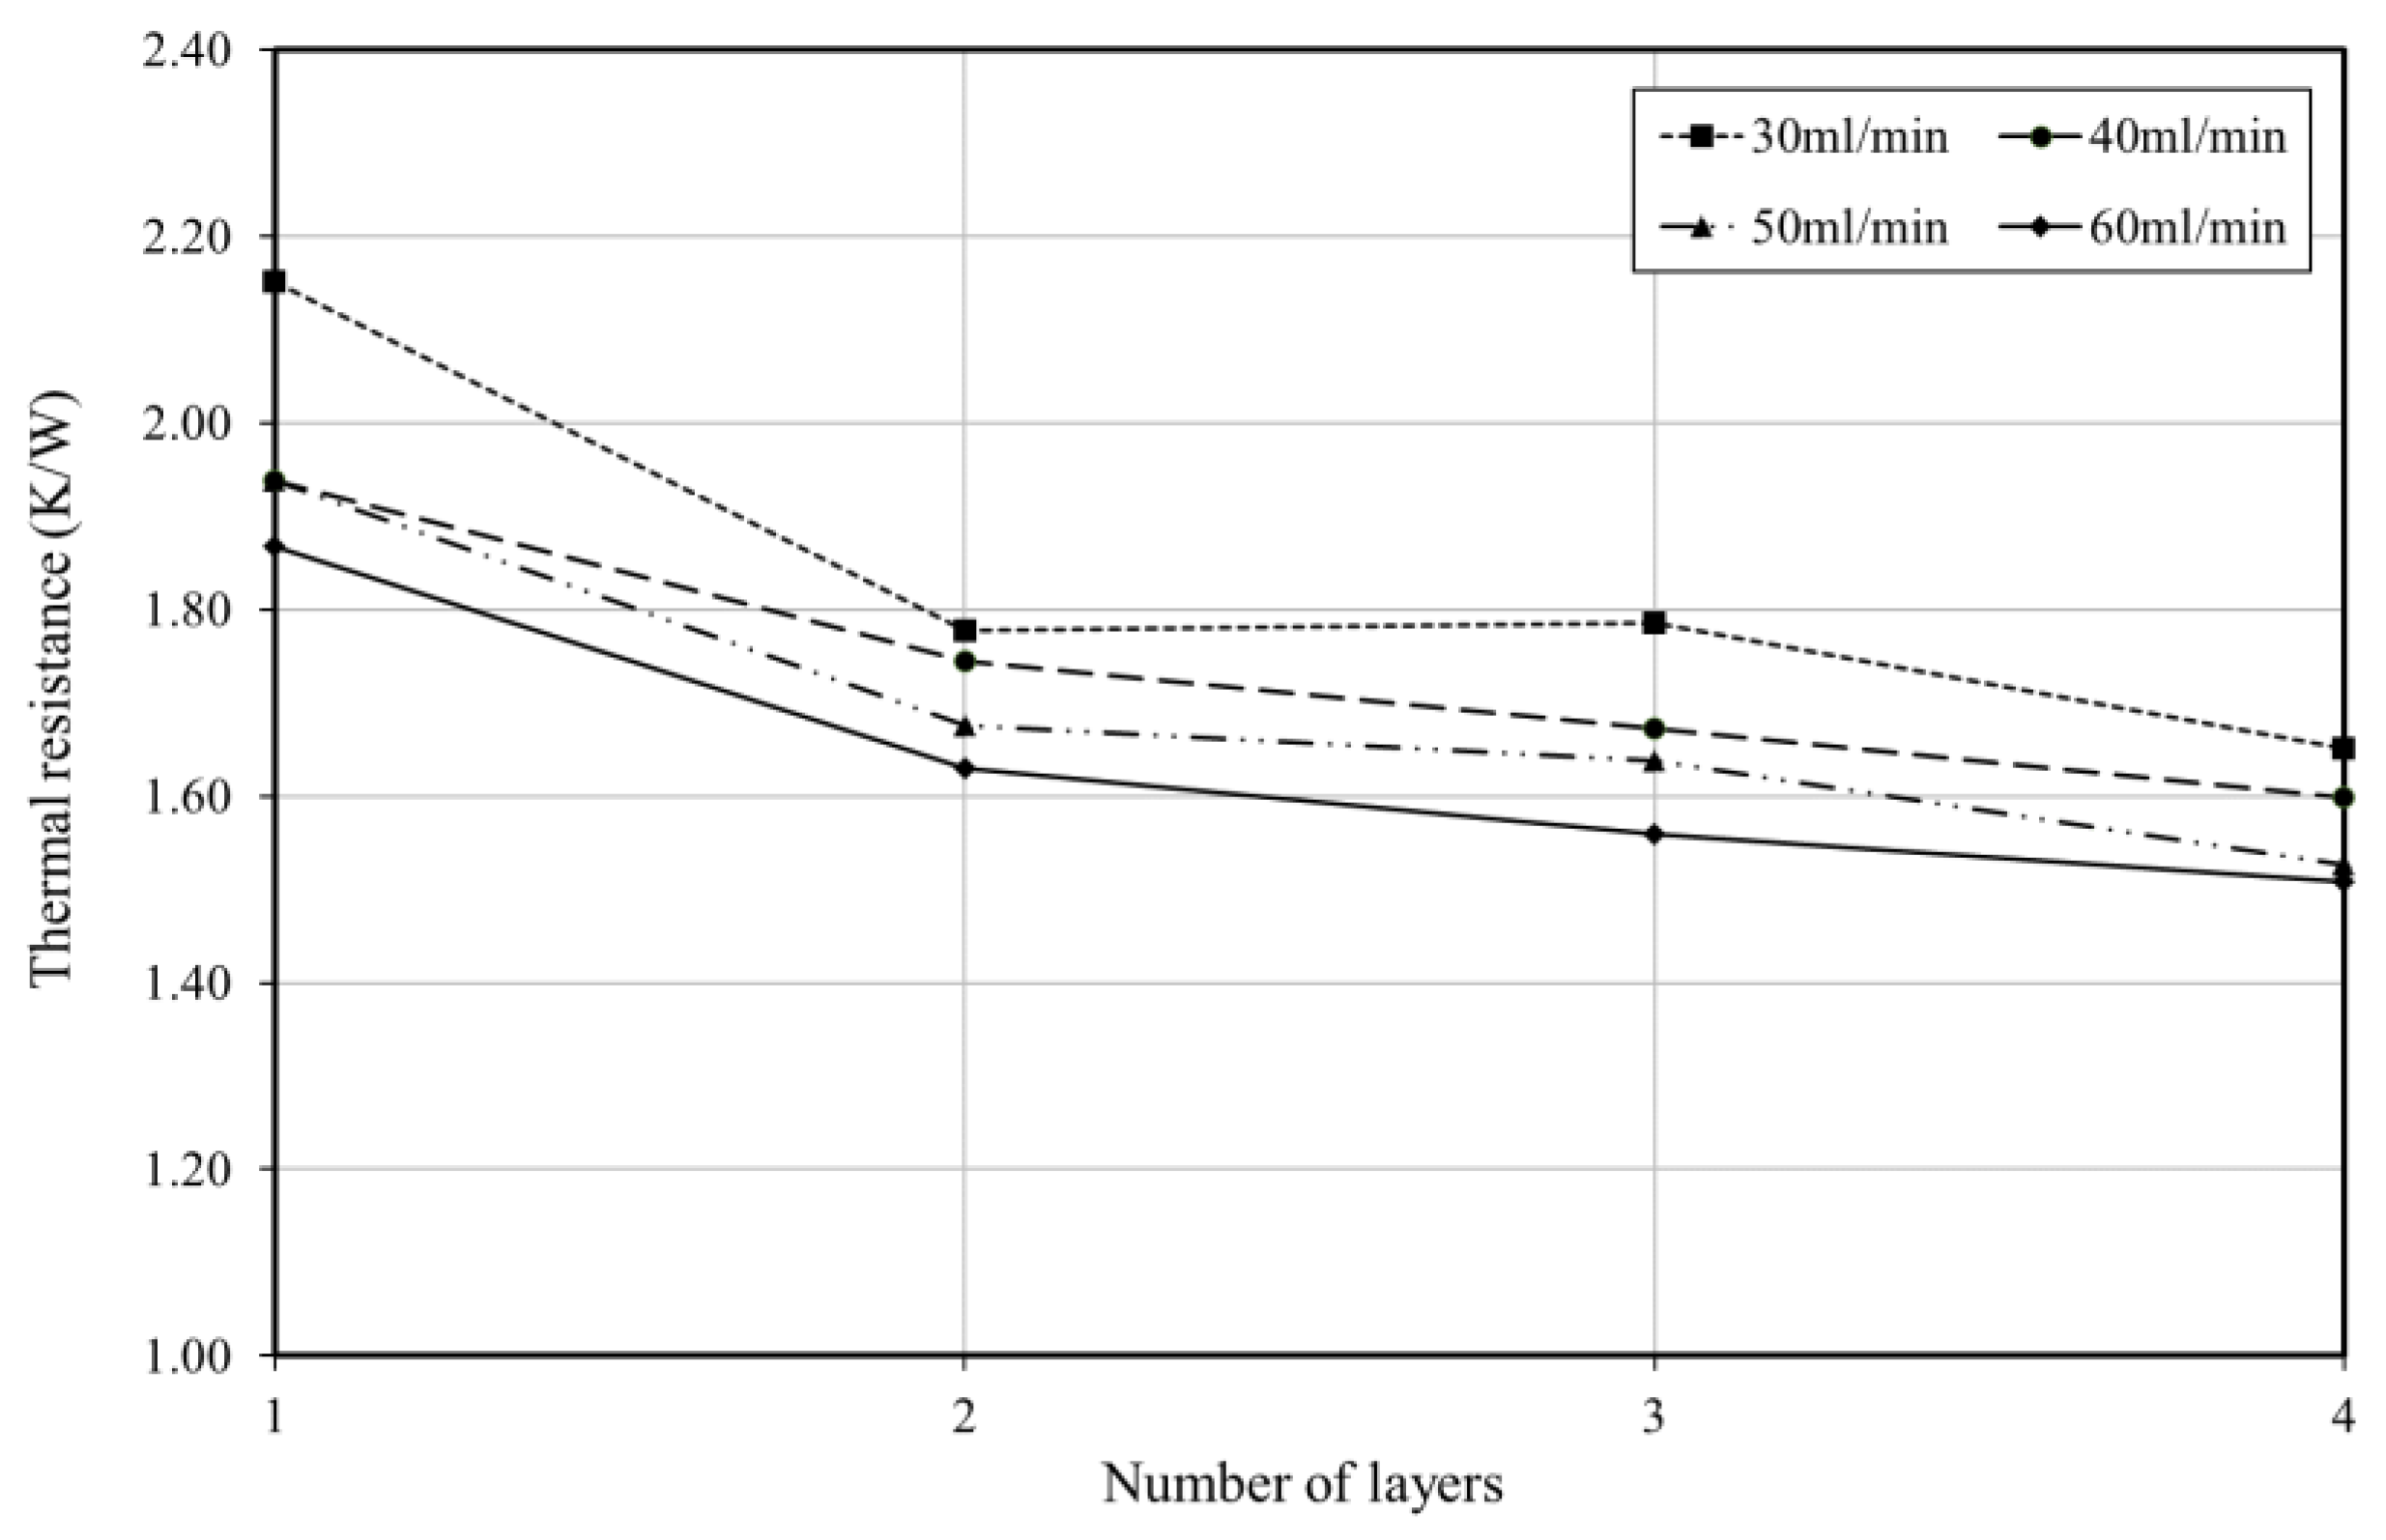
In this section the effect HTF flow rates on the thermal performance of the heat source is presented for various number of layers MLM heat sinks. Figure 17 shows effect of the HTF flow rates on the thermal resistance of the MLM heat sink for the 5 W power rate. It can be seen that for a single layer heat sink, the thermal resistance decreases from 2.04 to 1.78 K/W as HTF flow rate increases from 30 to 60 mL/min, respectively. A significant decrease of the thermal resistance is noticed as the HTF flow rate increases from 30 to 40 mL/min of the three- and four-layers heat sink with a difference of 0.15 and 0.14 K/W, respectively. An interesting note is that increasing the number of layers from three to four has a slight effect on the thermal resistance for the HTF flow rate of 30, 40, and 60 mL/min and this shows that the optimum number of layers in the 5 W power rating is three-layers.
Figure 18 shows the effect of the number of layers and HTF flow rates in reducing the heat sink thermal resistance for a higher power rate of 30 W. At this power rating, both the increase of the number of layers and HTF flow rate have a major impact in reducing the thermal resistance of the heat sink HTF. The thermal resistance reduces by 23.26% and 10.25% when the number of layers increases from one to four layers for 30 to 60 mL/min, respectively. This shows that the power rate is critical in determining the optimum number of layers for the lower thermal resistance.
A summary of the measurements of the heat source temperature for various HTF flow rates are shown in Table 8. It is noticed that the heat source temperature decreases significantly as the HTF flow rate increases for all the MLM heat sinks arrangements for power rates of more than 15 W. In addition, the heat source experiences a temperature of more than 80 °C when using a single layer heat sink for power rate of 30 W for all the tested HTF flow rates ranging from 30 to 60 mL/min, which is more than the recommended maximum temperature specified by the CPV assembly manufacturer for performing a high electrical efficiency.
A summary of the HTF outlet temperature i.e., the dissipated heated for the different flow rates, is presented in Table 9. Increasing the HTF flow rate decreases the HTF outlet temperature where the HTF outlet temperature in the 30 mL/min reaches the maximum among all the flow rates. This is more noticeable in the high power rates where the HTF outlet temperature difference is around 3.5 °C when the HTF flow rate increases from 30 to 40 mL/min for all numbers of layers. The maximum HTF outlet temperatures reaches its maximum in the four-layers heat sink of 38.36 °C.

4.4. Effects of Number of Layers on the Pressure Drop

The pressure drop of the MLM heat sink for different number of layer is shown in Figure 19. It is observed that the pressure drop for the flow rate of 30 mL/min is the maximum at the single layer MLM heat sink of 162.79 Pa and its minimum in the four-layers heat sink of 32.75 Pa which is a reduction of three times compared to the single layer heat sink. The heat sink of a single layer experiences a significant increase in the pressure drop when the HTF flow rates are increased from 30 to 60 mL/min, with an increase of 44.13 Pa. However, a slight increase in the pressure drop is noticed when the flow rate is increased for the MLM heat sink of the two-, three- and four-layers MLM heat sinks, with increases of only of 14.81, 9.90, and 15.49 Pa, respectively.

5. Conclusions

An experimental and numerical study of a multi-layered micro channel (MLM) heat sink for CPV thermal regulation application was carried out. The effect of the number of layers and HTF flow rate on the performance of the MLM heat sink at various heat fluxes was investigated. The number of layers and heat fluxes were varied from one to four and 5 to 30 W/cm2, respectively. The following is concluded from this work:
  • Increasing the number of layers has a major impact in reducing the heat sink thermal resistance and the heat source maximum temperature. The thermal resistance decreases by 17% as the number of layers increases from one-layer to two-layers. A slight decrease of the thermal resistance is observed when the number of layers increased to three and four.
  • The temperature non-uniformity decreases by 0.5 °C when the number of layers increases from one-layer to two-layers. However, the two-layers MLM heat sink experiences less temperature non-uniformity compared to the three-layers.
  • The thermal efficiency is improved significantly by increasing the number of layers from one-layer to three-layers by 20%, due to the increase in the HTF outlet temperature.
  • Increasing the input power from 5 to 30 W slightly increases the heat sink total thermal resistance and the heat source temperature increases. This shows the ability of the heat sink to accommodate a wide range of power rates with a slight change in the thermal resistance.
This study is one work of CPV-MLM investigations. The future work will consider applying the MLM heat sink in single solar cell CPV module. The investigation will include both the electrical and thermal performance using the indoor and outdoor characterizations.

Author Contributions

I.A.S. conceived, designed and performed the experiments; I.A.S. and S.K. analyzed the data; I.A.S. wrote the paper, S.K., T.M. and S.S. reviewed the paper and supervised I.A.S. research work.

Funding

The PhD of Idris Al Siyabi is funded by the Ministry of Higher Education of the Sultanate of Oman.

Conflicts of Interest

The authors declare no conflict of interest.

References

  1. Micheli, L.; Micheli, L.; Fernandez, E.F.; Almonacid, F. Enhancing Ultra-High CPV Passive Cooling Using Least-Material Finned Heat Sinks. AIP Conf. Proc. 2015, 1679, 130003. [Google Scholar]
  2. Khanna, S.; Sundaram, S.; Reddy, K.S.; Mallick, T.K. Performance analysis of perovskite and dye-sensitized solar cells under varying operating conditions and comparison with monocrystalline silicon cell. Appl. Therm. Eng. 2017, 127, 559–565. [Google Scholar] [CrossRef]
  3. Khanna, S.; Reddy, K.S.; Mallick, T.K. Optimization of finned solar photovoltaic phase change material (finned pv pcm) system. Int. J. Therm. Sci. 2018, 130, 313–322. [Google Scholar] [CrossRef]
  4. Araki, K.; Uozumi, H.; Yamaguchi, M. A Simple Passive Cooling Structure and Its Heat Analysis for 500 X concentrator PV module. In Proceedings of the 2002 IEEE 29th Photovoltaic Specialist Conference (PVSC), New Orleans, LA, USA, 19–24 May 2002; pp. 1568–1571. [Google Scholar]
  5. Du, D.; Darkwa, J.; Kokogiannakis, G. Thermal management systems for Photovoltaics (PV) installations: A critical review. Sol. Energy 2013, 97, 238–254. [Google Scholar] [CrossRef]
  6. Ye, Z.; Li, Q.; Zhu, Q.; Pan, W. The cooling technology of solar cells under concentrated system. In Proceedings of the 2009 IEEE 6th International Power Electronics and Motion Control Conference IPEMC ’09, Wuhan, China, 17–20 May 2009; pp. 2193–2197. [Google Scholar] [CrossRef]
  7. Bahaidarah, H.M.S.; Baloch, A.A.B.; Gandhidasan, P. Uniform cooling of photovoltaic panels: A review. Renew. Sustain. Energy Rev. 2016, 57, 1520–1544. [Google Scholar] [CrossRef]
  8. Royne, A.; Dey, C.J.; Mills, D.R. Cooling of photovoltaic cells under concentrated illumination: A critical review. Sol. Energy Mater. Sol. Cells 2005, 86, 451–483. [Google Scholar] [CrossRef]
  9. Theristis, M.; Donovan, T.S.O. An integrated thermal electrical model for single cell photovoltaic receivers under concentration. In Proceedings of the 15th International Heat Transfer Conference (IHTC-15), Kyoto, Japan, 10–15 August 2014; pp. 1–12. [Google Scholar] [CrossRef]
  10. Aldossary, A.; Mahmoud, S.; Al-Dadah, R. Technical feasibility study of passive and active cooling for concentrator PV in harsh environment. Appl. Therm. Eng. 2016, 100, 490–500. [Google Scholar] [CrossRef]
  11. Wei, X.; Joshi, Y. Stacked Microchannel Heat Sinks for Liquid Cooling of Microelectronic Components. J. Electron. Packag. 2004, 126, 60. [Google Scholar] [CrossRef]
  12. Vafai, K.; Zhu, L. Analysis of two-layered micro-channel heat sink concept in electronic cooling. Int. J. Heat Mass Transf. 1999, 42, 2287–2297. [Google Scholar] [CrossRef]
  13. Wei, X.; Joshi, Y. Optimization study of stacked micro-channel heat sinks for micro-electronic cooling, Intersoc. In Proceedings of the Conference on Thermal and Thermomechanical Phenomena in Electronic Systems (ITHERM 2002), San Diego, CA, USA, 30 May–1 June 2002; pp. 441–448. [Google Scholar] [CrossRef]
  14. Lin, L.; Deng, M.-X.; Zhang, X.-X.; Wang, X.-D. Numerical analysis and parametric study of multilayered microchannel heat sinks. Adv. Mech. Eng. 2015, 7. [Google Scholar] [CrossRef] [Green Version]
  15. Leng, C.; Wang, X.D.; Wang, T.H.; Yan, W.M. Optimization of thermal resistance and bottom wall temperature uniformity for double-layered microchannel heat sink. Energy Convers. Manag. 2015, 93, 141–150. [Google Scholar] [CrossRef]
  16. Leng, C.; Wang, X.D.; Wang, T.H.; Yan, W.M. Multi-parameter optimization of flow and heat transfer for a novel double-layered microchannel heat sink. Int. J. Heat Mass Transf. 2015, 84, 359–369. [Google Scholar] [CrossRef]
  17. Lu, B.; Meng, W.J.; Mei, F. Experimental investigation of Cu-based, double-layered, microchannel heat exchangers. J. Micromech. Microeng. 2013, 23. [Google Scholar] [CrossRef]
  18. Wang, S.L.; Li, X.Y.; Wang, X.D.; Lu, G. Flow and heat transfer characteristics in double-layered microchannel heat sinks with porous fins. Int. Commun. Heat Mass Transf. 2018, 93, 41–47. [Google Scholar] [CrossRef]
  19. Ahmed, H.E.; Ahmed, M.I.; Seder, I.M.F.; Salman, B.H. Experimental investigation for sequential triangular double-layered microchannel heat sink with nanofluids. Int. Commun. Heat Mass Transf. 2016, 77, 104–115. [Google Scholar] [CrossRef]
  20. Pang, L.; Wang, M.; Wang, W.; Liu, M.; Wang, J. Optimal thermal design of a stacked mini-channel heat sink cooled by a low flow rate coolant. Entropy 2013, 15, 4716–4731. [Google Scholar] [CrossRef]
  21. Hung, T.C.; Yan, W.M.; Wang, X.D.; Huang, Y.X. Optimal design of geometric parameters of double-layered microchannel heat sinks. Int. J. Heat Mass Transf. 2012, 55, 3262–3272. [Google Scholar] [CrossRef]
  22. Chen, K.C.; Wang, C.C. Performance improvement of high power liquid-cooled heat sink via non-uniform metal foam arrangement. Appl. Therm. Eng. 2015, 87, 41–46. [Google Scholar] [CrossRef]
  23. Chong, S.H.; Ooi, K.T.; Wong, T.N. Optimisation of single and double layer counter flow microchannel heat sinks. Appl. Therm. Eng. 2002, 22, 1569–1585. [Google Scholar] [CrossRef]
  24. Jeevan, K.; Azid, I.A.; Seetharamu, K.N.; Tehal, N. Optimization of double layer counter flow (DLCF) micro-channel heat sink used for cooling chips directly. In Proceedings of the 6th Electronics Packaging Technology Conference, Singapore, 8–10 December 2004; pp. 553–558. [Google Scholar]
  25. Lin, L.; Chen, Y.Y.; Zhang, X.X.; Wang, X.D. Optimization of geometry and flow rate distribution for double-layer microchannel heat sink. Int. J. Therm. Sci. 2014, 78, 158–168. [Google Scholar] [CrossRef]
  26. Wu, J.M.; Zhao, J.Y.; Tseng, K.J. Parametric study on the performance of double-layered microchannels heat sink. Energy Convers. Manag. 2014, 80, 550–560. [Google Scholar] [CrossRef]
  27. Levac, M.L.-J.; Soliman, H.M.; Ormiston, S.J. Three-dimensional analysis of fluid flow and heat transfer in single- and two-layered micro-channel heat sinks. Heat Mass Transf. 2011, 47, 1375–1383. [Google Scholar] [CrossRef]
  28. Wong, K.C.; Muezzin, F.N.A. Heat transfer of a parallel flow two-layered microchannel heat sink. Int. Commun. Heat Mass Transf. 2013, 49, 136–140. [Google Scholar] [CrossRef]
  29. Xie, G.; Liu, Y.; Sunden, B.; Zhang, W. Computational Study and Optimization of Laminar Heat Transfer and Pressure Loss of Double-Layer Microchannels for Chip Liquid Cooling. J. Therm. Sci. Eng. Appl. 2013, 5, 011004. [Google Scholar] [CrossRef]
  30. Al-Bakhit, H.; Fakheri, A. Numerical simulation of heat transfer in simultaneously developing flows in parallel rectangular ducts. Appl. Therm. Eng. 2006, 26, 596–603. [Google Scholar] [CrossRef]
  31. Cheng, Y.J. Numerical simulation of stacked microchannel heat sink with mixing-enhanced passive structure. Int. Commun. Heat Mass Transf. 2007, 34, 295–303. [Google Scholar] [CrossRef]
  32. Shi, B.; Srivastava, A.; Wang, P.; Circuits, B.I.; Aids, D. Non-Uniform Micro-Channel Design for Stacked 3D-ICs. In Proceedings of the 48th Design Automation Conference, San Diego, CA, USA, 5–10 June 2011; pp. 658–663. [Google Scholar]
  33. Hung, T.C.; Yan, W.M. Enhancement of thermal performance in double-layered microchannel heat sink with nanofluids. Int. J. Heat Mass Transf. 2012, 55, 3225–3238. [Google Scholar] [CrossRef]
  34. Sakanova, A.; Yin, S.; Zhao, J.; Wu, J.M.; Leong, K.C. Optimization and comparison of double-layer and double-side micro-channel heat sinks with nanofluid for power electronics cooling. Appl. Therm. Eng. 2014, 65, 124–134. [Google Scholar] [CrossRef]
  35. Hung, T.C.; Yan, W.M.; Li, W.P. Analysis of heat transfer characteristics of double-layered microchannel heat sink. Int. J. Heat Mass Transf. 2012, 55, 3090–3099. [Google Scholar] [CrossRef]
  36. Ng, E.Y.K.; Poh, S.T. CFD analysis of double-layer microchannel conjugate parallel liquid flows with electric double-layer effects. Numer. Heat Transf. Part A Appl. 2001, 40, 735–749. [Google Scholar] [CrossRef]
  37. Dixit, P.; Lin, N.; Miao, J.; Wong, W.K.; Choon, T.K. Silicon nanopillars based 3D stacked microchannel heat sinks concept for enhanced heat dissipation applications in MEMS packaging. Sens. Actuators A Phys. 2008, 141, 685–694. [Google Scholar] [CrossRef]
  38. Gong, L.; Zhao, J.; Huang, S. Numerical study on layout of micro-channel heat sink for thermal management of electronic devices. Appl. Therm. Eng. 2015, 88, 480–490. [Google Scholar] [CrossRef]
  39. Skandakumaran, P.; Ortega, A.; Jamal-Eddine, T.; Vaidyanathan, R. Multi-layered SiC microchannel heat sinks—Modeling and experiment. In Proceedings of the Ninth Intersociety Conference on Thermal and Thermomechanical Phenomena In Electronic Systems, Las Vegas, NV, USA, 1–4 June 2004; Volume 1, pp. 352–360. [Google Scholar] [CrossRef]
  40. Lei, N.; Ortega, A.; Vaidyanathan, R. Modeling and optimization of multilayer minichannel heat sinks in single-phase flow. In Proceedings of the ASME InterPACK Conference, Vancouver, BC, Canada, 8–12 July 2007; pp. 29–43. [Google Scholar] [CrossRef]
  41. Xie, G.; Chen, Z.; Sunden, B.; Zhang, W. Numerical predictions of the flow and thermal performance of water-cooled single-layer and double-layer wavy microchannel heat sinks. Numer. Heat Transf. Part A Appl. 2013, 63, 201–225. [Google Scholar] [CrossRef]
  42. Wei, X.; Joshi, Y.; Patterson, M.K. Experimental and Numerical Study of a Stacked Microchannel Heat Sink for Liquid Cooling of Microelectronic Devices. J. Heat Transf. 2007, 129, 1432. [Google Scholar] [CrossRef]
  43. Ansari, D.; Kim, K.Y. Performance analysis of double-layer microchannel heat sinks under non-uniform heating conditions with random hotspots. Micromachines 2017, 8, 54. [Google Scholar] [CrossRef]
  44. Shao, B.; Wang, L.; Cheng, H.; Li, J. Optimization and numerical simulation of multi-layer microchannel heat sink. Procedia Eng. 2012, 31, 928–933. [Google Scholar] [CrossRef]
  45. al Siyabi, I.; Shanks, K.; Mallick, T.; Sundaram, S. Thermal analysis of a multi-layer microchannel heat sink for cooling concentrator photovoltaic (CPV) cells. AIP Conf. Proc. 2017, 1881, 070001. [Google Scholar] [CrossRef] [Green Version]
  46. Radwan, A.; Ahmed, M. The influence of microchannel heat sink configurations on the performance of low concentrator photovoltaic systems. Appl. Energy 2017, 206, 594–611. [Google Scholar] [CrossRef]
  47. al Siyabi, I.; Sharma, S.; Mallick, T.K.; Sundaram, S. Thermal regulation of building-integrated concentrating photovoltaic system using phase change material. AIP Conf. Proc. 2016, 1766, 090001. [Google Scholar] [CrossRef] [Green Version]
  48. Ohadi, M.; Choo, K.; Dessiatoun, S.; Cetegen, E. Next Generation Microchannel Heat Exchangers; Springer: New York, NY, USA, 2013. [Google Scholar]
  49. COMSOL Multiphysics Reference Guide. Available online: http://www.lmn.pub.ro/~daniel/ElectromagneticModelingDoctoral/Books/COMSOL4.3/mph/COMSOLMultiphysicsReferenceGuide.pdf (accessed on 30 December 2018).
  50. Khanna, S.; Sharma, V. Effect of number of supports on the bending of absorber tube of parabolic trough concentrator. Energy 2015, 93, 1788–1803. [Google Scholar] [CrossRef]
  51. Khanna, S.; Sharma, V. Explicit Analytical Expression for Solar Flux Distribution on an Undeflected Absorber Tube of Parabolic Trough Concentrator Considering Sun-Shape and Optical Errors. J. Sol. Energy Eng. 2016, 138, 011010. [Google Scholar] [CrossRef]
  52. Sharma, V.; Khanna, S.; Nayak, J.K.; Kedare, S.B. Effects of shading and blocking in compact linear fresnel reflector field. Energy 2016, 94, 633–653. [Google Scholar] [CrossRef]
  53. Ong, C.L.; Escher, W.; Paredes, S.; Khalil, A.S.G.; Michel, B. A novel concept of energy reuse from high concentration photovoltaic thermal (HCPVT) system for desalination. Desalination 2012, 295, 70–81. [Google Scholar] [CrossRef]
Figure 1. (a) Experiment setup schematic; (b) photograph of the experimental set-up; (1) DC power supply, (2) data logger, (3) personal computer, (4) test module, (5) differential pressure meter, (6) variable area glass flowmeter, (7) water circulation bath.
Energies 12 00122 g001
Figure 2. (a) Schematic of the test module parts, (b) a photograph of the test module showing the thermocouple locations at; (1) water inlet temperature, (2) water temperature at the middle channel of the first layer, (3) heat source middle surface temperature, (4) water outlet temperature.
Energies 12 00122 g002
Figure 3. (a) Concentrating photovoltaic (CPV) assembly for Azurspace 3C44A; (b) CPV assembly layers.
Energies 12 00122 g003
Figure 4. (a) Schematic of the three stacked layers microchannel: width of channels (Wc), height of fins (Hc), thickness of fins (Wf), length of plate (L), width of plate (W), base thickness (tb); (b) microscopic images of the side of the plate; (c) surface finish under the microscope.
Energies 12 00122 g004
Figure 5. The schematic of the multi-layer microchannel heat sink and CPV receiver.
Energies 12 00122 g005
Figure 6. Schematic of the computational domain and boundary conditions: ① copper layer surface; ② ERH; ③ top and bottom multi-layered outer surfaces.
Energies 12 00122 g006
Figure 7. Validation of simulation results compared with experimental data for 30 mL/min water flow rates for layers ranged from one to four for (a) the temperature of the heat source in the middle top surface; (b) HTF outlet temperature versus the power.
Energies 12 00122 g007
Figure 8. Effects of number of layers on the thermal resistance and heat source temperature of 30 mL/min HTF flow rate and 15 W power rate.
Energies 12 00122 g008
Figure 9. The heat source temperature uniformity of 30 mL/min HTF flow rate and 15 W power rate for (a) one-layer; (b) two-layers; (c) three-layers MLM heat sink; (d) Schematic of the thermocouple distribution on heat source surface.
Energies 12 00122 g009
Figure 10. The heat source surface temperature contours MLM heat sink of 30 mL/min HTF flow rate and 15 W power rate for (a) one-layer; (b) two-layers; (c) three-layers; (d) 4-layers.
Energies 12 00122 g010
Figure 11. The MLM heat sink isotherms of 30 mL/min HTF flow rate and 15 W power rate for (a) one-layer; (b) two-layers; (c) three-layers; (d) 4-layers.
Energies 12 00122 g011
Figure 12. Effects of number of layers on the HTF outlet temperature and thermal performance of 30 mL/min HTF flow rate and 15 W power rate.
Energies 12 00122 g012
Figure 13. Effects of number of layers on the pressure drop across the heat sink of 30 mL/min HTF flow rate and 15 W power rate.
Energies 12 00122 g013
Figure 14. Effects of number of layers on the thermal resistance and heat source temperature of 30 mL/min HTF flow rate and 15 W power rate.
Energies 12 00122 g014
Figure 15. The heat source temperature uniformity for 3-layers MLM heat sink of 30 mL/min HTF flow rate for a power rate of (a) 5 W, (b) 15 W and (c) 30 W; (d) Schematic of the thermocouple distribution on heat source surface.
Energies 12 00122 g015
Figure 16. Effects of power rating on the HTF outlet temperature and thermal performance of three-layers MLM heat sink of 30 mL/min HTF flow rate.
Energies 12 00122 g016
Figure 17. Heat sink thermal resistance versus number of layers for different HTF flow rates for 5 W.
Energies 12 00122 g017
Figure 18. Heat sink thermal resistance versus number of layers for different HTF flow rates for 30 W.
Energies 12 00122 g018
Figure 19. The pressure drop versus number of layers for different HTF flow rates.
Energies 12 00122 g019
Table 1. Comparative study of different multi-layered microchannel (MLM) heat sink literatures.
Ref.Type of StudyNumber of LayersType of CoolantFlow DirectionsType of Heat SourceHeat Sink MaterialsShape of ChannelObjectivesImportant Findings
[23]Modelling1 and 2WaterCounter flowUniform (1.3 × 10⁷ W/m2) Rectangle
  • Optimization of heat sinks design in the laminar and turbulent flow conditions.
  • For a single layer counter flow: Heat sink performance (heat transfer and hydrodynamic) in laminar flow can be similar of that in turbulent flow.
  • For a double layer counter flow: Heat sink performance in laminar flow is better than that of the turbulent.
[13]Modelling1–6WaterParallel flowUniform Rectangle
  • Optimum fins width, channel width and aspect ratio of two-layered microchannel heat sink.
  • The optimum number of layers for lower thermal resistance and pumping power.
  • Thermal resistance is inversely proportional to the pumping power.
  • Thermal resistance depends on the channel length. The shorter length, the small thermal resistance.
  • In this study the optimum number of layers is three.
[24]Modelling2WaterCounter flowUniform Rectangle
  • To determine the lowest thermal resistance by varying the height sink dimensions such as height and width of channels, height and width of fins.
  • Double layer counter flow micro-channel heat sink has less thermal resistance compared to parallel and counter flow single layer microchannel heat sink.
[39] Analytical, numerical and experimental1–4WaterParallel flowUniformSilicon carbide (SiC)Square
  • A closed-form analytical, numerical and experimental analysis.
  • For same flow rate, the pressure drop decreases as the number of layers increased.
[11]Numerical simulation1–5WaterParallel flowUniformSteel, Silicon, copper and diamondSquare
  • A comparison of multi-layers heat sink with single-layer using numerical simulation and thermal resistance network analysis.
  • For materials with low thermal conductivity, the thermal resistance increases with increase of layers.
  • The materials thermal conductivity is not important for low coolant flow rate.
[30]Numerical simulation2WaterParallel flowUniform-Square
  • To determine the effect of the fluid flow on the overall heat transfer performance.
  • The performance of the heat sink is dependent on the flow characteristics in the channels.
[31]Numerical simulation2Air and waterCounter flowUniform-Rectangle
  • To investigate the effect of presence of passive microstructure in the channel
  • The increase of the height of passive microstructure compare to microchannel height leads to lower thermal resistance.
[40]Modelling and experimental1–5WaterParallel flowUniformCopperSquare
  • The comparison of performance of single and multiple layers of minichannel heat sink.
  • The increase of the minichannel layers leads to reduce the thermal resistance and pumping power.
[37]Modelling and experiment3Water-UniformSiliconRectangle
  • To determine the effect of silicon/micro/nanopillars on multilayer water-cooled heat sink.
  • The overall thermal resistance and heat dissipation rate of the heat sink are reduced with silicon pillars, compared to one without.
[27]Modelling1–2WaterParallel and counter flowUniformSiliconRectangle
  • To investigate the effect of fluid flow on the heat sink performance.
  • Two-layered heat sinks perform better in terms of the overall thermal resistance and temperature uniformity in the chip.
  • At low Re number, thermal resistance is lower in parallel flow.
  • Counter flow arrangement gives more temperature uniformity in the chip.
[32]Modelling and experiment1–2AirParallel flowUniformSiliconRectangle
  • Investigation of non-uniform allocation of microchannel for more temperature uniformity and less pumping power.
  • The study was able to achieve 50% less pumping power with sufficient cooling.
[21]Modelling2WaterParallel flowUniformSiliconRectangle
  • Analysis of the effect of individual geometric parameters in the performance of the heat sink and to find out its optimum parameters.
  • Optimal thermal resistance decreases with pumping power.
  • As the coolant pumping power increases, the optimal channel number, lower and upper aspect ratio increase and the optimal width ratio decreases.
[33]Numerical modelling2Nanofluid (Al2O3–water)Counter flowUniformSiliconRectangle
  • Analysis of enhancement double-layered heat sink by using a nanofluid and geometric parameters variation.
  • Significant thermal performance improvement of heat sink when using the nanofluid compared to water.
  • The heat sink effectiveness declines significantly under high pumping power.
[44]Numerical modelling2Deionized waterParallel flowUniform-Rectangle
  • Parameters optimization under high heat source of 556 W/cm2
  • The optimization achieved the satisfy requirement if chip of 98 °C temperature.
[35]Numerical modelling2Glycerol
Ethylene glycol Distilled water
Counter flowUniformSteel Silicon
Aluminum
Copper
Rectangle
  • The effect of substrate materials, coolants and geometric parameters on the performance of heat sink.
  • Heat sink heat transfer performance is enhanced by:
  • Coolant with high thermal conductivity and low dynamic viscosity,
  • Substrate with higher thermal conductivity,
[41]Numerical1 and 2Water Uniform (100 W/cm2) Rectangle and wavy
  • Investigation of the effect of wavy on the heat sink performance.
  • Double Wavy channel heat sink performed cooling performance and lower pressure drop than the single wavy channel heat sink.
[17]Experiment1–2WaterCounter flow-CopperRectangle
  • Comparison of fluid flow in single and double-layered heat sink.
  • Liquid-liquid counter-flow heat transfer.
  • Double-layered heat sink suffers less than half of pressure drop compared to single heat sink.
[20]Modelling2WaterCounter flowUniformCopperRectangle
  • Optimization of mini-channel parameters for optimal temperature uniformity and pump work.
[29]Modelling2WaterParallel and counter flowUniformSiliconRectangle
  • The thermal and flow behavior of the double-layered heat sink is investigated under different flow rates.
  • Parallel flow is better when the flow rate is at a low value and counter flow is better in high flow rate.
[28]Modelling2WaterParallel and counter flowUniformSiliconRectangle
  • Study the behavior of two-layered heat sink under various channel aspect ratios.
  • Parallel flow is better in heat transfer performance than counter flow except in high Reynolds number and high channel aspect ratio.
  • Small middle rib leads to lower thermal resistance.
[25]Modelling2WaterCounter flowUniformSiliconRectangle
  • Optimization of geometry and flow rate for double-layered heat sink.
  • Increasing the pumping power requires more channel, small bottom channel and thinner vertical rib.
[34]Modelling2Water Nanofluid (Al2O3–water)Counter flowUniformcopperRectangle
  • Two advanced microchannels (double-layer and double sided) are compared
  • Sandwich structure with counter flow shows a significant reduction in thermal resistance compared with single-layer, double-layer.
[26]Modelling2Water Counter flowUniformSiliconRectangle
  • The effects of channel number, aspect ratio and velocity ratio on the overall thermal performance.
Table 2. The dimensions of the microchannel.
Thickness of Fins Wf (μm) Width of Channel Wc (μm)Height of Channels and Fins Hc (μm)Base Thickness tb (μm)
50050010001000
Table 3. The volume and mass flow rates of water.
ParametersValue
Heating power (W)5, 10, 15, 20, 25 and 30
HTF flow rate (mL/min)30, 40, 50 and 60
Number of layers1, 2, 3 and 4
Table 4. The volume and mass flow rates of water.
Volume Flow Rate Using Flowmeter mL/min Volume Flow Rate Using Water Column mL/minVariation %Mass Flow Rate g/min
3029329.99
40392.540.00
5048446.31
60583.3356.90
Table 5. The CPV receiver dimensions and its material thermophysical properties [45].
LayerDimension
(mm)
Thickness
(mm)
Thermal Conductivity
(W/m·K)
Heat Capacity
(J/kg·K)
Density
(kg/m3)
ERH10 × 104.54007303965
Copper I27 × 250.2504003858700
Ceramic29 × 270.320279003900
Copper II29 × 270.2504003858700
Aluminum--1609002700
Solder-0.125501509000
Silver-0.2043023510,490
Table 6. The model thermal boundary conditions.
NoRegionBoundary Condition
1Top surfacesNatural convection (15 W/m2K)
2ERHHeat source (Qh)
3Surfaces on bottom and sidesThermally insulated
Table 7. Calculated temperature variation with number of elements for three-layers, 30 mL/min and 15 W heating power.
Number of Elements560,765712,539879,9921,510,4971,669,580
Element Size of DomainWater (Fluid Dynamics)NormalfineFineFinerExtra fine
Remaining (General Physics)NormalfineExtra fineExtra fineExtremely fine
Calculated ParametersMaximum Heat Source Temperature (°C)49.31549.30649.29449.29249.92
Fluid Outlet Temperature (°C)31.70431.70231.70131.70131.701
Table 8. The heat source maximum temperature for various HTF flow rates and power rates for the different layers MLM heat sinks.
Number of LayersHTF Flow Rate (mL/min)Power Rate (W)
51015202530
Temperature (°C)
13034.3244.2755.7265.9879.9388.55
4033.9143.4953.4462.5174.1182.27
5033.4142.5252.1861.8071.7882.15
6032.7742.0351.1860.9570.3080.02
23032.7941.7650.5160.5268.9177.39
4032.4340.4649.0356.9866.6076.32
5032.1239.9548.2156.6065.5674.30
6031.9439.6947.6054.7764.2672.88
33032.4941.0449.9158.5067.8177.48
4031.7840.1548.4756.0664.8874.16
5031.7339.5847.7355.8864.2973.23
6031.3838.9446.8654.6762.1670.70
43032.6340.5549.3557.7566.0073.57
4031.8739.4146.9855.3063.0671.99
5031.6639.1346.3853.6260.8369.74
6031.4238.9445.7553.0760.9969.31
Table 9. The HTF outlet temperature for various HTF flow rates and power rates for the different layers MLM heat sinks.
Number of LayersHTF Flow Rate (mL/min)Power Rate (W)
51015202530
Temperature (°C)
13026.0827.5429.7932.2233.6636.66
4025.5926.8728.2329.5530.7231.81
5025.1826.0326.9027.8929.0329.74
6024.8225.7026.4127.1527.9128.82
23026.3828.4730.5332.8335.3537.03
4025.8227.3028.6930.2331.8433.24
5025.5226.6127.6828.7729.8431.11
6025.1926.0526.9527.9628.9529.98
33026.4928.7231.1033.3935.6337.88
4025.7827.5029.2430.9732.8534.77
5025.3726.8128.2229.7431.2532.95
6025.2326.3527.5428.7529.9631.16
43026.4328.7731.2033.6536.2638.36
4025.8027.3929.2631.1232.8934.71
5025.4926.6828.1529.7131.2532.66
6025.3026.3527.5028.7530.0131.26