Article

A Novel Control Strategy for DC-Link Voltage Balance and Reactive Power Equilibrium of a Single-Phase Cascaded H-Bridge Rectifier

College of Electrical and Information Engineering, Hunan University, Changsha 410082, China
*
Author to whom correspondence should be addressed.
Energies 2019, 12(1), 51; https://doi.org/10.3390/en12010051
Submission received: 19 November 2018 / Revised: 21 December 2018 / Accepted: 21 December 2018 / Published: 24 December 2018

Abstract

:
The dc-link voltage balance and reactive power equilibrium of the cascaded H-bridge rectifier (CHBR) are the prerequisites for the safe and stable operation of the system. However, the conventional PI (Proportional-Integral) control strategy only puts emphasis on the CHBR dc-link voltage balance without taking into account its reactive power equilibrium under capacitive and inductive working conditions. For this reason, this paper has proposed a novel control strategy for the CHBR that can not only balance dc-link voltage, but also achieve reactive power equilibrium and eliminate the coupling effect between the voltage-balancing controller (VBC) and original system controller (OSC). The control strategy can achieve dc-link voltage balance and the reactive power equilibrium of the CHBR through modifying the active duty cycle by closed loop control, and adjusting the reactive duty cycle relatively according to the modifiable amount of the active duty cycle. Moreover, the strategy can eliminate the coupling effect between the VBC and OSC by the open loop control modification of the active and reactive duty cycle of any H-bridge module in CHBR. Simulations and experiments have shown that the proposed control strategy is feasible and effective in performing the CHBR dc-link voltage balance and reactive power equilibrium under all working conditions and load variations.

1. Introduction

1.1. Motivation and Incitement

Multi-level rectifiers have been widely used in high-voltage and high-power fields because they can reduce the voltage that a single semiconductor switch needs to withstand. Compared with other multi-level rectifier structures, the cascaded H-bridge rectifier (CHBR) has the advantages of a modular structure, easy expansion, and multiple independent DC outputs. Besides, the CHBR can effectively reduce the input current harmonic, filter inductance volume, and voltage stress of power devices [1,2,3], so it has been extensively applied to active power filters (APF) [4,5], static synchronous compensators (STATCOM) [6,7,8], traction systems [9,10], and the rectifier stage of solid-state transformers (SST) [11,12].
With the ever-growing electricity consumption, microgrids have been widely used to integrate distributed and sustainable energy sources. A microgrid should be equipped with the ability to solve local energy issues and have a higher flexibility to operate normally [13]. As the energy router of a microgrid, an SST not only functions as an AC/DC converter, it also makes the whole energy interconnected system fully compatible and expandable, providing a plug-and-use ac-dc mixed connector for distributed energy resources [14,15]. It also has many power quality regulatory functions such as reactive power compensation, active filtering, and power factor correction. However, the switching loss, difference in pulse delay and inconsistent dc-side load could easily lead to CHBR dc-link voltage and reactive power imbalance [16], disturbing the safe and stable operation of the system. Specifically, an unbalanced CHBR dc-link voltage could lead to overvoltage, overcurrent, capacitor breakdown, and even a runaway SST system; also, reactive power compensation cannot happen with the unbalanced reactive power of CHBR modules, making SST unable to fulfill its role in power quality regulation. Therefore, study dc-link voltage and reactive power balance is critical for the stable operation of a power electronic transformer and microgrid system [17,18].

1.2. Literature Review

In recent years, many feasible control strategies have been proposed to balance CHBR dc-link voltage [19,20,21,22,23,24,25,26], which can be classified into two categories. The first category refers to adopting advanced modulation techniques to balance CHBR dc-link voltage. As for the complexity in the predictive control algorithm of the CHBR model, the control strategy proposed in [19] uses a voltage vector instead of a current vector to determine whether the voltage changes transiently or steadily, and adopts a different control algorithm according to the changing voltage. The control strategy can not only lessen the complexity of calculation, but also make a fast dynamic response. Irfan Ahmed [20] suggested using a simplified space vector modulation technique to balance dc-link voltage. The basic concept of the technique is to divide an N-level space vector hexagon into several two-level space vector hexagons so as to reduce the calculation time. In [21], a method of selective harmonics elimination modulation is proposed to balance dc-link voltage at a low switching frequency. The method is used to eliminate specific subharmonics. The above methods based on advanced modulation techniques can be used to achieve the dc-link voltage balance, but are not applicable to a CHBR with lot of modules.
It seems to many scholars that closed loop control is preferable to the first category. As mentioned in [22,23], the closed loop regulation of an active duty cycle of all H-bridges can lead to the balance of CHBR dc-link voltage. The voltage-balancing controller (VBC) proposed in [24,25] aims to balance CHBR dc-link voltage by using closed loop control to modify the active duty cycle of any N-1 CHBR module. Meanwhile, the open-loop regulation of the active duty cycle of the N-th CHBR module is carried out to keep the total dc-link voltage unchanged. In [26], a new VBC for a single-phase CHBR is presented, which can not only balance the dc-link voltage, but also eliminate the coupling effect between it and the original system controller (OSC) in the working condition of the unit power factor. However, none of the above methods considered the influence of the modification of an active duty cycle on the reactive power distribution or the impossible average distribution of reactive power under the capacitive and inductive conditions.

1.3. Contribution and Paper Organization

Considering a single-phase CHBR, this paper has proposed a novel control strategy for dc-link voltage balance and reactive power equilibrium based on the d-q coordinate system. The strategy can achieve a CHBR dc-link voltage balance and reactive power equilibrium in the case of an inconsistent H-bridge module load by using closed loop control to modify the active duty cycle of any N-1 CHBR module and adjusting the reactive power of each module according to the modifiable amount of active duty cycle. In addition, the use of the strategy to make an open loop regulation of the active and reactive duty cycles of the N-th CHBR module can eliminate the coupling effect between the OSC and VBC under all working conditions. Furthermore, the strategy with a simple calculation feature is easily introduced into the CHBR with a large number of modules.
This paper is organized as follows: the principle of the OSC and conventional PI (Proportional-Integral) VBC methods for a single-phase CHBR is described in Section 2. The theoretical analysis of the proposed VBC method is presented in Section 3. In Section 4, by using a single-phase seven-level CHBR prototype for simulation and experiment, the proposed control strategy is proved to be feasible and effective. Finally, conclusions are drawn in Section 5.

2. Analysis of CHBR

2.1. CHBR and OSC

The topology of a single-phase CHBR is shown in Figure 1. Vs denotes the input ac voltage, is the input ac current, Ls is the input inductance, and Rs is the equivalent resistance of the circuit loss. Ri and Ci (i = 1…N) are the equivalent resistance of the load and capacitance of the i-th H-bridge. VH is the 2N + 1 level waveform produced by the N H-bridges connected in series. VHi and Vdci (i = 1…N) are the ac-side and dc-side voltage of the i-th H-bridge.
The basic approach to control a single-phase CHBR is to construct an imaginary ac phase with 90° lagging behind the real ac phase, transfer the ac voltage and current to the d-q coordinate system through an sm-dq transformation, and use a dual closed-loop controller to generate the common active duty cycle dd and reactive duty cycle dq for all of the H-bridge modules to balance the CHBR dc-link voltage. The OSC of the CHBR adopts sm-dq transformation and dual closed-loop controller, as shown in Figure 2.
When the CHBR only uses the OSC, its mathematical model in the d-q coordinate system is expressed as:
{ L s d i s d d t = R s i s d + ω L s i s q + V s d d d N V d c a L s d i s q d t = R s i s q ω L s i s d + V s q d q N V d c a
where Vdca is the average voltage of all of the dc outputs, Vsd and Vsq are the active and reactive component of the input ac voltage in the d-q coordinates, isd and isq are the active and reactive component of the input ac current in the d-q coordinates, and ω is the angular frequency of the d-q rotational coordinates.

2.2. Dc-Link Voltage Balance

According to Figure 1, under the working conditions of the unit power factor, the active power of the i-th H-bridge is expressed as:
P H i = 1 2 V H d i i s d = V d c i 2 R i
where PHi represents the active power of the i-th H-bridge; and VHdi represents the active component of VHi in the d-q coordinates.
According to the theory of H-bridge linear modulation, the equation is as follows:
{ V H d i = d d i V d c i V H q i = d q i V d c i
where ddi and dqi represent the active and reactive duty cycle of the i-th H-bridge; and VHqi represents the reactive component of VHi in the d-q coordinates.
From Equations (2) and (3), the equation can be derived as following:
1 2 d d i i s d = V d c i R i
Suppose that the CHBR only adopted an OSC to generate the common active duty cycle dd and reactive duty cycle dq for all of the modules. From Equation (4), the following is obtained:
1 2 i s d d d = V d c 1 R 1 = V d c 2 R 2 = = V d c N R N
It can be seen from Equation (5) that the CHBR dc-link voltage cannot be balanced under different loads. Besides, the dc-link voltage of each module varies with its load in certain proportions. Therefore, to balance the CHBR dc-link voltage, it is necessary to add a VBC to regulate the dc-link voltage of each module on the basis of the OSC.

2.3. Conventional PI VBC

The conventional PI VBC is used to balance the CHBR dc-link voltage by modifying the active duty cycle of each module according to the differences in the active power. At the same time, it maintains the sum of the modification amounts of the CHBR module active duty cycle at zero to keep the total dc-link voltage unchanged.
The conventional PI VBC can be described as [23]:
{ Δ d d i = k p i ( V d c a V d c i ) + k i i ( V d c a V d c i ) Δ d d N = i = 1 N 1 Δ d d i
In the d-q coordinates, the instantaneous reactive power of the i-th H-bridge can be calculated according to the following [27]:
Q H i = 1 2 ( d q i i s d d d i i s q ) V d c i
where QHi denotes the reactive power of the i-th H-bridge.
When the CHBR uses both a VBC and an OSC, the active and reactive duty cycles of the i-th H-bridge module are expressed as:
{ d d i = d d + Δ d d i ( i = 1 , 2 , , N ) d q i = d q + Δ d q i ( i = 1 , 2 , , N )
where Δddi and Δdqi are the modifiable amount of the active and reactive duty cycle generated by a VBC.
The conventional PI VBC does not modify the reactive duty cycle, so Δdqi equals 0. Then, Equation (7) can be rewritten as:
Q H i = 1 2 [ d q i s d ( d d + Δ d d i ) i s q ] V d c i
According to Equation (9), the modification of the active duty cycle of each H-bridge module has an effect on its reactive power. When the ac input current reactive component isq is not 0A, the conventional PI VBC can still balance the CHBR dc-link voltage, but it is not able to distribute the reactive power equally. Therefore, the active and reactive duty cycle of each H-bridge module should be modified simultaneously for the purpose of CHBR dc-link voltage balance and reactive power equilibrium.

3. Novel VBC

3.1. Reactive Power Equilibrium

In the d-q coordinates, the average instantaneous reactive power of the CHBR module can be calculated by the following:
Q H a = 1 2 ( d q i s d d d i s q ) V d c a
where QHa denotes the average instantaneous reactive power of the CHBR module.
The difference between the instantaneous reactive power of the i-th module and the average reactive power of the CHBR module can be expressed as:
Q H i Q H a = 1 2 ( d q i s d d d i s q ) ( V d c i V d c a ) + 1 2 ( Δ d q i i s d Δ d d i i s q ) V d c i
For the CHBR reactive power equilibrium, the modification of the reactive duty cycle by the VBC should satisfy the following formula:
( d q i s d d d i s q ) ( V d c i V d c a ) + ( Δ d q i i s d Δ d d i i s q ) V d c i = 0

3.2. Analysis of Coupling Effects

When the CHBR adopts both a VBC and an OSC, its dynamic equation is expressed as:
{ L s d i s d d t = R s i s d + ω L s i s q + V s d i = 1 N d d i V d c i L s d i s q d t = R s i s q ω L s i s d + V s q i = 1 N d q i v d c i
The substitution of Equation (8) into Equation (13) leads to:
{ L s d i s d d t = R s i s d + ω L s i s q + V s d d d N V d c a + ( d d N V d c a i = 1 N Δ d d i V d c i ) L s d i s q d t = R s i s q ω L s i s d + V s q d q N V d c a + ( d q N v d c a i = 1 N Δ d q i v d c i )
Through the comparison of Equations (1) and (14), it is found that the last terms on the right side of Equation (14) are the coupling terms caused by the VBC. In order for the VBC not to affect the OSC, the coupling terms should be removed.
The coupling coefficients are defined as [26]:
{ J 1 = ( d d N V d c a i = 1 N ( d d + Δ d d i ) V d c i ) 2 J 2 = ( d q N V d c a i = 1 N ( d q + Δ d q i ) V d c i ) 2
According to Equation (15), when the coupling coefficients J1 and J2 equal 0, the coupling effect between the controllers will be eliminated. Therefore, the sum of the active and reactive duty cycle modifications should satisfy the following equation:
{ d d N V d c a i = 1 N ( d d + Δ d d i ) V d c i = 0 d q N V d c a i = 1 N ( d q + Δ d q i ) V d c i = 0

3.3. Novel VBC Design

According to the above analysis, a reasonably designed VBC is the key to the CHBR’s dc-link voltage balance and reactive power equilibrium, as well as the elimination of the coupling effect. The proposed VBC consists of a dc-link voltage controller and a reactive power controller. For the first N-1 CHBR module, the dc-link voltage controller uses the PI regulator to modify the active duty cycle so as to eliminate the error between the feedback and reference values of the dc-link voltage. Thus, the dc-link voltage of each H-bridge module can be balanced. The reactive power controller, according to Equation (12), modifies the reactive duty cycle of the first N-1 CHBR module, and then equally distributes the reactive power among the CHBR modules. As far as the N-th H-bridge module is concerned, the proposed VBC, according to Equation (16), is applied to modify the active and reactive duty cycle through open-loop regulation so as to eliminate the coupling effect. The control block diagram of the proposed VBC is shown in Figure 3. The block diagram of the CHBR with the proposed VBC is shown in Figure 4.
The dc-link voltage controller can be described as:
{ Δ d d i = k p i ( V d c a V d c i ) + k i i ( V d c a V d c i ) Δ d d N = i = 1 N ( V d c a V d c i ) d d i = 1 N 1 Δ d d i V d c i V d c N
The reactive power controller can be described as:
{ Δ d q i = ( d q i s d d d i s q ) ( V d c a V d c i ) i s d V d c i + i s q i s d Δ d d i Δ d q N = i = 1 N ( V d c a V d c i ) d q i = 1 N 1 Δ d q i V d c i V d c N
By comparing Equations (6) and (12), it could be seen that the conventional PI VBC does not meet the conditions of the reactive power balance, so it can only achieve a CHBR dc-link voltage balance, but not reactive power equilibrium. A comparison of Equations (12), (17), and (18) shows that Equation (18) meets the conditions of reactive power equilibrium, so the proposed VBC can achieve both CHBR dc-link voltage balance and reactive power equilibrium. Equation (18) is the key to the equal distribution of reactive power among the CHBR modules, which is just the distinction of the proposed VBC from conventional PI VBC.

3.4. Effective Range of Novel VBC

Due to the structural constraint of the CHBR itself, the active power imbalance of each H-bridge module should be limited to a certain range to ensure the normal operation of the new-type VBC. The limitation of the active power imbalance mainly depends on the upper limit of the modulation ratio, which should be less than one, theoretically.
Under all of the working conditions, the instantaneous active power of the i-th H-bridge can be calculated by [27]:
P H i = 1 2 ( d d i i s d + d q i i s q ) V d c i = 1 2 ( ( d d + Δ d d i ) i s d + ( d q + Δ d q i ) i s q ) V d c i
The average instantaneous reactive power of the CHBR module is expressed as:
P H a = 1 2 ( d d i s d + d q i s q ) V d c a
where PHa denotes the average instantaneous active power of the CHBR module.
Suppose the dc-link voltage was balanced; according to Equations (12), (19), and (20), the following equation can be derived:
P H i P H a = 1 + Δ d d i ( i s d 2 + i s q 2 ) d d i s d 2 + d q i s d i s q
In order to avoid overshooting, the active and reactive duty cycle of each H-bridge module should satisfy the following equation:
( d d + Δ d d i ) 2 + ( d q + Δ d q i ) 2 1
The substitution of Equation (22) into Equation (21) leads to:
P H i P H a 1 2 + 1 2 1 + 4 ( i s d 2 + i s q 2 ) ( 1 d d 2 d q 2 ) ( d d i s d + d q i s q )
To enable the proposed VBC to equally distribute the CHBR reactive power, balance the dc-link voltage, and eliminate the coupling effect, the active power imbalance of each H-bridge module must be within the range that is indicated in Equation (23).

3.5. Stability Analysis of Novel VBC

To analyze the stability of the proposed VBC, the structure diagram of the OSC can be converted as shown in Figure 5.
In Figure 5, H1 and H2 are the sampling coefficients. Gpi1 and Gpi2 are the transfer functions of the voltage and current PI controller of the OSC, respectively. Gm is the proportional gain of the PWM (Pulse-Width Modulation) module. Gid is the transfer function that relates the active duty cycle and active current of the CHBR. Gvi is the transfer function that relates the i-th H-bridge dc-link voltage and the CHBR active current.
The transfer function G of OSC can be described as:
G = G p i 1 G p i 2 G m G i d G v i 1 + G p i 2 G m G i d H 2 + G p i 1 G p i 2 G m G i d G v i H 1
The transfer function Gvi can be described as:
G v i = V d c i i s d = [ d d i L s S + ( d q i ω L s + d d i R s ) C L s S 2 + C R s S + d d i d q i N ]
The transfer function Gid can be described as:
G i d = i s d d d = N V d c ( R s + L s S )
Figure 6 shows the Thevenin equivalent circuit of the CHBR. In Figure 6, ZN is the impedance of N-th H-bridge. Z0 is the impedance of the line that connects the output of the CHBR to the load. iN is the output current of the N-th H-bridge. F is the transfer function of the PI controller of VBC.
For the i-th H-bridge, the following equations can be derived:
G [ V d c r e f + ( V d c a V i ) F ] = Z 0 V i Z i + V i
V i = F G Z 0 / Z i + 1 + G F V d c r e f + G Z 0 / Z i + 1 + G F V d c a
In Equation (27), Zi is the load of the i-th H-bridge, where Zi>>Z0. The G*F can be approximated as the gain of the VBC loop. The main parameters of the CHBR are listed in Table 1. Figure 7 shows the Bode diagram of the GF. In Figure 7, the gain crossover frequency is 3200 Hz, and the phase margin is 120°. In addition, the roots of the (Z0/ZK + 1 + GF) are in the left half of the complex plane. Therefore, it can be predicted that the system is stable with the VBC.

4. Simulation and Experimental Research

4.1. Simulation Research

To verify the effect of the proposed control strategy for dc-link voltage balance and reactive power equalization, the MATLAB/Simulink software was used to establish a three-module CHBR simulation platform, as shown in Figure 1. The strategy is compared with the conventional PI control strategy in different working conditions and load variations. The CHBR connects to a one-kV ac voltage source with a line inductance of 50 mH. The dc-link voltage and capacitance of each H-bridge module is considered to be 540 V and 1200 uF. All of the H-bridge modules connect to the resistive load to study. The main parameters of the CHBR that is used in the simulation and experiment are listed in Table 1.

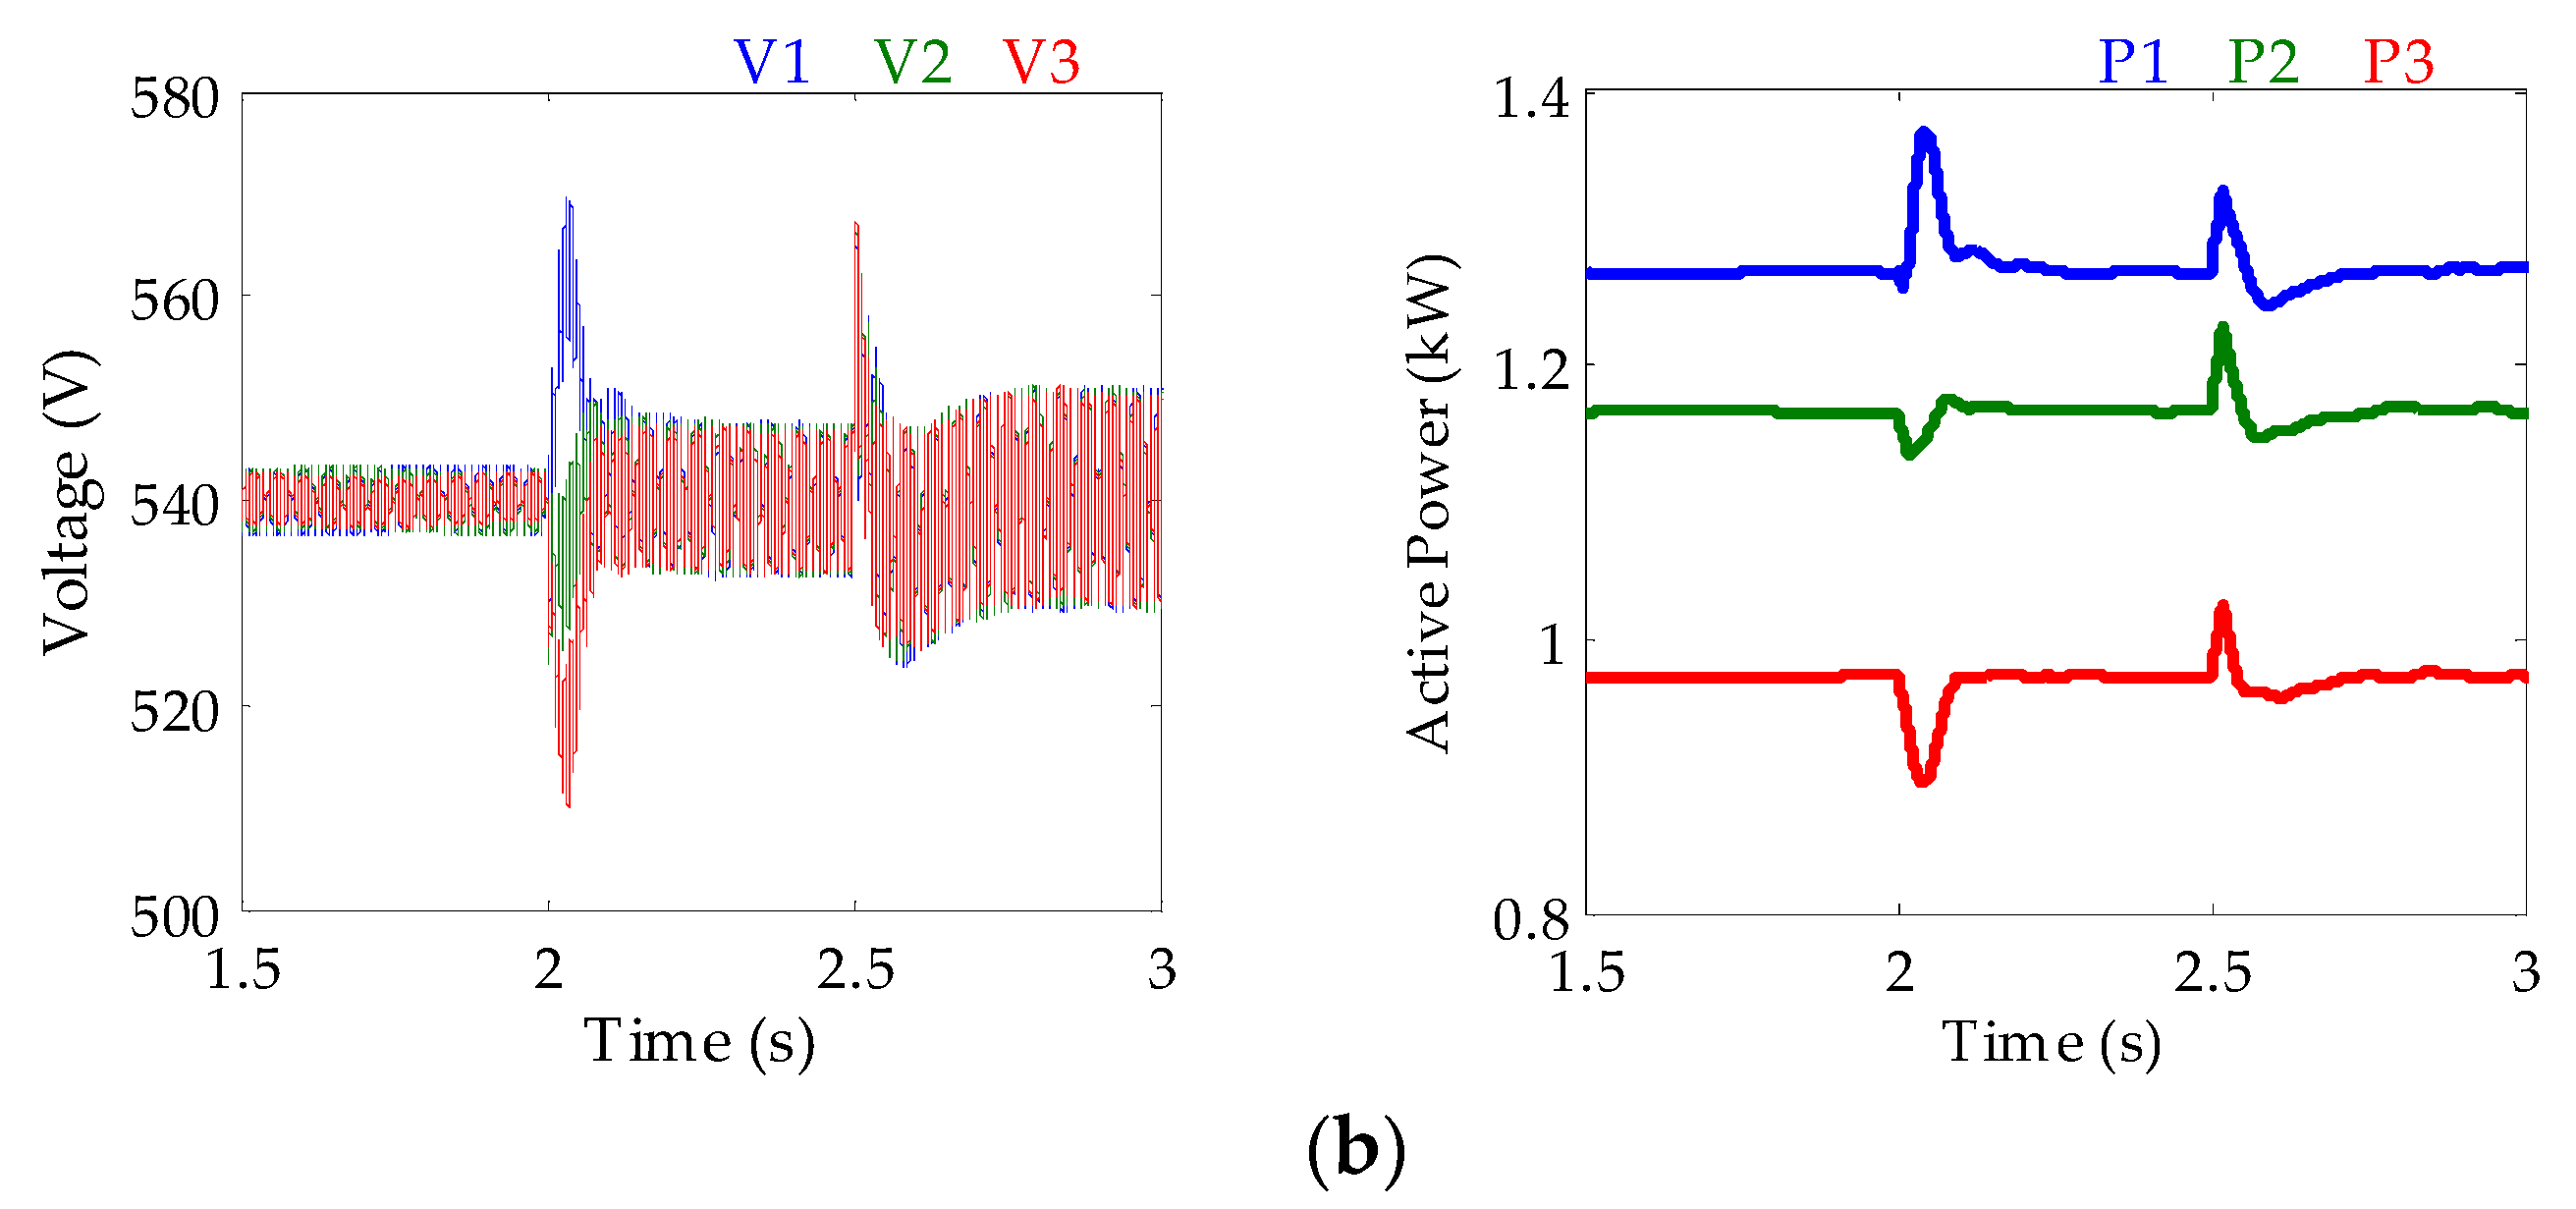
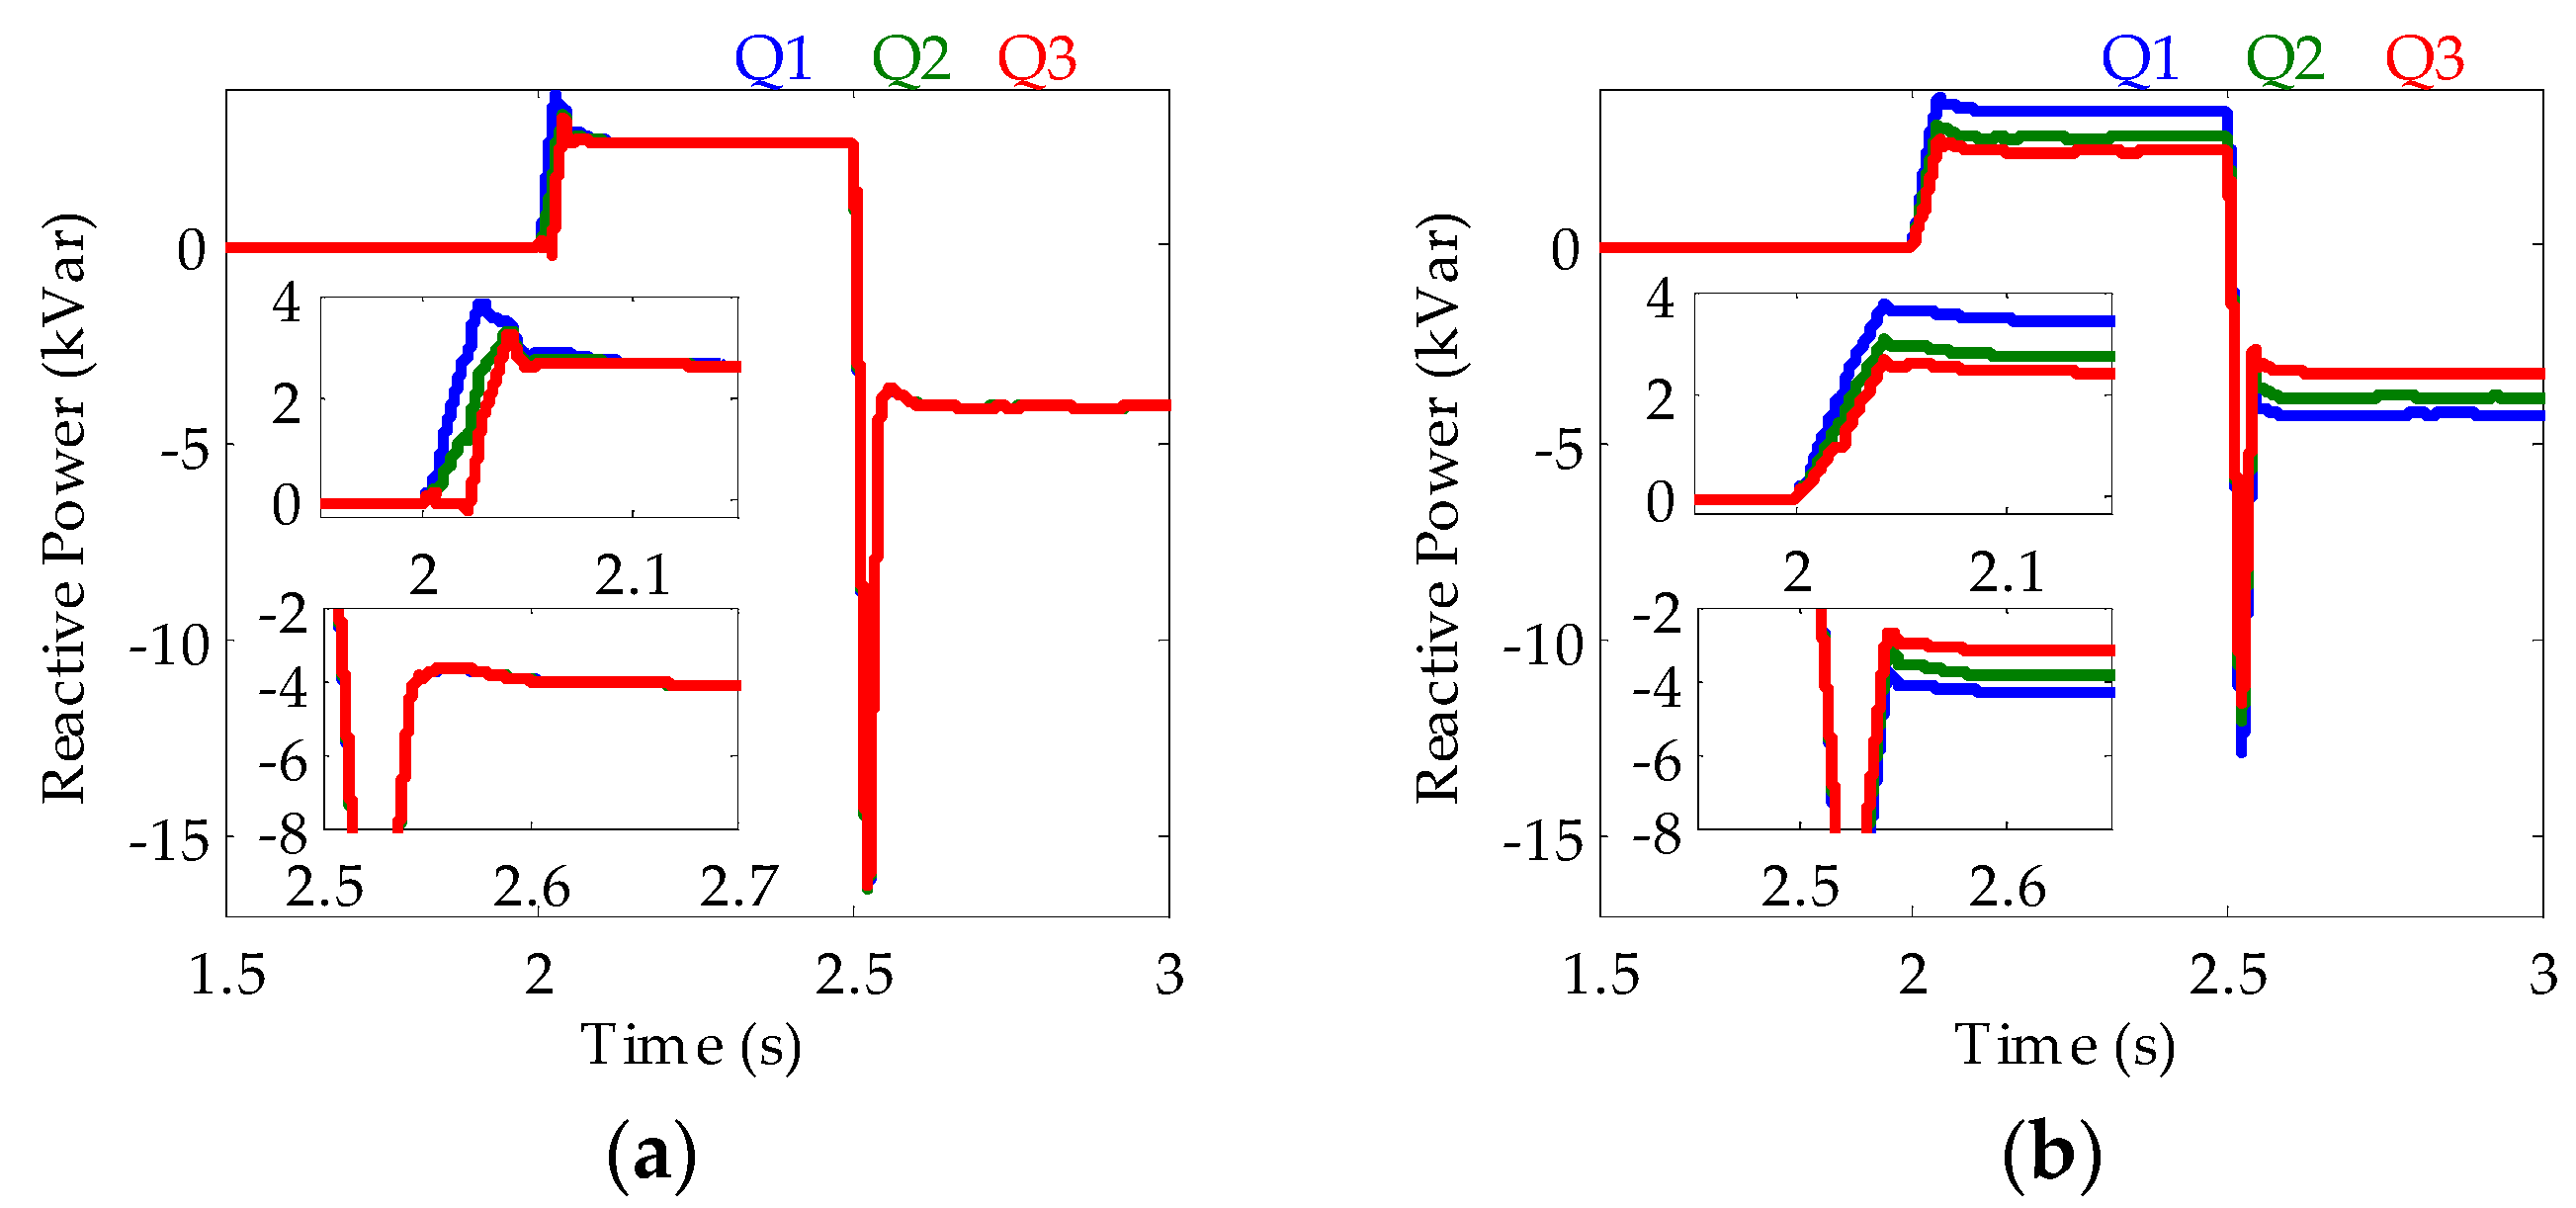
4.1.1. Control Performance Comparison of the Proposed and Conventional Control Strategy under Different Working Conditions

To compare the control performance of the proposed and conventional PI control strategy over CHBR under the unit power factor and inductive and capacitive working conditions, the simulation condition is given as follows: the loads of three H-bridge modules are 230 Ω, 250 Ω, and 300 Ω, respectively; within 0~2 s, the reference reactive current iqref is 0 A, while at 2 s, the iqref decreases to –20 A, and at 2.5 s, the iqref increases to 20 A.
Figure 8 shows simulation waveforms of the active and reactive current of the CHBR under different working conditions by using proposed and conventional control strategies. According to Figure 8, under both control strategies, the reactive current of the CHBR can follow the reference reactive current to reduce from 0 A to −20 A at 2 s, and increase from −20 A to 20 A at 2.5 s. Figure 9 shows the simulation waveforms of dc-link voltage and active power of CHBR modules under different working conditions by using proposed and conventional control strategies. Figure 9 shows that both control strategies can maintain the dc-link voltage of all of the CHBR modules at 540 V in all of the working conditions, and stabilize the output active power of the modules to 1.27 kW, 1.17 kW, and 0.97 kW, respectively. Figure 10 shows the simulation waveforms of the reactive power of CHBR modules under different working conditions by using a proposed strategy and a conventional control strategy. Figure 10a shows that the proposed control strategy can perform CHBR reactive power equilibrium in all of the working conditions, with the maximum difference in reactive power among the modules being basically 0 kVar. In contrast, as shown in Figure 10b, the conventional control strategy can only attain CHBR reactive power equilibrium when iqref equals 0 A. When iqref equals −20 A and 20 A, it cannot fulfill the CHBR reactive power equilibrium, with the maximum difference in reactive power up to 1.2 kVar.
The simulation results of Figure 8, Figure 9 and Figure 10 prove that when the load of the CHBR H-bridge modules are not equal, both control strategies can enable the reactive current of the CHBR to follow a reference reactive current, maintaining dc-link voltage balance and stabilizing the output active power of the H-bridge modules. However, the conventional control strategy can only equally distribute the CHBR reactive power under unit power factor working conditions, while the proposed control strategy can fulfill the CHBR reactive power equilibrium under all of the working conditions.

4.1.2. Control Performance Comparison of the Proposed and Conventional Control Strategy under Load Variation

To compare the control performance of the proposed and conventional control strategy over the CHBR under load variation, the simulation conditions are given as follows: the reference reactive current iqref is 20 A; at the beginning, the load of all three H-bridge modules are 300 Ω, and at 1.5 s, the load of the first H-bridge module changes to 230 Ω.
Figure 11 shows the simulation waveforms of dc-link voltage and the active power of the CHBR modules under load variation by using the proposed and the conventional control strategy. As shown in Figure 11, under both control strategies, the dc-link voltage of all of the CHBR modules can be stabilized to 540 V, no matter whether the loads of the modules are balanced or not. Moreover, when the load of the first H-bridge module changes from 300 Ω to 230 Ω at 1.5 s, both control strategies can increase the output active power of the first H-bridge module from 0.97 kW to 1.26 kW, and reduce that of the other two H-bridge modules from 0.97 kW to 0.96 kW. Figure 12 shows the simulation waveforms of the reactive power of CHBR modules under load variation by using the proposed and conventional control strategy. As shown in Figure 12a, the proposed control strategy can achieve CHBR reactive power equilibrium both before and after load changes, with the maximum difference in reactive power among the modules being basically 0 kVar. Furthermore, as shown in Figure 12b, the conventional control strategy can achieve CHBR reactive power equilibrium when the load of the CHBR is balanced. However, when the loads of the CHBR modules are different, the CHBR reactive power equilibrium cannot be achieved, and the maximum difference in reactive power among the modules is 1.2 kVar.
The simulation results shown in Figure 11 and Figure 12 have verified that under both control strategies, dc-link voltage balance and the active power redistribution of the CHBR can be achieved when the load step changes. However, the conventional control strategy can equally distribute the CHBR reactive power only when load of the CHBR is balanced, while the proposed control strategy can achieve CHBR reactive power equilibrium no matter whether its load is balanced or not.

4.2. Experimental Research

To further verify the proposed control strategy, a test is carried out on a seven-level cascaded H-bridge experimental platform based on DSP28335. The experimental platform consists of three H-bridge modules, as shown in Figure 13. The experiment parameters are consistent with those of the simulation.

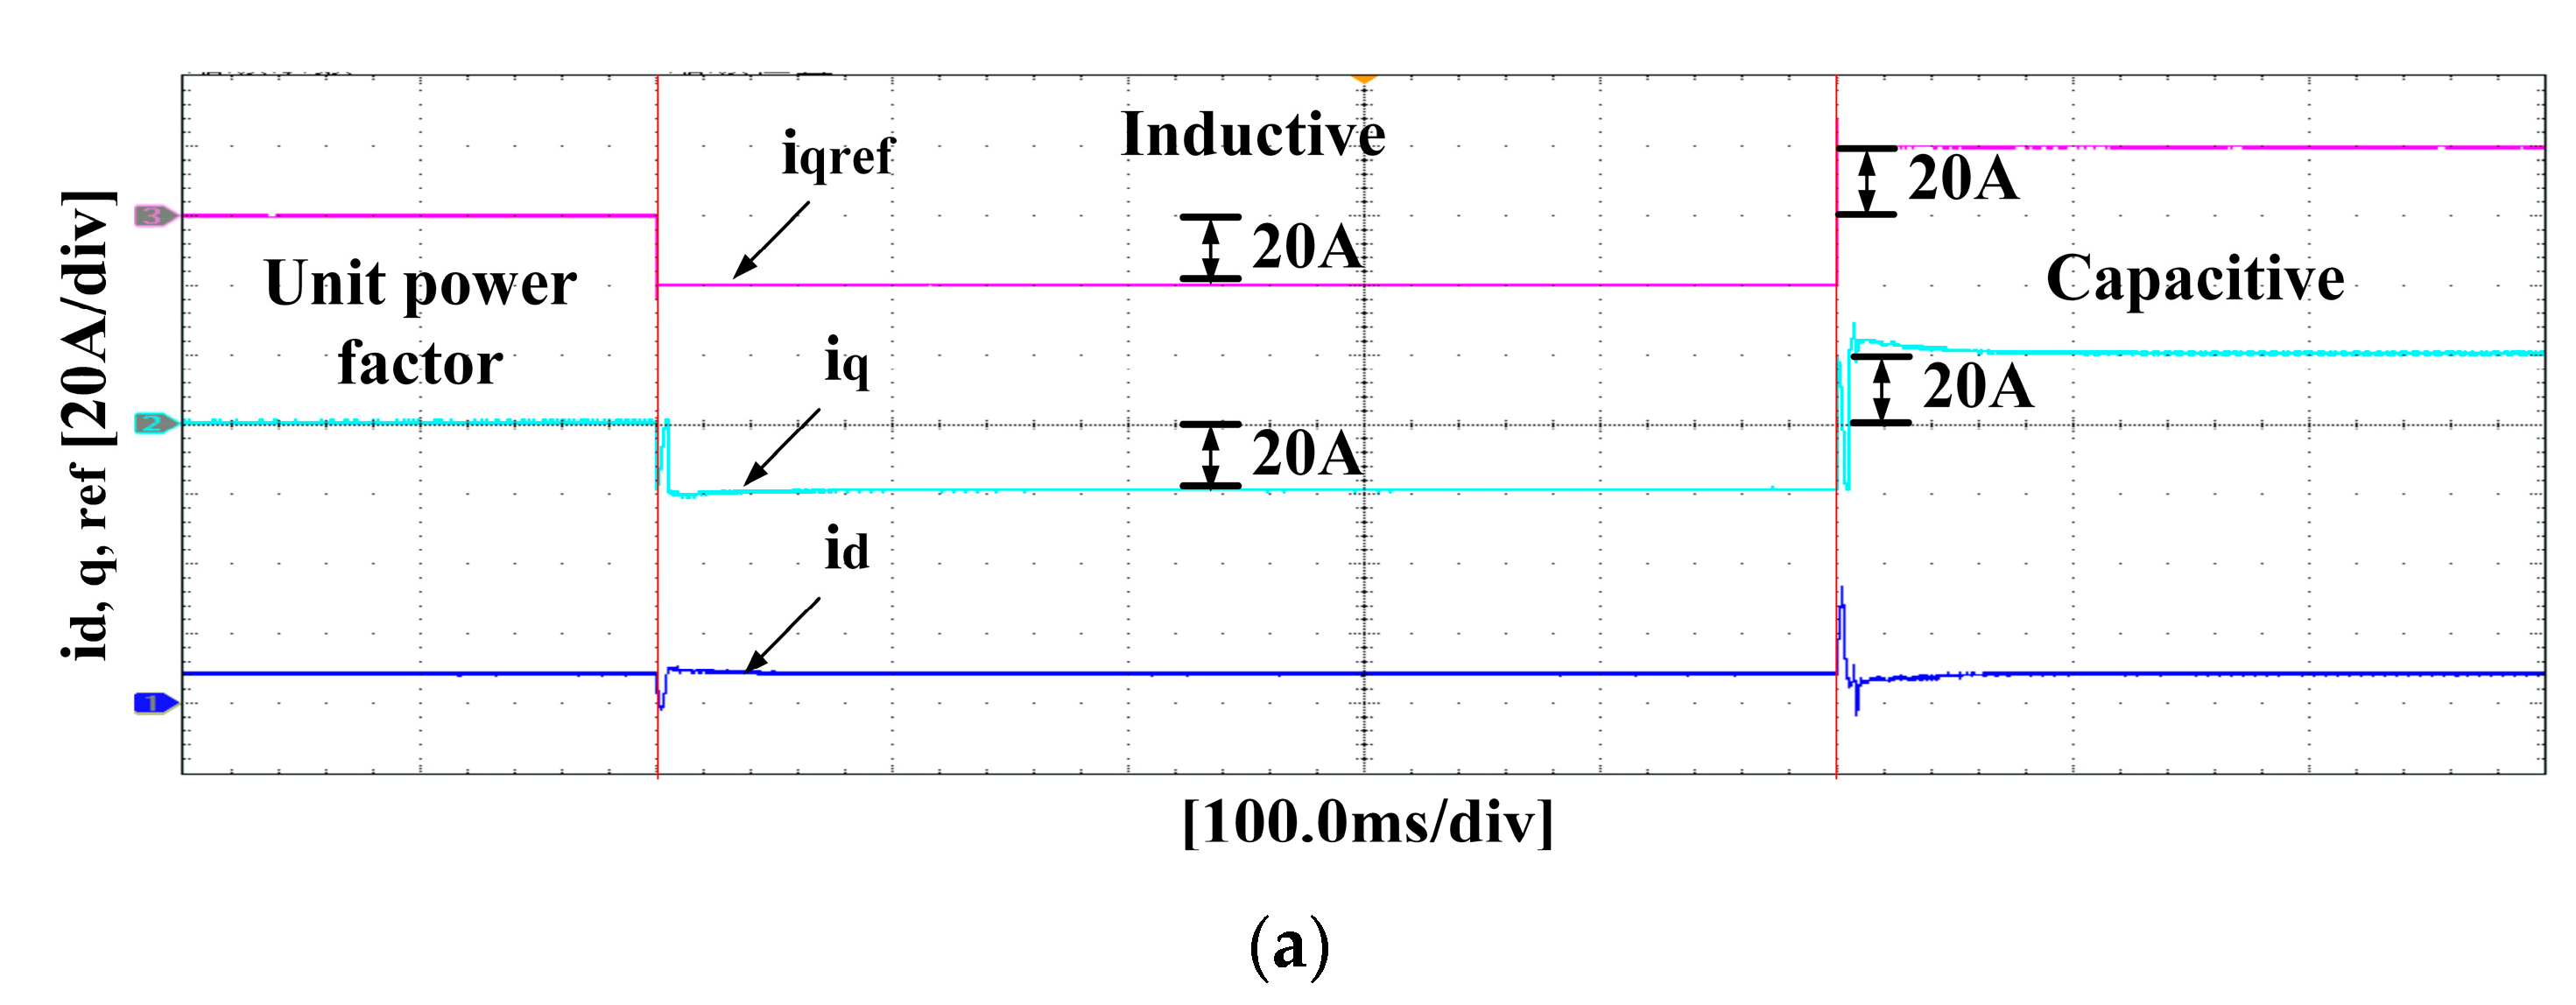
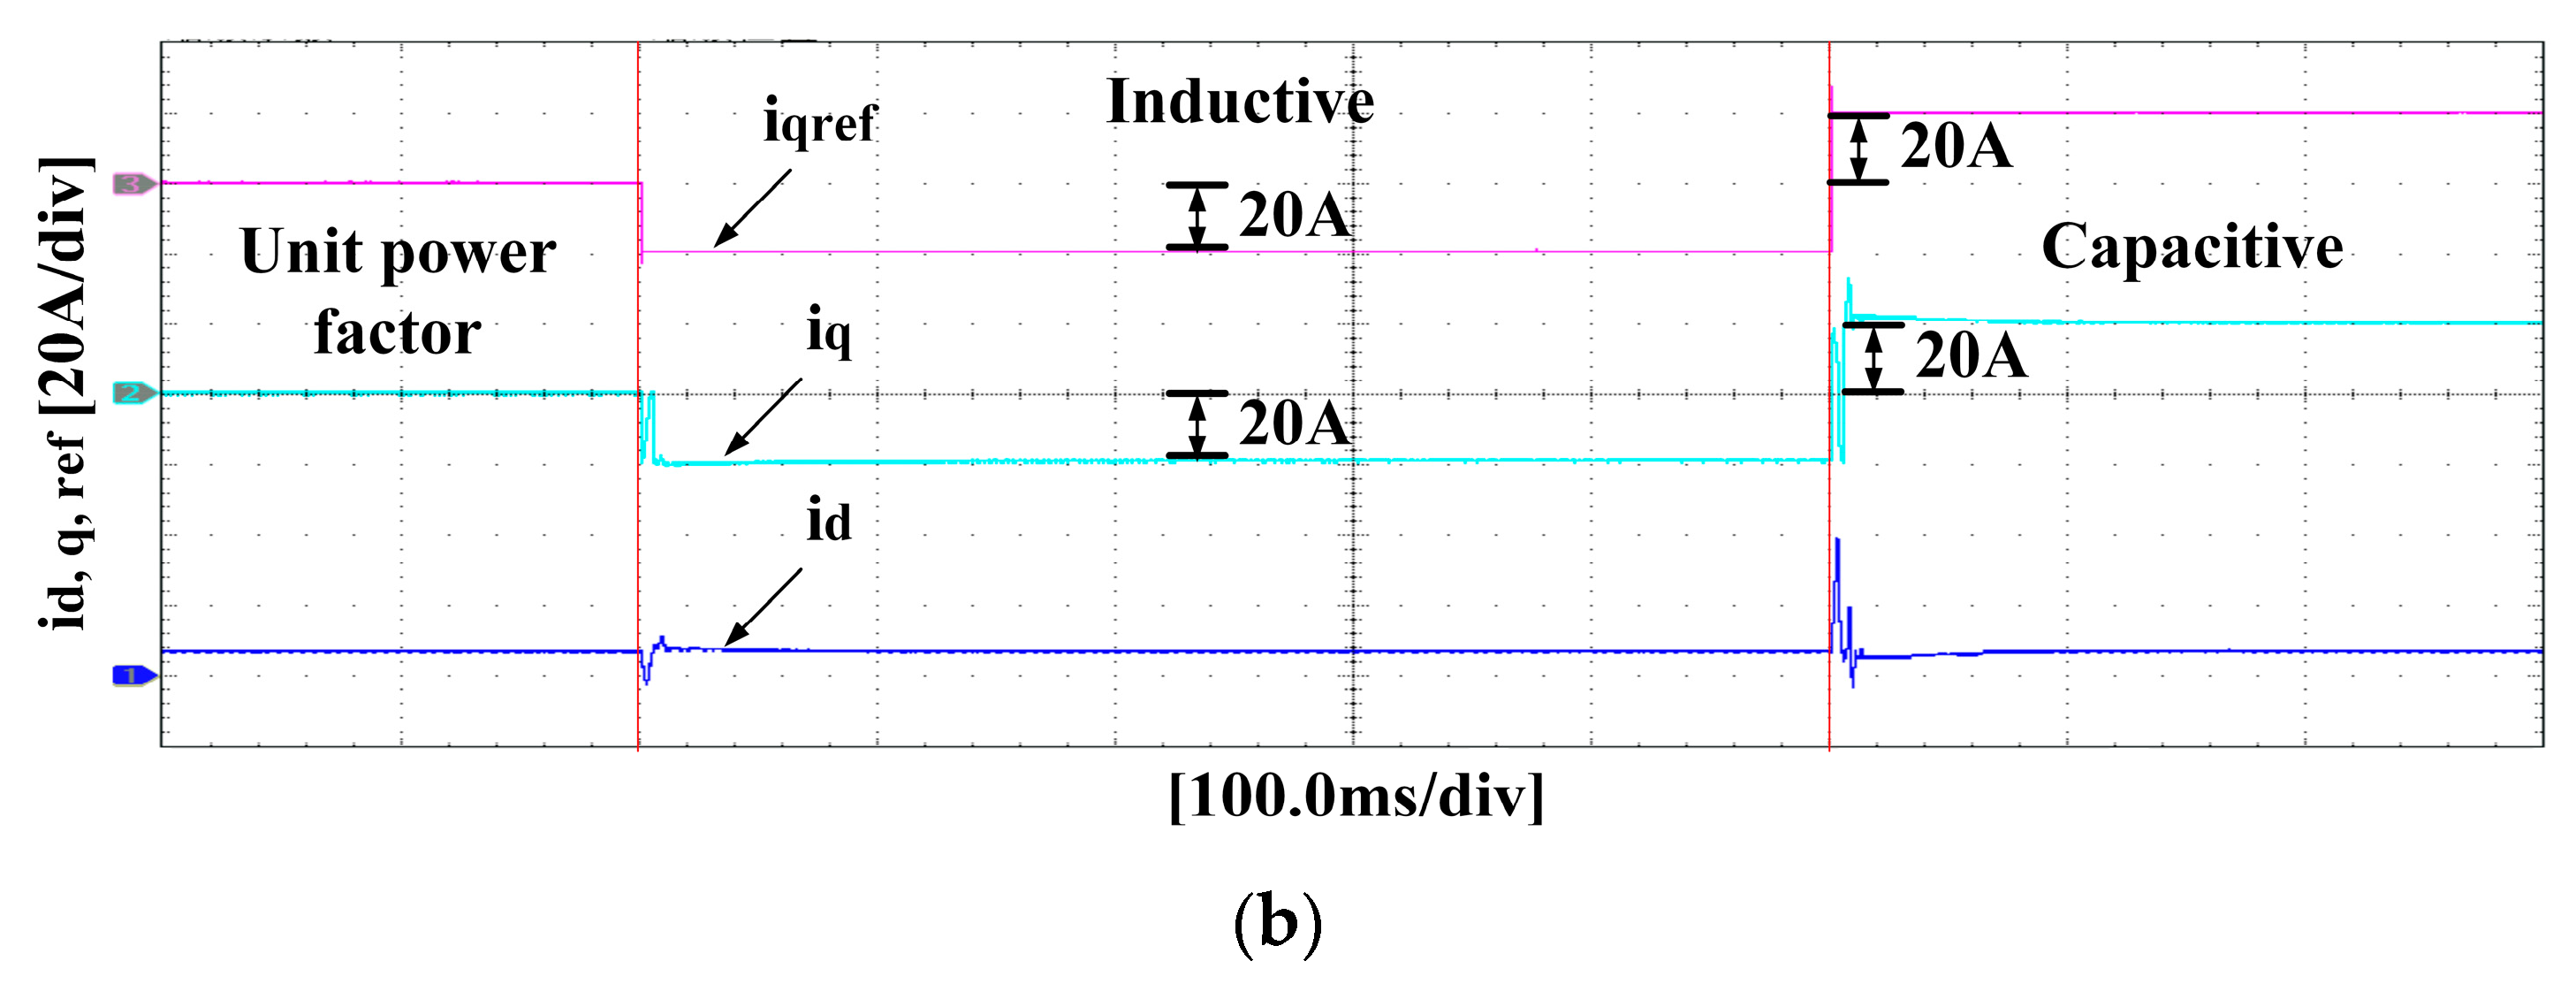
4.2.1. Control Performance Comparison of the Proposed and Conventional Control Strategy under Different Working Conditions.

Figure 14 shows the experimental waveforms of the active and reactive current of CHBR under different working conditions that are obtained by using the proposed and conventional control strategies. From Figure 14, it is known that under both control strategies, the reactive current of the CHBR can follow the reference reactive current. Figure 15 and Figure 16 show the experimental waveforms of the dc-link voltage and the active power of the CHBR modules under different working conditions that are obtained by using the proposed and conventional control strategies. From Figure 15 and Figure 16, it is known that under both control strategies, the CHBR dc-link voltage balance can be achieved, and the output active power of all of the H-bridge modules can be maintained stable. Figure 17 shows the experimental waveforms of the reactive power of the CHBR modules under different working conditions that are obtained by using the proposed and conventional control strategies. From Figure 17, it is known that the proposed control strategy can maintain the reactive power balance of the CHBR modules under all of the working conditions. However, using the conventional control strategy, the CHBR reactive power equilibrium can only be maintained under the unit power factor working condition, rather than the inductive and capacitive working conditions.
The experimental results that are shown in Figure 14, Figure 15, Figure 16 and Figure 17 confirmed that under different working conditions, both control strategies have an equal performance in leading the CHBR reactive current to follow the reference reactive current, balancing the dc-link voltage and maintaining the output active power of the CHBR modules. However, the proposed control strategies can equally distribute the CHBR reactive power under all of the working conditions, but the conventional control strategy is not able to do so.

4.2.2. Control Performance Comparison of the Proposed and Conventional Control Strategy under Load Variation

Figure 18 and Figure 19 show the experimental waveforms of dc-link voltage and the active power of the CHBR modules under load variation that are obtained by adopting the proposed and conventional control strategies. Figure 18 and Figure 19 showed that both control strategies can maintain dc-link voltage balance and perform active power redistribution. Figure 20 shows the experimental waveforms of the reactive power of the CHBR modules under load variation that are obtained by adopting the proposed and conventional control strategies. As indicated in Figure 20, when the CHBR adopts the proposed control strategy, its reactive power can be balanced after load changes, but when the CHBR adopts the conventional control strategy, the CHBR reactive power cannot be equally distributed after load changes.
The experimental results shown in Figure 18, Figure 19 and Figure 20 have verified that under load variations, both control strategies can achieve dc-link voltage balance and redistribute the active power of the CHBR modules. The difference lies in that the performance of the proposed control strategy to equally distribute the reactive power is not affected by load variations, while the conventional control strategy cannot achieve CHBR reactive power equilibrium after load changes.

5. Conclusions

This paper has proposed a novel control strategy for dc-link voltage balance and the reactive power equilibrium of a single-phase CHBR. This strategy is used to modify the active duty cycle of any N-1 module in the CHBR through closed loop regulation, and deal with the reactive duty cycle according to the active duty cycle modification so as to eliminate the effects of active power redistribution on reactive power distribution. With an unbalanced load under all of the working conditions and load changes, the proposed control strategy can equally distribute the CHBR reactive power to each H-bridge module and balance the CHBR dc-link voltage. In addition, the use of the proposed control strategy for the open loop regulation of the active and reactive duty cycle of one of the CHBR modules can eliminate the coupling effect between the VBC and OSC. A single-phase seven-level CHBR simulation and experimental system has been built to verify the proposed control strategy. The theoretical analysis, experimental results, and simulation results demonstrate that the proposed control strategy is feasible and effective for dc-link voltage balance and reactive power equilibrium.

Author Contributions

C.L. and D.L. designed the proposed control strategy; C.L. and G.W. conducted experimental works, modeling and simulation; S.H., H.Z. and Q.H. gave help of paper writing.

Funding

This work was supported in part by the National Natural Science Foundation of China (51737004).

Conflicts of Interest

The author declare no conflict of interest.

Nomenclature

Vs, isInput ac voltage and current.
Ls, RsInput inductance and equivalent resistance of circuit loss.
Ri, CiEquivalent resistance and capacitance of the i-th H-bridge.
VHi, Vdciac and dc voltage of the i-th H-bridge.
dd, dqCommon active duty cycle and reactive duty cycle.
VdcaAverage voltage of all of the dc outputs.
Vsd, VsqActive and reactive component of the input ac voltage in the d-q coordinates.
isd, isqActive and reactive component of the input ac current in the d-q coordinates.
ωAngular frequency of the d-q rotational coordinates.
PHi, QHiActive and reactive power of the i-th H-bridge.
VHdi, VHqiActive and reactive component of VHi in the d-q coordinates.
ddi, dqiActive and reactive duty cycle of the i-th H-bridge.
Δddi, ΔdqiModifiable amount of the active and reactive duty cycle.
PHa, QHaAverage instantaneous active and reactive power of the CHBR module.
J1, J2Coupling coefficients.
H1, H2Sampling coefficients.
Gpi1, Gpi2, FTransfer function of voltage, current, and VBC PI controller.
GidTransfer function that relates the active duty cycle and active current of the CHBR.
GviTransfer function that relates the i-th H-bridge dc-link voltage and CHBR active current.
ZN, ZiImpedance of the N-th and i-th H-bridge.
Z0Impedance of the line that connects the output of the CHBR to the load.

References

  1. Farivar, G.; Hredzak, B.; Agelidis, V.G. Decoupled Control System for Cascaded H-Bridge Multilevel Converter Based STATCOM. IEEE Trans. Ind. Electron. 2015, 63, 322–331. [Google Scholar] [CrossRef]
  2. Dujic, D.; Zhao, C.; Mester, A. Power electronic traction transformer-low voltage prototype. IEEE Trans. Power Electron. 2013, 28, 5522–5534. [Google Scholar] [CrossRef]
  3. Pavel, D.; Zdenek, P.; Martin, P.; Marek, C. New Configuration of Traction Converter with Medium-Frequency Transformer Using Matrix Converters. IEEE Trans. Ind. Electron. 2011, 58, 5041–5048. [Google Scholar]
  4. Yang, Z.; Sun, J.; Li, S.; Huang, M.; Zha, X. An Adaptive Carrier Frequency Optimization Method for Harmonic Energy Unbalance Minimization in a Cascaded H-Bridge-Based Active Power Filter. IEEE Trans. Power Electron. 2018, 33, 1024–1037. [Google Scholar] [CrossRef]
  5. Wu, L.; Wu, M. Single-phase cascaded H-bridge multi-level active power filter based on direct current control in AC electric railway application. IET Power Electron. 2017, 10, 637–645. [Google Scholar] [CrossRef]
  6. Zhang, Y.; Wu, X.; Yuan, X. A Simplified Branch and Bound Approach for Model Predictive Control of Multilevel Cascaded H-Bridge STATCOM. IEEE Trans. Ind. Electron. 2017, 64, 7634–7644. [Google Scholar] [CrossRef]
  7. Ghias, F.; Christopher, D.T.; Branislav, H. Low-Capacitance Cascaded H-Bridge Multilevel StatCom. IEEE Trans. Power Electron. 2017, 32, 1744–1754. [Google Scholar]
  8. Jung, J.-J.; Lee, J.-H.; Sul, S.-K.; Son, G.T.; Chung, Y.-H. DC Capacitor Voltage Balancing Control for Delta-Connected Cascaded H-Bridge STATCOM Considering Unbalanced Grid and Load Conditions. IEEE Trans. Power Electron. 2018, 33, 4726–4735. [Google Scholar] [CrossRef]
  9. Liu, J.; Zhao, N. Improved Fault-Tolerant Method and Control Strategy Based on Reverse Charging for the Power Electronic Traction Transformer. IEEE Trans. Ind. Electron. 2018, 65, 2672–2682. [Google Scholar] [CrossRef]
  10. Ma, F.; He, Z.; Xu, Q. Multilevel Power Conditioner and its Model Predictive Control for Railway Traction System. IEEE Trans. Ind. Electron. 2016, 63, 7275–7285. [Google Scholar] [CrossRef]
  11. Mariam, S.; Jose, M.C.; Alberto, R.; Manuel, A. Energization and Start-Up of CHB-Based Modular Three-Stage Solid-State Transformers. IEEE Trans. Ind. Electron. 2018, 54, 5483–5492. [Google Scholar]
  12. Lin, H.; Shu, Z.; He, X.; Liu, M. N-D SVPWM with DC Voltage Balancing and Vector Smooth Transition Algorithm for a Cascaded Multilevel Converter. IEEE Trans. Ind. Electron. 2018, 65, 3837–3847. [Google Scholar] [CrossRef]
  13. Hamid, R.B.; Mojtaba, M.; Gevork, B.G.; Heidar, A.T. A generalized descriptor-system robust H∞ control of autonomous microgrids to improve small and large signal stability considering communication delays and load nonlinearities. Int. J. Electric. Power Energy Syst. 2017, 92, 63–82. [Google Scholar]
  14. She, X.; Yu, X.; Wang, F. Design and Demonstration of a 3.6-kV–120-V/10-kVA Solid-State Transformer for Smart Grid Application. IEEE Trans. Power Electron. 2014, 29, 3982–3996. [Google Scholar]
  15. Wang, L.; Zhang, D.; Wang, Y.; Wu, B.; Athab, H.S. Power and Voltage Balance Control of a Novel Three-Phase Solid-State Transformer Using Multilevel Cascaded H-Bridge Inverters for Microgrid Applications. IEEE Trans. Power Electron. 2016, 31, 3289–3301. [Google Scholar] [CrossRef]
  16. Liu, Z.; Liu, B.; Duan, S. A Novel DC Capacitor Voltage Balance Control Method for Cascade Multilevel STATCOM. IEEE Trans. Power Electron. 2011, 27, 14–27. [Google Scholar] [CrossRef]
  17. Fan, H.; Li, H. High-Frequency Transformer Isolated Bidirectional DC–DC Converter Modules with High Efficiency over Wide Load Range for 20 kVA Solid-State Transformer. IEEE Trans. Power Electron. 2011, 26, 3599–3608. [Google Scholar] [CrossRef]
  18. Tiago, C.B.; Ali, M.; Helmo, M.P.; Ahmed, A.D. Simplified Small-Signal Model for Output Voltage Control of Asymmetric Cascaded H-Bridge Multilevel Inverter. IEEE Trans. Power Electron. 2018, 33, 3509–3519. [Google Scholar]
  19. Chan, R.; Kwak, S. Improved Finite-Control-Set Model Predictive Control for Cascaded H-Bridge Inverters. Energies 2018, 11, 355. [Google Scholar] [CrossRef]
  20. Ahmed, I.; Vijay, B.B.; Amarendra, M.; Prafullachandra, M.M. Simplified Space Vector Modulation Technique for Multilevel Inverter. IEEE Trans. Power Electron. 2016, 31, 8483–8499. [Google Scholar] [CrossRef]
  21. Fakhry, M.G.; Massoud, A.; Ahmed, S. A grid-connected cascaded H-bridge multilevel converter with quasi seven-level Selective Harmonic Elimination. In Proceedings of the International Conference on Electric Power and Energy Conversion Systems (EPECS), Sharjah, UAE, 24–26 November 2015; pp. 1–6. [Google Scholar]
  22. Martin-Arnedo, J.; González-Molina, F.; Martinez-Velasco, J.A. EMTP model of a bidirectional cascaded multilevel solid state transformer for distribution system studies. Energies 2017, 10, 521. [Google Scholar] [CrossRef]
  23. Han, C.; Huang, A.Q.; Liu, Y. A Generalized Control Strategy of Per-Phase DC Voltage Balancing for Cascaded Multilevel Converter-Based STATCOM. In Proceedings of the IEEE Power Electronics Specialists Conference, Orlando, FL, USA, 17–21 June 2007; pp. 1746–1752. [Google Scholar]
  24. Zhao, T.; Wang, G.; Bhattacharya, S. Voltage and Power Balance Control for a Cascaded H-Bridge Converter-Based Solid-State Transformer. IEEE Trans. Power Electron. 2013, 28, 1523–1532. [Google Scholar] [CrossRef]
  25. Jon, A.B.; Luis, M. Individual Voltage Balancing Strategy for PWM Cascaded H-Bridge Converter-Based STATCOM. IEEE Trans. Ind. Electron. 2008, 55, 21–29. [Google Scholar]
  26. She, X.; Huang, A.Q.; Zhao, T. Coupling Effect Reduction of a Voltage-Balancing Controller in Single-Phase Cascaded Multilevel Converters. IEEE Trans. Power Electron. 2012, 27, 3530–3543. [Google Scholar] [CrossRef]
  27. Hirofumi, A.; Shigenori, I.; Tsurugi, Y. Control and Performance of a Transformerless Cascade PWM STATCOM with Star Configuration. IEEE Trans. Ind. Appl. 2007, 43, 1041–1049. [Google Scholar]
Figure 1. Topology of the cascaded H-bridge rectifier (CHBR).
Energies 12 00051 g001
Figure 2. Control block diagram of the original system controller (OSC).
Energies 12 00051 g002
Figure 3. The block diagram of the proposed voltage-balancing controller (VBC).
Energies 12 00051 g003
Figure 4. The block diagram of the proposed VBC.
Energies 12 00051 g004
Figure 5. The OSC structure diagram.
Energies 12 00051 g005
Figure 6. Thevenin equivalent circuit of the CHBR.
Energies 12 00051 g006
Figure 7. Bode plot of G*F.
Energies 12 00051 g007
Figure 8. Simulation waveforms of the active and reactive current of the CHBR under different working conditions by the use of (a) the proposed control strategy and (b) the conventional control strategy.
Energies 12 00051 g008
Figure 9. Simulation waveforms of dc-link voltage and the active power of CHBR modules under different working conditions by the use of (a) the proposed control strategy and (b) the conventional control strategy.
Energies 12 00051 g009aEnergies 12 00051 g009b
Figure 10. Simulation waveforms of the reactive power of CHBR modules under different working conditions by the use of (a) the proposed control strategy and (b) the conventional control strategy.
Energies 12 00051 g010
Figure 11. Simulation waveforms of dc-link voltage and active power of CHBR modules under load variation by use of (a) the proposed control strategy and (b) the conventional control strategy.
Energies 12 00051 g011
Figure 12. Simulation waveforms of reactive power of CHBR modules under load variation by use of (a) the proposed control strategy and (b) the conventional control strategy.
Energies 12 00051 g012
Figure 13. The experimental platform.
Energies 12 00051 g013
Figure 14. Experimental waveforms of the active and reactive current of the CHBR under different working conditions by use of (a) the proposed control strategy and (b) the conventional control strategy.
Energies 12 00051 g014aEnergies 12 00051 g014b
Figure 15. Experimental waveforms of the dc-link voltage of the CHBR modules under different working conditions by use of (a) the proposed control strategy and (b) the conventional control strategy.
Energies 12 00051 g015
Figure 16. Experimental waveforms of the active power of the CHBR modules under different working conditions by use of (a) the proposed control strategy and (b) the conventional control strategy.
Energies 12 00051 g016aEnergies 12 00051 g016b
Figure 17. Experimental waveforms of the reactive power of the CHBR modules under different working conditions by use of (a) the proposed control strategy and (b) the conventional control strategy.
Energies 12 00051 g017
Figure 18. Experimental waveforms of the dc-link voltage of the CHBR modules under load variation by use of (a) the proposed control strategy and (b) the conventional control strategy.
Energies 12 00051 g018
Figure 19. Experimental waveforms of the active power of the CHBR modules under load variation by use of (a) the proposed control strategy and (b) the conventional control strategy.
Energies 12 00051 g019
Figure 20. Experimental waveforms of the reactive power of the CHBR modules under load variation by use of (a) the proposed control strategy and (b) the conventional control strategy.
Energies 12 00051 g020
Table 1. Main Parameters of CHBR.
ParametersValue
Input AC voltage1 kV
Line inductance50 mH
DC-link voltage540 V each (total 1.62 kV)
DC-link capacitance1200 uF
Switching frequency4 kHz
Voltage PI controllerKp1 = 0.3, Ki1 = 40
Current PI controllerKp2 = 50, Ki2 = 180
VBC PI controllerKp3 = 5, Ki3 = 50

