2.1. Selection of Suitably Exploitable Areas
As indicated above, the methodology to measure the annual amount of residual biomass or residue produced by the forests, and the potential amount of fuel for energy generation, needs previous information:
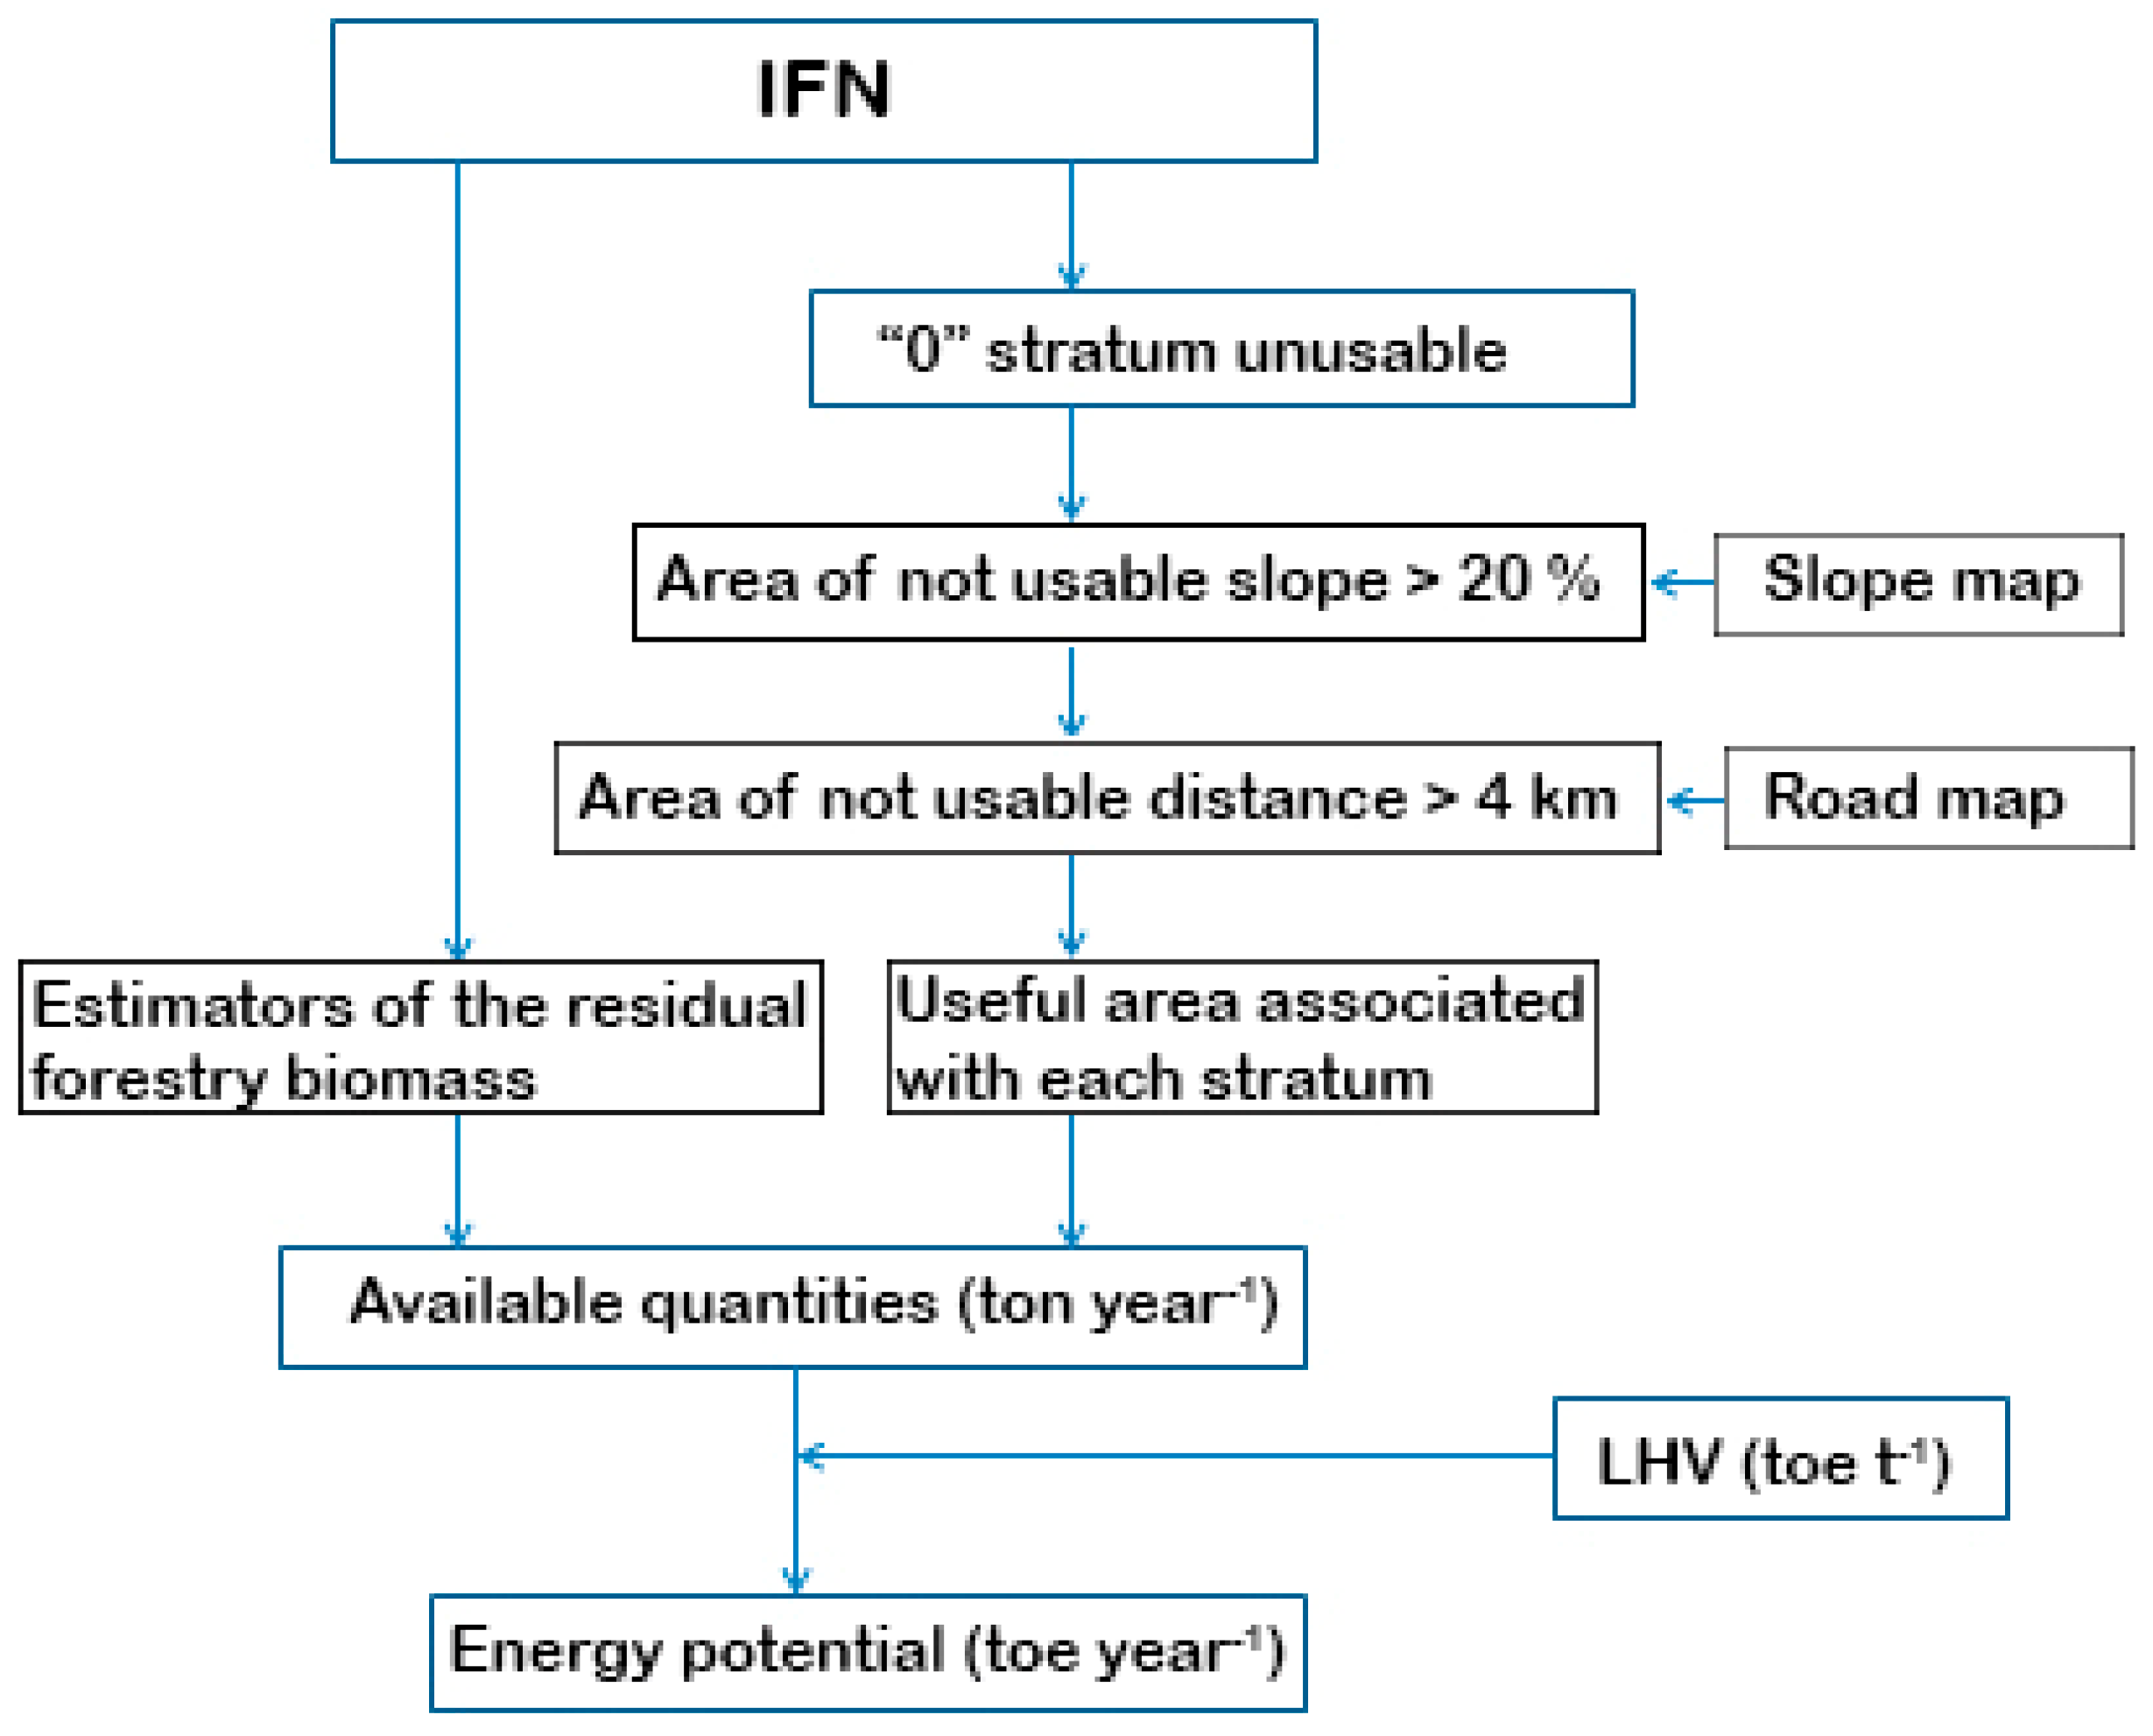
Total exploitable surface biomass was calculated as the difference between the forest area that generates biomass and the generating biomass that does not meet appropriate conditions for extraction. Therefore, it is necessary to previously determine both surfaces. To determine these two surfaces with the support of the GIS, it was necessary to use the information contained in the IFN (files in e00 format), corresponding to the province of Badajoz. All the following methodology is shown in
Figure 1.
The surface occupied by stratum is obtained from IFN, eliminating stratum 0, because it is not forest (rivers, towns, roads, etc.). As mentioned above, it is meant to introduce in the study environmental and economic considerations that nowadays limit the energetic exploitation of the forest biomass residues. In this sense, the biomass waste should not be extracted from areas showing high slopes, difficult access or if it is too far from the transport network. Therefore, biomass residues from areas with a slope over 20% were discarded in order to prevent erosion and soil damage. It was proved that the cost difference between harvesting biomass on land with slopes over 20% is much higher than on lower slopes, as, even though it is possible to collect biomass, yields vary considerably. Some authors have determined the increase involved in biomass extraction on slopes greater that 20% [
39]. Furthermore, the extraction of biomass from these slopes determines changes in soil erosion and loss thereof, as well as nutrient loss and variation of runoff, which could introduce changes in biomass growth and cause unwanted environmental harm.
After all, they lack economic feasibility. Here is the procedure we followed, on surfaces in the province of Badajoz, with a slope lower than 20%:
Depending on the slope percentage map, areas with a slope under 20% are classified as 1, and those over 20% are classified as 0.
GIS is used to link the grid model and unify all those slope layers under 20%.
A new layer was created with all those new polygons that met the required criteria.
The entire forested area that may produce forest residues (i.e., that from the IFN) was replaced by the layer of exploitable area in the total zone.
An aptitude layer with the preference areas was set in order to ensure that only the forest residues from the areas close to roads and pathways were included. The selected limit distance criterion for financial viability was set at 4 km from any pathways or roads of the transport network. It was estimated that greater than 4 km distance without appropriate forest roads, adds to the costs of biomass extraction substantially. For this, several studies were considered, such as Graham et al. [
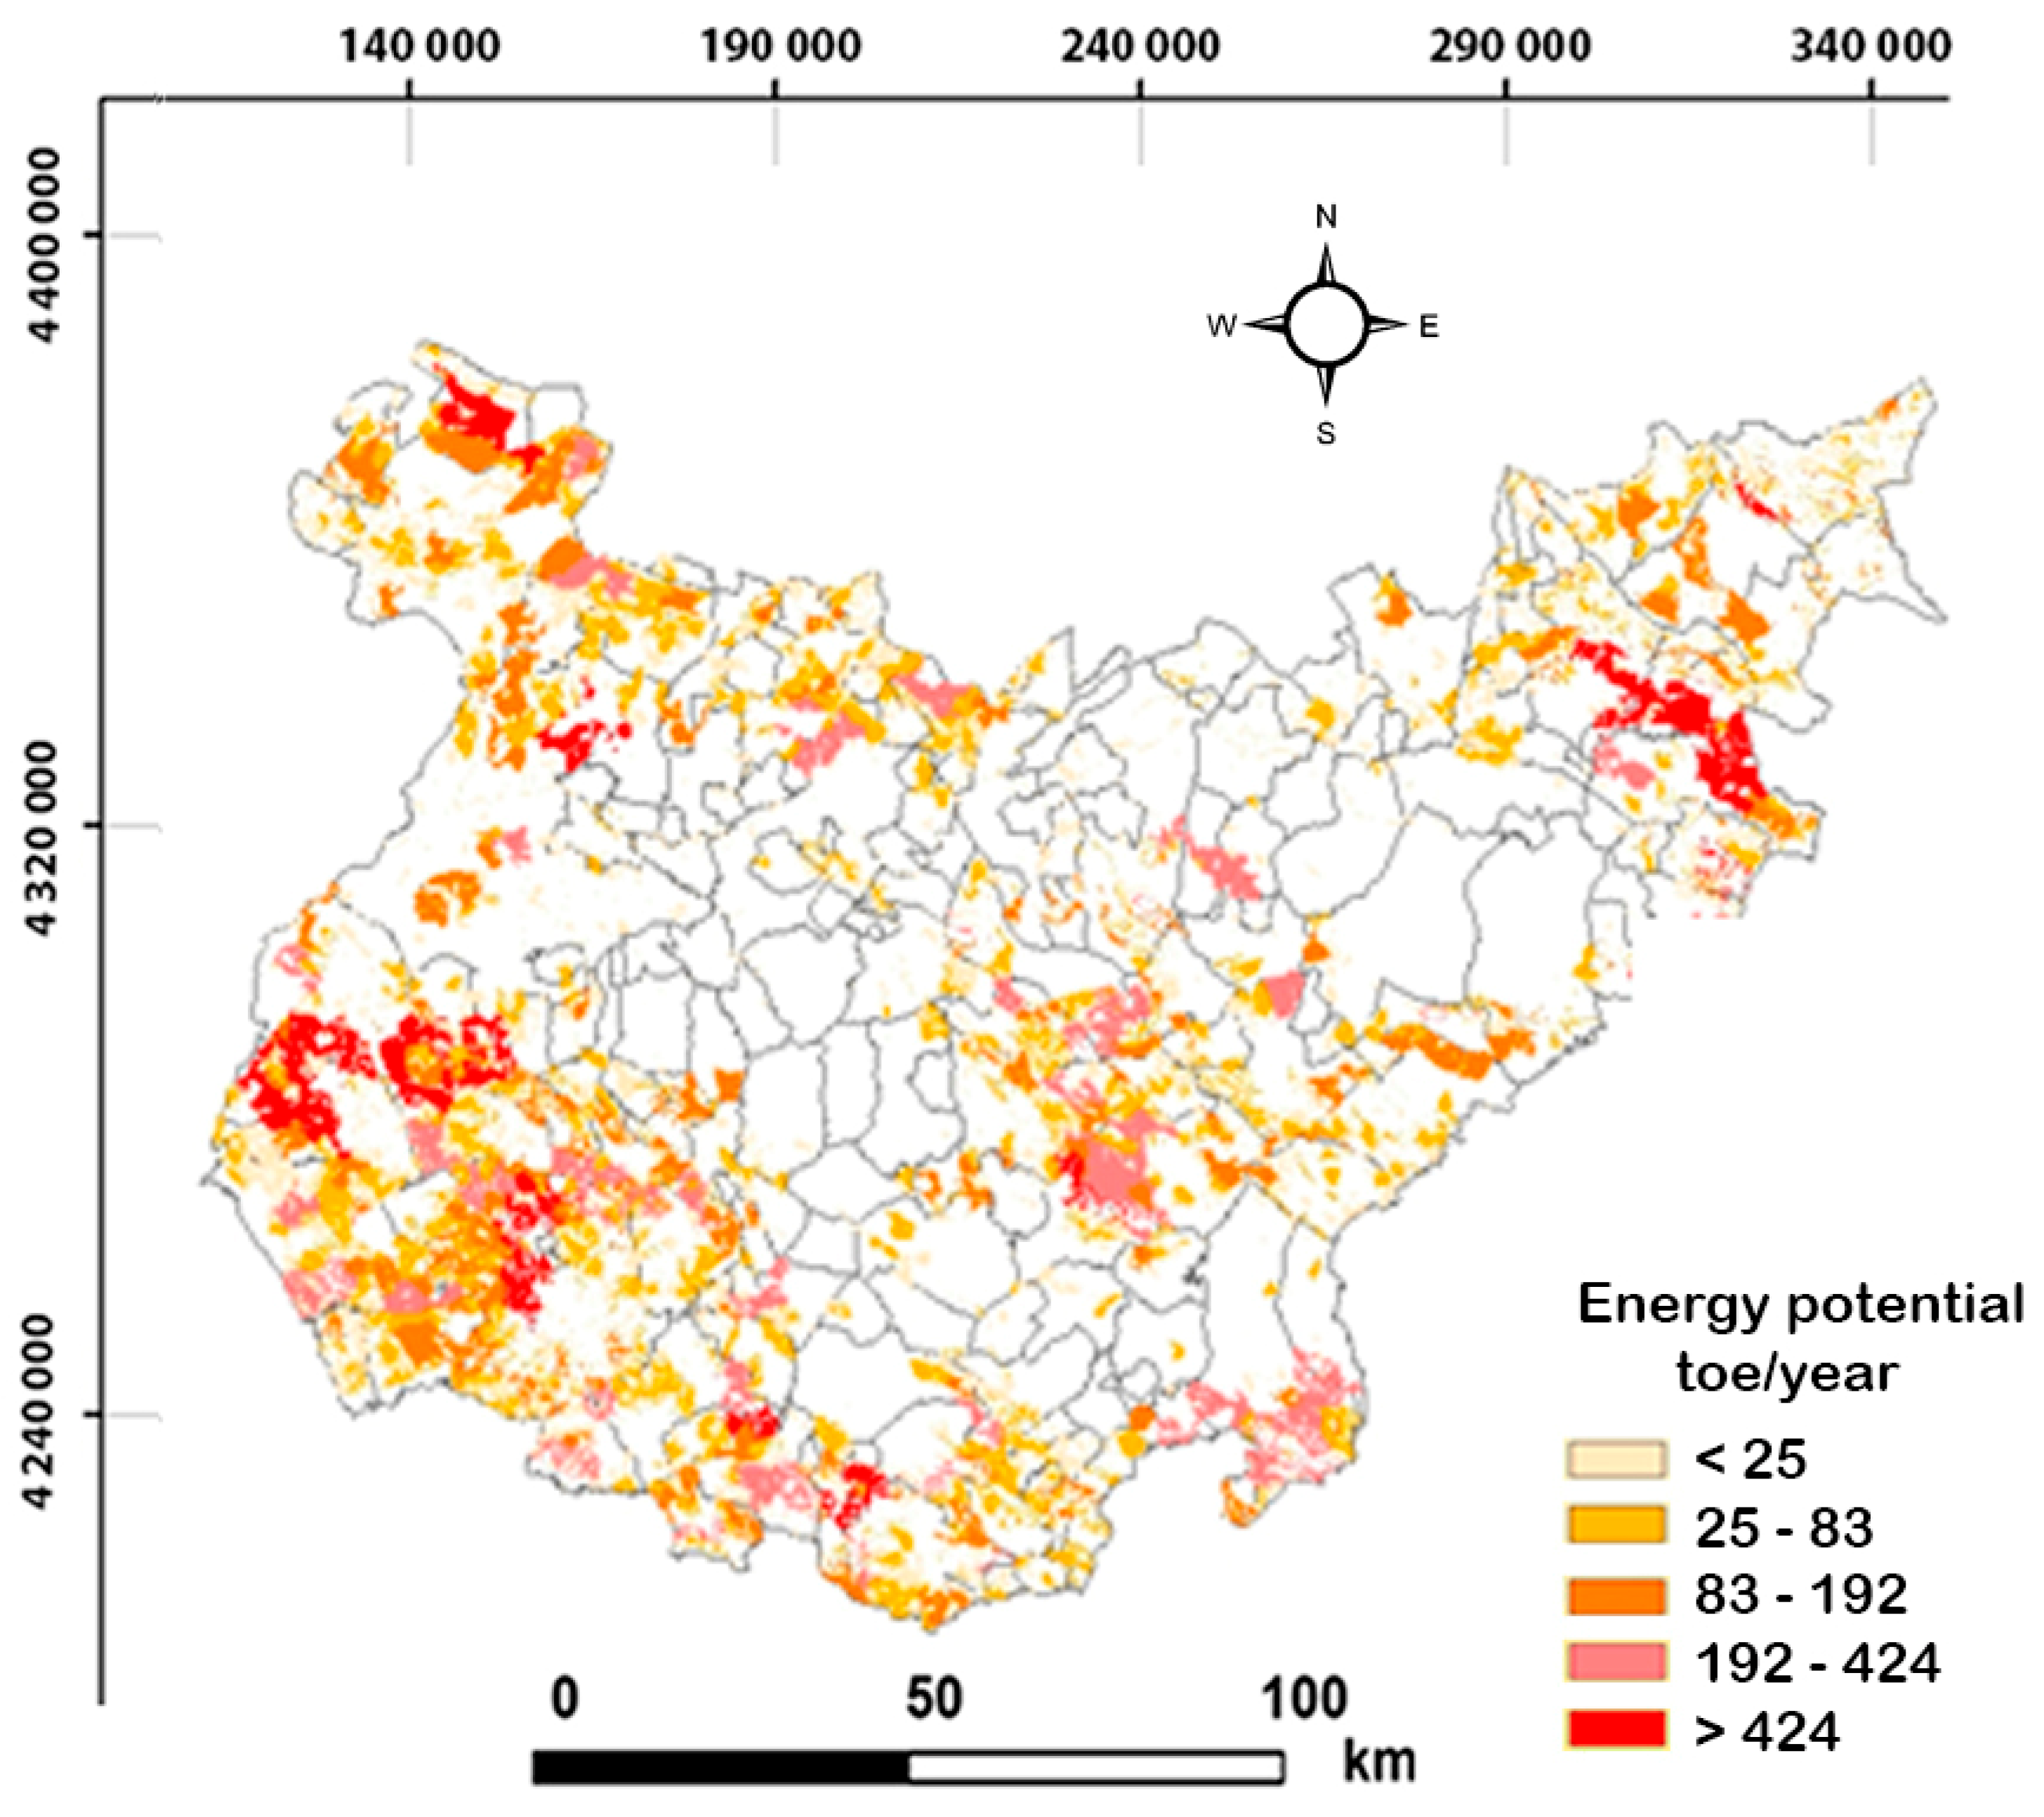
40], which estimated the average cost of biomass extraction at 53 €/dry ton, and the average cost of €7 per transport km. This means that 4 km transport costs €28 per dry ton, an amount that is more than 50% of the total cost, which determines the unfeasibility of extracting the biomass. The results obtained are shown in
Figure 2, were map represents the exploitable area.
The area occupied by protected natural areas belonging to the Red Natura has also been considered. It should be noted, in this regard, that logging and silvicultural treatments are allowed in most of these areas. For these reasons, in a first approximation, the forest biomass of these spaces has been taken into account.
2.2. Determination of Available Forest Biomass
We understand the term forest biomass, in its broadest sense, as the whole forest mass at a given point in time. Stocks and annual increases should be considered. Stocks are defined as the quantity of biomass that exist at the time the forest inventory is made. They are not considered for the calculation of potential due to environmental sustainability issues, as already indicated, so that only annual growth has been included. The purpose of this increase was divided into three different criteria: domestic and industrial use of wood, production of energy and ecological recovery (keeping in mind that woodland is a CO
2 collector and its leaves contribute to soil restoration).
Figure 3 shows several forest biomass types.
It must be highlighted that in this type of region, the dominant area (around 50%) is the dehesa with medium-density wooded vegetation of around 39% covered surface and substrata mainly consisting of pasture species. The remaining soil (11.27%) consists of forests, mainly
pinus pinaster, and scrubland [
41].
The current legislation prohibits the commercial use of this wood in the timber industry, it is only allowed in forestry/silvicultural activities, and their residues can be used for such purposes.
The fractions of trunks and thick branches are normally used as raw material for the timber industry. On the other hand, the leaves must not be picked up so they can help the ecological restoration of the soil. Considering all this, only the branches with diameter below 7 cm were selected for the quantification of the available biomass for energy use. The only exception was the eucalypt, for which all fractions were quantified because clearcutting is allowed and also there is no other current use for such species in our region.
Therefore, although the biomass fractions established are considered, we referred to aerial biomass because the biomass of the radical part is not used, not only for environmental, but also for financial reasons considering the cost of its extraction. Thus, the following biomass fractions are considered:
Tree bole
Branches with a diameter greater than 7 cm R > 7 cm
Branches with diameters between 2 and 7 cm R 2–7 cm
Branches with a diameter less than 2 cm R < 2 cm
Leaves
The methodology was based on calculating the annual increase of forest biomass from branches with a diameter less than 7 cm (including pruning and natural fall), which are what in this article have been defined as estimators of forest biomass. Both calculations and results are grouped by stratum. A stratum characterizes the type of forestry in a given area, depending on the species present, condition of the forestry mass, and the fraction of forest covered. Consequently, it is a statistically homogeneous group, which represents the bulk of biomass generated annually, and is the key variable under study in the work. The mapping information was key to measure the area covered by each species, in order to optimally calculate the biomass it would generate. Each stratum was identified by a number. The geographical distribution of the strata in the province of Badajoz is shown in
Figure 4.
We used a method based on the logarithmic model proposed by Montero et al. [
42], which connects the normal tree diameter (diameter of a tree when measured at a distance of 1.3 m over the average ground level, expressed in cm), with the net dry biomass or any of its fractioning. The logarithmic model is used as Equation (1),
where D
n is the normal diameter, a and b are two specific regression parameters shown in
Table 2, and B is the biomass for each fraction. BT is the total aerial tree biomass, BF is the tree bole biomass, BR
7 and BR
2 are the biomass from branches with a diameter between 2 and 7 cm and less than 2 cm, respectively, BA is the biomass needles, BH is the biomass from leaves and Br is the root biomass. All are expressed in kg of dry matter.
With the objective of eliminate the bias added by logarithmic transformation, the results was multiplied by a correction factors (a and b), that was obtained from the standard deviation of the estimate.
By using Equation (2), we obtained the biomass annual increase. The annual biomass weight increase for a given biomass fraction, species and diametric class was defined by the difference between the dry biomass of two consecutive years.
where D
n is the normal diameter (cm), ID
n is the annual diameter increase (cm) and IB is the annual biomass increase in kg of dry matter.
The increases in the different fractions of annual biomass measured in kg of dry matter per tree, for each species and diametric class, were obtained through an application of their own, using Equations (1) and (2) [
43,
44]. This application was perform in Excel Tables, which allowed all kinds of operations and jobs. Once the growth values are obtained using the previous expressions and tables, it is necessary to calculate the average values corresponding to the different fractions for the 14 broadleaf tree species under study.
The final use of the annual increments, i.e., the fractions previously established, are classified according to the traditional purpose of the different fractions, that is to say:
Domestic and industrial use of wood Tree bole and R > 7 cm.
Energy production 2–7 cm and R < 2 cm.
Ecological recovery Leaves
With the previous scheme, and based on the above Excel tables, the biomass growths available for each stratum are calculated in accordance with the indicated assigned groups. As an example,
Table 1 lists these results for
pinus pinaster.The IFN inventory, for the province of Badajoz establishes the amount of trees per hectare (tree/h). Applying the values we collected above (
Table 2), we obtained the residual forest biomass estimators (y). This is shown in
Table 3 (ton/ha of dry biomass). Therefore, these estimators represent the annual increase of biomass per species and diameter.
The estimators also helped to calculate and map the results using the GIS by assigning these estimators to a particular area of influence composed of cells (cell: enclosed unit with some kind of vegetation cover in the inside, different from the surrounding cover. The cell size can vary, with a minimum surface of 2.5 ha).
The area of each cell was used in order to account for just the available forest biomass. In these areas, those zones with a slope over 20% and/or located further than 4 km from roads or forest tracks were excluded.
It is not intended in this research to determine the total cost precisely. So it only took into account the costs of collection and transport, as a measure to improve the utilization of biomass. The annual amount of dry biomass available, once the estimators were calculated, was obtained by Equation (3):
where
An is the exploitable area in the cell (ha),
yn is the annual residue estimator (ton/ha) and
Qav is the annual amount of available dry biomass in cell
n (ton).
Finally, the stages to determine the available biomass, through GIS, were the following: (i) Importation of the estimators (
Table 4) to the attribute table of the exploitable area layer. (ii) Calculation of the amounts of biomass from the GIS database [
45]. (iii) Graphic representation of the results.
It should be noted that the criteria adopted to quantify the annual production of biomass for energy use were set accounting for the sustainability of the resource over time. Final results should therefore be regarded as conservative.


