Article

Numerical Simulation on Deflecting Hydraulic Fracture with Refracturing Using Extended Finite Element Method

1
Key Laboratory Deep Underground Science and Engineering, College of Architecture and Environment, Sichuan University, Ministry of Education, Chengdu 610065, China
2
CNOOC Research Institute Co. Ltd., Beijing 100028, China
3
Sinopec Petroleum Exploration and Production Research Institute, Beijing 100083, China
*
Authors to whom correspondence should be addressed.
Energies 2019, 12(11), 2044; https://doi.org/10.3390/en12112044
Submission received: 23 April 2019 / Revised: 22 May 2019 / Accepted: 24 May 2019 / Published: 28 May 2019

Abstract

:
Refracturing is a key technology in enhancing the conductivity of fractures from hydraulically-fractured wells. However, the deflecting mechanism of the diverting fracture is still unclear. In this paper, a fully coupled seepage-stress model based on the extended finite element method (XFEM) was developed to realize the deflection mechanism of the refracturing fractures. The modified construction of refracturing was then verified by laboratory experiments. Furthermore, two new deflection angles considering the influence area along initial fracture length were introduced to evaluate the refracturing. The numerical results demonstrated that: (1) lower stress difference, larger perforation angle and longer perforation depth can lead to a higher deflection angle, thereby a more curving propagation path of the diverting fracture; (2) increasing injection rate or fluid viscosity can significantly enhance the diverting behavior; and (3) an initial location near the root of the initial fracture results in a larger value of the deflection angle, which is preferred for far-field refracturing. The conclusions in this study can be a systematic guide for the parameter optimization in refracturing treatment.

1. Introduction

Hydraulic fracturing is an effective way to enhance the simulated reservoir volume to conventional and unconventional reservoirs. In a traditional hydraulic fracturing process, a symmetric fracture initiates from the perforation azimuth angle and forms a preferred hydraulic plane orthogonal to the minimum compressive far-field stress. However, the fracture during refracturing consistently deflects and propagates along an unknown direction with tortuosity trajectories due to the existence of the initial fracture. For deeper propagation of the diverting fracture in the refracturing process, rapid diverting is unexpected. Therefore, understanding the geometries of the diverting fractures is important for a successful refracturing treatment.
At present, a complex fracture network can be estimated by means of utilizing flow-back data analysis and surveillance micro-seismic analysis in the field application [1]. Further, tracer and chemical analysis [2,3] also were used to evaluate the complexity of fracture network. However, for clear visualization of the fracture geometry and propagation path, micro-seismic analysis has obvious advantages. Previous studies [4,5] showed that fracture diversion typically occurs due to the interference stress of multi-fractures, especially in the process of refracturing and fracturing in a horizontal well. Depending on the purpose, refracturing treatment can be applied to realize the far-field or near-wellbore diversion of the fractures. So far, several scholars have investigated the influence of the plugging and diverting technology on the deflecting geometries of refracturing fractures [6,7]. Laboratory fracturing experiments have been widely used to investigate the propagation behavior of refracturing hydraulic fractures [8,9,10,11]. True tri-axial laboratory experiments were developed for parametric studies including perforation parameters, injection rate, fracture width, and horizontal stress difference, which were related to the fracture reorientation during the refracturing process. Various behaviors of the deflecting fractures were observed in experiments which are the important support for the field application. However, these simulation results deviate from the real-field application due to excessive assumptions and simplifications. Hence, a fully coupled method for simulating fracture deflection during refracturing should be developed to evaluate the refracturing fractures.
Various numerical models have been employed to simulate hydraulic fracturing behavior under complex geological circumstances, including boundary element method (BEM) [12,13,14], discrete element method (DEM) [15,16], and finite element method (FEM) [17,18]. Furthermore, an extensive method based on FEM called extended finite element method (XFEM) [19,20] has been rapidly developed as it has the advantage of avoiding re-meshing during fracture analysis. However, BEM, DEM, and FEM could not achieve an efficient deflection of the fracture, due to the limitation in the mesh shape. For DEM and FEM, the trajectories of the fracture are restricted within the predefined elements requiring a high refining to guarantee an accurate propagation path. XFEM has a clear advantage in modeling fracture deflection comparing with the other method [21], even difficulties in calculation appear when a large amount of natural fractures exist.
Qi et al. [22] represented a fully-coupled model based on FEM considering the seepage-stress in the oriented perforation refracturing model. However, the fluid flow within the fracture was seemingly ignored, which decreased the accuracy. Wang et al. [23] used the XFEM model to simulate the propagation of refracturing fractures described clearly in the fracture diversion under a complex stress state. Nevertheless, all diverting fractures were assumed to initiate from the flaws perpendicular to the direction of the in situ maximum horizontal stress. However, this does not correspond to the field application. Furthermore, far-field diverting could not be achieved due to the limitation of this model. Therefore, a fully-coupled model that can simulate the arbitrary initiation and deflection of the refracturing should be established extensively.
In this study, a fully seepage-stress coupling model based on XFEM was developed to model the diverting fractures in the refracturing process. The accuracy of this model was verified by using the commercial software ABAQUS and experiments [24,25,26]. An improved model with initial fracture was introduced to analyze the influence of geological data and hydraulic fracturing treatment, including the perforation azimuth angle, perforation depth, injection rate, fluid viscosity, horizontal stress difference, and far-field location of fracture initiation. According to the simulation results, the optimization of the refracturing application parameters can be proposed for a successful fracturing treatment.

2. Numerical Model

A fully coupled hydraulic fracturing model is complex due to seepage-stress coupling, fracture propagation and fluid flow within fractures. Furthermore, various parameters of geology and field treatment should be taken into consideration to describe the geometry of fractures. Therefore, a set of governing equations were established to model the whole fracturing process in the following parts.

2.1. Governing Equations of Seepage-Stress

The solution of the stress field in our seepage-stress model was expressed through the virtual work principle. The virtual work within a unit time is equal to the total virtual work from the body force and surface force [27]. The stress equilibrium equation can be described as:
V ( σ p w I ) : δ ε d V = V f · δ u d V + S τ · δ u d S
where σ is effective stress; pw is the pore pressure of fracture flow; I is the unit matrix; f and τ represent the body force and surface force, respectively; δε and δu are the virtual strain and displacement, respectively.
The equilibrium equation can be summarized as Equation (2) when the behavior of seepage-stress is considered [28]:
V δ ε T D e p d ε d t d V + V δ ε T D e p [ m ( s o + p o ε ) 3 K s d p o d t ] d V V δ ε T m ( s o + p o ξ ) d p o d t d V = V δ u T d f d t d V + S δ u T d τ d t d S
where Dep is the matrix of elastic and plastic; t is the time and m = [1,1,1,0,0,0]T; KS is the modulus of compression within rock particle; so is saturation of rock; ξ = dso/dpo shows the relation between saturation and pressure; po is the pressure in the porous media; dV and dS are the micro unit for the body and surface, respectively.
The rock is modeled as a finite porous medium by using the finite element method. Liquid can flow through the solid phase coupling seepage-stress. According to the conservation of mass, the fluid mass within the rock is equal to the difference value between the fluid volume flowing in and out. All fluid flow within rock was assumed to conform to Darcy’s law. The continuity equation can be concluded as:
s o ( m T m T D e p 3 K S ) d ε d t T [ k 0 k r ( p o ρ o g ) ] + { ξ n + n s o K o + s o [ 1 n 3 K S m T D e p m ( 3 K S ) 2 ] [ ( s o + p o ξ ) ] } d p o d t = 0
where k0 is the product of initial permeability and fluid density; ρo, kr and g represent the fluid density, permeability coefficient and vector of gravity accelerated velocity, respectively; n and Ko are the porosity and fluid volume modulus within rock massive, respectively.
Combining Equations (2) and (3), the seepage-stress model in XFEM can be solved by Equation (4). This equation considered the fully coupled factors including stress, strain, displacement, porosity, fluid leak-off coefficient, and saturation. This law can be expressed as:
[ K C E G ] d d t { u ¯ p o ¯ } + [ 0 0 0 F ] { u ¯ p o ¯ } = { d f d t f ¯ }
K = V B T D e p B d V C = V B T D e p m ( s o + p o ε ) 3 K s N p d V V B T ( s o + p o ξ ) m N p d V E = V N p T [ s o ( m T m T D e p 3 K S ) B ] d V F = V ( N p ) T k k r N p d V G = V N p T { s o [ ( 1 n 3 K S m T D e p m ( 3 K S ) 2 ) ] · ( s o + p o ξ ) + ξ n + n s o K o } N p d V d f = V N u T d f d V + S N u T d τ d S f ¯ = S N p T q o b d S V ( N p ) T k k r g d V
where the qob is the fluid volume on the boundary.

2.2. Approximation of Extended Finite Element Method (XFEM)

XFEM is an extensive numerical method based on the traditional finite element which can only simulate a predefined fracture path in fracture analysis [29]. In XFEM, enriched elements with additional virtual nodes was introduced to model the crack fracture as shown in Figure 1. Furthermore, new “edge-phantom nodes” within the edges also enable the solution of fracture flow and the pore pressure at the bottom and top surface are interpolated by attaching the pore pressure degrees of freedom at the real corner nodes and the phantom nodes. The displacement field u was approximated into three parts by discretization of the equilibrium equation. Two types of enrichment shape functions were also added to describe the property of the fracture and fracture tip. The displacement field u can be then concluded as follows [30]:
u = I S a l l N I u ( x ) u I + I S f r a c N I u ( x ) H ( x ) a I + I S t i p N I u ( x ) l = 4 4 F l ( x ) b I l
where Sall, Sfrac and Stip are the sets of all ordinary nodes, Heaviside enrichment nodes and fracture-tip enrichment nodes, respectively; uI is node degrees of freedom in traditional finite element; aI and blI represent the enrichment nodal degrees of freedom for fracture and crack-tip, respectively; NuI is the standard finite shape function of node I. H(x) is the enrichment shape jump function; Fl is the singular displacement field around the facture tip.
The jump function H that describes the displacement behavior of Heaviside enriched nodes (Figure 1) can be written as:
H ( x ) = { 1 , if   ( x x ) n 0 1 , x < 0
where x is Gauss point and x* is the point on the crack closet to x; n is the unit vector normal to the crack at x*; The values H(x) = 1, or −1 represent the opposite sides on the crack wall.
The asymptotic crack-tip function Fl(x) was employed to calculate the field displacement around the crack-tip. The function based on the asymptotic feature takes the general form [31]:
F l ( x ) = [ r s i n θ 2 , r s i n θ 2 s i n θ , r c o s θ 2 , r c o s θ 2 c o s θ ]
where r and θ are the polar coordinates at the crack tip with its original coordinate system.

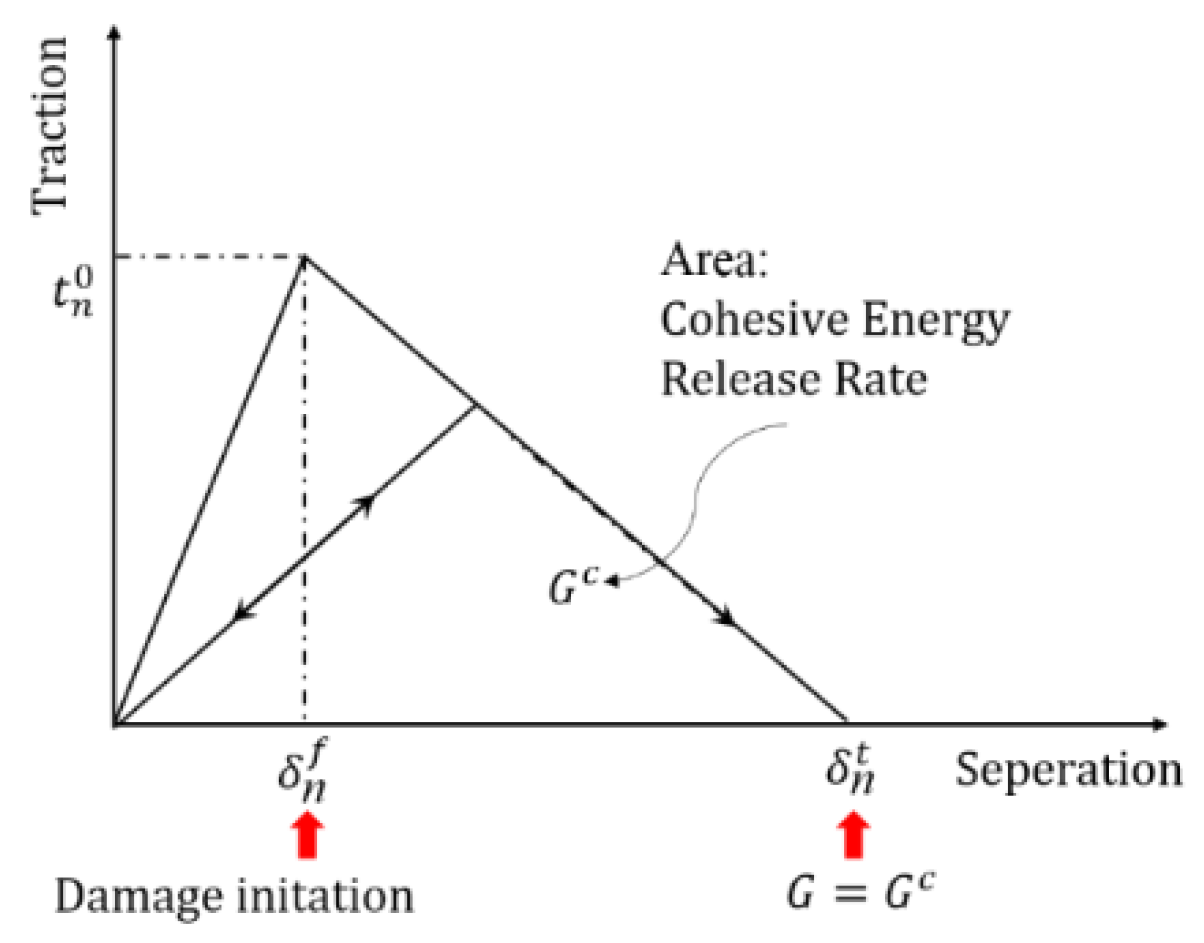
2.3. Crack Initiation and Damage Evolution

Using XFEM based on the cohesive zone method (CZM) to model the hydraulic fracture was more suitable for field application due to the evident advantage of modeling fractures in quasi-brittle rocks [32]. Furthermore, the CZM model can realize fully coupled pore pressure-stress in the rock and allow arbitrary propagation while considering the fracture tip viscosity. It can also describe the fracture initial loading, initial damage, and damage evolution [33,34]. Meanwhile, the traction-separation law based on CZM was applied to model hydraulic fracturing as shown in Figure 2.
Based on the CZM model, the damage initiated when the stiffness of the cohesive zone degenerated into a critical value. The process began when the initial stress or strain conformed to the chosen special initiation criteria. In this model, the maximum principal stress criterion was adopted:
f = { σ m a x σ m a x 0 }
where σ0max represents the maximum allowable principal stress; the symbol 〈〉 is the Macaulay bracket which does not initiate the damage in pure compressive conditions; it assumes that damage will initiate when the stress ratio f reaches the value of 1.
After the initiation of the fracture, a special criterion was applied in describing the fracture evolution. The Benzeggagh–Kenane (BK) fracture criterion is an energy release law most accepted in modeling fracture propagation. The BK law [35] can be expressed as:
G n c + ( G s c G n c ) ( G s + G t G n + G s + G t ) η = G c
where G n , G s and Gt represent the energy release rate of one normal and two shear direction, respectively. The superscript c expresses critical energy release rate, and the η is a constant of material property. In this criterion, the energy release rate of the two shear directions should be equal.
The traction-separation law was introduced to describe the relationship between damage and stress. Both normal and shear stress were taken into consideration and were affected by the process of fracture damage. The normal and shear stress component can be describe as follows [36]:
t n = { ( 1 D ) t ¯ n , t ¯ n 0 t ¯ n , t ¯ n < 0
t s = ( 1 D ) t ¯ s
t t = ( 1 D ) t ¯ t
where t ¯ is the stress component in traction separation behavior without damage and t is the stress component in the process of damage. Here, the index n, s, t represent the normal stress and the two shear stress, respectively. D is the damage variable which represents the average overall damage. No damage occurs (D = 0) at the beginning of the simulation. In addition, full degradation of the cohesive element at all integration points happens (D = 1), which means a zero load carrying capacity for these elements.
The evolution of damage variable, D, took the regular form with the following [37]:
D = δ m f ( δ m max δ m 0 ) δ m max ( δ m f δ m 0 )
where δ m f and δ m 0 are the displacement at the complete failure and the initial opening before the damage occurs, respectively; δ m max is the maximum displacement in the history of loading.

2.4. Fluid Flow within the Fracture

Two types of flow patterns (Figure 3) were presented in the cohesive zone including the normal and tangential flow within the opening gap. The continuity flow was assumed to be an incompressible full-Newtonian fluid. Pore pressure on the fracture surface was simulated by introducing the pore pressure node in the enrichment elements. This improvement realized the seepage in the reservoirs.
The tangential flow formulated from the Poiseuille can be described by the following equation [38]:
q f = w 3 12 μ p f
where qf is the fluid rate of tangential flow; w is the fracture width; μ is the fluid viscosity; p f is the gradient of pressure.
The difference with fracturing fluid pressure controls the seepage behaviors between fracture and porous medium. The normal flow introduced the two fluid leak-off coefficients can be described as follows:
q t = c t ( p i p t ) q b = c b ( p i p b )
where qt and qb are the fluid rate permeating into the up and side surfaces, respectively; ct and cb are the leak-off coefficients for the top and bottom cohesive layers, respectively; pt and pb are the pore pressure on the top and bottom surfaces, respectively; pi is the pore pressure in the middle of the fracture.

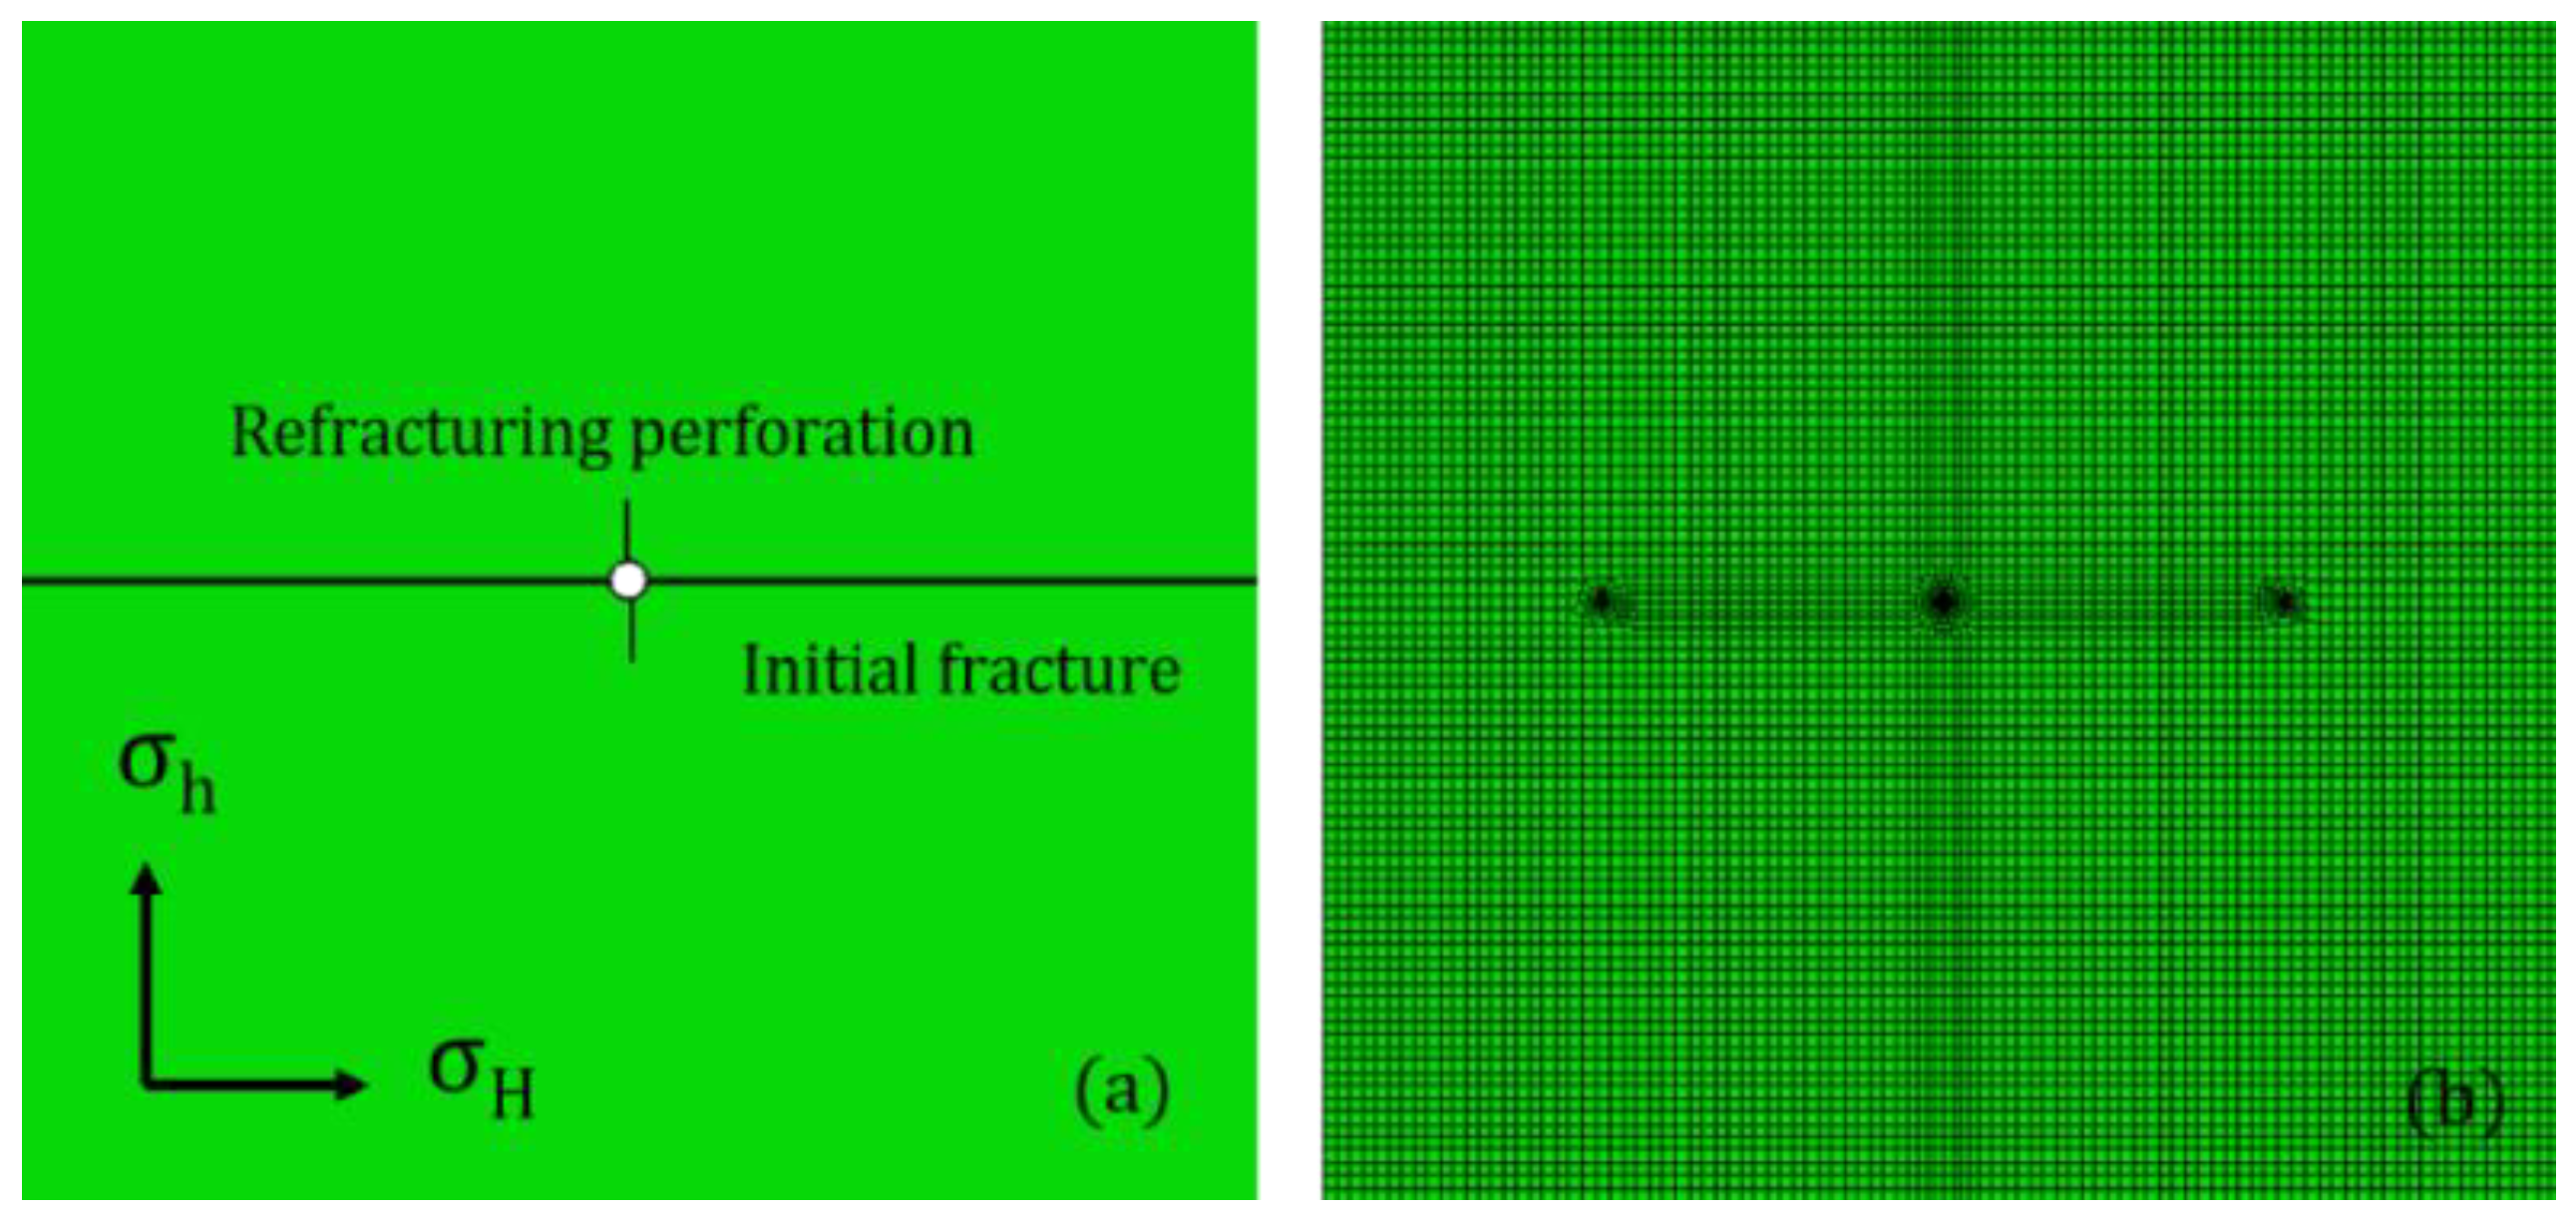
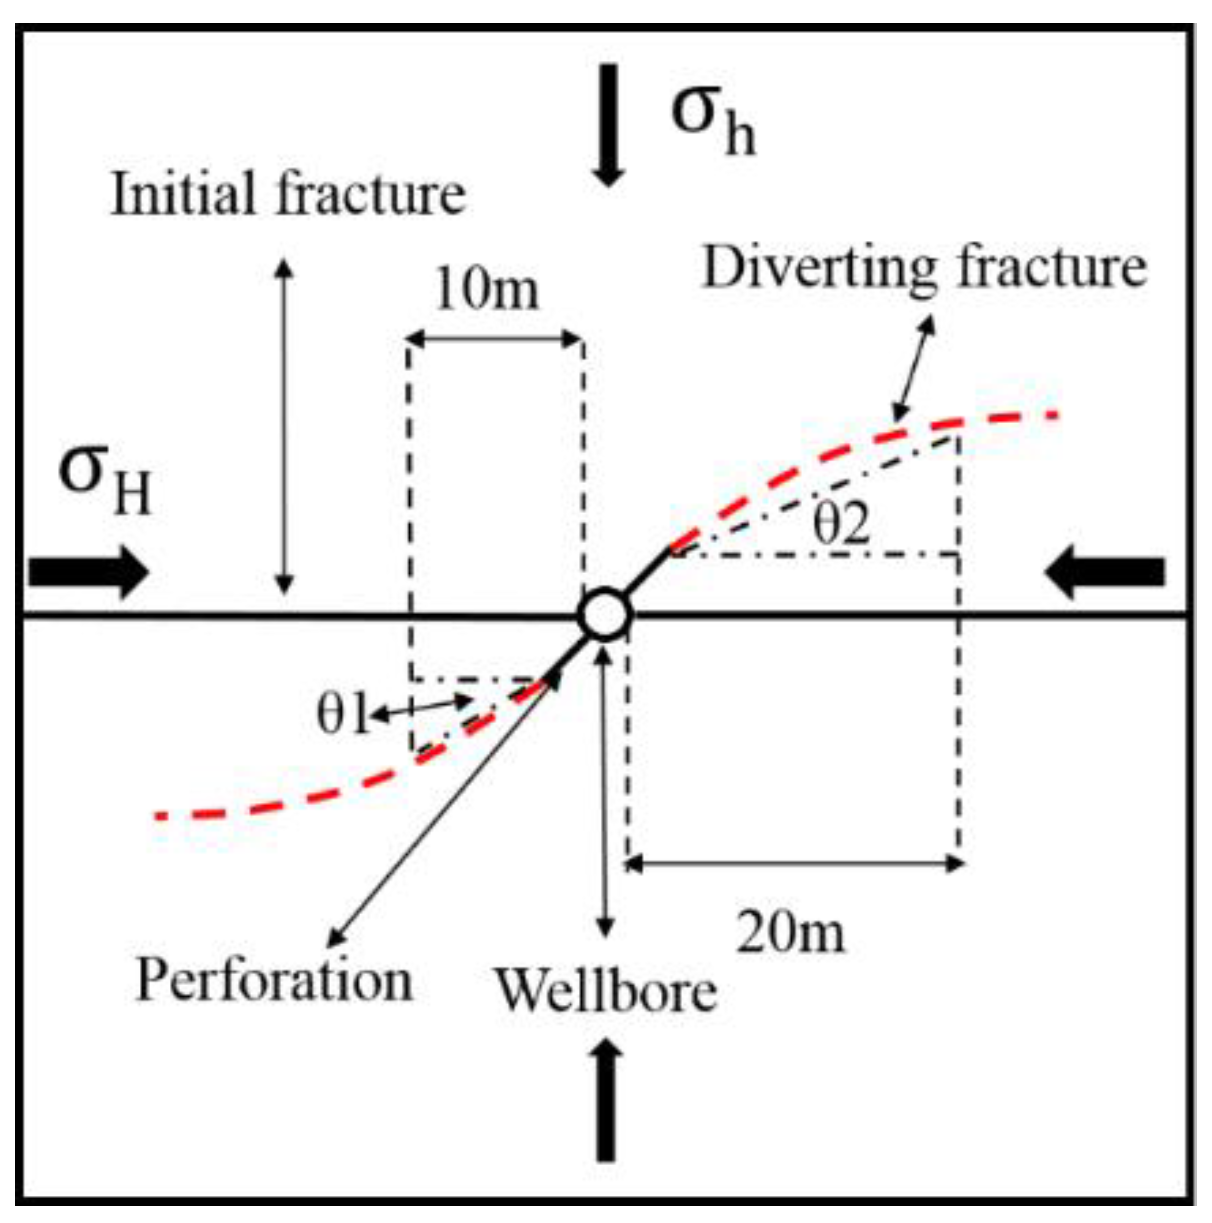
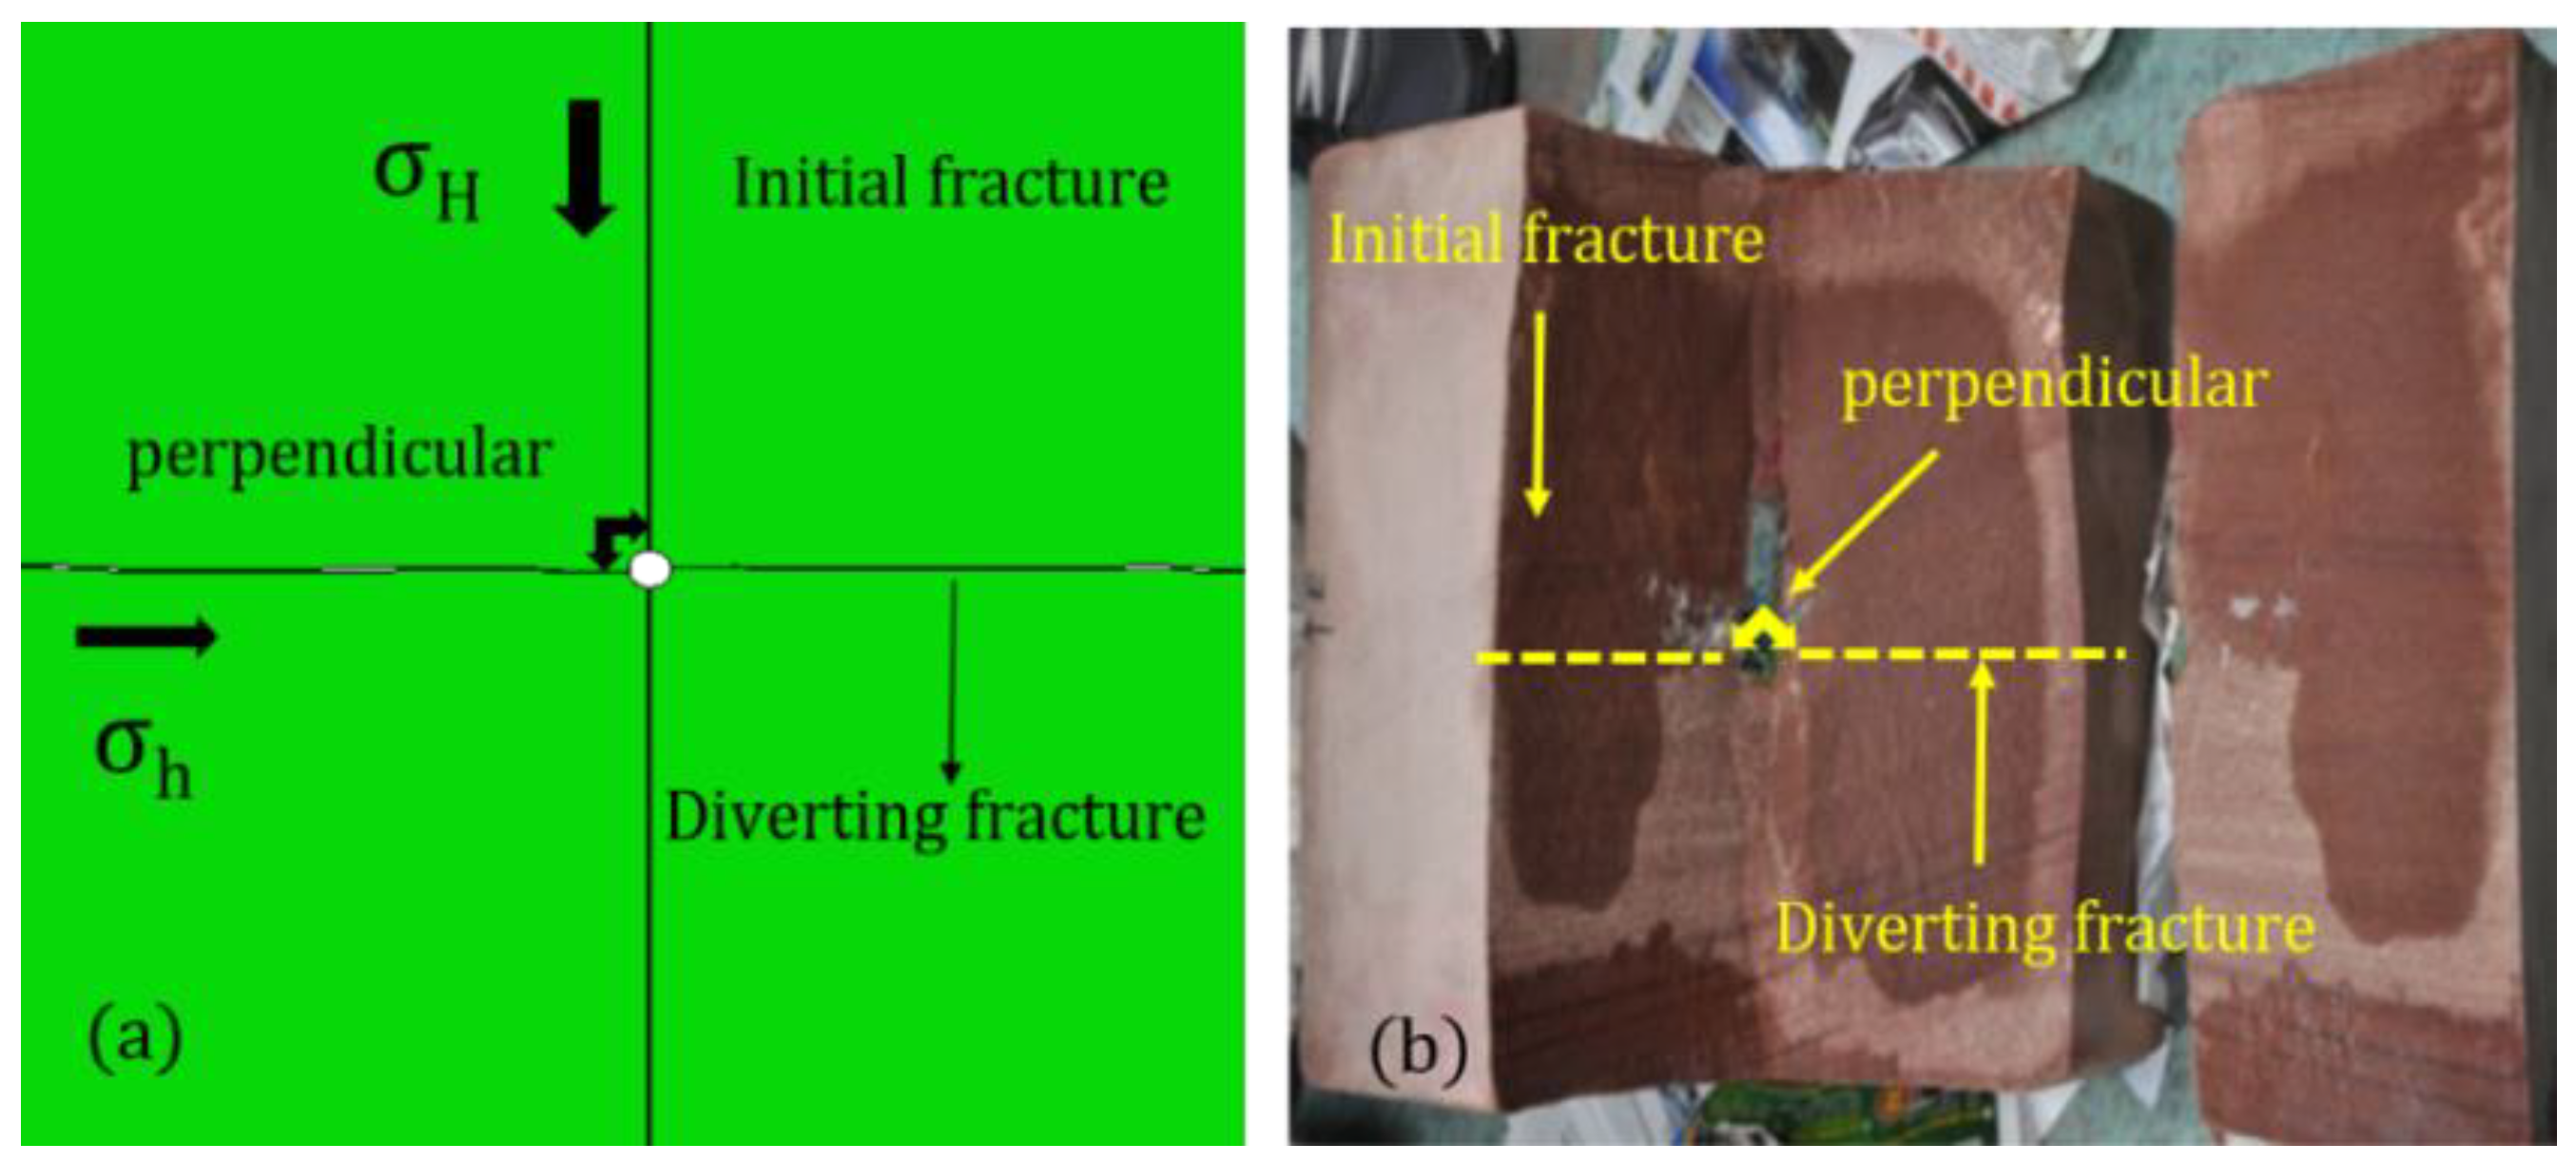
3. Model Construction and Verification

To simulate the deflecting geometries of refracturing diverting fracture, a new 2D (seen in Figure 4) construction was developed. One pair of the initial fracture with a constant width of 10 mm and a length of 40 m was predefined to model the first-stage hydraulic fractures. A fully coupled model based on XFEM, which considers the pore pressure property of rocks, refined the meshes for high accuracy of the fracture propagation. Therefore, 28,274 elements of 4-node plain strain with pore pressure (CPE4P) were applied to realize the rock deformation coupling pore-elasticity. The XFEM coupling pore-pressure was solved by the ABAQUS standard solver. Using the geostatic and soil analysis step, a fully coupled seepage-stress simulation was realized. The model extended to 200 × 200 m to eliminate the influences of out boundary. Other parameters, such as geology and fracturing treatment, along with the mechanical parameters from the test data by Qu et al. [39], are shown in Table 1. Constant pore-pressure was applied on the outer boundary and initial fracture surface to model the stabilized condition after the first-stage fracturing. The initial fracture nodes were fixed to simulate the prop of proppant, which generates a high conductivity channel for the fracturing flow. Similarly, the displacement freedom degree of the outer boundaries was fixed to obtain an equilibrium state.
To ensure an accurate description of the refracturing fracture, this study employed four assumptions to the model: (1) the property of formation is homogeneous without preexisting natural fractures; (2) an initial fracture with fixed displacement degree of freedom was introduced to model the prop of the proppant; (3) constant pore-pressure was applied in the entire model to simulate a stable state of pressure after the first-stage fracturing; and (4) the initial fracture with a constant width of 10 mm propagated along the direction of the maximum horizontal stress. All aforementioned assumptions agreed well with the field application and laboratory experiment.
To evaluate the capability of the model to simulate the deflection of refracturing hydraulic fracture, the deflection angle considering the influence area of the initial fracture was defined using the following procedure (Figure 5): (1) the end point of the perforation was set as the initial node; (2) a line measuring a half-length (20 m) or quarter length (10 m) of the initial fracture and parallel to the final deflecting direction of diverting fracture was drawn from the initial node; (3) vertical lines from the half-length node or quarter-length node were drawn to intersect with the diverting fracture; and (4) the initial and intersection nodes were connected. The two deflection angles can be obtained as θ1 and θ2. Compared to the traditional concept of the diverting radius, the two deflection angles express its influence along the length of the initial fracture.
To verify the capabilities of the modified construction in modeling refracturing, the simulation results were compared with the laboratory experiment as shown in Figure 6. The laboratory results used-stress in three directions namely the vertical stress σv = 15 MPa, maximum horizontal stress σH = 7.5 MPa and minimum horizontal stress σh = 5 MPa. The fracturing fluid was injected at a value of 10 mL/min. Parameters presented by Wang et al. [40] were used as a reference. Figure 6 shows that the numerical result was similar to that of the experiment in which the diverting fracture nearly propagated perpendicularly to the initial fracture with a stress difference of 2.5 MPa. Furthermore, the capability of the XFEM model in modeling hydraulic fracture diverting was verified by several researchers [41]. Therefore, the new modified model based on XFEM can be used to simulate the fracturing reorientation in the refracturing process.

4. Results and Discussion

To provide a precise description of refracturing fractures, six sets of hydraulic models were established to understand the sensitivity of the different factors. The simulations thoroughly investigated the perforation azimuth angle, perforation depth, injection rate, fluid viscosity, fracture initiate location, and horizontal stress difference. Different geometries and diverting behaviors of refracturing fractures were achieved in various simulation conditions.

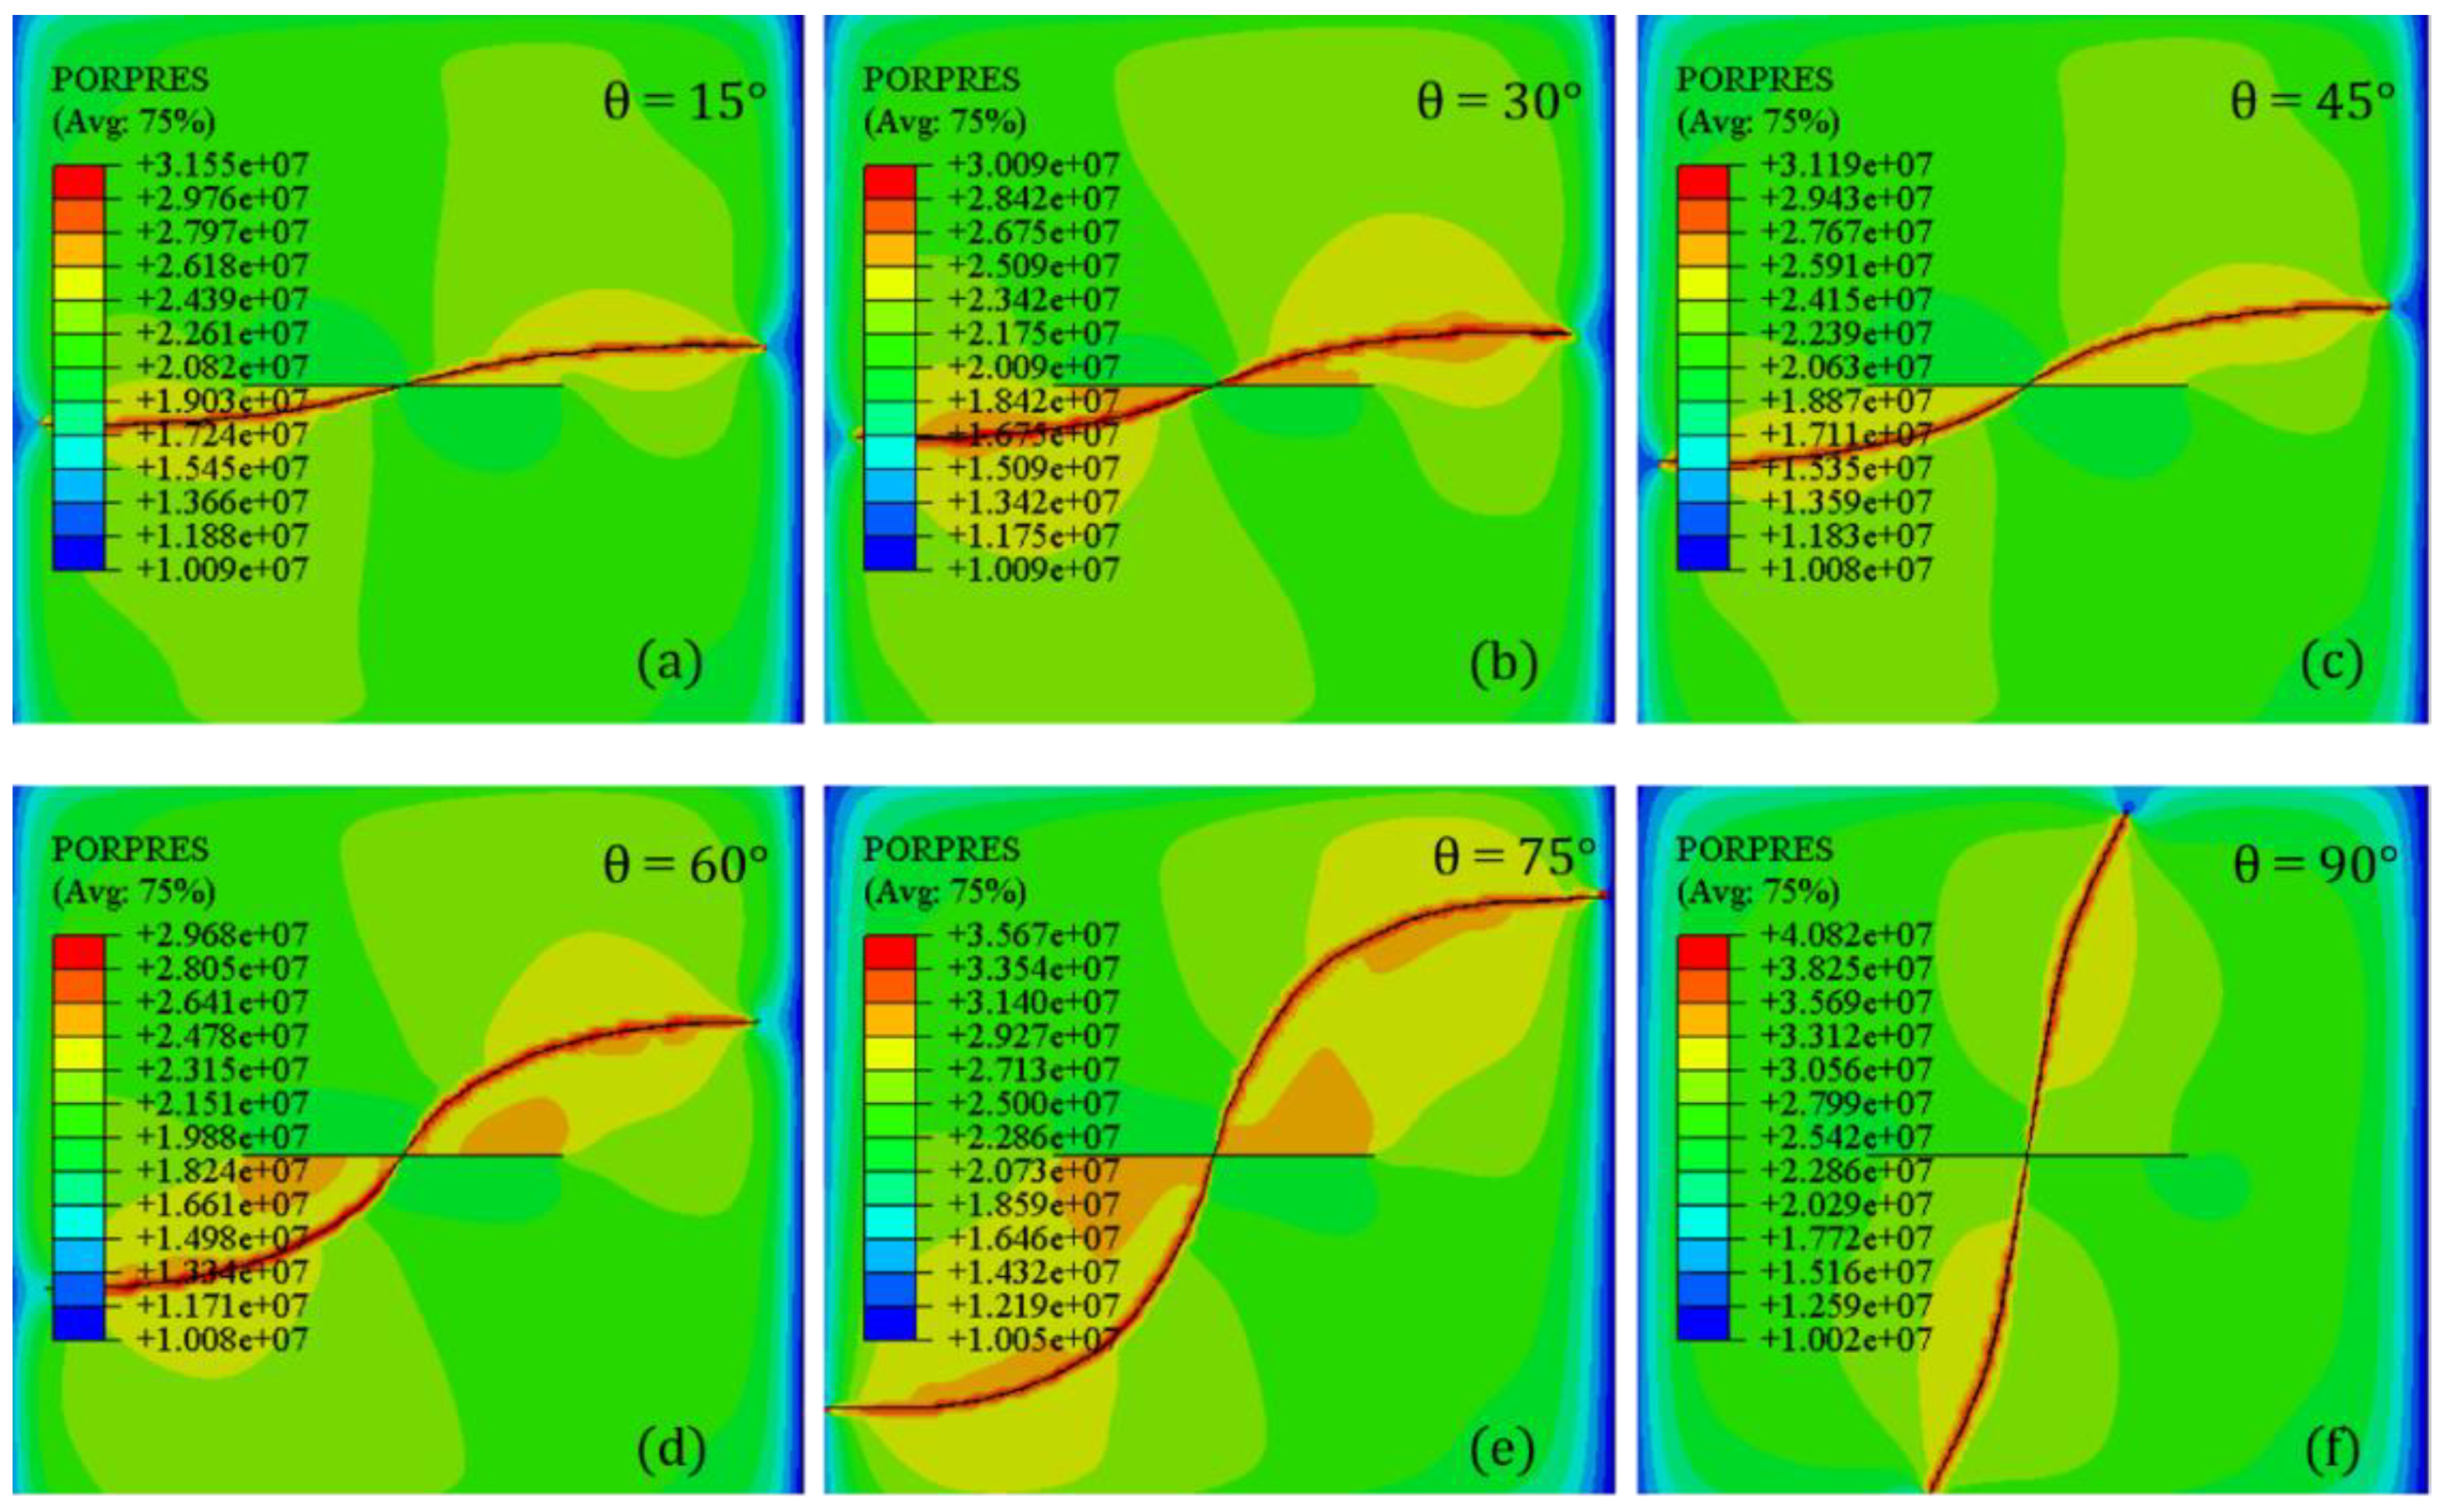
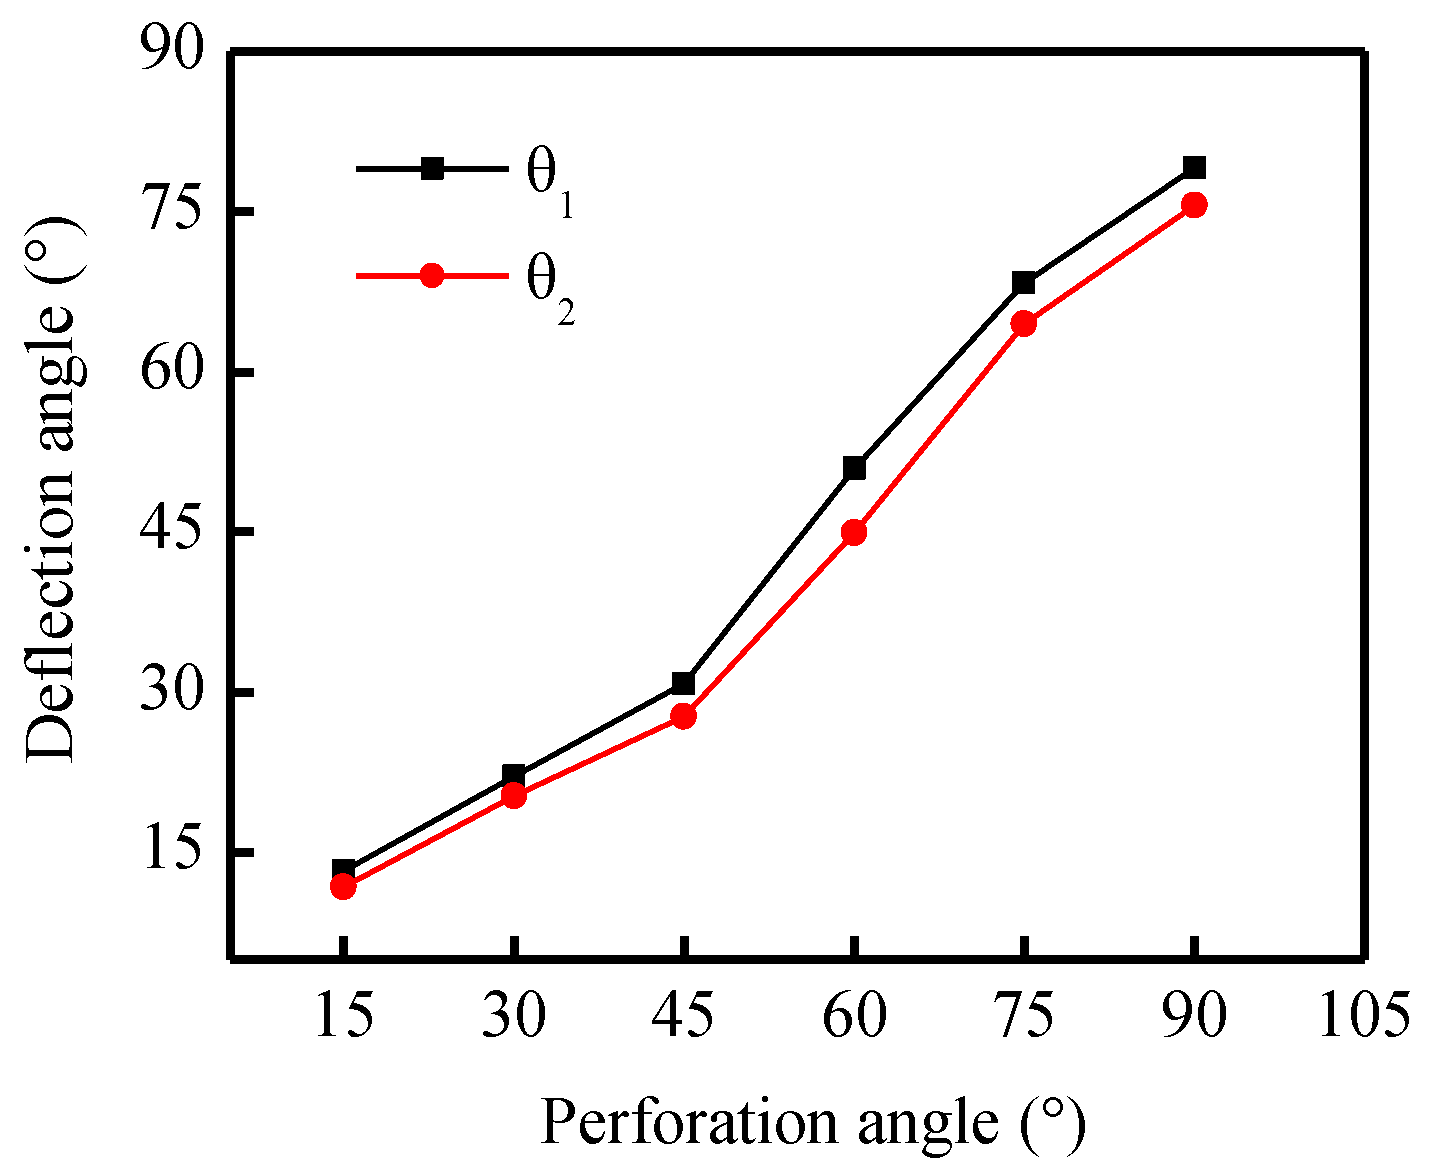
4.1. Perforation Azimuth Angle

Owing to its strong guidance for fracture initiation, oriented perforating has been a key technology in horizontal and vertical hydraulic fracturing. As shown in Figure 7, different perforation azimuth angles θ = 15°, 30°, 45°, 60°, 75°, and 90° were simulated in the refracturing models. The perforation depth, injection rate, fluid viscosity, and horizontal stress difference were fixed with the values of L = 0.5 m, Q = 7 × 10⁻⁴ m3/s, μ = 1 mpa·s and ∇σ = 6 MPa, respectively. The result showed the significant influence of perforation azimuth angle on the diverting fracture propagation behavior. In traditional hydraulic fracturing, fracture propagates in the direction of the minimum resistance to attain the lowest propagation pressure within the fracture. For the refracturing process, the second fracture tends to propagate orthogonally to the in situ maximum horizontal stress near the wellbore with a high stress difference of 6 MPa. An obvious alteration of in situ stress due to the proppant initial fracture was indicated.
Figure 7 demonstrates the difficulty of the deflection of diverting fractures as of perforation azimuth angle increased and finally reorient to the direction of the maximum horizontal stress. This is due to the propped initial fracture which can reorient the direction of in situ stress in a finite area. In this area, the different perforation azimuth angle can change the propagation patterns. Therefore, the perforation azimuth angle only affected the fracturing operation during the early stage of the fracturing process [42]. The diverting fracture rapidly completed the deflection process when the perforation angle was less than 60°. When θ = 90°, the diverting fracture propagated nearly perpendicularly to the initial fracture near the wellbore and evidently deflected when the fracture extended far from the initial fracture. This indicates that the horizontal stress difference decreases due to the reorientation of the stress field leading to a deeper propagation from a higher perforation azimuth angle. Therefore, perforating should be operated at a high azimuth angle for deeper propagation of diverting fracture.
To investigate the diverting behaviors in refracturing, the relationship between the perforation azimuth angle and defection angle is displayed in Figure 8. The deflection angles of θ1 and θ2 increased as the perforation azimuth angle increased. While the difference was minimal between θ1 and θ2, the maximum difference of 6.1° was obtained with an azimuth angle of 60°. Hence, a higher perforation azimuth angle can result in a more curving diverting fracture and longer propagation distance from the initial fracture which is expected in the refracturing treatment. Based on the results, a higher perforation azimuth angle is recommended in the relative condition of stress difference. In the meantime, the reduction of the perforation azimuth angle can result in a rapidly diverting and shorter propagation which is undesirable in the field treatment.

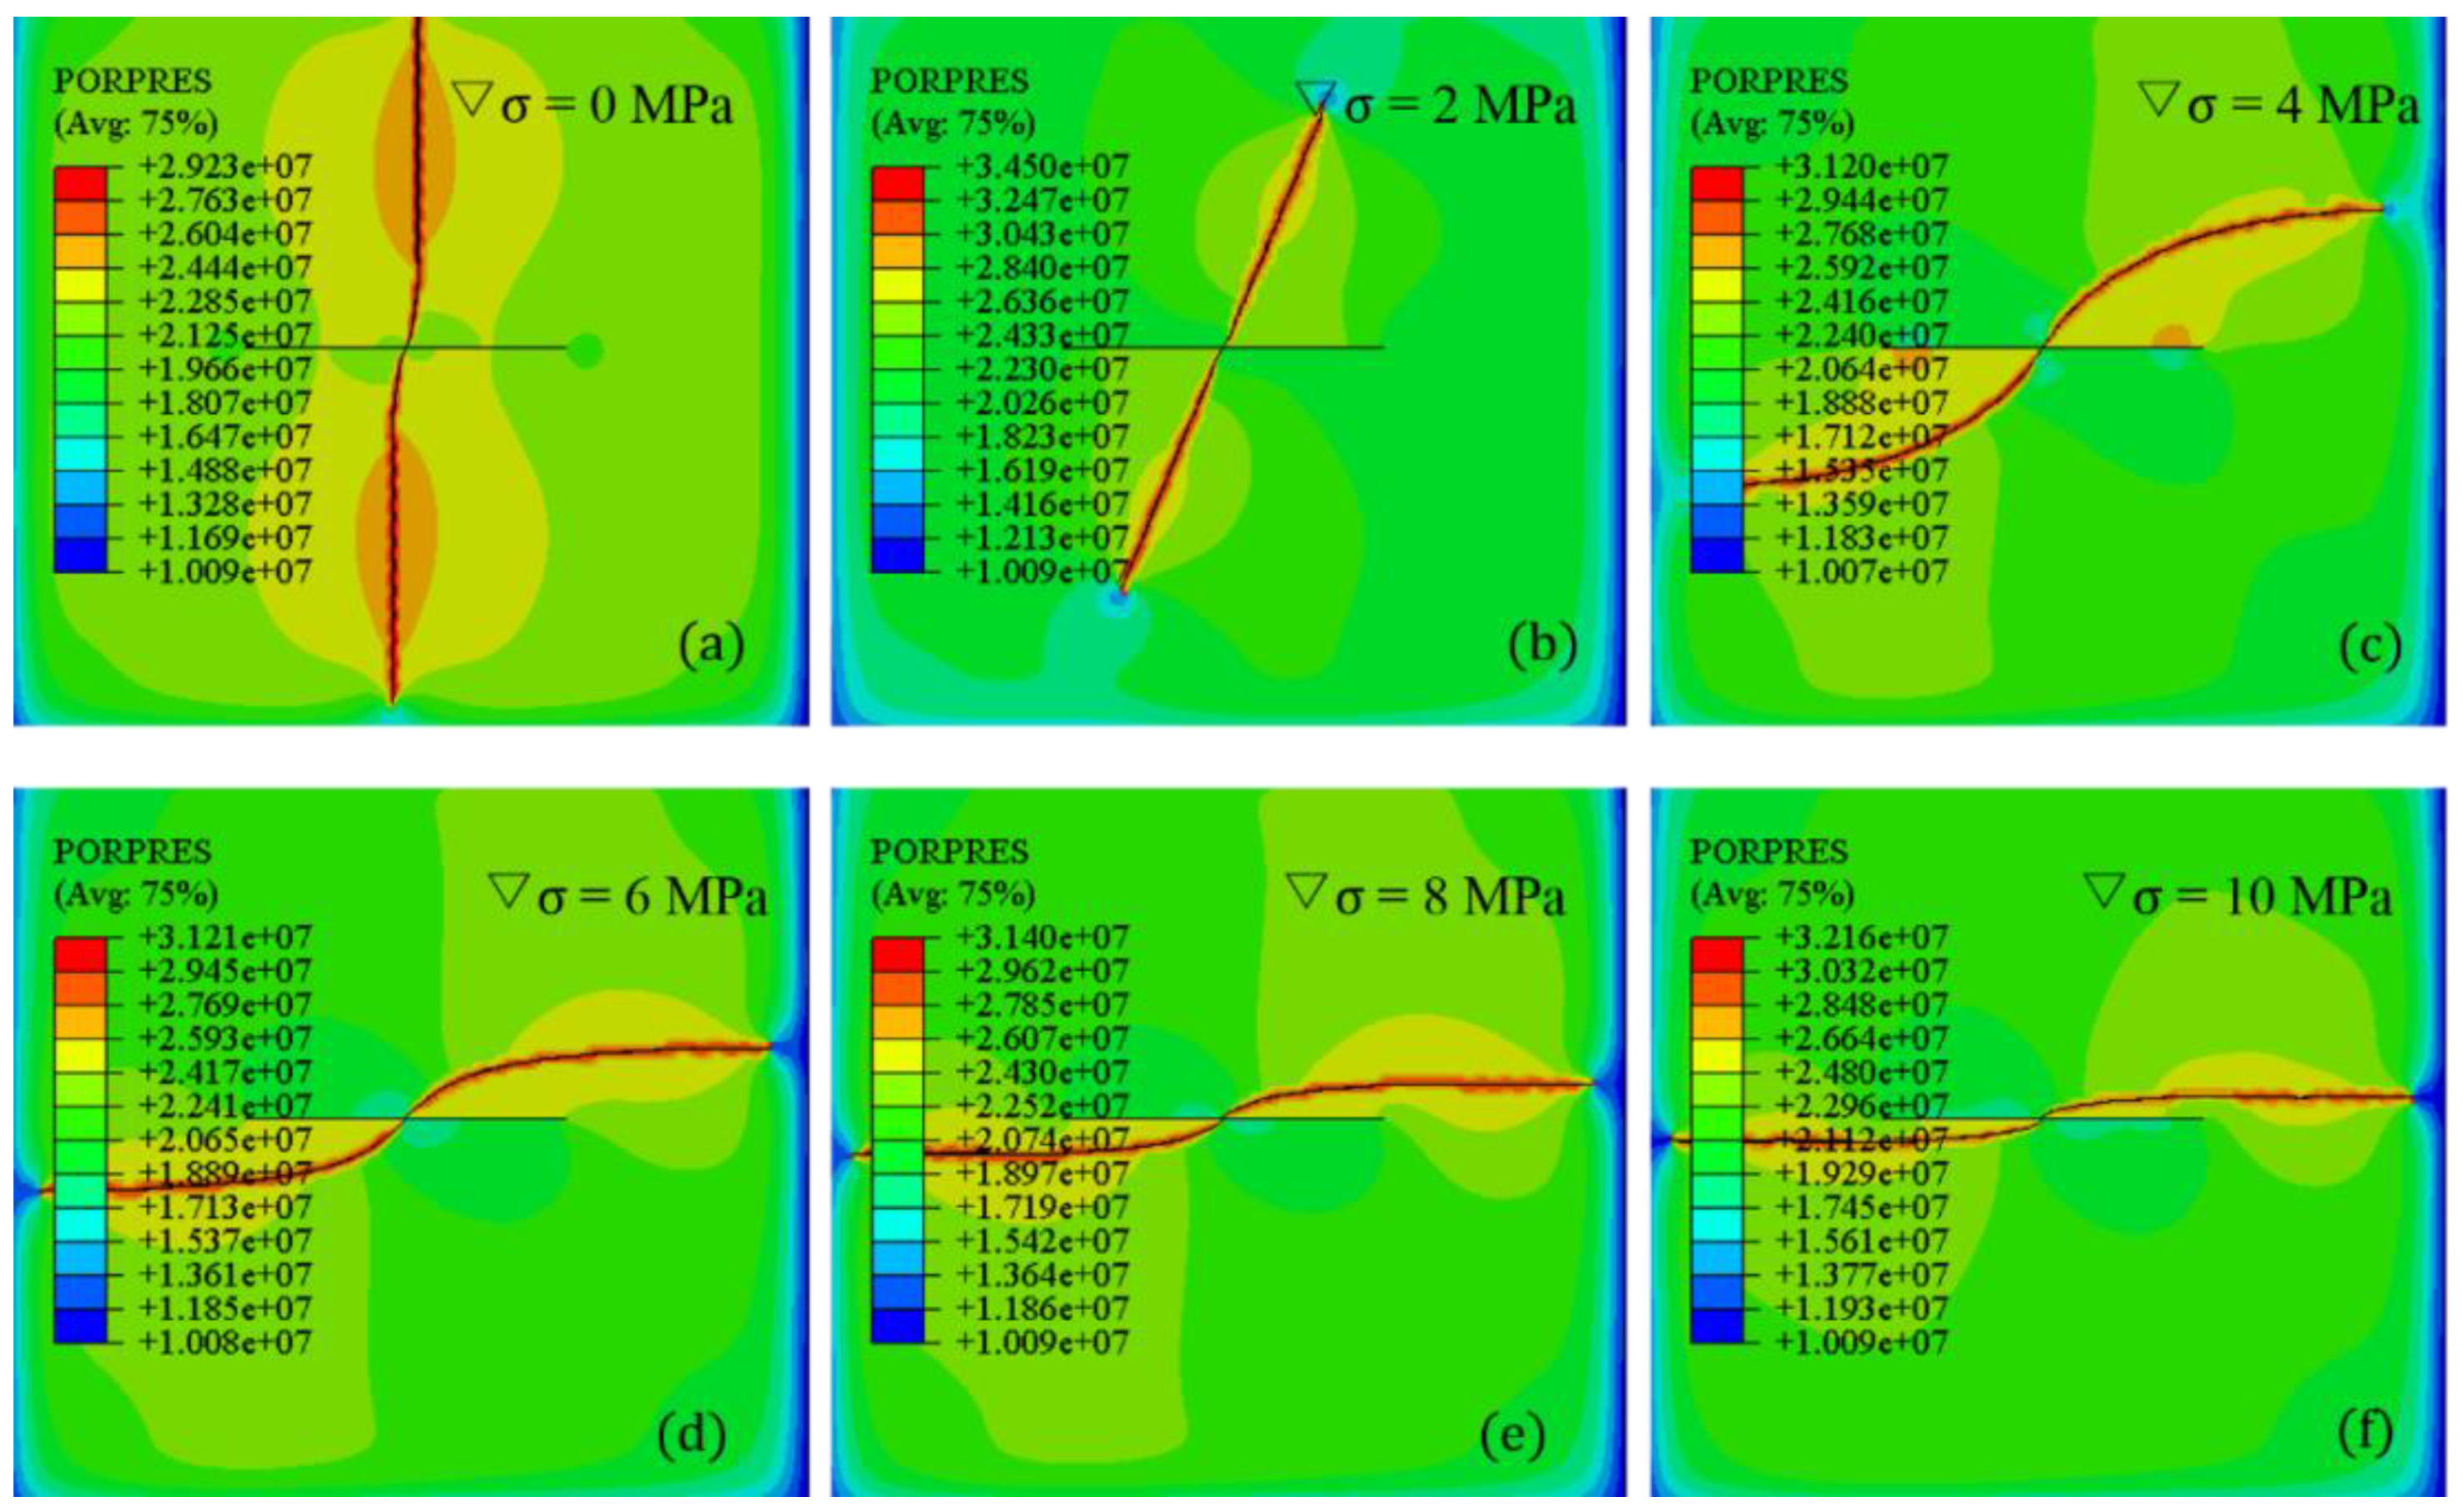
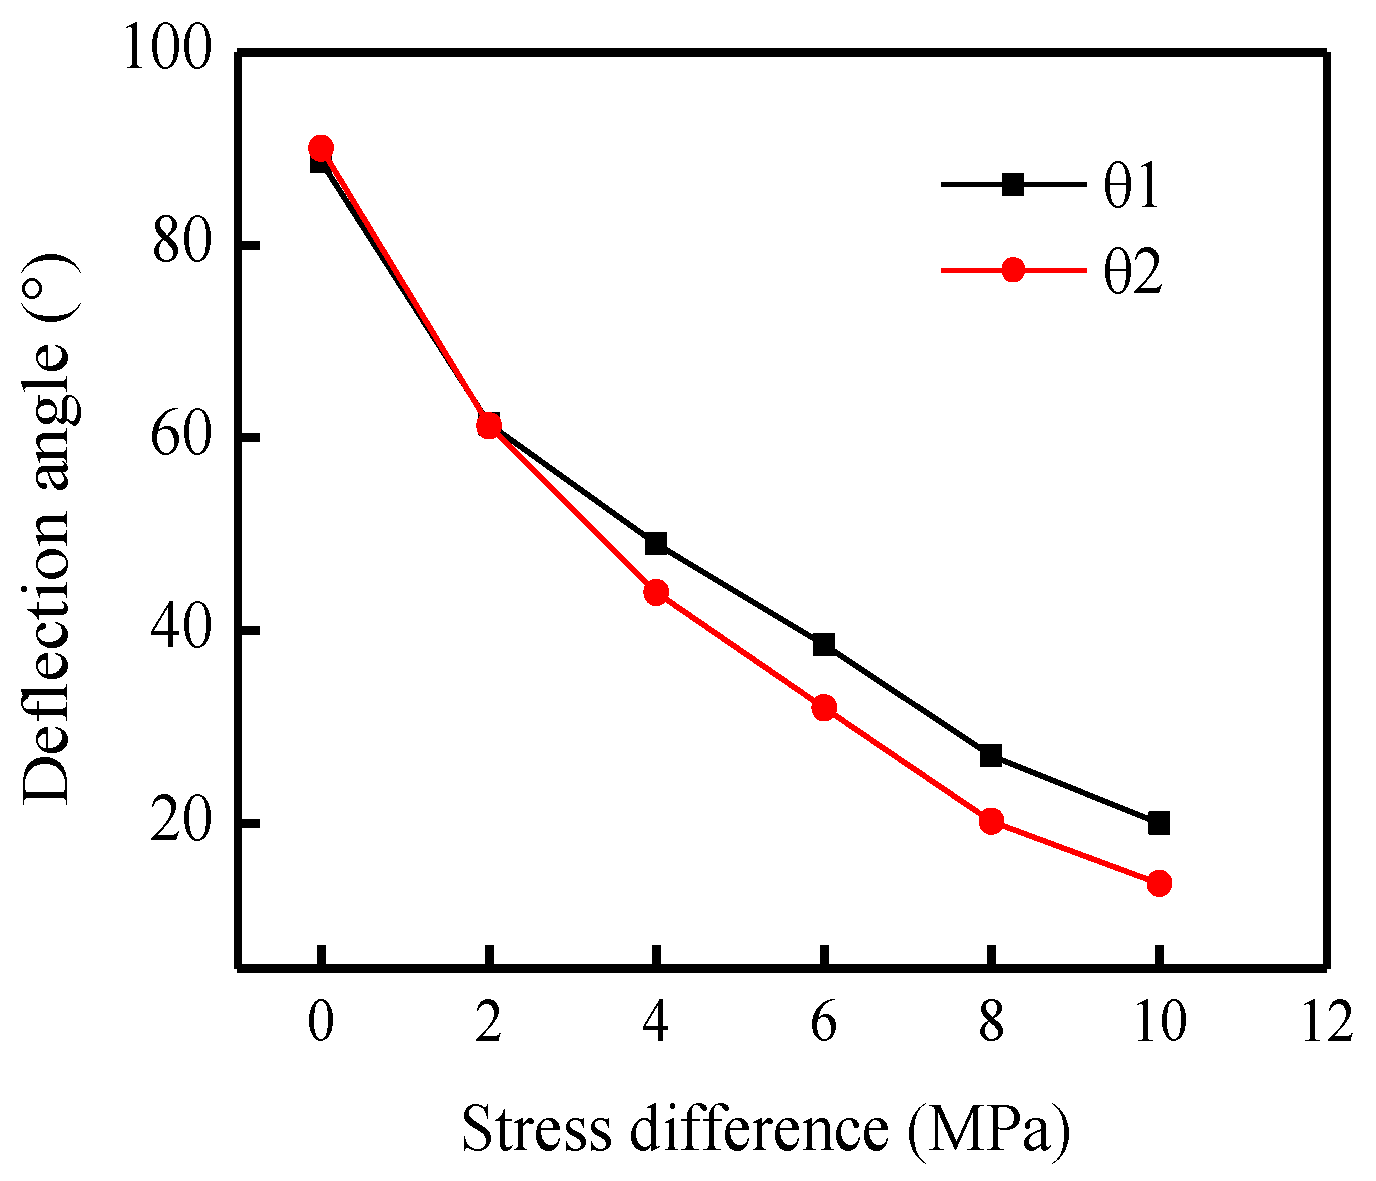
4.2. Horizontal Stress Difference

Horizontal stress difference determines the propagation patterns of the fracture, thereby, playing an important role in the deflecting behaviors of hydraulic fractures [43,44]. Various values of stress difference including ∇σ = 0, 2, 4, 6, 8 and 10 MPa were simulated to obtain the geometries of the diverting fracture shown in Figure 9. The parameters of the injection rate, fluid viscosity, perforation azimuth angle, and perforation depth were kept constant at Q = 7 × 10⁻⁴ m3/s, μ = 1 mpa·s, L = 0.5 m, and θ = 60°, respectively. Other parameters were set identical to those in Table 1. The stress difference were observed to evidently influence the geometry of the diverting fracture. The diverting fracture deflected easier to the direction perpendicular to the in situ minimum stress as the horizontal stress difference increased.
For a stress difference of ∇σ = 0 MPa (Figure 9a), the diverting fracture immediately defected to the direction perpendicular to the initial fracture, after the perforation was initiated. When the stress difference was increased to ∇σ = 2 MPa (Figure 9b), the diverting fracture nearly propagated along the perforation azimuth angle with minimal changes of the propagation direction. Therefore, the reorientation of the stress field caused by the initial fracture can easily change the propagation patterns within a lower stress difference especially less than 2 MPa. With the increase of the stress difference, the diverting fracture oriented easier into the direction of the maximum horizontal stress. In a higher stress difference, even the stress difference decreased due to stress interference, whereas the in situ direction of horizontal stress did not change.
Furthermore, two deflection angles θ1 and θ2 (Figure 10) were measured to describe the diverting behavior. The deflection angles of θ1 and θ2 decreased as the stress difference increased. However, few distinctions for the same stress difference were observed at ∇σ = 0 and 2 MPa. Meanwhile, the difference between θ1 and θ2 with the same stress difference increased with an increase of the stress difference. This denotes that the fracture deflection changes considerably as the stress difference increases. When the stress difference exceeded 10 MPa, the deflection angles decreased to less than 20°, demonstrating a rapid deflection in the direction of the original maximum principal stress. Wang et al. [45] similarly concluded that the diverting fracture does not initiate in a new direction with a large stress difference. Therefore, a lower stress difference can result in the preferred fracture geometries of refracturing and can easily redirect the in situ stress field.

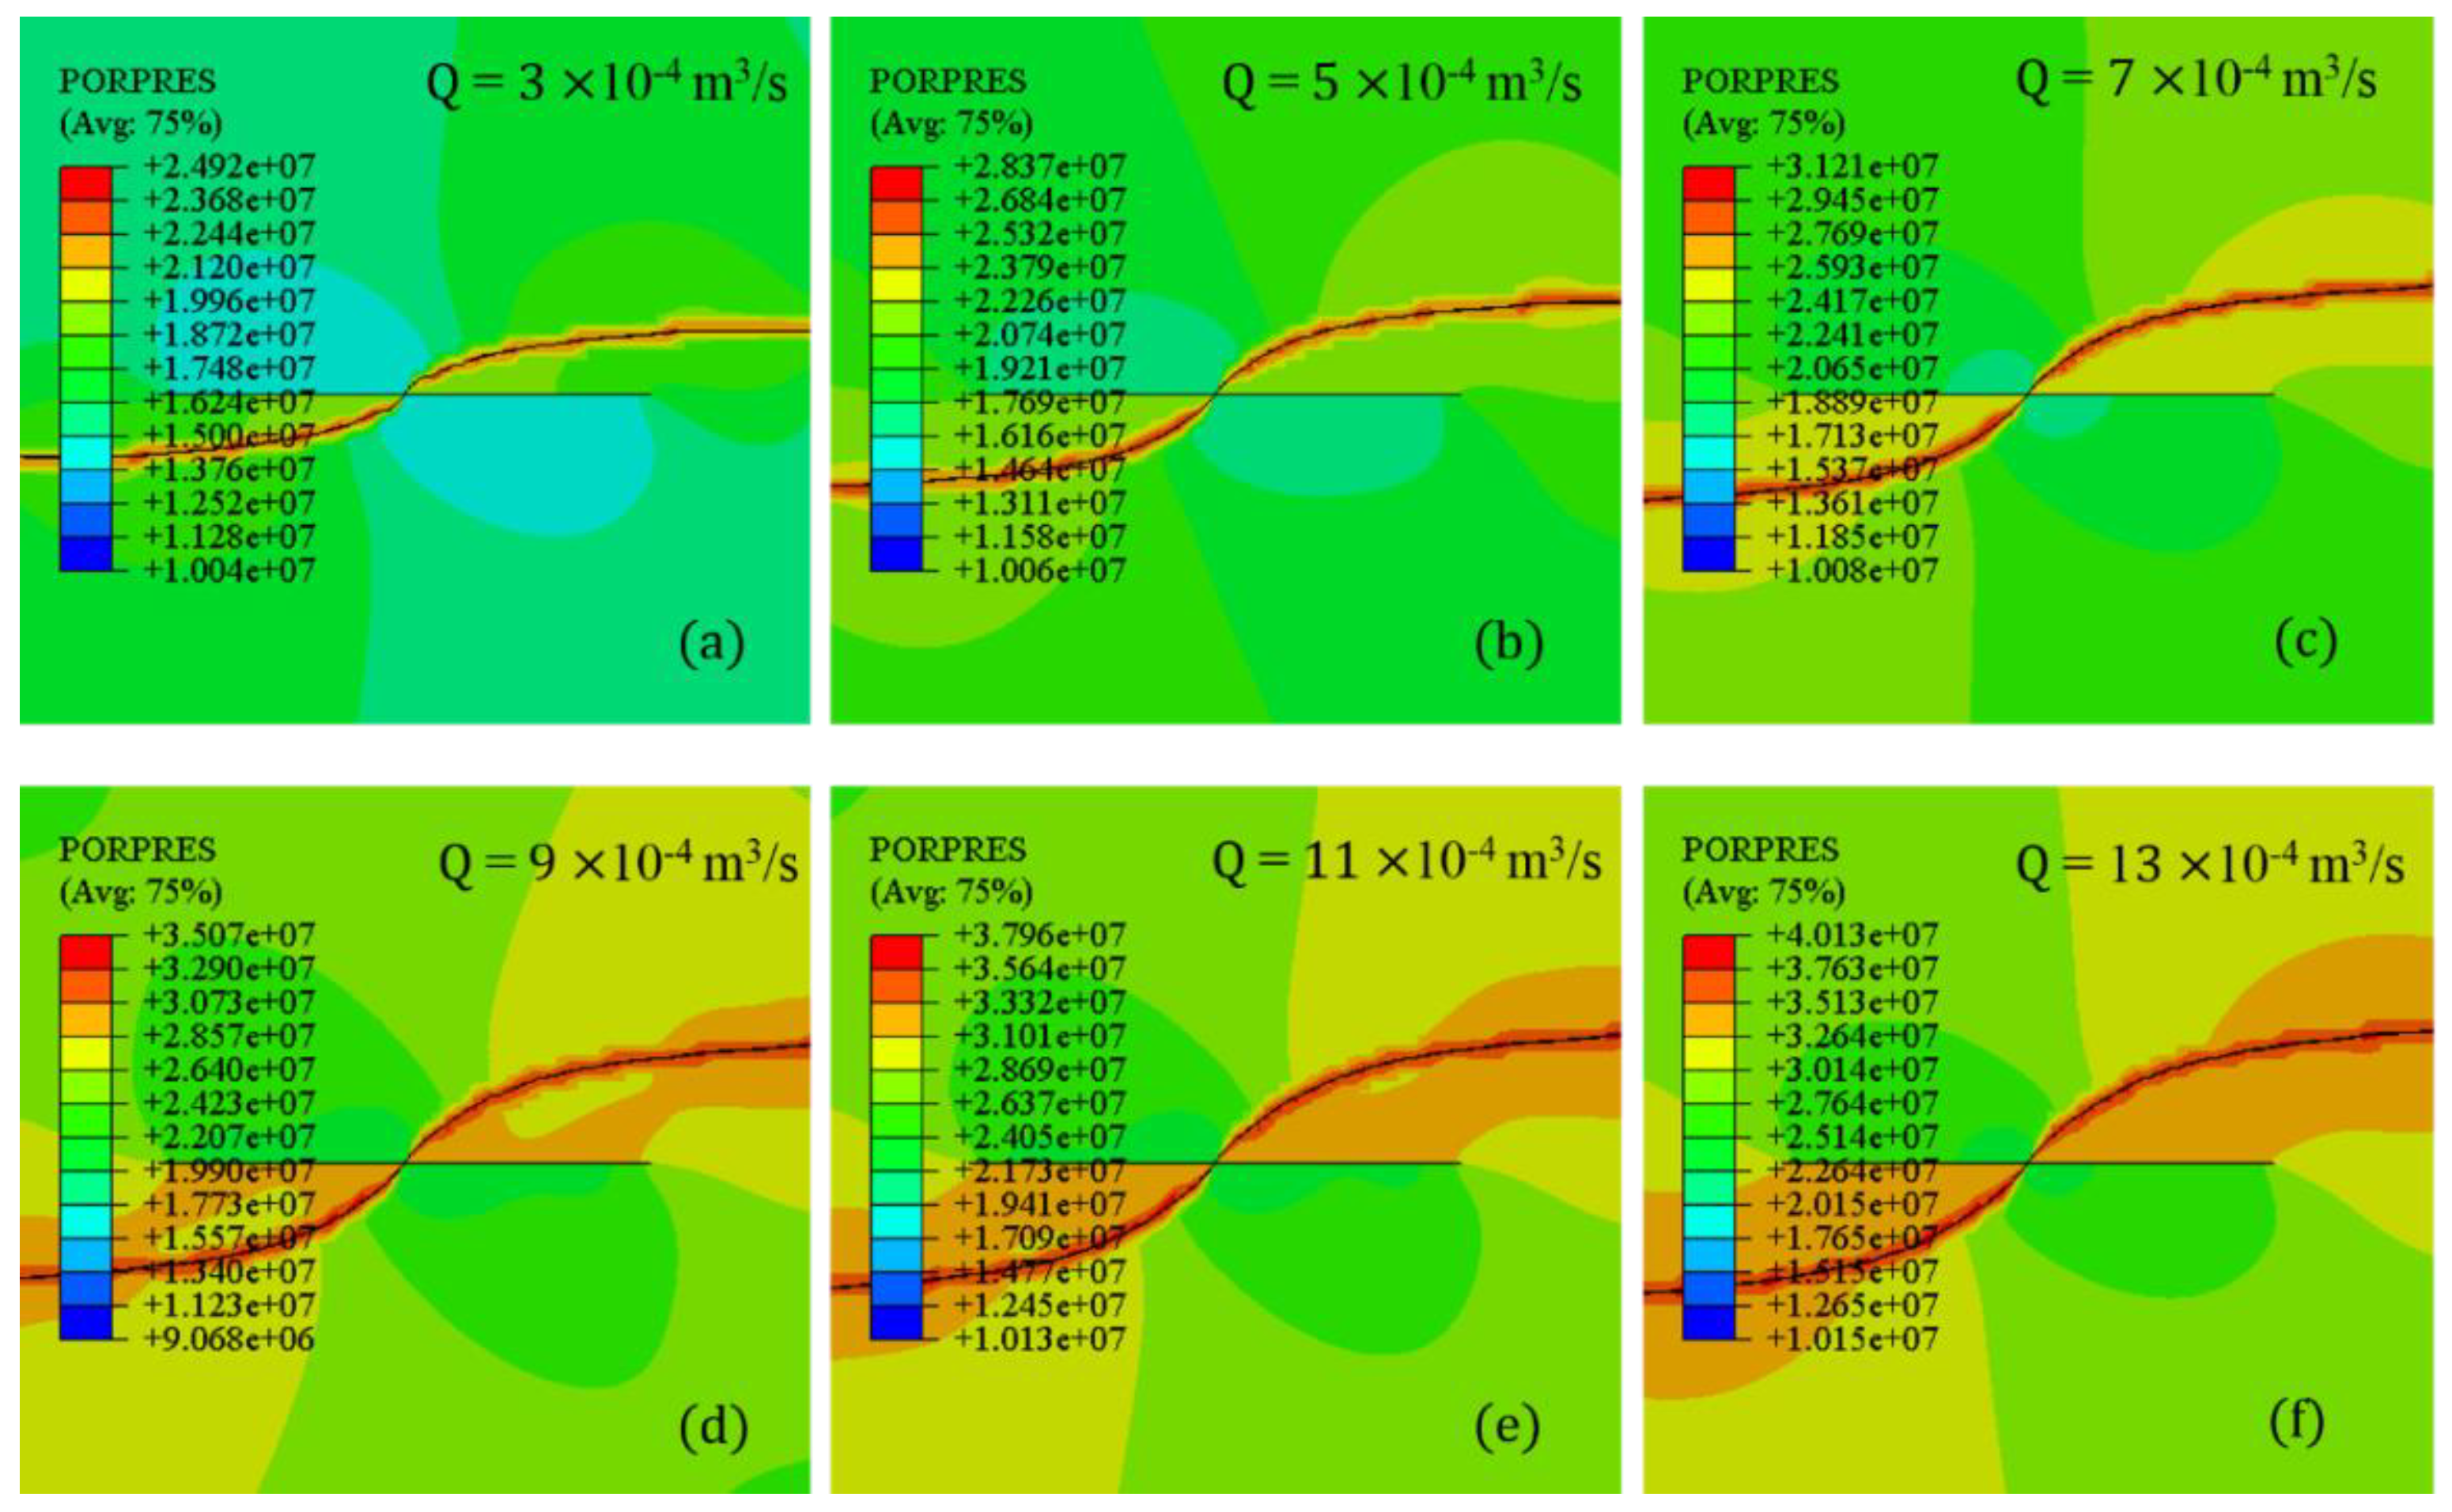
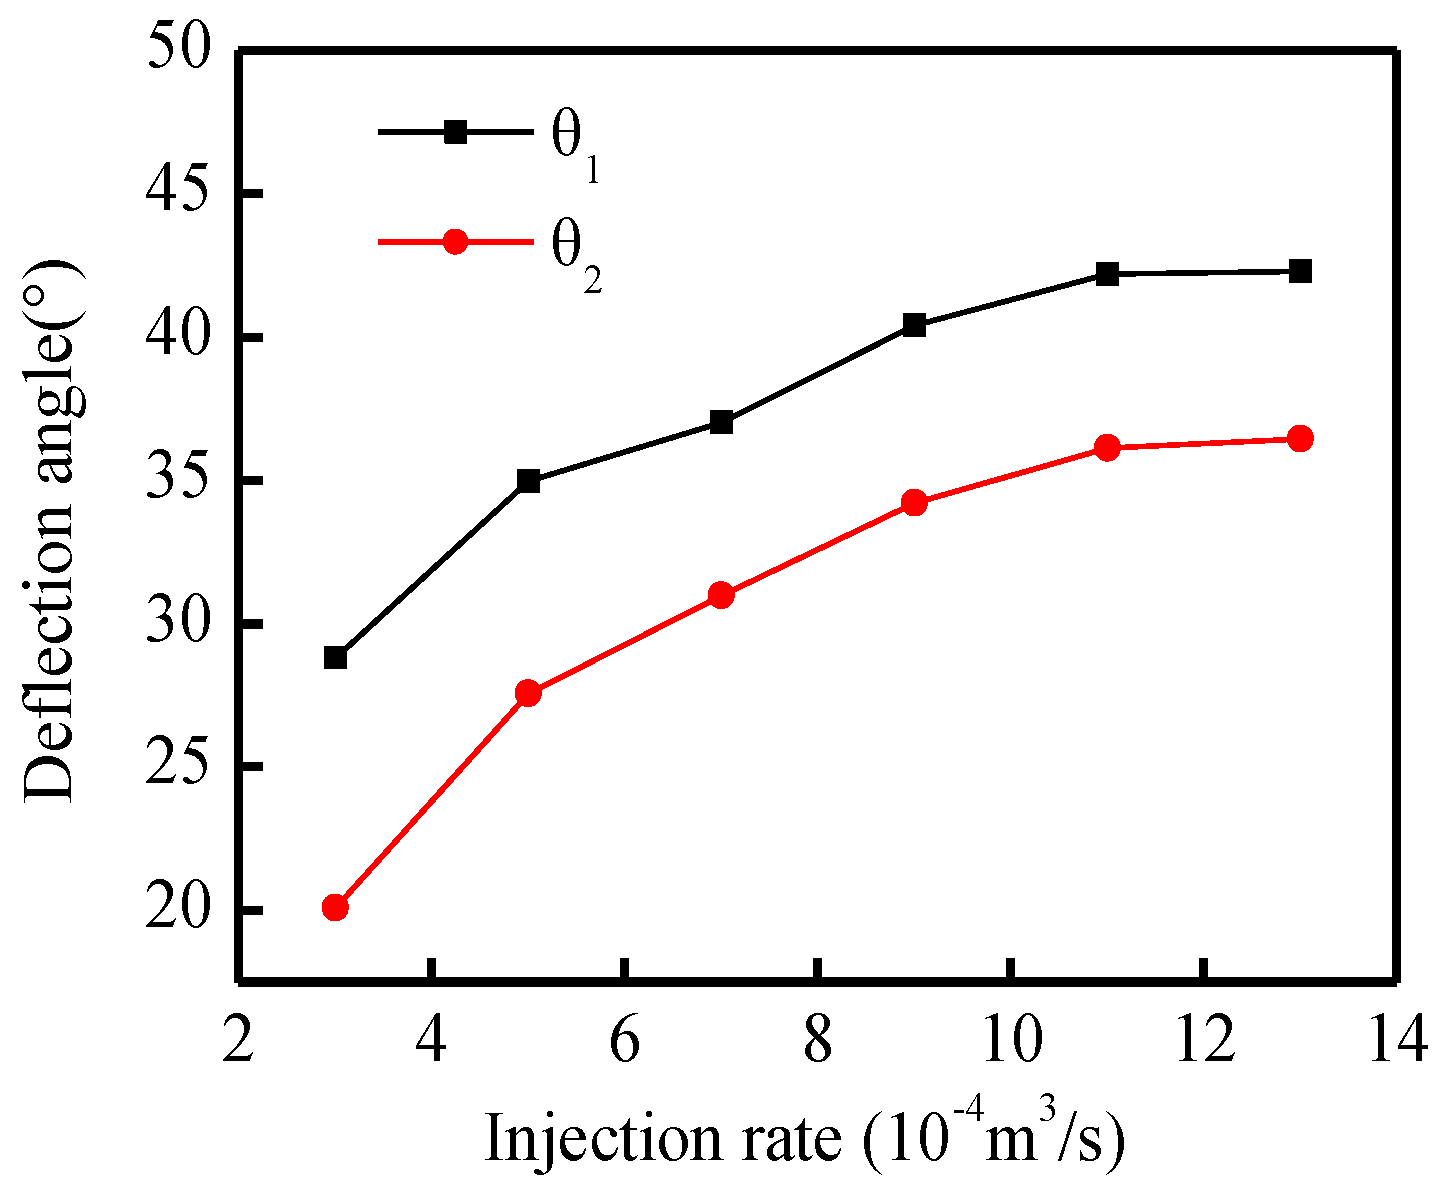
4.3. Injection Rate of the Fracturing Fluid

Injection rate, a main control parameter in field applications, determines the propagation path of the diverting fracture. A higher injection rate leads to a higher fluid pressure within the fracture, resulting in less diversion and a straighter fracture. Different injection rates of Q = 3 × 10⁻⁴, 5 × 10⁻⁴, 7 × 10⁻⁴, 9 × 10⁻⁴, 11 × 10 and 13 × 10−4 m3/s were applied in the simulations (Figure 11). The perforation azimuth angle, perforation depth, stress difference, and fluid viscosity were set to θ = 60°, L = 0.5 m, ∇σ = 6 MPa and μ = 10 mpa·s, respectively. Other simulation parameters conformed to that of Table 1.
Various propagation patterns and deflecting paths of the diverting fractures were achieved in the simulations. The results show that a higher value of injection rate can result in a longer curving distance and more curvilinear geometries of the diverting fracture. Therefore, the preferred propagation patterns can be achieved with a higher fracturing injection rate. That can be explained by the fact that a large amplitude increase of injection rates indicate a sharp increase of net pressure. Compared with the horizontal stress difference, a high net pressure is more likely to generate high induced stress to reduce in situ stress difference. Therefore, a higher injection rate may enhance the fracture propagation, however reduces the curve’s tangential derivative similar to the study by Feng et al. [46]. The maximum propagation pressure within fracture reached up to 40.13 MPa at an injection rate of 13 × 10−4 m3/s.
Figure 12 presents the relationship between the two deflection angles and injection rate to describe the diverting behaviors in different influenced area. Both the deflection angles of θ1 and θ2 increased with an increase of the injection rate. Hence, a higher injection rate can aggravate the diverting behavior of refracturing. Less increase of the two deflection angles were observed when the injection rate was further increased. This demonstrated that a higher injection rate can only enhance the diverting distance temporarily, instead, the influence experiences a decrease in a higher injection rate. Increase of the injection rate is a key process to improving the net pressure, thereby overcoming the stress concentration and avoiding tortuosity of the fracture near the wellbore. Therefore, optimization of a proper injection rate should be employed in the refracturing process for a deeper propagation of diverting fractures.

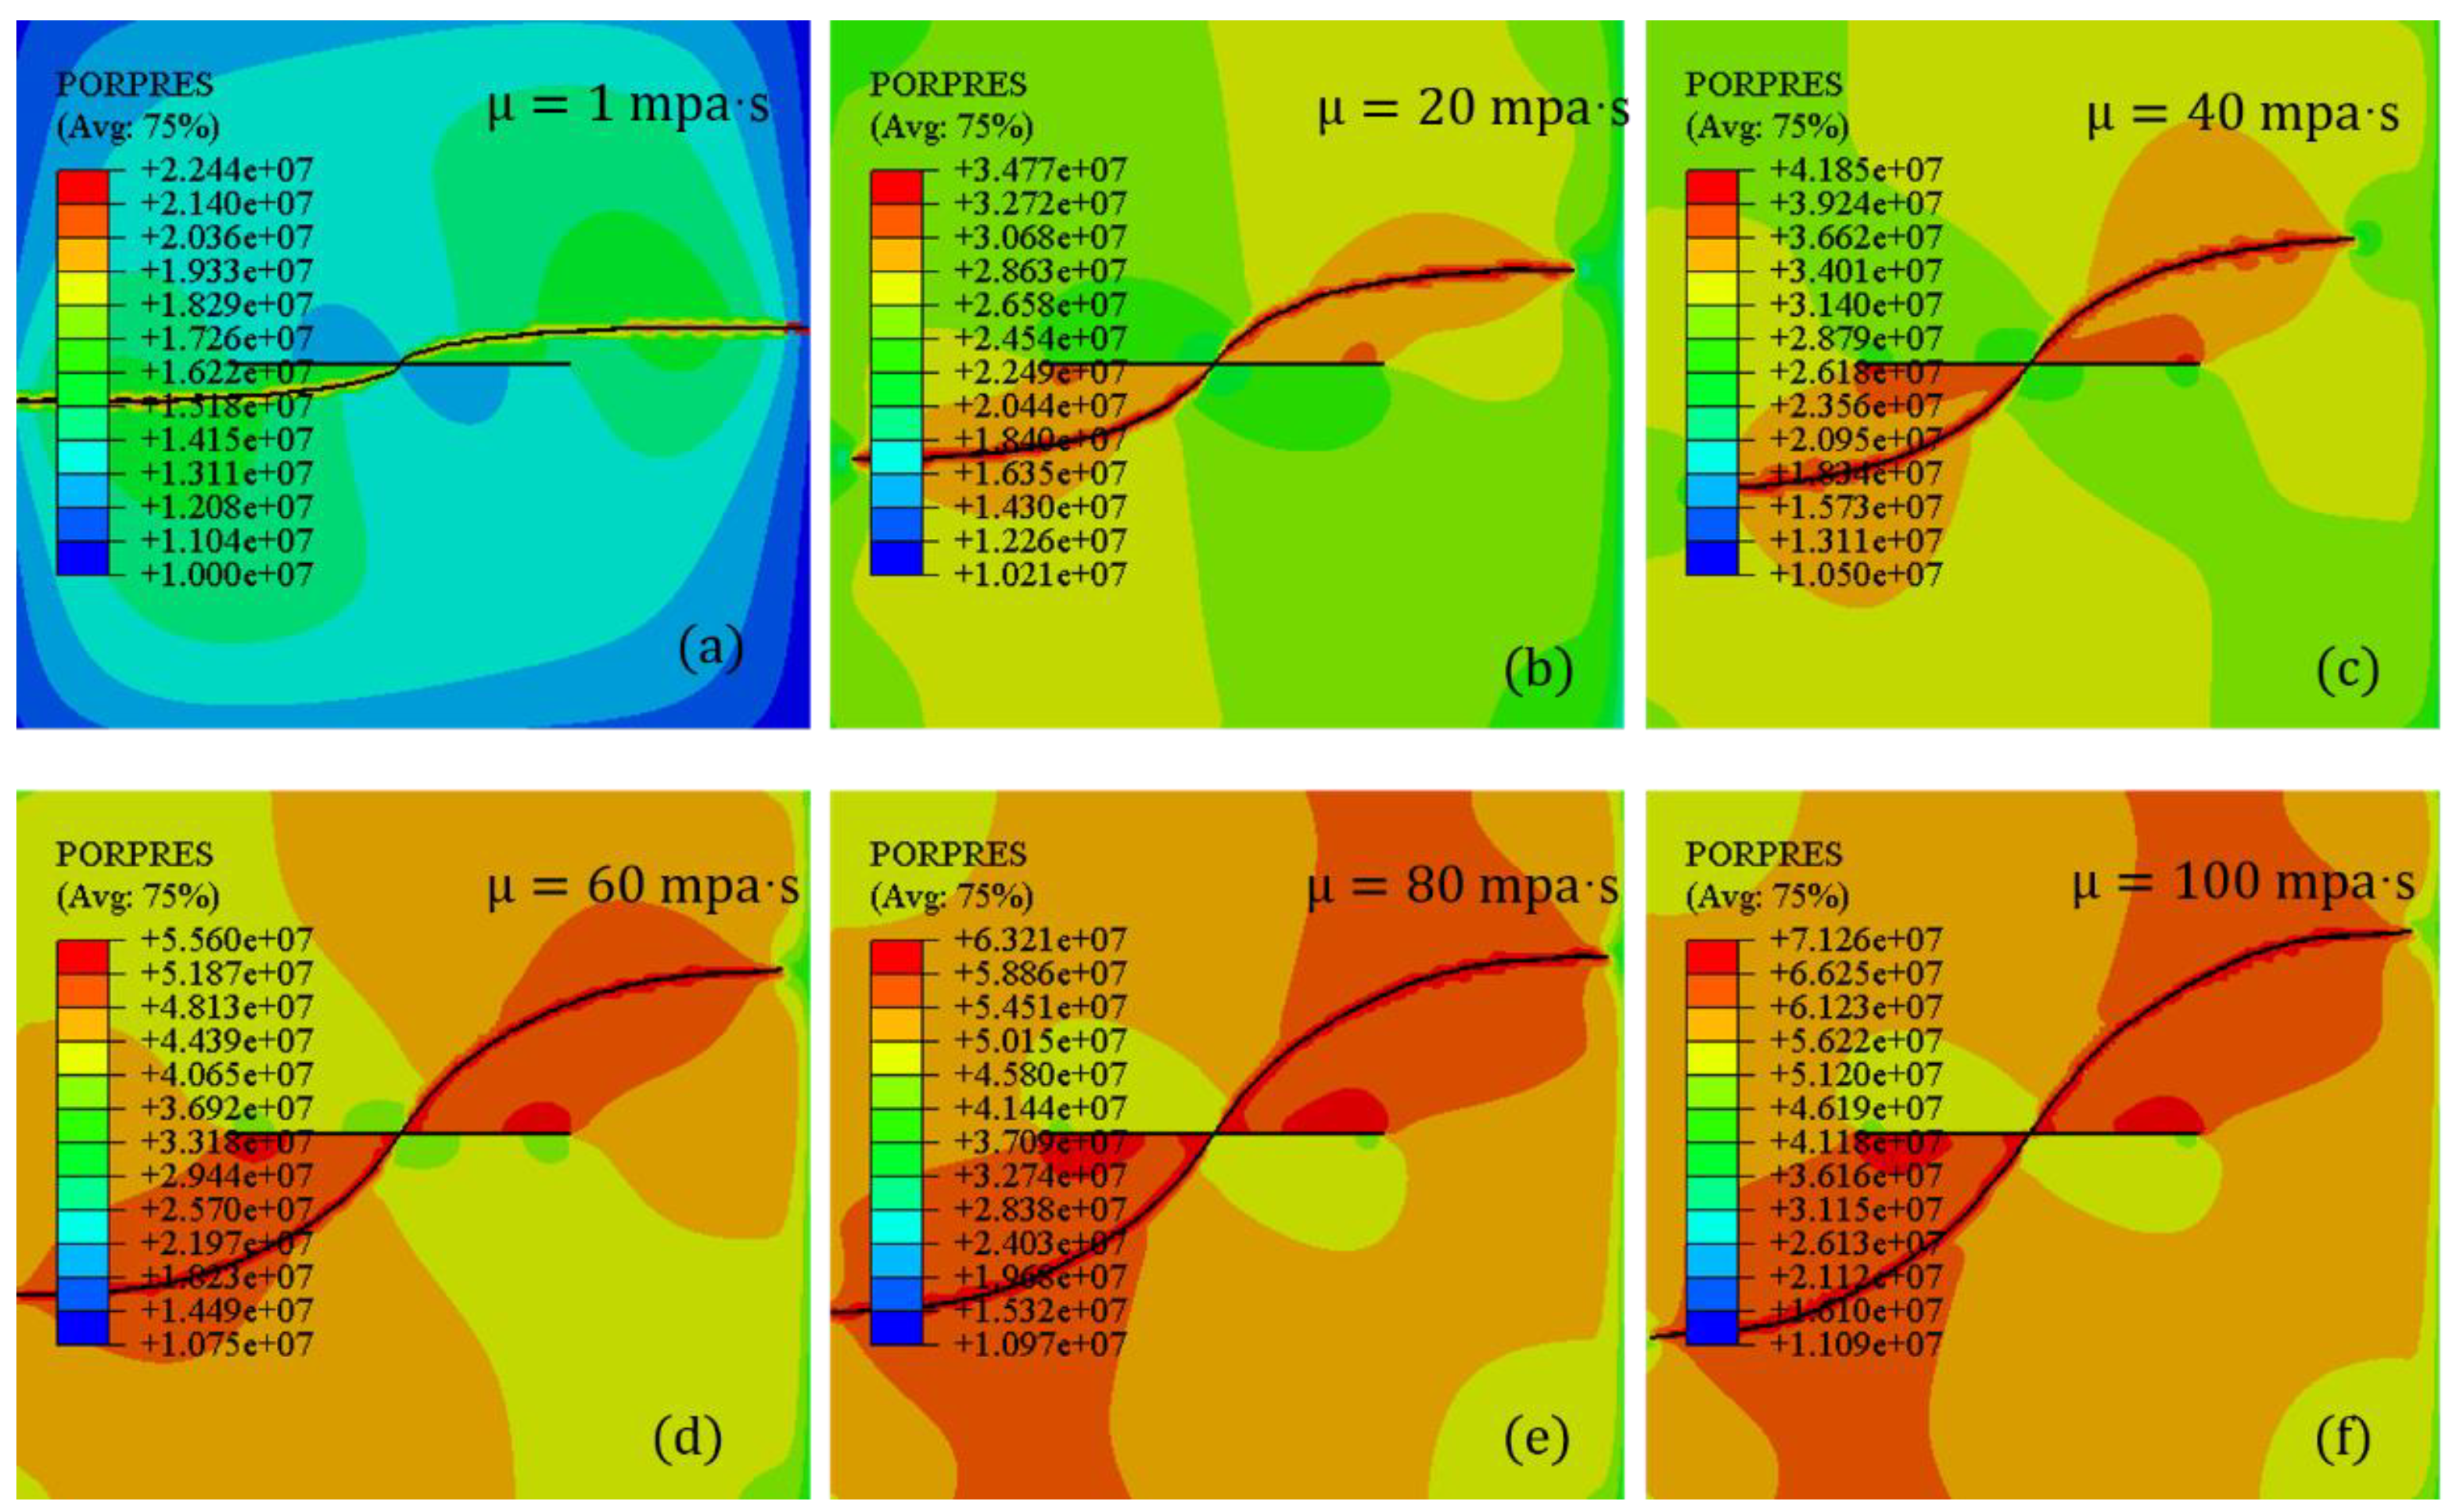
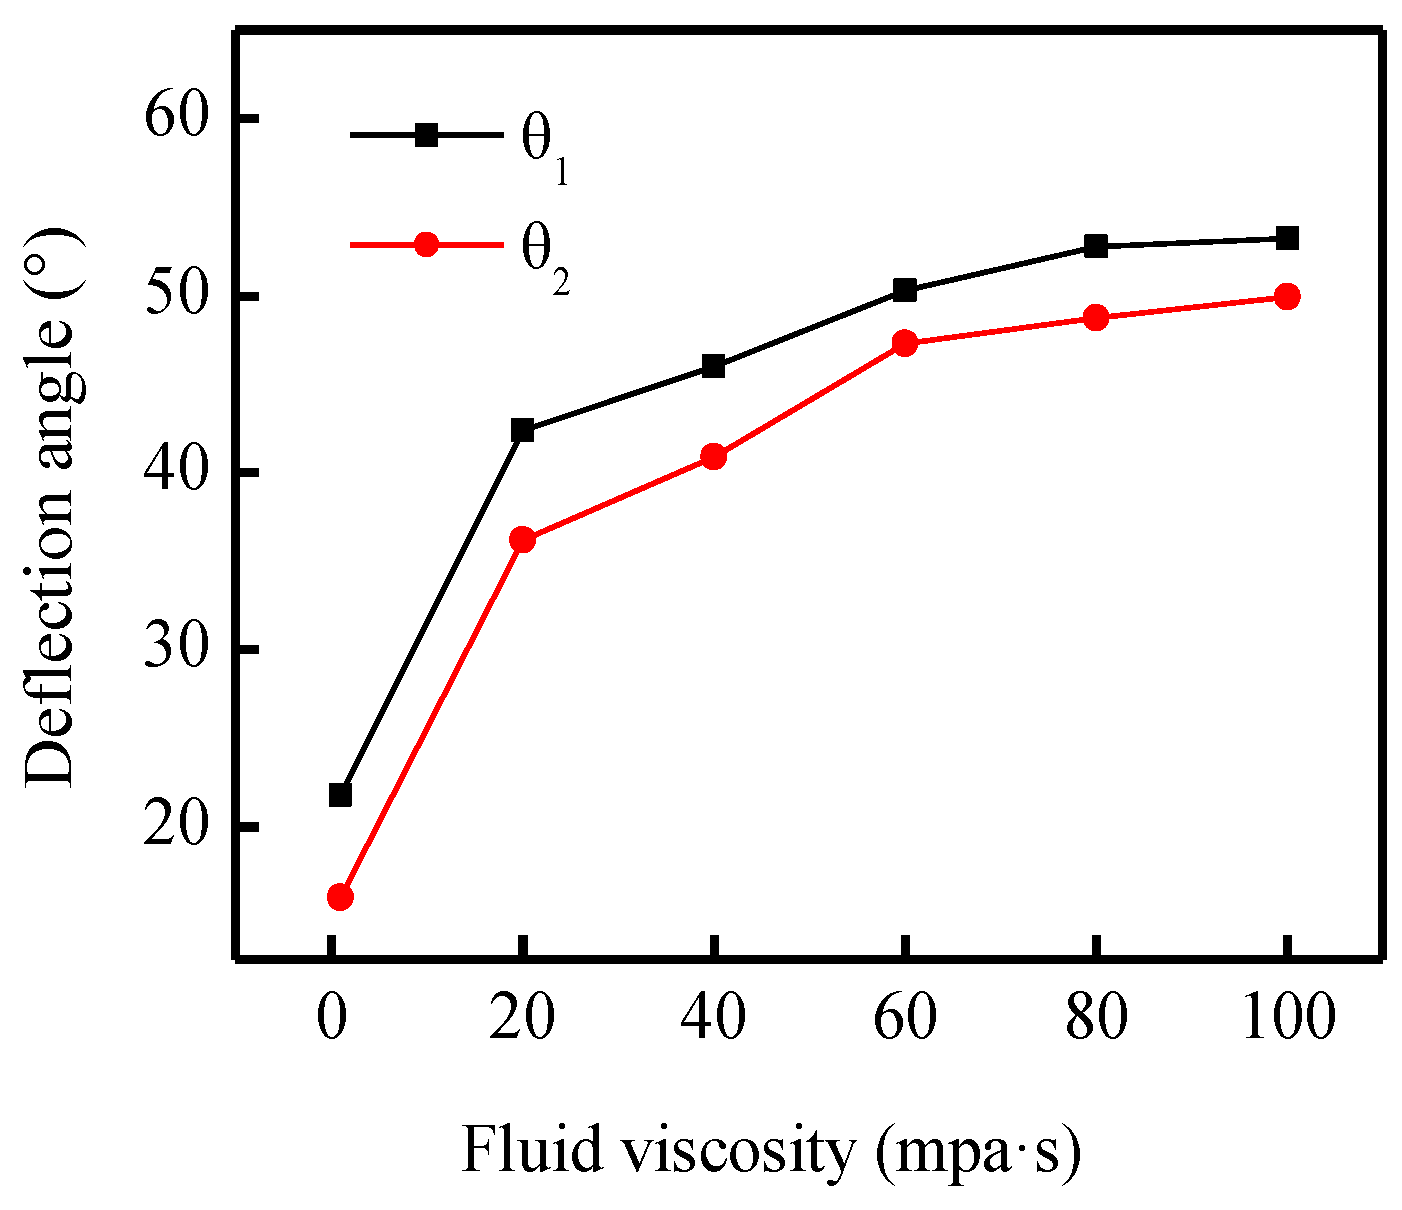
4.4. Fluid Viscosity

Fluid viscosity is an important property for fluid flow within a fracture, which highly influences the fluid frictional resistance and proppant displacement [47,48]. As shown in Figure 13, different fluid viscosity of μ = 1, 2, 40, 60, 80, and 100 mpa·s were simulated to describe fracture deflection and propagation behavior. The perforation azimuth angle, perforation depth, stress difference, and injection rate were set to θ = 60°, L = 0.5 m, ∇σ = 6 MPa, and Q = 7 × 10⁻⁴ m3/s, respectively. Other parameters conformed to that of Table 1. Fluid viscosity can influence the deflecting behavior of the diverting fracture significantly, especially at a higher value.
As represented in Figure 13a, the diverting fracture rapidly deflected to the direction of horizontal maximum stress with a low fluid viscosity (μ = 1 mpa·s). Simultaneously, more curving and a longer curving distance was observed as the fluid viscosity was increased. As shown in Figure 13f, a higher fluid viscosity (μ = 100 mpa·s) resulted in an extremely high propagation pressure (71.26 MPa) within the diverting fracture. This can be due to the large frictional resistance for high viscosity of the fracturing fluid. Considering the pressure resistance of the fracturing equipment, the fluid viscosity of the corresponding injection rate should be taken into consideration for a proper injection process. These conclusions were consistent with previous experimental results from Beugelsdijk et al. [49] and Olson [50].
Figure 14 presents the two deflection angles to investigate the diverting mechanism with different fluid viscosity. Both deflection angles were observed to increase with an increase of the fluid viscosity especially in the relatively lower range of viscosity (1–20 mpa·s). However, the deflection angle changed minimally from 46.02° to 53.24° when the fluid viscosity exceeded 40 mpa·s. This result shows that high viscosity of the injection fluid is an effective method to reduce the fracture tortuosity consistent with the conclusions presented by Zhang et al. [51]. Furthermore, the deflection behavior of the diverting fracture significantly changed with a relatively lower fluid viscosity. Considering the displacement of the proppant, more viscous fluid may be adopted whereas extremely high pressure should be avoided in field treatment. According to the simulation, effective geometries of the diverting fracture can be achieved with a recommended fluid viscosity of 20–40 mpa·s.

4.5. Initial Location of the Diverting Fracture

Far-field plugging and diverting realized by the modified model can simulate different initial locations along the initial fracture. Figure 15 shows the different initial locations along the initial fracture of D = 5, 10, 15, 20, 25 and 30 m modeled to describe the propagation pattern of the diverting fracture. The parameters including the perforation depth, perforation azimuth angle, injection rate, fluid viscosity, and stress difference were constant at L = 0.5 m, θ = 60°, Q = 7 × 10⁻⁴ m3/s, μ = 1 mpa·s, and ∇σ = 6 MPa, respectively. Table 1 shows the rest of the parameters. All the diverting fractures in the following models were assumed to initiate perpendicular to the initial fracture corresponding to the redirection stress field near the initial fracture.
The results show that more curving fracture and longer deflecting distance was achieved as the initial location approached to the wellbore. As the location approached to the root of the initial fracture, the influence of the fracture-induced stress increased. This is mainly due to the stronger stress interference near the root of the first fracture. The curve of the two deflection angles in Figure 16 demonstrated that the longer distance of the initial location resulting to lower values of deflection angle. However, an evident difference between θ1 and θ2 was observed indicating the intensified behavior of diverting with its propagation. Hence, it can be concluded that longer initial fracture can result in a larger stress influence and formation of larger stress reorientation. Therefore, for refracturing a location near from the root of initial fracture is recommended to generate deeper propagation for the diverting fracture.

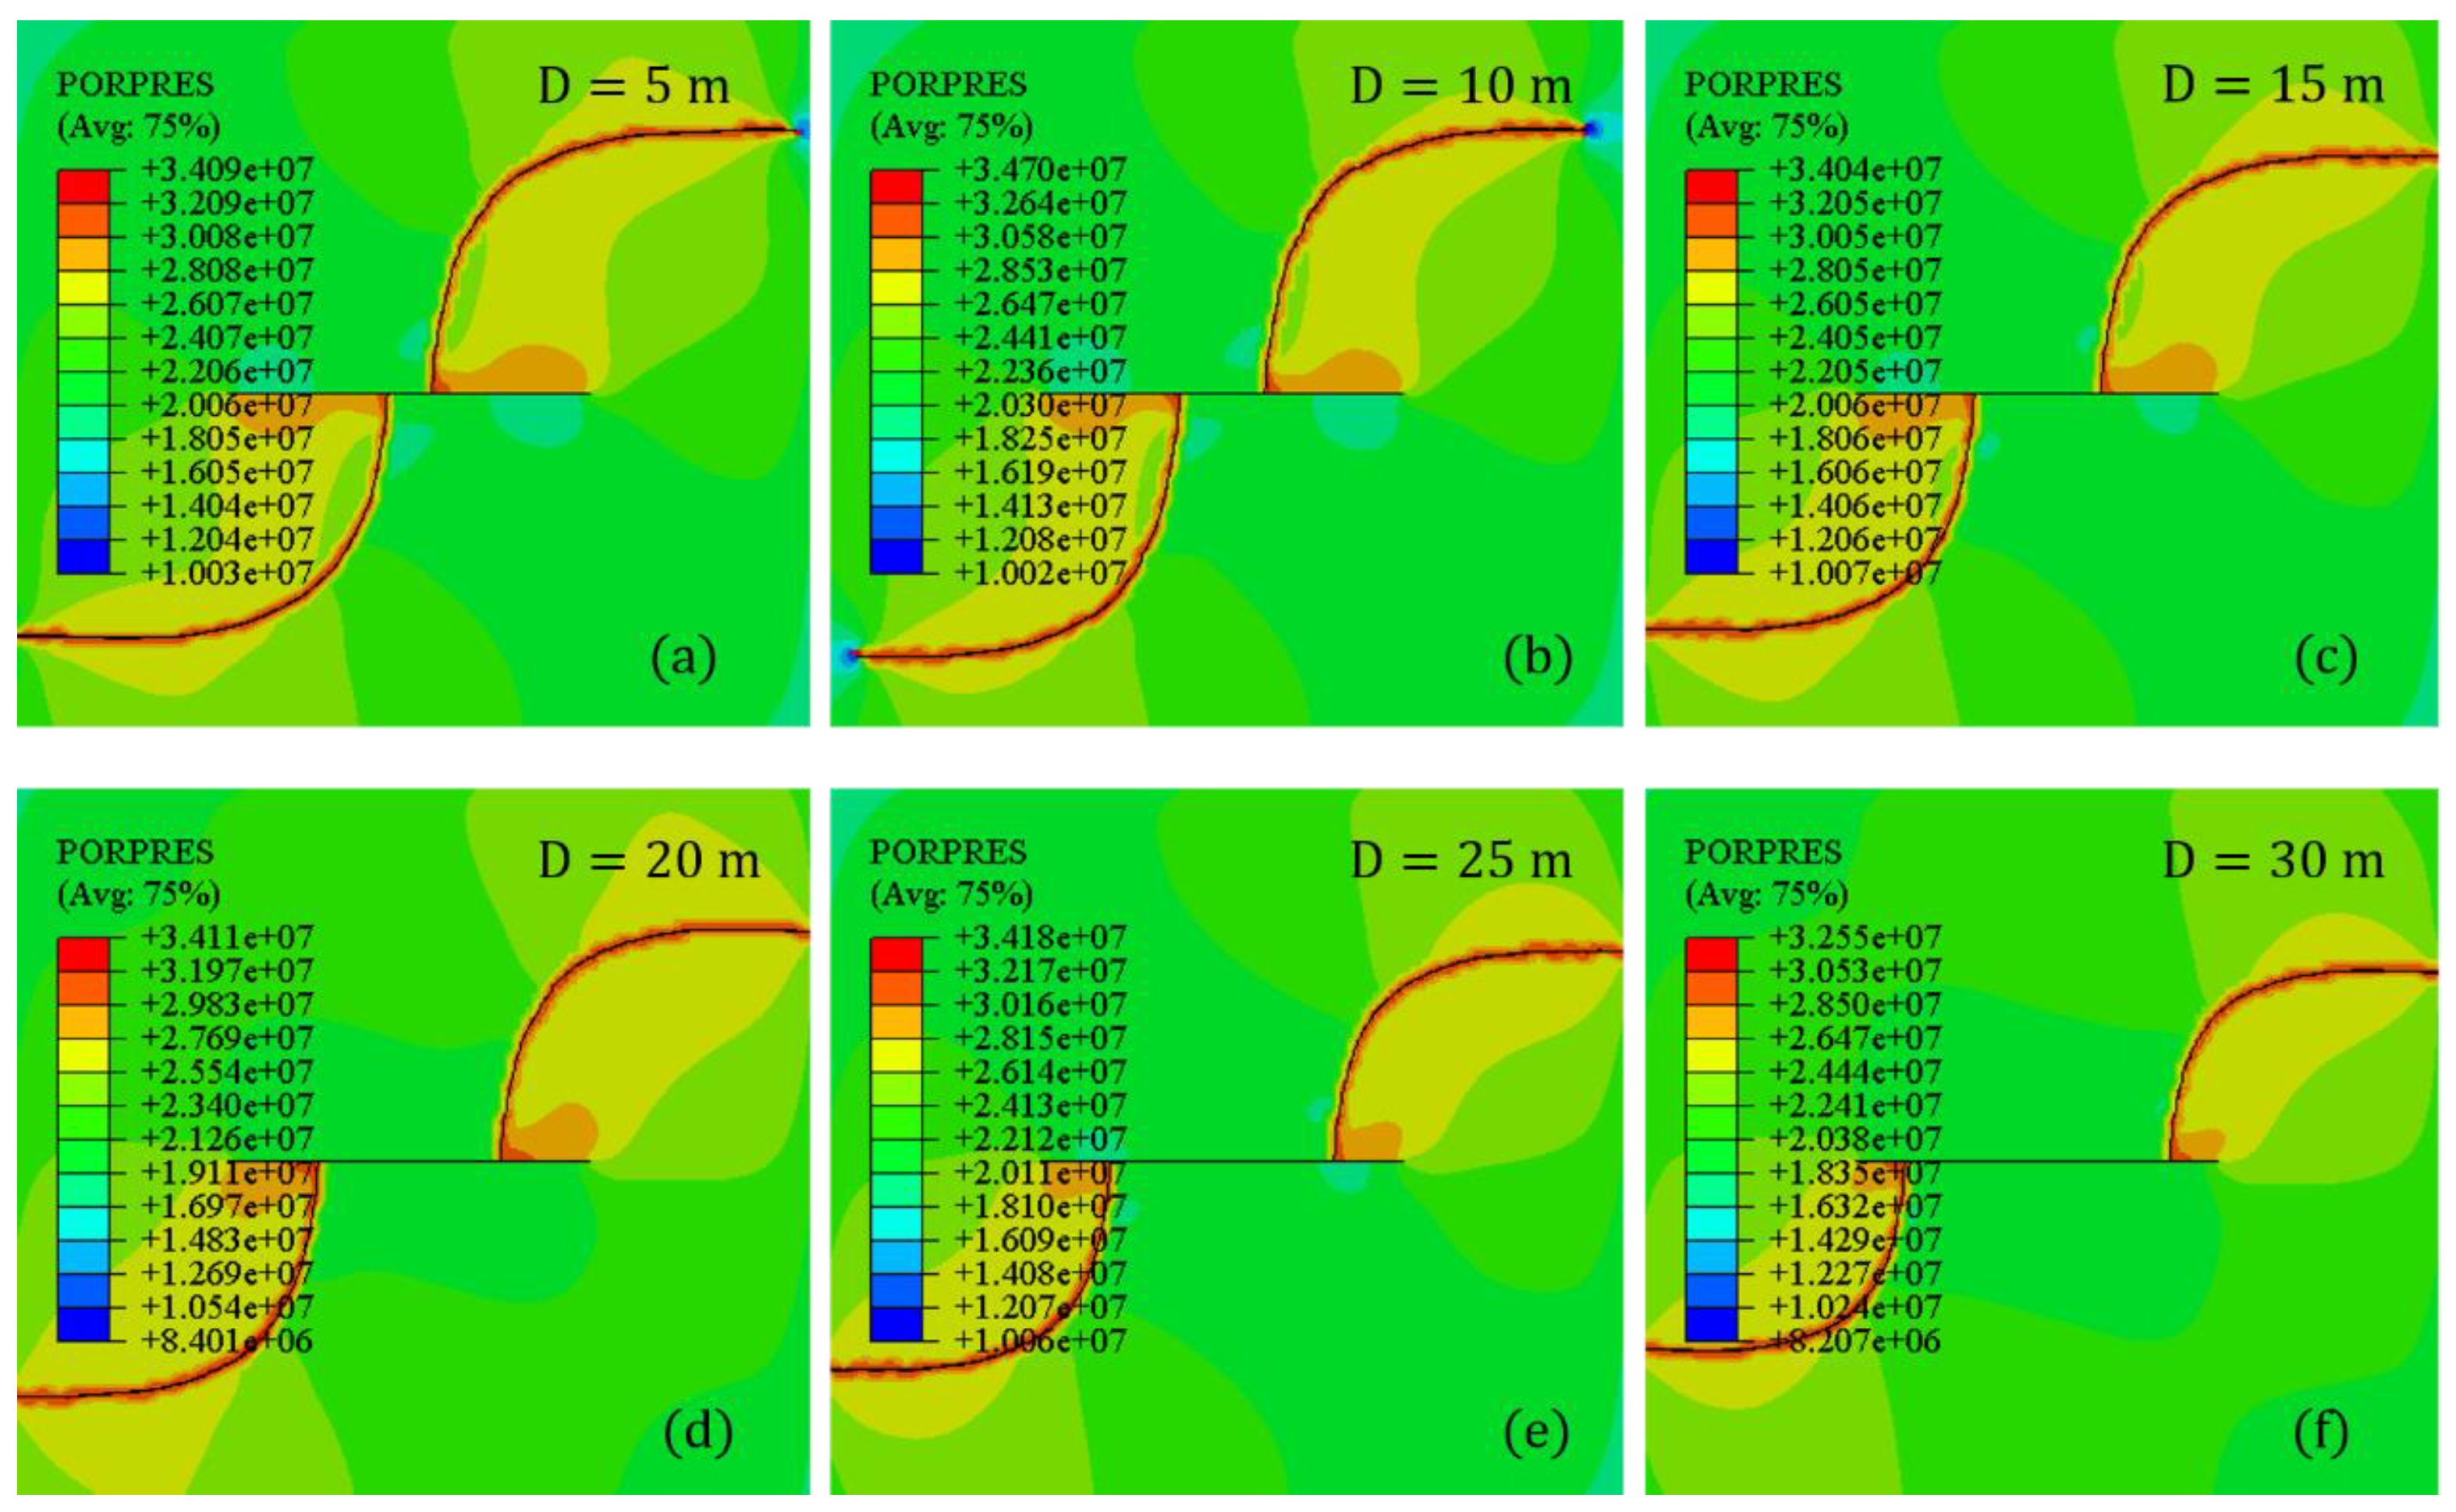
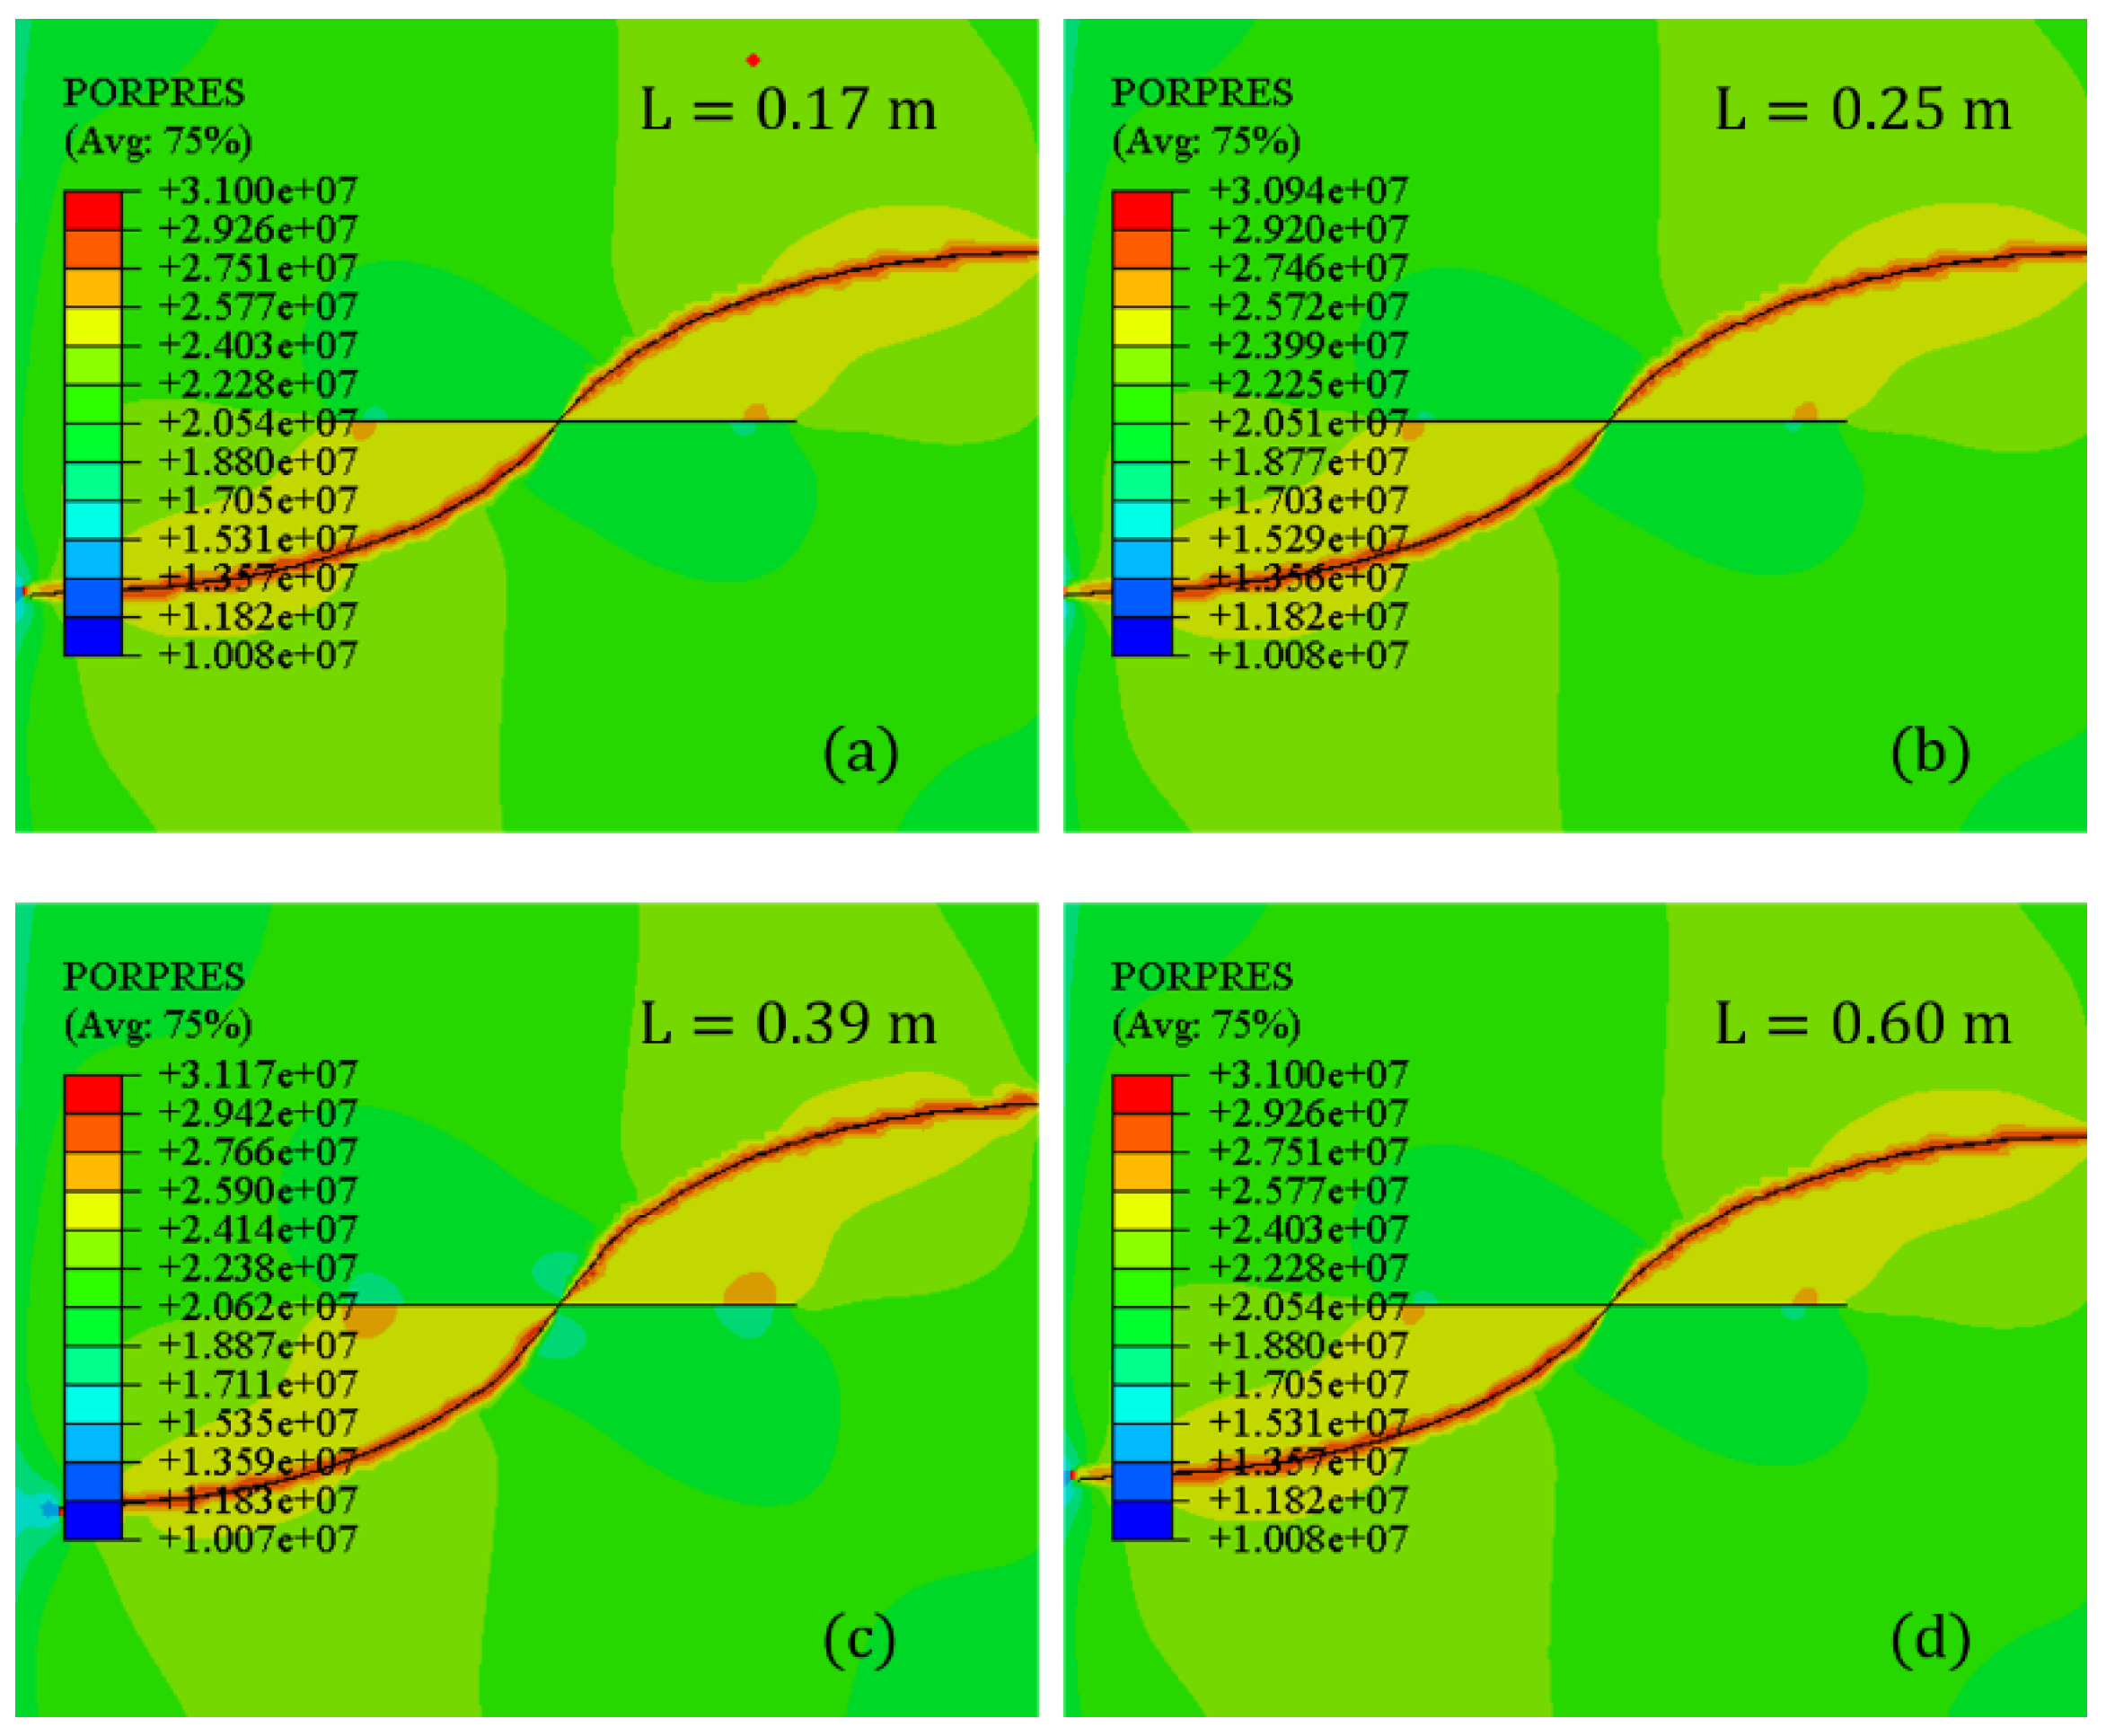
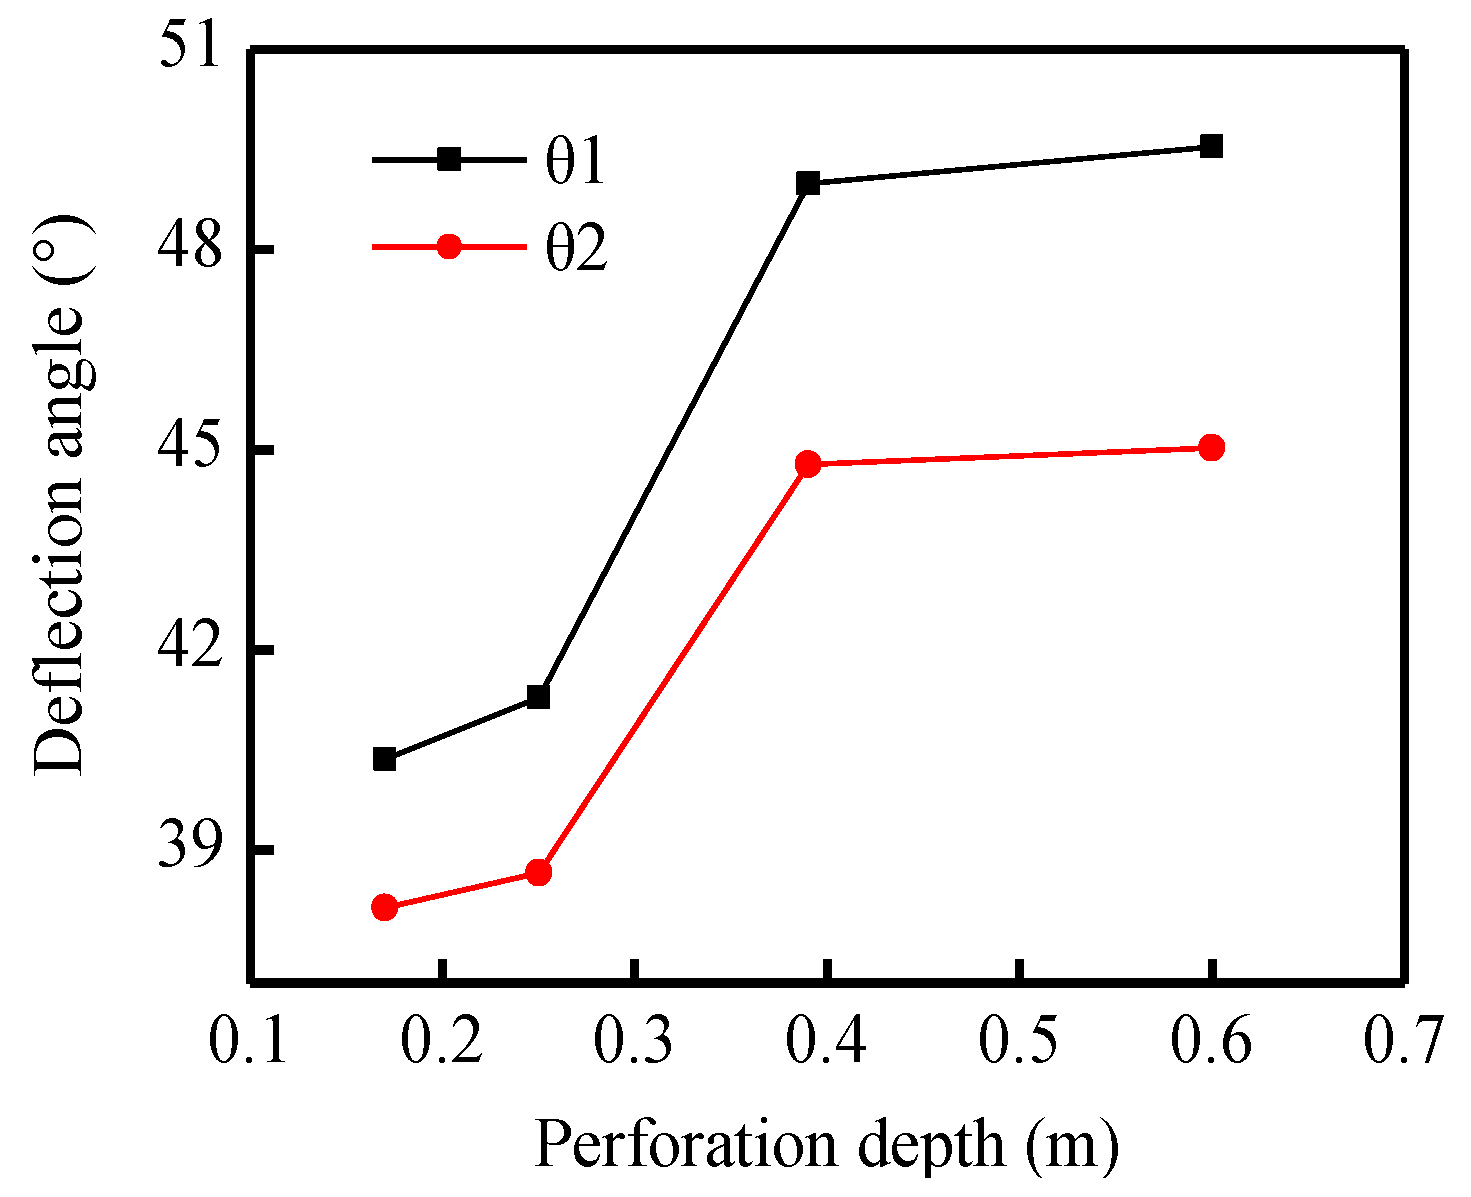
4.6. Perforation Depth

Perforation depth, a key parameter in the well-completion treatment, mostly determines the initiation of the fracture. Elevating the perforation depth supports deeper propagation away from the wellbore, thereby avoiding serious stress concentration in the near-wellbore region [52]. In this section, the perforation azimuth angle was fixed at θ = 60°, while the perforation depth varied from 0.1 to 0.6 m corresponding to L = 0.17, 0.25, 0.39, and 0.60 m. The injection rate, fluid viscosity, and stress difference were set to Q = 7 × 10⁻⁴ m3/s, μ = 1 mpa·s, and ∇σ = 6 MPa, respectively.
As shown in Figure 17, the geometries and deflection of the diverting fracture changed minimally as the perforation length increased. With careful observation in the initiation of the diverting fracture, the longer the perforation depth resulted in a delay in the diverting. This is due to the longer perforation depth which avoids the stress concentration near the wellbore, thereby forming straighter fractures. Hence, the perforation depth can influence the diverting fracture less when the depth is larger than the stress concentration area near the wellbore region. As shown in Figure 18, the two deflection angles tend to increase as the perforation depth increased. However, the range of variation was minimal with a change from 40.36° to 49.54°, and 38.13° to 45.02° for θ1 and θ2, respectively, when the perforation depth varied to 0.60 from 0.17 m. The deflection angle evidently increased when the perforation depth increased from 0.15 to 0.39 m, whereas a relatively minimal increase was observed as the perforation depth changed from 0.39 to 0.60 m. Therefore, according to the simulation, a relatively longer perforation depth of approximately 0.40 m is recommended to exceed the wellbore concentration area during refracturing.

5. Conclusions

This paper developed a modified construction in modeling refracturing based on XFEM. The deflecting geometries near the wellbore and the far-field diverting fractures were simulated by sensitivity analysis of multiple factors. The following conclusions were obtained from this study:
(1)
The existence of the first-stage fracture can significantly change the in situ stress field or redirect the direction of the stress field relative to lower horizontal stress difference. With an increase of the stress difference, the diverting fracture deflected easily to the direction of the maximum horizontal stress after initiating from the perforation. For particularly low stress difference such as ∇σ = 2 MPa, the deflection of the diverting fracture did not occur, instead it propagated along the perforation azimuth angle.
(2)
Perforation parameters including azimuth angle and depth can influence the deflecting geometries of the diverting fracture. Higher perforation depth and azimuth angle can result in a higher deflection angle and consequently a more curving fracture.
(3)
Fluid properties such as the injection rate and fluid viscosity are vital factors that affect the propagation behaviors of the diverting fracture. The deflection angle is sensitive to the change of the injection rate and fluid viscosity, thereby resulting in a more curving diverting fracture with higher values. To generate the preferred diverting fracture, higher injection rate and fluid viscosity are recommended. Furthermore, there are no additional changes of deflection angles when the injection rate and viscosity exceed the value of 11 × 10−4 m3/s and 80 mpa·s, respectively.
(4)
For far-field plugging and diverting, the deflecting behavior were influenced by the initial location of the diverting fracture. The location near the root of the initial fracture can enhance the stress reorientation resulting in a more curved fracture. Thus a plugging location near the root of the initial fracture is preferred.

Author Contributions

Conceptualization, J.L. and S.D.; Methodology, J.L.; Software, X.L.; Validation, W.H., and S.D.; Formal analysis, Y.Y.; Investigation, X.L.; Resources, Y.Y.; Data curation, W.H.; Writing-original draft preparation, J.L.; Writing-review and editing, S.D.; Visualization, S.D.; Supervision, S.D.; Project administration, S.D.; Funding acquisition, S.D. and W.H.

Funding

This work was supported by the National Natural Science Foundation of China (No.11872042), the Sichuan Science and Technology Program (Nos.2018JY0024 & 2019YJ0156), the China Postdoctoral Science Foundation (2019M653395), and the Sichuan University Postdoctoral Research Foundation (2019SCU12049).

Conflicts of Interest

The authors declare no conflict of interest.

References

  1. Xu, Y.; Ezulike, O.D.; Zolfaghari, A.; Dehghanpour, H.; Virues, C. Complementary Surveillance Microseismic and Flowback Data Analysis: An Approach to Evaluate Complex Fracture Networks. In Proceedings of the SPE Annual Technical Conference and Exhibition, Dubai, UAE, 26–28 September 2016; p. 30. [Google Scholar]
  2. Haggerty, R.; Fleming, S.W.; Meigs, L.C.; McKenna, S.A. Tracer tests in a fractured dolomite: 2. Analysis of mass transfer in single-well injection-withdrawal tests. Water Resour. Res. 2001, 37, 1129–1142. [Google Scholar] [CrossRef] [Green Version]
  3. Zolfaghari, A.; Dehghanpour, H.; Ghanbari, E.; Bearinger, D. Fracture Characterization Using Flowback Salt-Concentration Transient. SPE J. 2016, 21, 233–244. [Google Scholar] [CrossRef]
  4. Sepehri, J.; Soliman, M.Y.; Morse, S.M. Application of Extended Finite Element Method to Simulate Hydraulic Fracture Propagation from Oriented Perforations. In Proceedings of the SPE Hydraulic Fracturing Technology Conference, The Woodlands, TX, USA, 3–5 February 2015; p. 15. [Google Scholar]
  5. Cafaro, D.C.; Drouven, M.G.; Grossmann, I.E. Optimization models for planning shale gas well refracture treatments. AiChE J. 2016, 62, 4297–4307. [Google Scholar] [CrossRef]
  6. Rezaei, A.; Bornia, G.; Rafiee, M.; Soliman, M.; Morse, S. Analysis of refracturing in horizontal wells: Insights from the poroelastic displacement discontinuity method. Int. J. Numer. Anal. Methods Geomech. 2018, 42, 1306–1327. [Google Scholar] [CrossRef]
  7. Deng, J.Q.; Lin, C.; Yang, Q.; Liu, Y.R.; Tao, Z.F.; Duan, H.F. Investigation of directional hydraulic fracturing based on true tri-axial experiment and finite element modeling. Comput. Geotech. 2016, 75, 28–47. [Google Scholar] [CrossRef]
  8. Fan, T.-G.; Zhang, G.-Q. Laboratory investigation of hydraulic fracture networks in formations with continuous orthogonal fractures. Energy 2014, 74, 164–173. [Google Scholar] [CrossRef]
  9. Zhou, J.; Jin, Y.; Chen, M. Experimental investigation of hydraulic fracturing in random naturally fractured blocks. Int. J. Rock Mech. Min. Sci. 2010, 47, 1193–1199. [Google Scholar] [CrossRef]
  10. Zou, Y.; Zhang, S.; Zhou, T.; Zhou, X.; Guo, T. Experimental Investigation into Hydraulic Fracture Network Propagation in Gas Shales Using CT Scanning Technology. Rock Mech. Rock Eng. 2015, 49, 33–45. [Google Scholar] [CrossRef]
  11. Zhou, J.; Chen, M.; Jin, Y.; Zhang, G.-Q. Analysis of fracture propagation behavior and fracture geometry using a tri-axial fracturing system in naturally fractured reservoirs. Int. J. Rock Mech. Min. Sci. 2008, 45, 1143–1152. [Google Scholar] [CrossRef]
  12. Weng, X. Modeling of complex hydraulic fractures in naturally fractured formation. J. Unconvent. Oil Gas Resour. 2015, 9, 114–135. [Google Scholar] [CrossRef]
  13. Zeng, Q.; Yao, J. Numerical simulation of fracture network generation in naturally fractured reservoirs. J. Nat. Gas Sci. Eng. 2016, 30, 430–443. [Google Scholar] [CrossRef]
  14. Zhang, X.; Jeffrey, R.G.; Wu, B. Mechanics of edge crack growth under transient pressure and temperature conditions. Int. J. Solids Struct. 2015, 69–70, 11–22. [Google Scholar] [CrossRef]
  15. Meyer, B.R.; Bazan, L.W. A Discrete Fracture Network Model for Hydraulically Induced Fractures—Theory, Parametric and Case Studies. In Proceedings of the SPE Hydraulic Fracturing Technology Conference, The Woodlands, TX, USA, 24–26 January 2011; p. 36. [Google Scholar]
  16. Yan, C.; Zheng, H. FDEM-flow3D: A 3D hydro-mechanical coupled model considering the pore seepage of rock matrix for simulating three-dimensional hydraulic fracturing. Comput. Geotech. 2017, 81, 212–228. [Google Scholar] [CrossRef]
  17. Carrier, B.; Granet, S. Numerical modeling of hydraulic fracture problem in permeable medium using cohesive zone model. Eng. Fract. Mech. 2012, 79, 312–328. [Google Scholar] [CrossRef] [Green Version]
  18. Sarris, E.; Papanastasiou, P. The influence of the cohesive process zone in hydraulic fracturing modelling. Int. J. Fract. 2011, 167, 33–45. [Google Scholar] [CrossRef]
  19. Moës, N.; Dolbow, J.; Belytschko, T. A finite element method for crack growth without remeshing. Int. J. Numer. Methods Eng. 1999, 46, 131–150. [Google Scholar] [CrossRef]
  20. Belytschko, T.; Black, T. Elastic crack growth in finite elements with minimal remeshing. Int. J. Numer. Methods Eng. 1999, 45, 601–620. [Google Scholar] [CrossRef]
  21. Dahi Taleghani, A.; Olson, J.E. How Natural Fractures Could Affect Hydraulic-Fracture Geometry. SPE J. 2013, 19, 161–171. [Google Scholar] [CrossRef]
  22. Qi, M.; Li, M.; Guo, T.; Liu, C.; Gao, S.; Tang, S. Influence of Oriented Perforation Design on Refracture Reorientation: Simulation and Experiment. J. Energy Resour. Technol. 2018, 140, 082903. [Google Scholar] [CrossRef]
  23. Wang, B.; Zhou, F.; Wang, D.; Liang, T.; Yuan, L.; Hu, J. Numerical simulation on near-wellbore temporary plugging and diverting during refracturing using XFEM-Based CZM. J. Nat. Gas Sci. Eng. 2018, 55, 368–381. [Google Scholar] [CrossRef]
  24. Gordeliy, E.; Abbas, S.; Prioul, R. Modeling of Near-Wellbore Fracture Reorientation Using a Fluid-Coupled 2D XFEM Algorithm. In Proceedings of the 50th U.S. Rock Mechanics/Geomechanics Symposium, Houston, TX, USA, 26–29 June 2016; p. 9. [Google Scholar]
  25. Taleghani, A.D.; Gonzalez-Chavez, M.; Hao, H.; Asala, H. Numerical simulation of hydraulic fracture propagation in naturally fractured formations using the cohesive zone model. J. Petrol. Sci. Eng. 2018, 165, 42–57. [Google Scholar] [CrossRef]
  26. Li, J.; Xiao, W.; Hao, G.; Dong, S.; Hua, W.; Li, X. Comparison of Different Hydraulic Fracturing Scenarios in Horizontal Wells Using XFEM Based on the Cohesive Zone Method. Energies 2019, 12, 1232. [Google Scholar] [CrossRef]
  27. Vahab, M.; Akhondzadeh, S.; Khoei, A.R.; Khalili, N. An X-FEM investigation of hydro-fracture evolution in naturally-layered domains. Eng. Fract. Mech. 2018, 191, 187–204. [Google Scholar] [CrossRef]
  28. Gong, D.G.; Qu, Z.Q.; Li, J.X.; Qu, G.Z.; Cao, Y.C.; Guo, T.K. Extended finite element simulation of hydraulic fracture based on ABAQUS platform. J. Petrol. Sci. Eng. 2016, 27, 1512–1520. [Google Scholar]
  29. Wang, X.; Liu, C.; Wang, H.; Liu, H.; Wu, H. Comparison of consecutive and alternate hydraulic fracturing in horizontal wells using XFEM-based cohesive zone method. J. Petrol. Sci. Eng. 2016, 143, 14–25. [Google Scholar] [CrossRef]
  30. Wang, X.L.; Shi, F.; Liu, C.; Lu, D.T.; Liu, H.; Wu, H.A. Extended finite element simulation of fracture network propagation in formation containing frictional and cemented natural fractures. J. Nat. Gas Sci. Eng. 2017, 50, 309–324. [Google Scholar] [CrossRef]
  31. Shi, F.; Wang, X.; Liu, C.; Liu, H.; Wu, H. An XFEM-based method with reduction technique for modeling hydraulic fracture propagation in formations containing frictional natural fractures. Eng. Fract. Mech. 2017, 173, 64–90. [Google Scholar] [CrossRef]
  32. Li, J.; Dong, S.; Hua, W.; Li, X.; Pan, X. Numerical Investigation of Hydraulic Fracture Propagation Based on Cohesive Zone Model in Naturally Fractured Formations. Processes 2019, 7, 28. [Google Scholar] [CrossRef]
  33. Nguyen, V.P.; Lian, H.; Rabczuk, T.; Bordas, S. Modelling hydraulic fractures in porous media using flow cohesive interface elements. Eng. Geol. 2017, 225, 68–82. [Google Scholar] [CrossRef]
  34. Yao, Y. Linear Elastic and Cohesive Fracture Analysis to Model Hydraulic Fracture in Brittle and Ductile Rocks. Rock Mech. Rock Eng. 2012, 45, 375–387. [Google Scholar] [CrossRef]
  35. Guo, J.; Zhao, X.; Zhu, H.; Zhang, X.; Pan, R. Numerical simulation of interaction of hydraulic fracture and natural fracture based on the cohesive zone finite element method. J. Nat. Gas Sci. Eng. 2015, 25, 180–188. [Google Scholar] [CrossRef]
  36. Haddad, M.; Sepehrnoori, K. Simulation of Multiple-Stage Fracturing in Quasibrittle Shale Formations Using Pore Pressure Cohesive Zone Model. In Proceedings of the SPE/AAPG/SEG Unconventional Resources Technology Conference, Denver, CO, USA, 25–27 August 2014; p. 16. [Google Scholar]
  37. Liu, C.; Wang, X.; Deng, D.; Zhang, Y.; Zhang, Y.; Wu, H.; Liu, H. Optimal spacing of sequential and simultaneous fracturing in horizontal well. J. Nat. Gas Sci. Eng. 2016, 29, 329–336. [Google Scholar] [CrossRef]
  38. Haddad, M.; Sepehrnoori, K. Simulation of hydraulic fracturing in quasi-brittle shale formations using characterized cohesive layer: Stimulation controlling factors. J. Unconvent. Oil Gas Resour. 2015, 9, 65–83. [Google Scholar] [CrossRef]
  39. Qu, Z.; Tian, Y.; Li, J.; Guo, T.; Li, X.; Liu, X. Numerical simulation study on fracture extension and morphology of multi-cluster staged fracturing for horizontal wells. J. China Univ. Petrol. 2017, 41, 102–109. [Google Scholar]
  40. Wang, D.; Zhou, F.; Ge, H.; Shi, Y.; Yi, X.; Xiong, C.; Liu, X.; Wu, Y.; Li, Y. An experimental study on the mechanism of degradable fiber-assisted diverting fracturing and its influencing factors. J. Nat. Gas Sci. Eng. 2015, 27, 260–273. [Google Scholar] [CrossRef] [Green Version]
  41. Feng, Y.; Gray, K.E. Modeling of curving hydraulic fracture propagation from a wellbore in a poroelastic medium. J. Nat. Gas Sci. Eng. 2018, 53, 83–93. [Google Scholar] [CrossRef]
  42. Zhang, R.; Hou, B.; Shan, Q.; Tan, P.; Wu, Y.; Gao, J.; Guo, X. Hydraulic fracturing initiation and near-wellbore nonplanar propagation from horizontal perforated boreholes in tight formation. J. Nat. Gas Sci. Eng. 2018, 55, 337–349. [Google Scholar] [CrossRef]
  43. Yin, J.; Xie, J.; Datta-Gupta, A.; Hill, A.D. Improved characterization and performance prediction of shale gas wells by integrating stimulated reservoir volume and dynamic production data. J. Petrol. Sci. Eng. 2015, 127, 124–136. [Google Scholar] [CrossRef]
  44. Zhao, J.; Chen, X.; Li, Y.; Fu, B. Simulation of simultaneous propagation of multiple hydraulic fractures in horizontal wells. J. Petrol. Sci. Eng. 2016, 147, 788–800. [Google Scholar] [CrossRef]
  45. Wang, D.; Zhou, F.; Ding, W.; Ge, H.; Jia, X.; Shi, Y.; Wang, X.; Yan, X. A numerical simulation study of fracture reorientation with a degradable fiber-diverting agent. J. Nat. Gas Sci. Eng. 2015, 25, 215–225. [Google Scholar] [CrossRef]
  46. Feng, Y.; Gray, K.E. Parameters controlling pressure and fracture behaviors in field injectivity tests: A numerical investigation using coupled flow and geomechanics model. Comput. Geotech. 2017, 87, 49–61. [Google Scholar] [CrossRef]
  47. Guo, T.; Zhang, S.; Zou, Y.; Xiao, B. Numerical simulation of hydraulic fracture propagation in shale gas reservoir. J. Nat. Gas Sci. Eng. 2015, 26, 847–856. [Google Scholar] [CrossRef]
  48. Guo, T.; Zhang, S.; Qu, Z.; Zhou, T.; Xiao, Y.; Gao, J. Experimental study of hydraulic fracturing for shale by stimulated reservoir volume. Fuel 2014, 128, 373–380. [Google Scholar] [CrossRef]
  49. Beugelsdijk, L.J.L.; de Pater, C.J.; Sato, K. Experimental Hydraulic Fracture Propagation in a Multi-Fractured Medium. In Proceedings of the SPE Asia Pacific Conference on Integrated Modelling for Asset Management, Yokohama, Japan, 25–26 April 2000; p. 8. [Google Scholar]
  50. Olson, J.E. Multi-fracture propagation modeling: Applications to hydraulic fracturing in shales and tight gas sands. In Proceedings of the 42nd U.S. Rock Mechanics Symposium (USRMS), San Francisco, CA, USA, 29 June–2 July 2008; p. 8. [Google Scholar]
  51. Zhang, X.; Jeffrey, R.G.; Bunger, A.P.; Thiercelin, M. Initiation and growth of a hydraulic fracture from a circular wellbore. Int. J. Rock Mech. Min. Sci. 2011, 48, 984–995. [Google Scholar] [CrossRef]
  52. Yu, J.; Shen, F.; Gu, Q. Influence of perforation parameters on hydraulic fracturing of fracture pressure in horizontal well. Petrol. Geol. Recovery Effic. 2011, 18, 105–106. [Google Scholar] [CrossRef]
Figure 1. Schematic of enrich nodes and fluid nodes.
Energies 12 02044 g001
Figure 2. Cohesive traction-separation relation based on cohesive zone method (CZM).
Energies 12 02044 g002
Figure 3. Fracturing flow pattern within fracture.
Energies 12 02044 g003
Figure 4. Model construction: (a) construction of initial fracture and perforation; and (b) mesh part of whole model.
Energies 12 02044 g004
Figure 5. Schematic diagram of deflection angle.
Energies 12 02044 g005
Figure 6. Comparison result between numerical model and experiment: (a) numerical result based on extended finite element method (XFEM); and (b) true tri-axial experiment result [40].
Energies 12 02044 g006
Figure 7. Reorientation behavior of refracturing fractures with different perforation azimuth angle (PORPRES present the pore-pressure with enrichments: unit is Pa).
Energies 12 02044 g007
Figure 8. Relationship between perforation angle and two deflection angles (θ1 and θ2 corresponding to quarter-length (10 m) and the half-length (20 m) deflection angle, respectively).
Energies 12 02044 g008
Figure 9. Reorientation behavior of refracturing fractures with different horizontal stress difference (PORPRES present the pore-pressure with enrichments: unit is Pa).
Energies 12 02044 g009
Figure 10. Relationship between stress difference and two deflection angles (θ1 and θ2 corresponding to quarter-length (10 m) and the half-length (20 m) deflection angle, respectively).
Energies 12 02044 g010
Figure 11. Reorientation behavior of refracturing fractures with different injection rate (PORPRES present the pore-pressure with enrichments: unit is Pa).
Energies 12 02044 g011
Figure 12. Relationship between injection rate and two deflection angles (θ1 and θ2 corresponding to quarter-length (10 m) and the half-length (20 m) deflection angle, respectively).
Energies 12 02044 g012
Figure 13. Reorientation behavior of refracturing fractures with different fluid viscosity (PORPRES present the pore-pressure with enrichments: unit is Pa).
Energies 12 02044 g013
Figure 14. Relationship between fluid viscosity and two deflection angles (θ1 and θ2 corresponding to quarter-length (10 m) and the half-length (20 m) deflection angle, respectively).
Energies 12 02044 g014
Figure 15. Reorientation behavior of refracturing fractures with different initiation location (PORPRES present the pore-pressure with enrichments: unit is Pa).
Energies 12 02044 g015
Figure 16. Relationship between initiation location and two deflection angles (θ1 and θ2 corresponding to quarter-length (10 m) and the half-length (20 m) deflection angle, respectively).
Energies 12 02044 g016
Figure 17. Reorientation behavior of refracturing fractures with different perforation depth (PORPRES present the pore-pressure with enrichments: unit is Pa).
Energies 12 02044 g017
Figure 18. Relationship between perforation depth and two deflection angles (θ1 and θ2 corresponding to quarter-length (10 m) and the half-length (20 m) deflection angle, respectively).
Energies 12 02044 g018
Table 1. Input parameters of the numerical model.
ParametersValues
Model dimension200 × 200 m
Wellbore radius10 cm
Perforation length0.1–0.6 m
Perforation angle, θ0°–90°
Maximum horizontal stress, σH15–25 MPa
Minimum horizontal stress, σh15 MPa
Vertical stress, σv25 MPa
Young’s modulus, E12.79 GPa
Poisson’s ratio, υ0.25
Tensile strength, σt1.82 MPa
Fracture energy, Gc28 N/mm
Permeability, k10 mD
Leak-off coefficient, c1 × 10−14 m/(pa·s)
Porosity, φ0.25
Fluid viscosity, μ1–100 mpa·s
Injection rate, Q3 × 10−4–13 × 10−4 m3/s
Initial pore pressure, P10 MPa

