Article

High-Efficiency Bi-Directional Single-Phase AC/DC Converter Design and Field Application for LVDC Distribution

Smart Power Distribution Lab., KEPCO Research Institute, 105 Munji-Ro, Yuseong-Gu, Daejeon 34056, Korea
*
Author to whom correspondence should be addressed.
Energies 2019, 12(11), 2191; https://doi.org/10.3390/en12112191
Submission received: 7 May 2019 / Revised: 2 June 2019 / Accepted: 3 June 2019 / Published: 8 June 2019
(This article belongs to the Special Issue Reliability of Power Electronic Systems)

Abstract

:
This paper describes the design and field application of a high-efficiency single-phase AC/DC converter that is suitable for distribution lines. First, an appropriate AC/DC converter was designed in consideration of the environment of the application system. In order to ensure high efficiency and high reliability, we designed an optimum switching element and capacitor suitable for the converter, and the protection element of the AC/DC converter was designed based on these elements. The control function for the power converter suitable for an LVDC distribution system is proposed for highly reliable operation. The AC/DC converter was manufactured based on the design and its performance was verified during application in an actual low-voltage DC (LVDC) distribution grid through tests at the demonstration site. The application to a DC distribution system in an actual grid is very rare and it is expected that it will contribute to the expansion of LVDC distribution.

1. Introduction

Low-voltage DC (LVDC) distribution is being considered globally to replace AC distribution in order to provide a stable power supply for digital consumer electronics and to improve network efficiency following the interconnection of renewable energy sources. The share of DC power consumption in PCs, TVs, DC buildings, internet data centers (IDCs), and DC homes is expected to increase. In particular, EPRI in the United States estimates that digital devices will account for 50% of the world’s total DC load in 2020. In addition, due to the expansion of renewable energy, such as photovoltaics (PV) generation and fuel cells, there is a need for a new high-quality electricity service, such as DC distribution service technology [1]. Korea Electric Power Corporation (KEPCO) was founded under the Korea Electric Power Corporation Act to facilitate development of electric power sources, satisfy the nation’s electric power supply and demand, and contribute to the development of national economy. The Act on the Management of Public Institution s classifies KEPCO as a market-oriented public corporation. In response to global trends, KEPCO has an interest in the LVDC distribution system. In particular, many studies on AC/DC converters that connect with existing high-voltage AC systems are in development [2]. This paper focuses on the design, manufacturing, and demonstration of AC/DC power converters for converting high-voltage AC systems in a mountainous area, which come into frequent contact with trees, to an LVDC distribution system [3,4]. First of all, the capacity of the power converter is chosen by analyzing the load of the system, its switching elements, protection devices, and switching frequencies are chosen to ensure stable operation and high efficiency. In order to realize the high-efficiency power converter, the AC/DC converter applies SiC-MOSFETs, which provides high switching operation and low switching loss. In addition, a control function of an AC/DC converter suitable for an LVDC distribution system is applied for highly reliable power supply when it is connected with the real system. The equipment is manufactured based on the design contents and a performance demonstration is carried out by constructing a system at an LVDC distribution site with the similar environment before being applied to in an actual distribution grid. The on-site demonstration is required to verify the performance of the protection behavior through load fluctuations and line fault simulations. We present the demonstration results from the AC/DC converter to a low-load and low-voltage long-distance DC distribution system. The case of applying the LVDC distribution system to an actual distribution grid is very rare in the world, and the developed power converter, which is applied to DC systems with high efficiency, single phase, and bi-directional power transmission, has differences in its design and performance compared to existing products. Therefore, this paper provides a guideline of design and manufacturing of SiC-MOSFET-based AC/DC converter for LVDC distribution system. It may contribute to related researchers and engineers by presenting various analyses and validation of the actual implementation in LVDC demonstration site. In addition, this paper presents the standard of the design and specifications for the power converter required for the power distribution system by analyzing the AC/DC converter’s operation history and results.

2. Materials and Methods

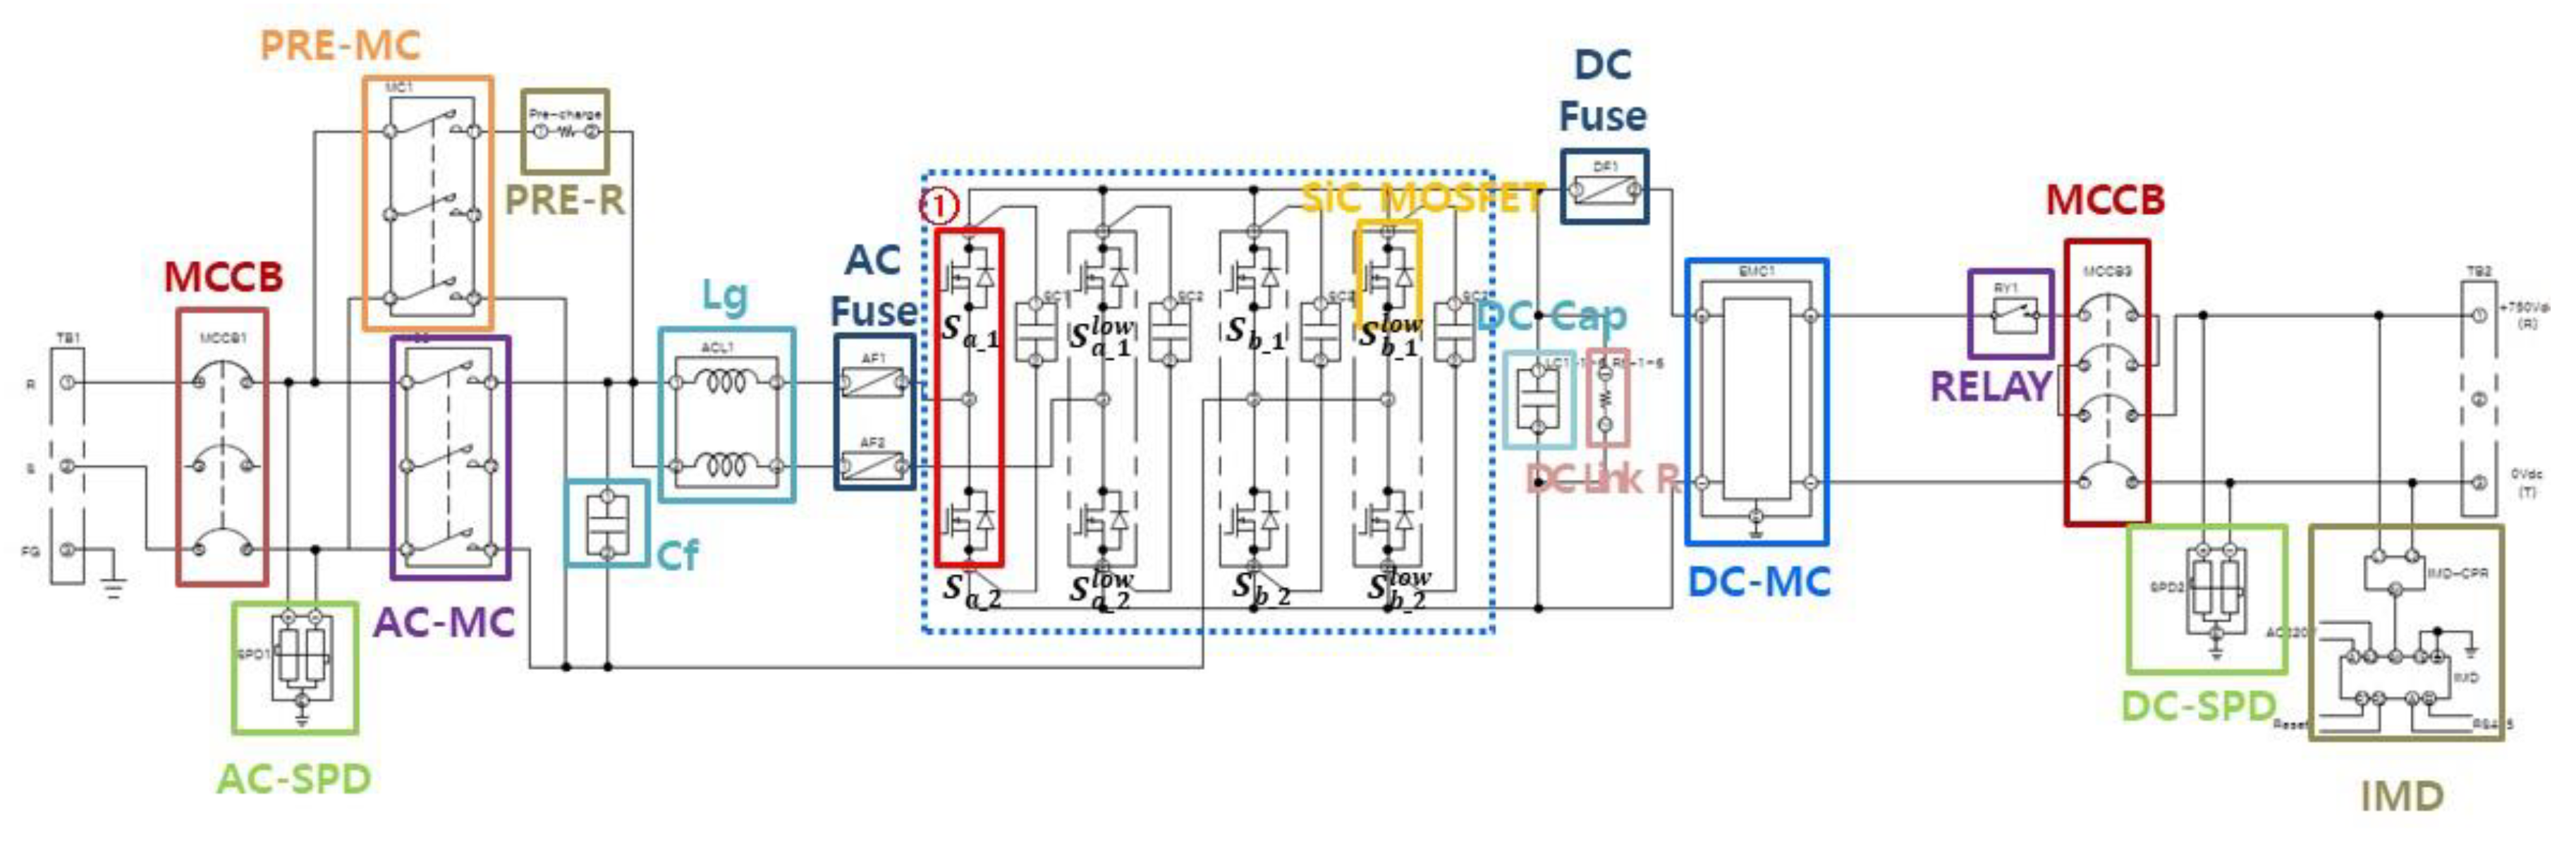
2.1. Hardware Design

The capacity of the AC/DC converter was designed based on the transformer capacity equation for the power distribution system used by KEPCO. As for a single-phase transformer, the capacity of a transformer is calculated while considering the sum of the load equipment, expected load increase rate, number of the expected years until reaching the overload limit, and load demand factor. The equation for the transformer capacity calculation is as follows:
D P r ( 1 + r ) n 1.3 P t
where ∑Pr is the sum of the load equipment, r is the expected load increase rate, n is the number of the expected years until the overload limit is reached, D is the load demand factor, and Pt is the rated capacity of the transformer.
The number of years until the overload limit is reached is the number of required years until the transformer utilization rate reaches 130% and its preferable range. This is generally 7 to 9 years, where it is adjusted and applied in consideration of the load in the installation area. In general, the load demand factor of the supplying load is in principle 0.65 in a shopping district and busy street, 0.5 in other areas, and 1.0 for seasonal loads like a cooling load. Therefore, the sum of the calculated loads and the conversion factor are ∑Pr × D and (1 + r)n/1.3, respectively. The target area can obtain 29.63 kW if the total contracted power, demand factor of the supplying load for a mountainous area, yearly load increase rate, and number of remaining years are substituted with 27 kW, 0.6, 20%, and 4.76, respectively. Therefore, the capacity of the AC/DC converter can be calculated as 30 kW.
The switching element can be selected based on the capacity of the converter. The switching device was designed by considering the high internal rated-voltage, and a SiC-MOSFET with a fast switching frequency was used. Considering the power factor of 0.99, the efficiency is 97%, and the converter capacity considering 150% margins is 46.9 kW. Thus, the maximum rms phase current is 236.7 A, considering that the single-phase AC input voltage for the primary circuit is 220 V. It can be confirmed that the rms phase current of 591.7 A is required when the margin is multiplied by 2.5 in anticipation of an inrush current. In order to realize the high-efficiency power conversion system, the converter is built with SiC-MOSFETs. Because the highest current rating of SiC-MOSFET on the market is 300 A, two 1200 V/300 A rated SiC-MOSFETs were designed in parallel to configure a switching element. These two SiC-MOSFETs conduct switching operation with the same gating signal at the same time. The DC link output from a single-phase AC/DC converter requires low voltage ripple and stable voltage fluctuation as the supply voltage of the DC line. Here, the ripple in the DC output voltage was selected within 1% of the rated voltage as its specification, and the DC link capacitance must be considered to meet the selected ripple voltage. The DC output voltage and voltage ripple are calculated as 750 V and 7.5 V, respectively. The voltage ripple of the DC link can be expressed as v d c , r i p p l e m a x and v d c , r i p p l e m i n , as shown in Figure 1.
The capacitance, which is above the design value, was applied while considering the following equation for the DC link capacitance:
C d c = I ^ d c , r i p p l e 2 ω g v d c , r i p p l e m a x = S 2 ω g V d c n v d c , r i p p l e m a x
where S is the apparent power, ωg is the angular frequency of the system, Vdc is the rated voltage, and Vdc_ripple is the required ripple voltage. The output voltage ripple is 15 V within ±1%, but the design was based on a 12 V ripple voltage in consideration of the demand factor. When the calculation is carried out in consideration of the specifications of the single-phase AC/DC converter, the DC link capacitance is Cdc = 30.0 kVA/(2 × 377 rad/s × 750 V × 12 V) = 4420.87 μF. Therefore, the output stage capacitance is designed to be at least 4420.87 μF. Table 1 summarizes the circuit design values of the power converter. There are various grid current filter circuit such as L-, LC-, and LCL-filters. By considering system volume and weight, the grid side filter of this study is designed with LC configuration to suppress harmonics. The filtering principle of LC-filter is the same as the LCL-filter, however, the secondary inductor of LCL-filter is removed and it is replaced with grid impedance, which is composed with L and R elements. The values of Lg and Cf are designed to satisfy under 5% total harmonic distortion (THD) at rated power [5].
The designed circuit was based on the above specifications, as follows. In order to improve the reliability of the topology when applied in an actual grid, a single-phase, full-bridge topology was applied, and the current capacity was addressed in parallel according to the element selection suitable for the rated current capacity. Therefore, a full-bridge topology consists of two MOSFET switching devices in parallel on one arm. Based on Figure 2, the area inside the power stack is ① part, and these two parts can be determined by leg. PRE-MC, PRE-R, and AC-MC are initial charging circuit. LC filter, MCCB for the device protection, and fuses are included in the input side. In addition, through AC SPD, the operation stability of the device was enhanced by preventing lightning waves from the system. Here, two half-bridges in parallel, which compose the left-side leg, are connected with individual filter inductors and fuses. Therefore, the filter inductors and fuses can be designed with relatively small current rating devices. In addition, this configuration provides a redundancy when a half-bridge fails and the system can maintain its power conversion normally with another healthy half-bridge in light load conditions. The circuit breaker and magnetic contactor are designed with three-phase products to handle the relatively high input current rating. The output capacitor, the MCCB for the device protection, SPD, and fuses are included in the output side of the SiC-MOSFET based full-bridge circuit. The fuse is used for DC side short circuit protection. In addition, IMDs to detect the ground fault of the DC distribution line, an IT system, are also included. The resistor is connected with DC-link capacitor to discharge DC-link voltage when the converter is in stand-by state. Although the SiC-MOSFET provides extremely high switching frequency operation, it causes higher-voltage ringing compared to the commutation of Si devices due to stray inductance. The spike-type voltage ringing can be suppressed by increasing gate resistance, however the switching loss is also increased. To maintain the low switching loss characteristic, which is one the biggest advantages of SiC device, snubber capacitors are required. The snubber capacitors are connected directly with each half-bridge leg. The design value was selected for each protection element to protect the switching element in the power converter. The detailed specifications are as follows. In addition, the device for the insulation resistance of the live wire is installed at the output stage to identify earth faults in the ungrounded line. Table 2 summarizes the protection element specifications of the power converter. The circuit diagram of the overall AC/DC converter is shown in Figure 2.

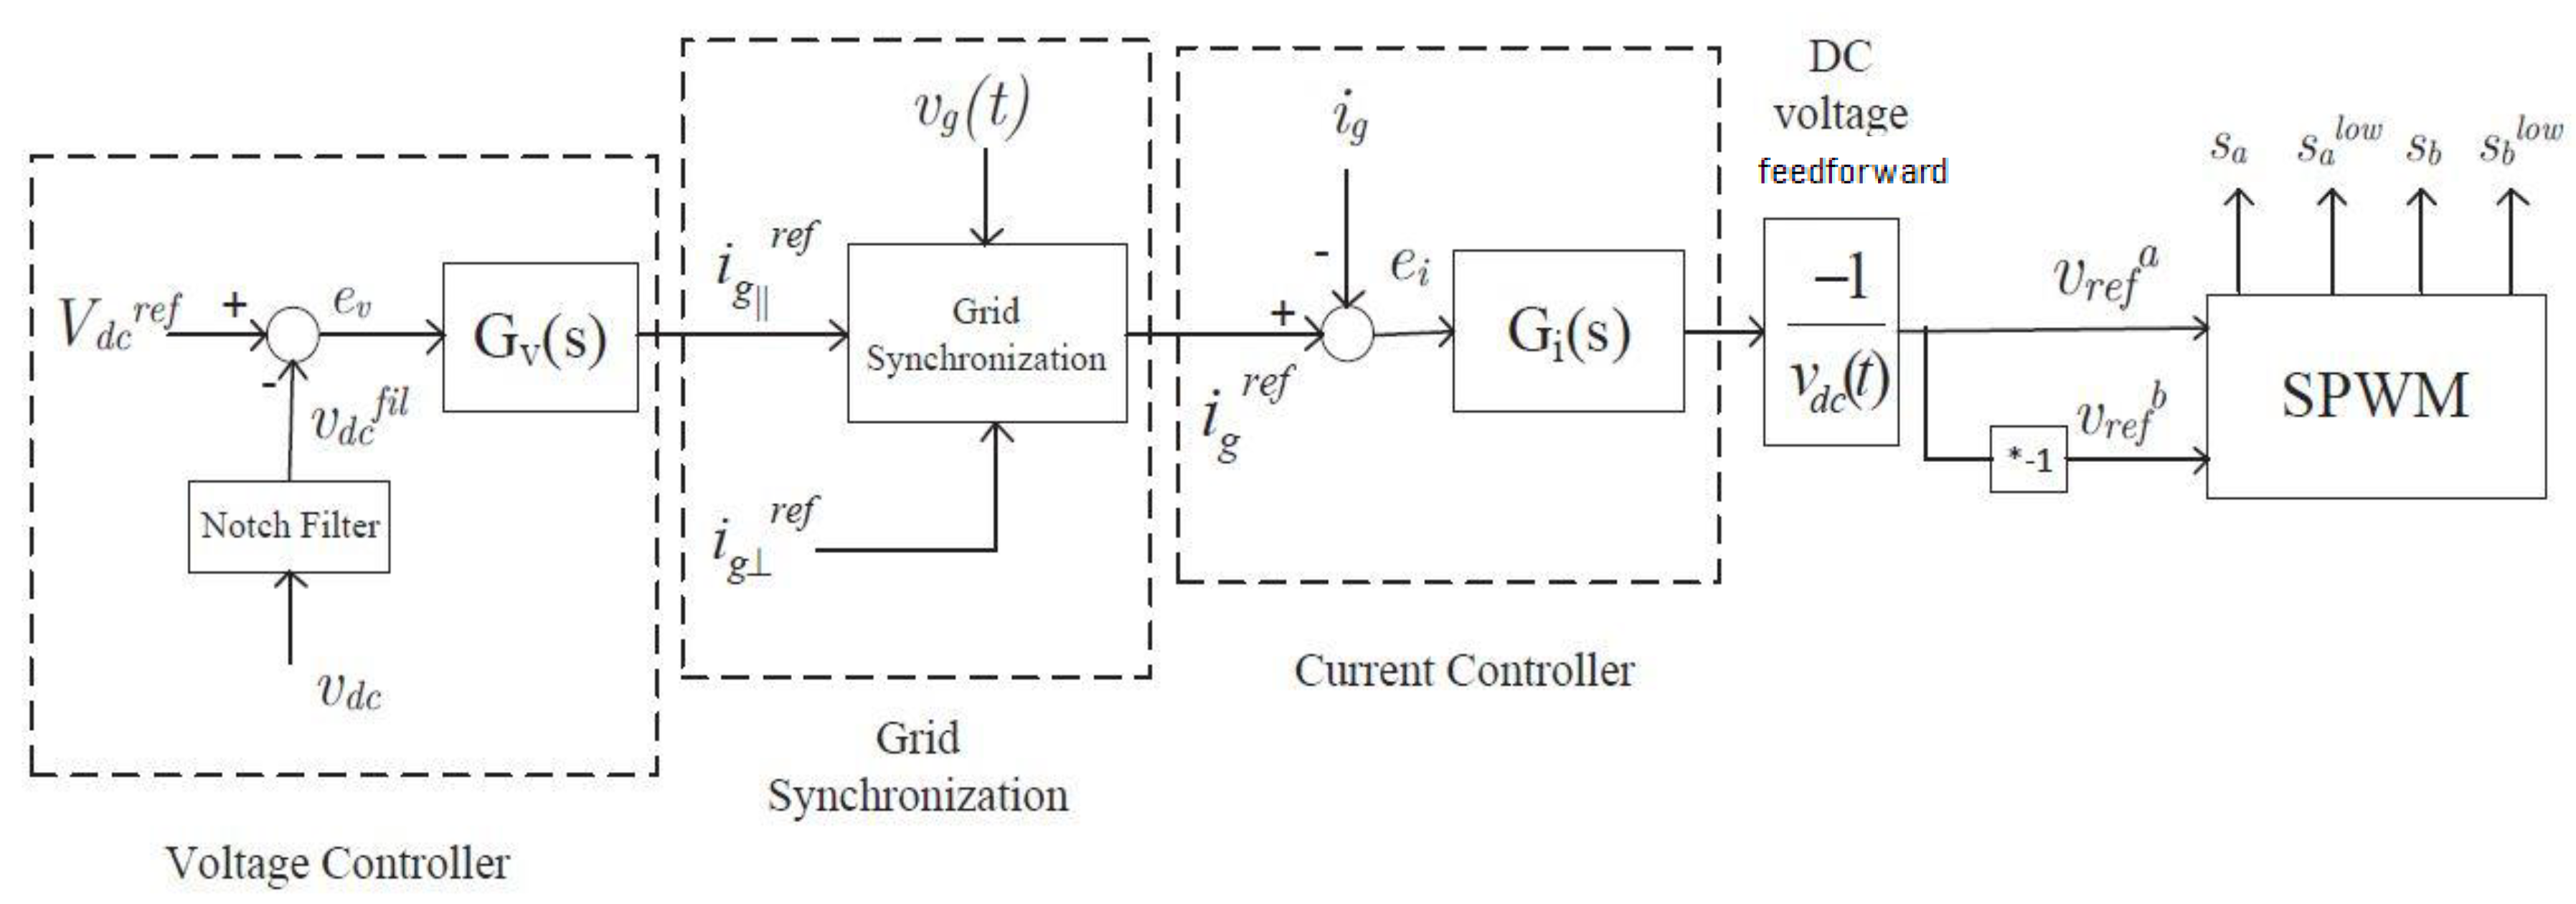
2.2. Control Algorithm

For control of AC/DC capacitors, the switching control algorithm of the power converter used a common control algorithm. However, this paper presents control methods and operation plans to improve operational stability when applied to DC distribution lines.
Figure 3 shows the control block diagram of the single-phase AC/DC converter. It is necessary to detect the system phase angle in order to control the grid-connected system. In order to detect the phase angle of grid, the synchronous reference frame-based phase locked loop (SRF-PLL) is used in this study. The SRF-PLL requires two voltage signals expressed in dq-axis SRF. Because there is only one voltage source in single phase grid and d-axis voltage is set as the single-phase voltage, the virtual q-axis voltage signal should be generated, which has 90º phase difference versus d-axis voltage. All pass filter (APF) has unity-gain magnitude for all frequency and introduces a 90º phase delay at the selected frequency. Therefore, the APF is used to create the virtual q-axis voltage in the PLL system [6]. The detected phase is used for synchronous coordinate conversion, which is required for AC current control. The DC link voltage is compared with the output voltage after the 750 Vref voltage command is received and is controlled using the PI controller [7,8,9,10]. The output voltage in a single-phase system generates a 120 Hz voltage ripple, which is double the system frequency due to the previously designed DC link capacitance. When the voltage is controlled using a sensor where the ripple is included, THD in the AC input current is affected and the system may become unstable. The 120 Hz voltage ripple in DC output side causes third harmonic of 180 Hz distortion in the grid input current. Therefore, it is necessary to control only the output voltage by removing the 120 Hz component in order to improve the input current THD and to stably control the DC link voltage. Therefore, the 120 Hz ripple voltage was removed from the DC link voltage using a notch filter and was used as the feedback value of the voltage controller [11]. The DC link voltage controller output appears as a current command in the AC system and controls the AC current using a current controller. The AC current is used as the feedback value of the current controller by performing synchronous coordinate conversion using the system phase. The output from the current controller is output as a reference voltage for the AC/DC converter control in the input side and the output reference voltage generates the system frequency and synchronized command using an inverse coordinate conversion. In the various carrier-based pulse-width modulation (PWM), the converter uses sinusoidal PWM (SPWM), which is simple and provides good harmonic characteristics [12]. The output reference voltage is compared with a triangular carrier band to firing six different gating signals. The paralleled SiC-MOSFETs receive same gating signals to operate at the same time.
This work also proposes the control function for the power converter suitable for the distribution line for stable power supply [13,14,15,16]. The converter must respond robustly to faults in the system or properly shut down in order to ensure reliable operation. In the case of a short circuit in the LVDC distribution line, it is necessary to block the short circuit according to the following criteria. The block setting is divided into two steps according to the magnitude of the current and the detection time. The input current is blocked after 60 s when 150% of the rated current is detected, and after 2 ms when more than 162% of the current is detected. The output current is blocked after 60 s when 184% of the rated current is detected, and after 2 ms when 200% of the rated current is detected. When it is blocked after 2 ms, we artificially set the delay time in order to accurately confirm that the actual overcurrent occurred by adding the filter control operation to cope with imaginary detection values by noise when applied in the field. In case of the 60 s setting, the delay time was also set to classify short-circuit failure in the DC distribution line and the inrush current in consideration of the motor load. This made it possible to supply a stable voltage when it was applied to the distribution system by complementing the blocking operation caused by the sensitive protection operation in the existing power converter. In addition, the inrush current and short-circuit current were classified according to the motor load so that a stable voltage could be supplied without stopping the operation of the power converter, even during an inrush current. Table 3 shows the scheme for input and output detection. An ungrounded system (IT system) is suitable for use in the LVDC distribution system in terms of safety due to a failure, electrolytic corrosion, and the economic aspects of the system [17,18]. For ungrounded lines, additional insulation resistance measurement (IMD) equipment is required in the DC line to detect this because there is no change in the voltage and current when a primary grounding fault occurs. Therefore, an additional IMD is required in the energized DC line to detect this. It is possible to determine whether a grounding fault occurs by changing the insulation resistance between the energized lines and earth. In order to realize this, the insulation resistance should be set to level 3 in the case of a grounding fault by associating the power converter with the IMD [19,20,21]. It should be possible to block the converter after an alarm occurs for a certain period of time at each level. In this paper, the insulation resistance ranged from 1 to 75 kΩ in order to halt operation of the AC/DC power converter after 1 min, and the operation ceases immediately when the insulation resistance is 1 kΩ or less. In addition, the DC output should be maintained normally for momentary power failure on the input side of the AC system for less than or equal to 0.1 s. For further power failure, it should be possible to automatically re-enter when the system status is determined normal after shutdown occurs. Therefore, after checking re-entry of the AC system, an attempt should be made to restart three times, and operation should be blocked if the system fails to restart more than three times within one minute.

3. AC/DC Converter Production

The specifications of the AC/DC power converter are summarized in Table 4 according to the previous design contents. The voltage of the DC line only allows ripple within 1% and the efficiency was designed to be 97% at the rated load. An ethernet communication port was configured for interlocking with the operating system and the board for storing the operational history data was configured. The operating temperature was set according to the Korean temperature for the stable outdoor operation.
The AC/DC converter is manufactured in a size (700 mm width, 1000 mm length, and 725 mm depth) that can be mounted on a pole as shown below. The enclosure was designed to meet the IP65 requirements of the enclosure protection standard IEC-529 to protect the power converter from external moisture, dust, and wind; thus, making it suitable for outdoor installation and operation. It can be fixed to upper and lower hanger bands on the pole as it has two fixing devices on the upper part, while the lower part remains fixed on the pole. The maximum weight cannot exceed 530 kg if it is to be installed on the pole. The total weight of the manufactured AC/DC power converter is 200 kg [22,23,24,25,26,27,28,29].

4. LVDC Demonstration Site Test in the Power Testing Center

Such as Figure 4, a field test was conducted at the LVDC distribution demonstration site owned by KEPCO in order to verify the operational performance and safety of the manufactured power converter. The demonstration site is located inside the power training (PT) center of KEPCO and has a system with very similar structure as that used in an actual application. A 1.5 km 3-core 70SQ CV-cable, 20 kW AC load simulator, and 20 kW DC load simulator were equipped in bi-pole form. The application system was a monopole structure, and the test was conducted through only one pole [30].

4.1. Performance Test

The basic performance test was conducted to verify if the target performance was reached by measuring the input voltage, current, THD, PF, output voltage, output current, voltage fluctuation rate, and conversion rate of the power converter while changing the load in 2 kW increments using a load simulation device. During the experiment, the data such as voltage, current, power, THD, and efficiency are measured by a power analyzer from DEWETRON Co. The voltage and current were measured at the input and output stages of the power converter.
The waveform in Figure 5a shows the voltage and power at the output stages of the power converter during a load change. Figure 5b shows the efficiency of the power converter and the ripple voltage at the output stages. The table shows the measured and calculated values of the input and output stages of the power converter during a load change. THD is 13.5% in the low load range and decreased below 5% as the load approaches the rated value, especially for loads above 22 kW. We could confirm that the system efficiency is already shown to be higher than 96%, even at loads above 8 kW, and the maximum efficiency was 97.62% when the load was 28 kW. There is overshoot and ringing on the waveform of efficiency. It is caused by the step change of load but the measuring scale of the power analyzer is not changed directly along with the load change and it requires some time delay. Therefore, the intermittent overshoot of efficiency waveform can be ignored. We could confirm that the ripple in the output voltage is at least 0.56% and increases gradually as the load increases, but the output voltage was controlled to be less than ±1% at 4.2 V, even in the rated load range. The performance test results in Table 5 show that these values meet the target specifications of the power converter.

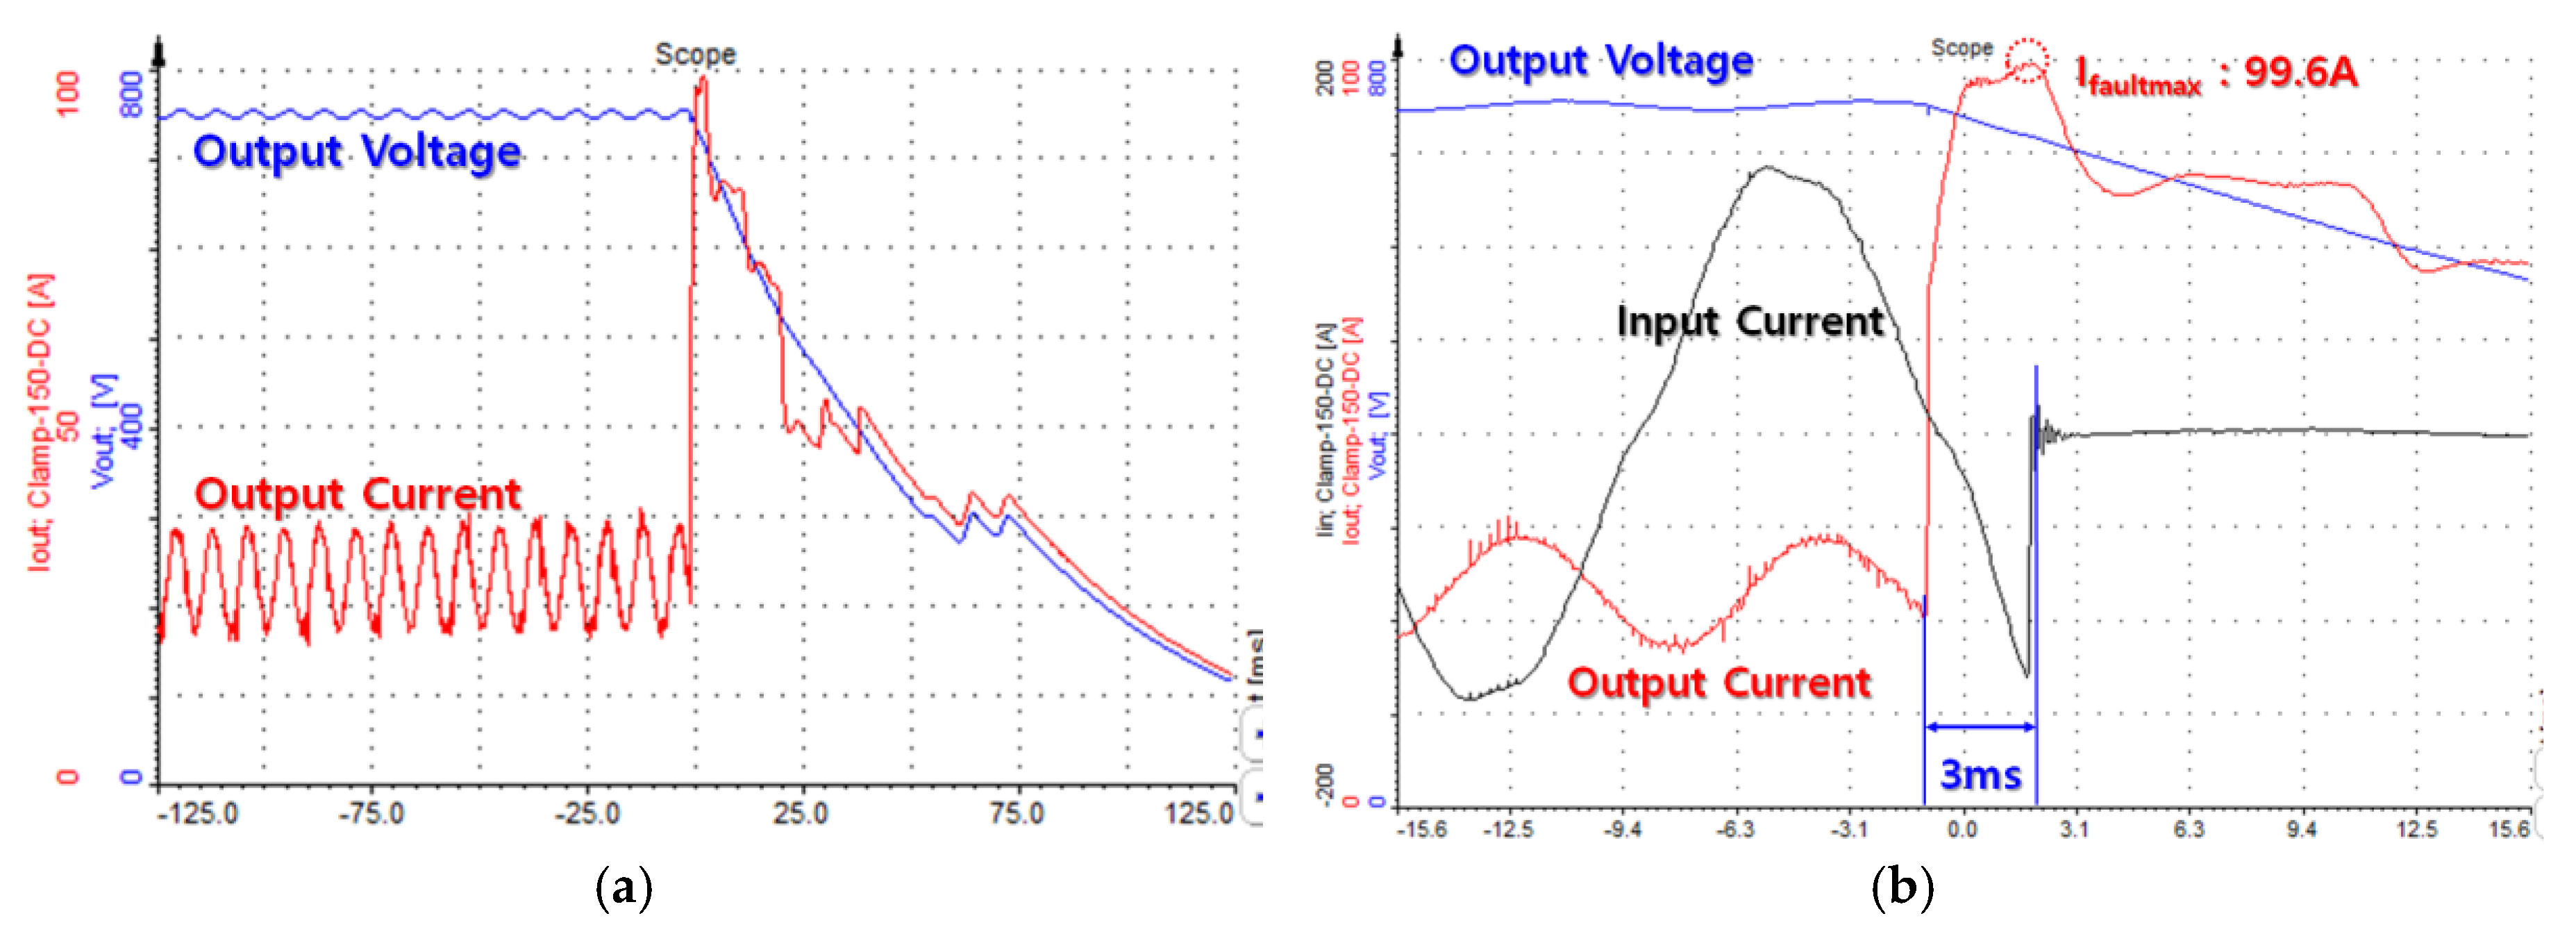
4.2. Protection Test

The DC fault configures a short circuit, which has very low impedance at the DC output side and it causes extremely high current flowing through the power converter and the DC distribution lines. Therefore, it is necessary to identify faults conditions on the line and block them in order to avoid a secondary accident in the distribution line. In order to verify this, an artificial fault generator (AFG) was used to verify the blocking ability of the power converter by arbitrarily generating a fault in the DC line. The Figure 6 shows the fault test configuration at the demonstration site and the AFG.
The AFG was used to create 1 s short-circuit fault conditions to verify the protection provided by the power converter. The output current protection level was set to 150% of the rated current (60 A). The fault simulator was configured to limit the short-circuit current to 100 A by setting the resistance to 7.5 ohm. If we look at the waveforms below, we can confirm that the operation of the power converter ended within 3 ms after the short fault occurs. In addition, we could confirm that a fault current of up to 99.6 A occurred, despite the fact that the protection was set to 60 A.
The grounding fault condition was also tested using the fault simulator as shown in Figure 7. A grounding fault could be detected according to changes in the insulation resistance value of the IMD inside the power converter in case of a grounding fault because there were no voltage or current changes in the power line. The insulation resistance value tends to change sensitively due to the line environment and can be found to operate between 100 and 200 kΩ under normal conditions. However, we find that the insulation resistance value fell below 1 kΩ and a grounding fault occurred when the line was in a ground condition. The power converter was configured to halt operation for 1 min after an earth fault occurred. We believe that further studies are required because there is no precise standard regarding the insulation resistance of an energized line and there is a lack of application cases in LVDC distribution. In addition, we also confirmed that the power converter restarted automatically after a momentary power failure, which ensures the supplied power remains stable during a momentary power failure in the AC system. The restart time of the power converter is 100 ms. The test results from the demonstration site verify that the performance of the power converter met the design goals.

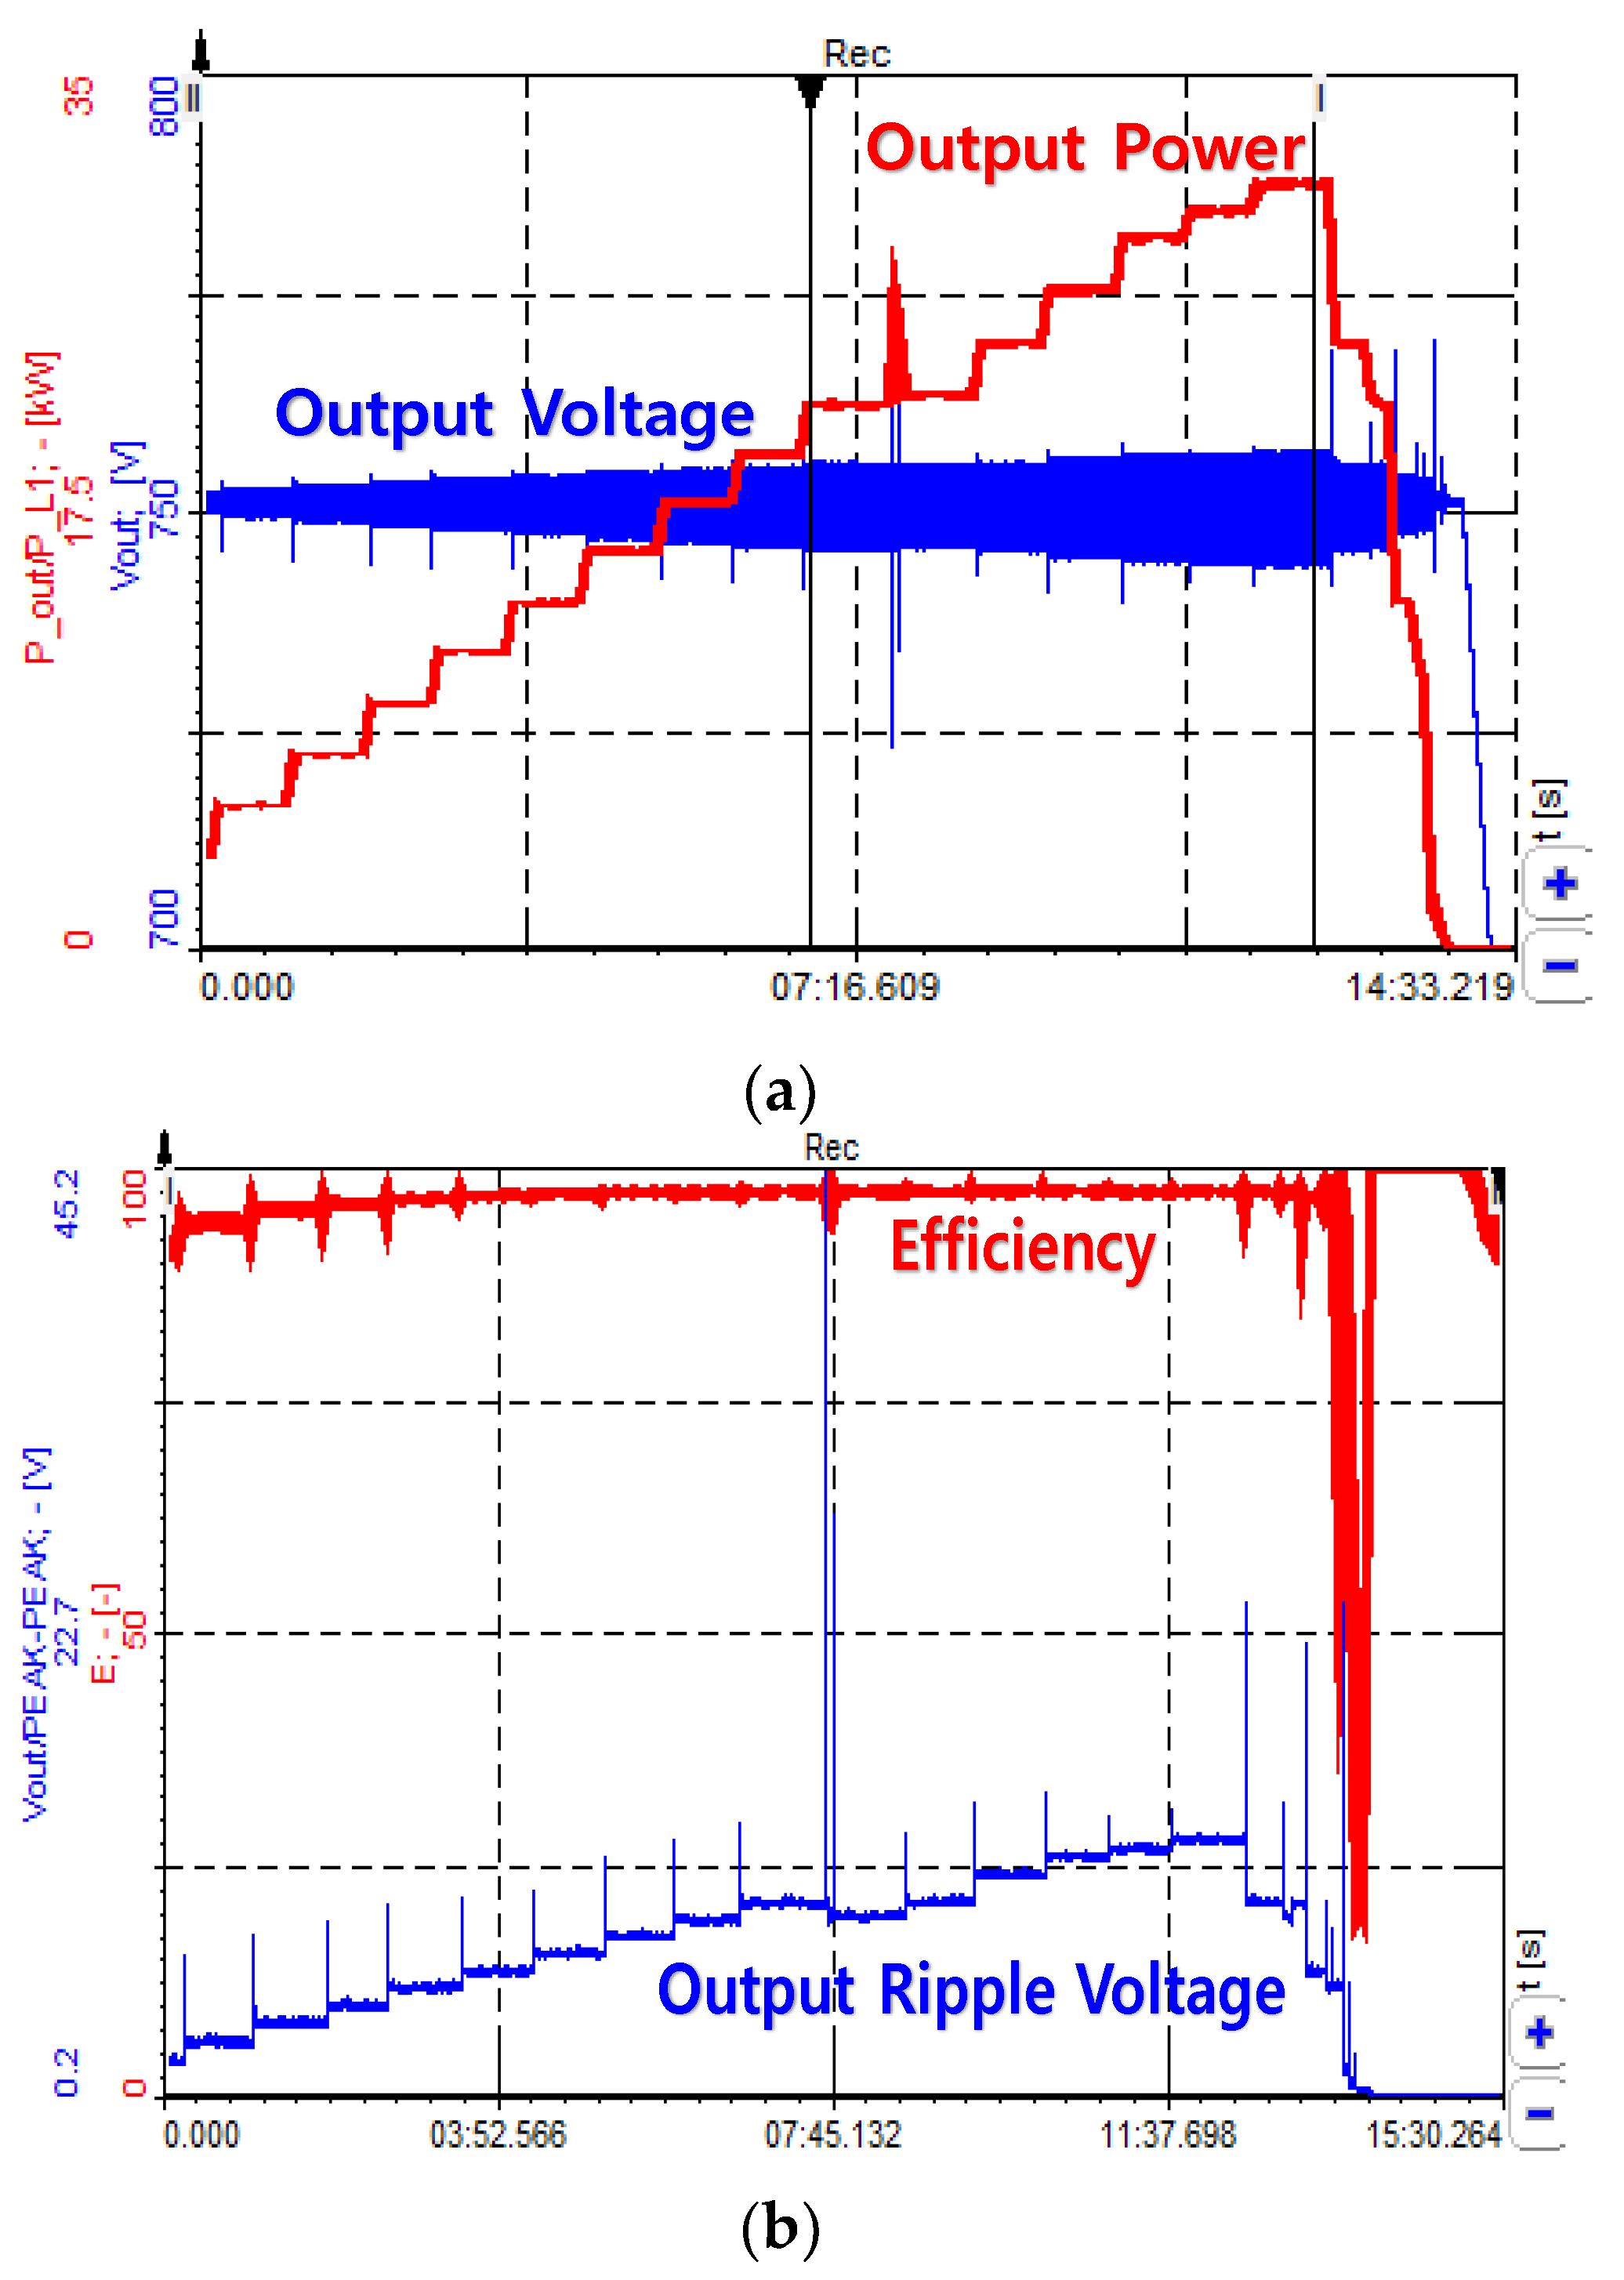
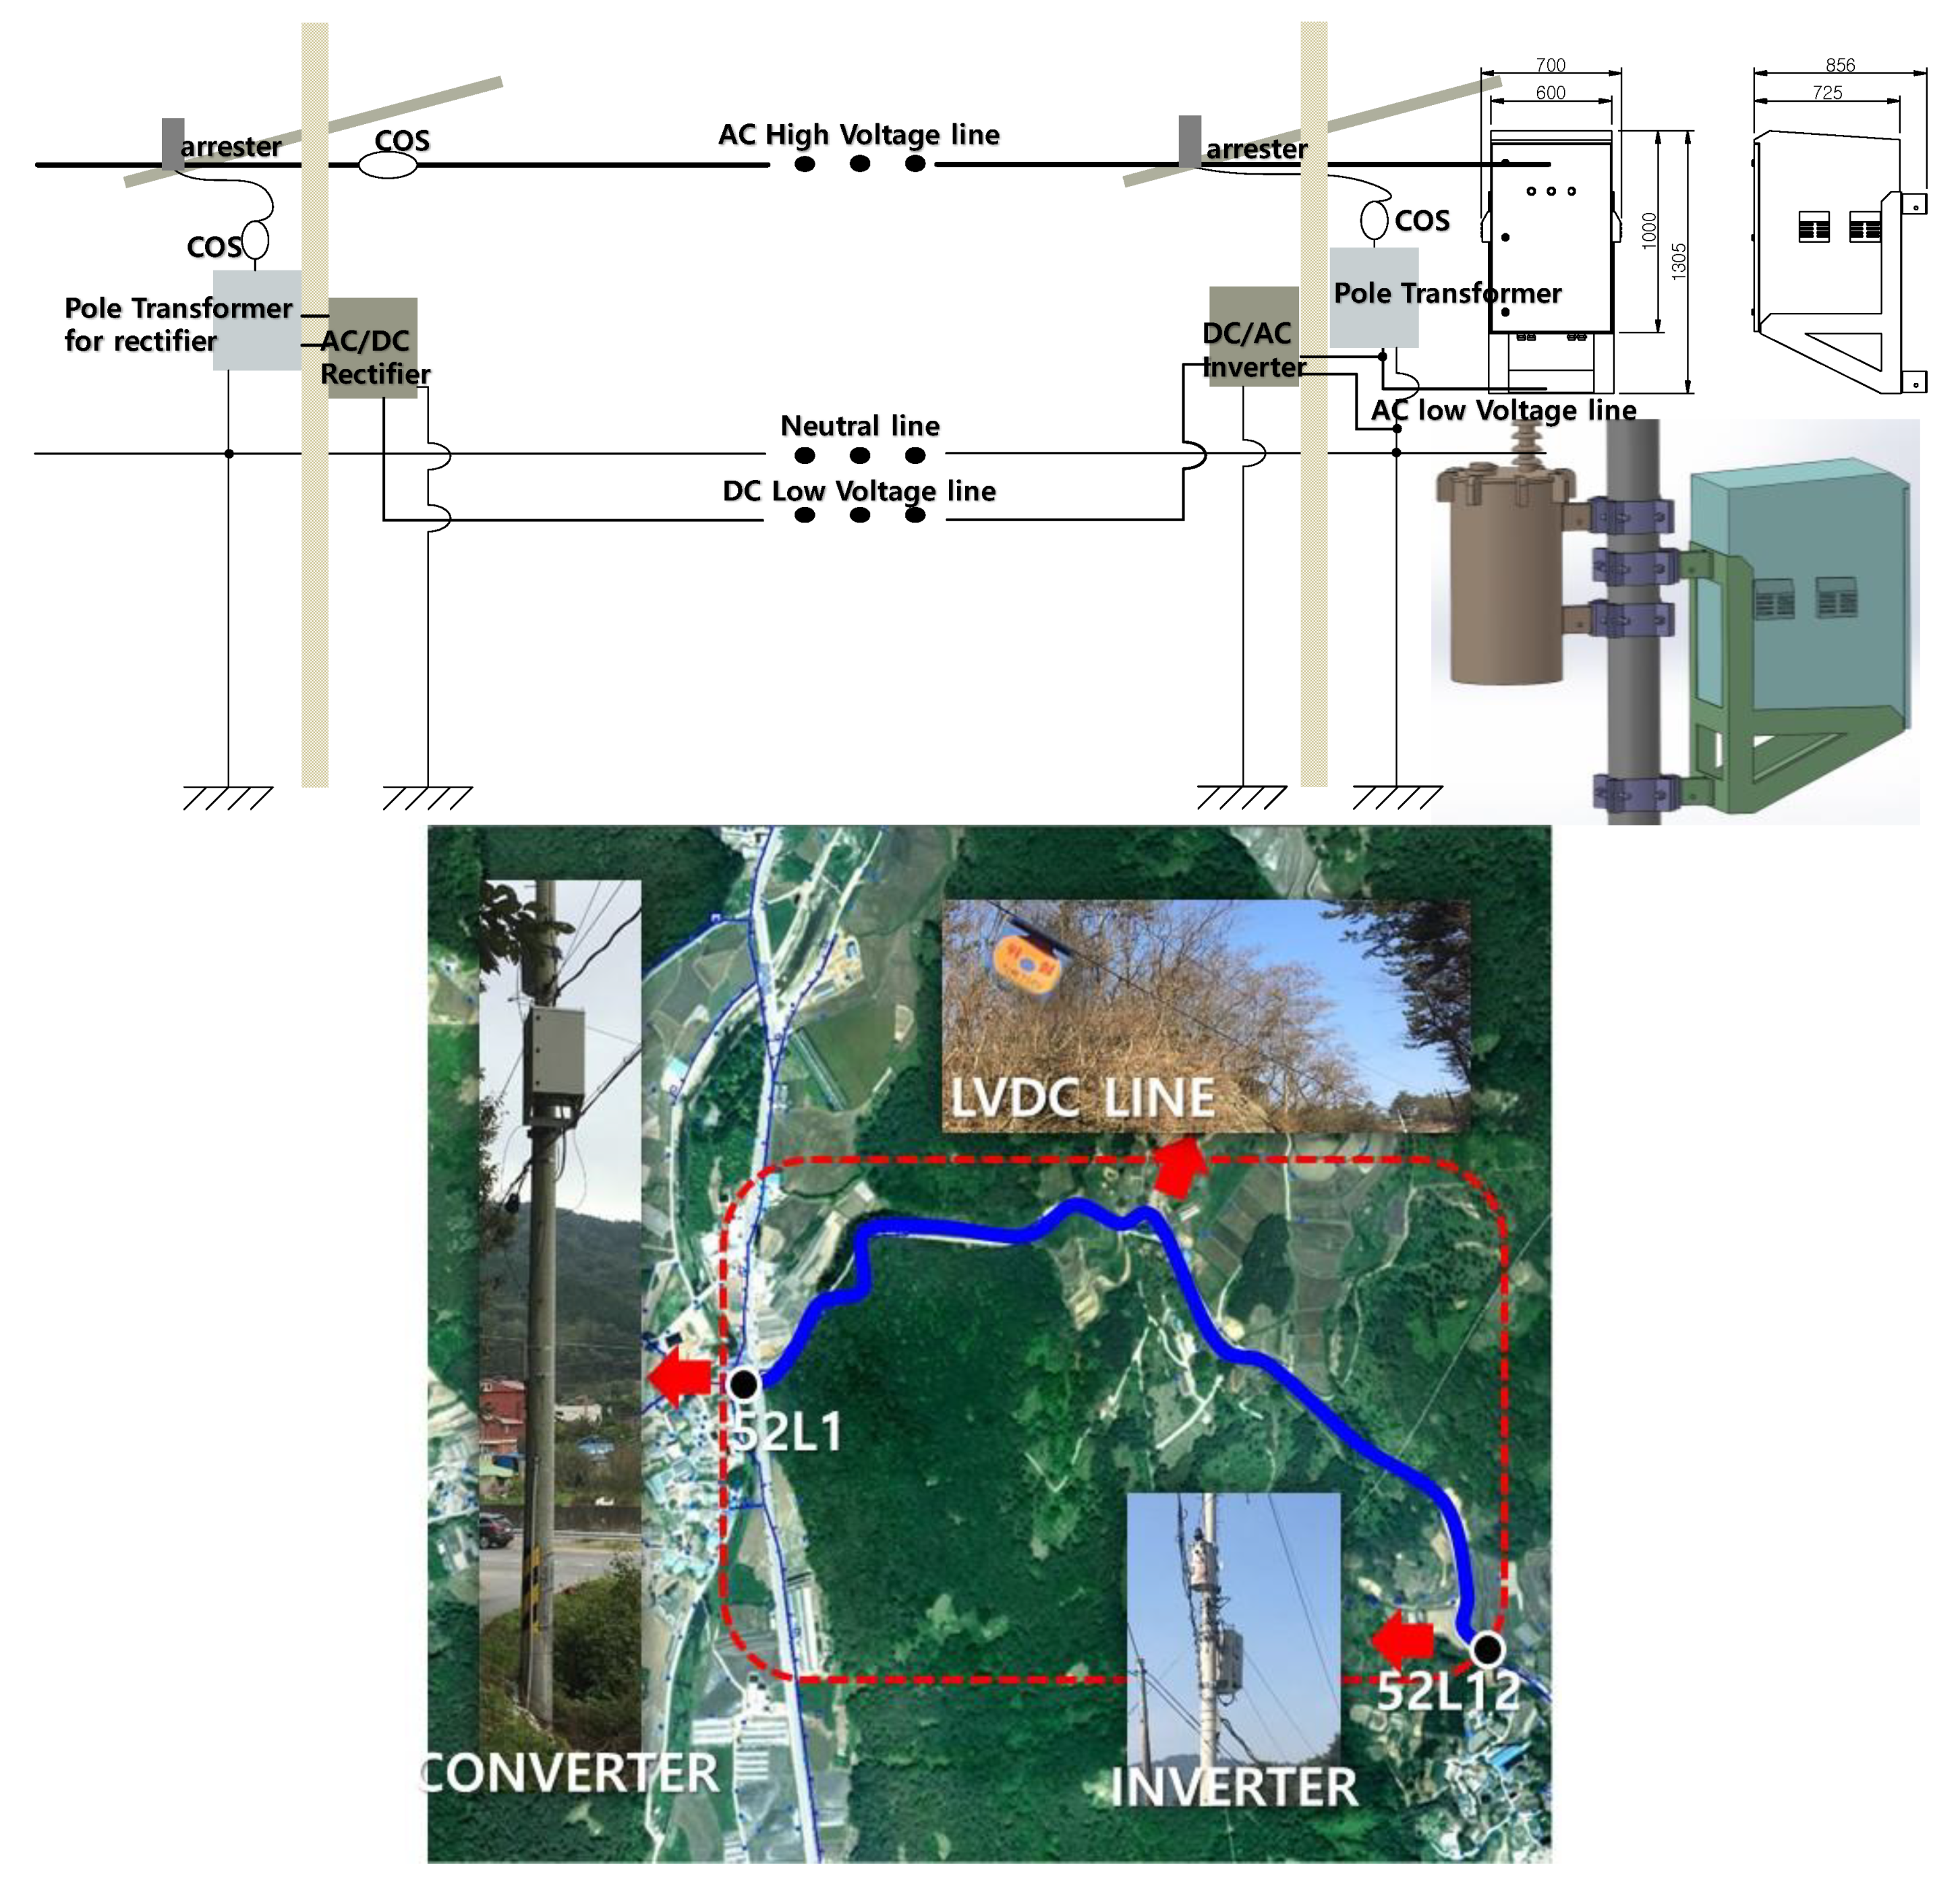
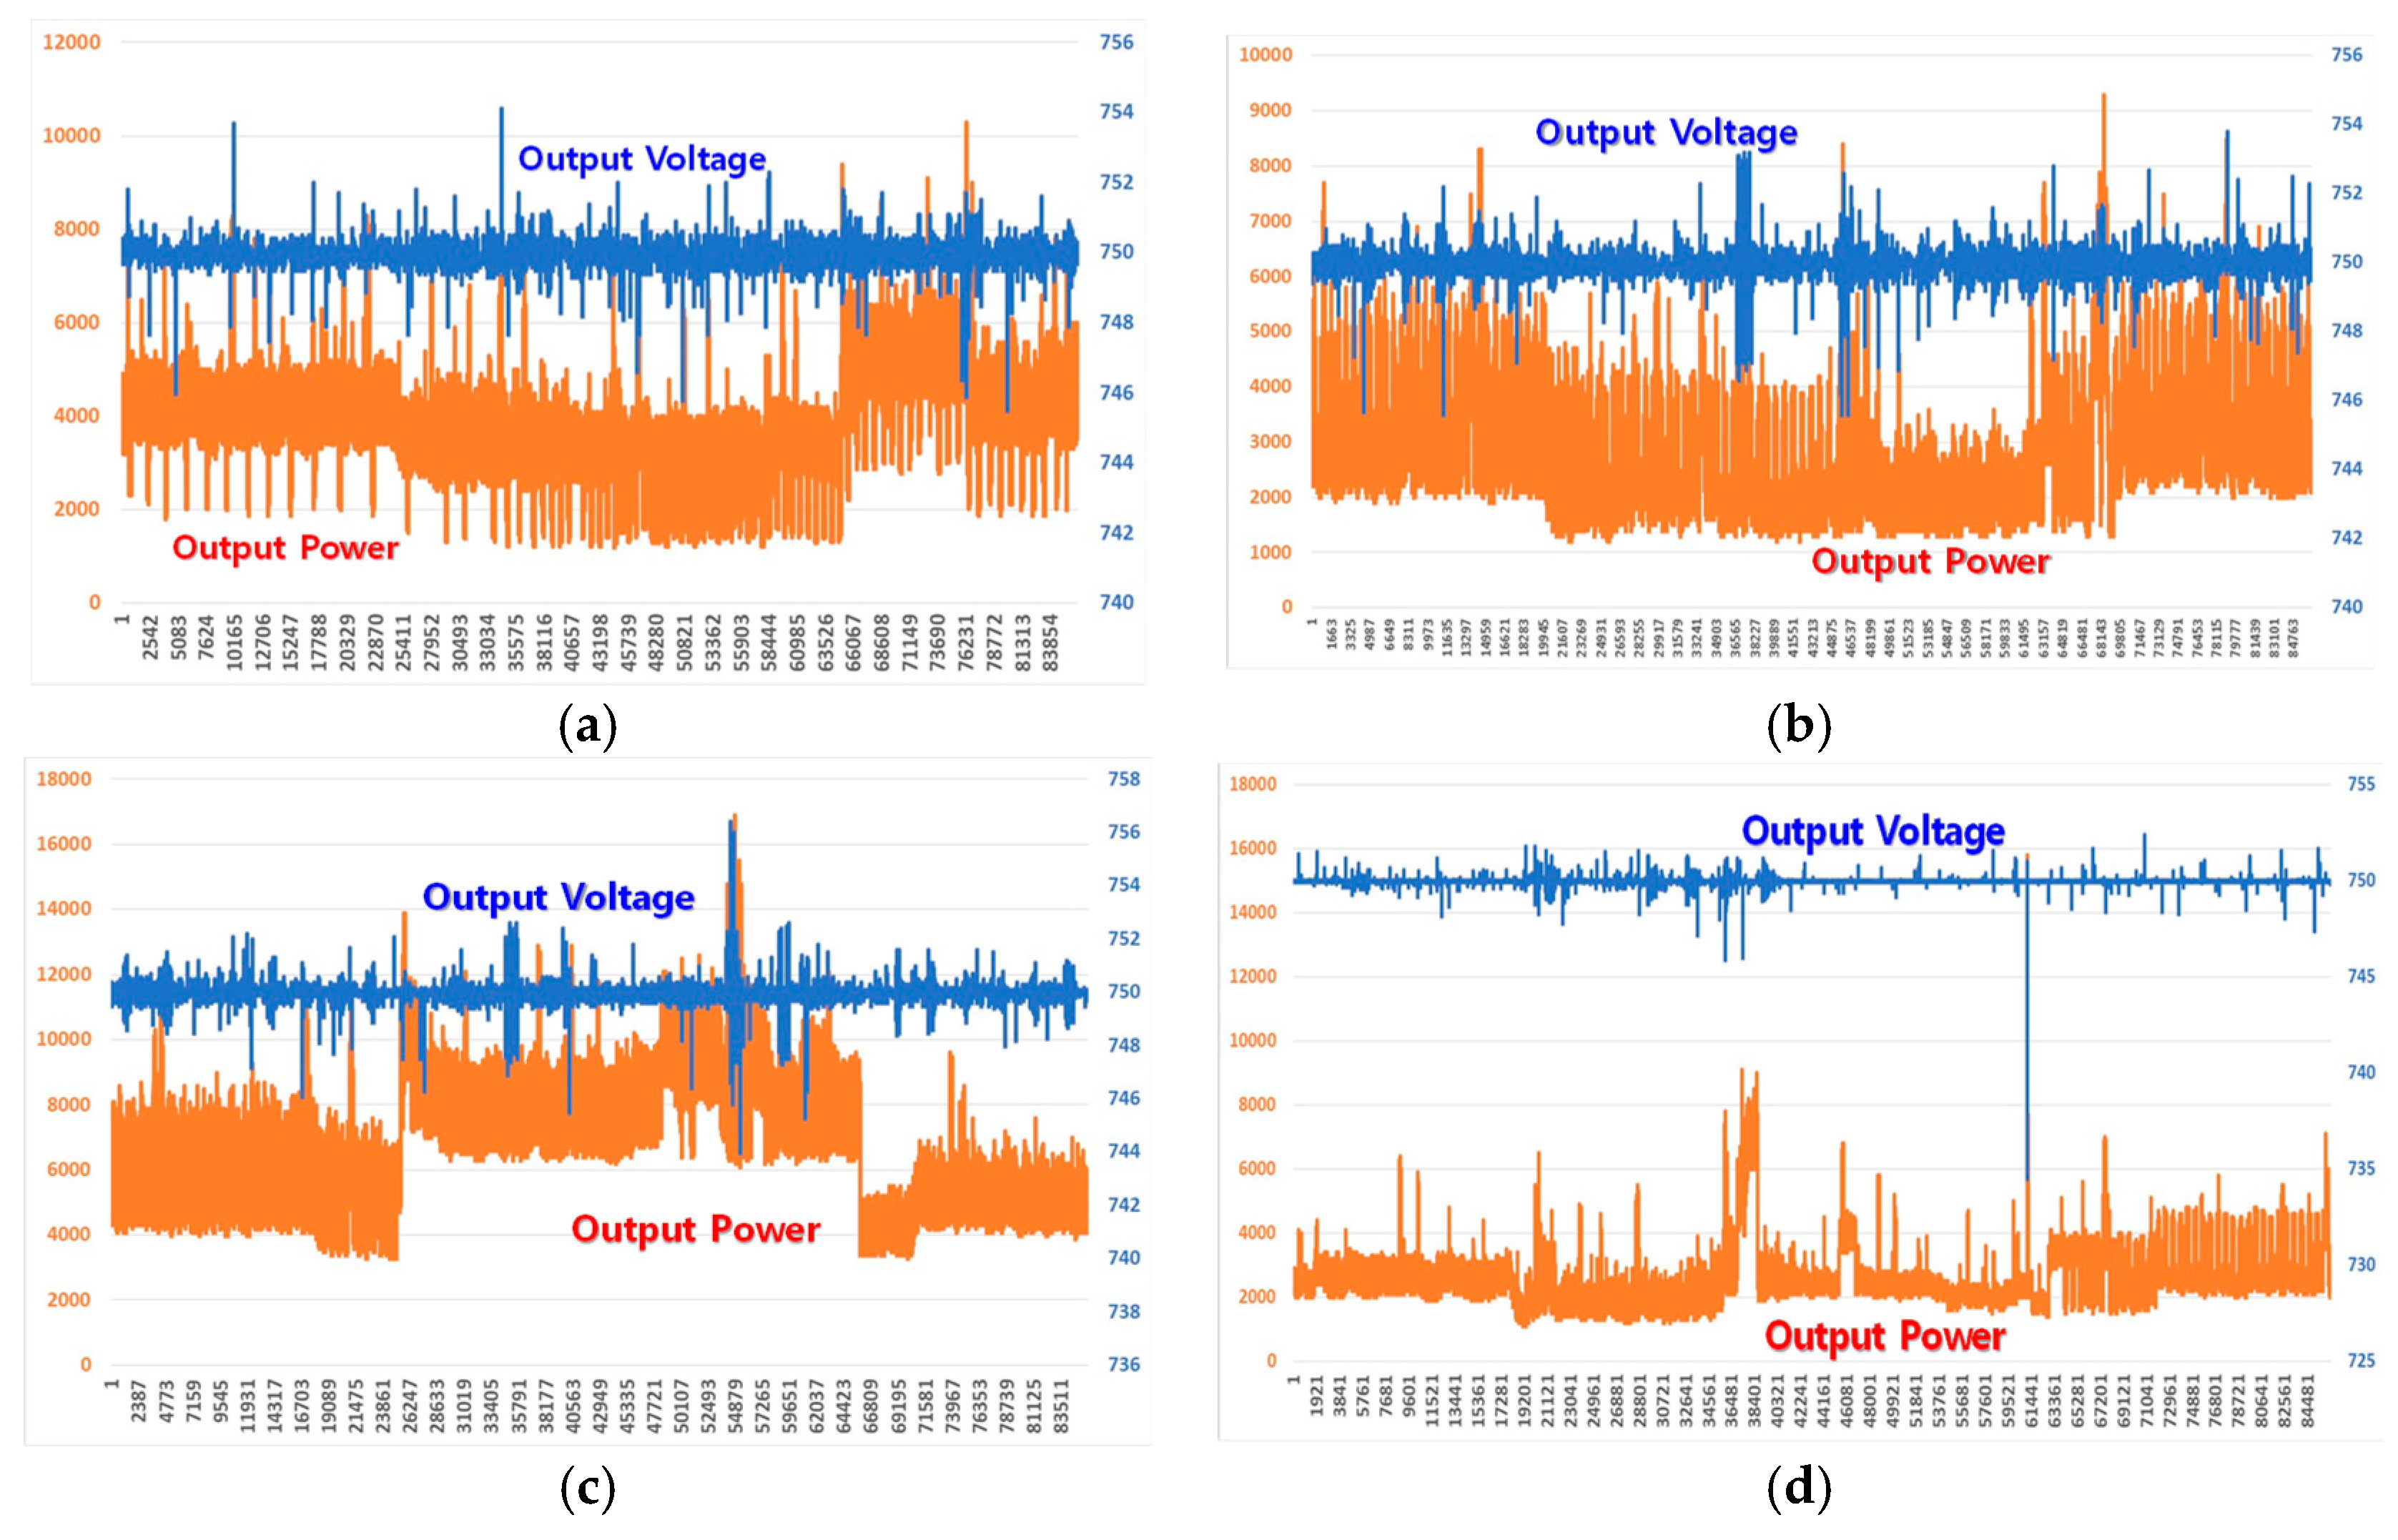
5. Field Test Results

The target LVDC distribution lines are connected to an AC high voltage system in a mountainous area where ABC cables are installed and frequently come into contact with trees in Figure 8. This is a long-distance distribution system with over 12 spans, and the contract power at the low-load end line is 30 kW or less (customer 12, communication repeater, and streetlight). The AC/DC converter switches the existing single-phase 13.2 kV AC voltage to low DC voltage if the line comes into contact with a tree in order to supply an AC load to the actual customer. Therefore, the DC/AC inverters are configured at the last parts of the load. The 2-core CV-cable 70SQ was configured for 12 spans, and the communication line, optical transmission system, and reception equipment were included alongside the operating system [30].
The results of applying the LVDC distribution system to an actual gird are as follows. Figure 9 shows the test result waveform based on daily and seasonal average operating histories stored by the operating system. The operational history is stored every second, yielding a total of 86,400 data collected each day. On average, it is practically operating at 30% to 60% of the power converter capacity, and one can confirm that it maintains high-efficiency performance, even at low loads. One can also confirm that the operation remains stable against load changes due to the control scheme in the power converter, although one can confirm that a sudden change in load occurs from the output power waveform due to the use of a generator for pumping water. It was confirmed that the insulation resistance of the energized line remained nearly constantly at a maximum of 500 kΩ with a minimum of 470 kΩ in the steady state. Table 6 summarizes the voltagte quality results of the power converter demonstrate site. The demonstration line in the LVDC distribution system has been operating since October 2016 until now, and improvements are actively being developed through data acquisition and analysis.

6. Conclusions

This paper presents the design, manufacturing, and demonstration of the SiC MOSFET-based bi-directional AC/DC power converter for LVDC distribution. To do so, the capacity of the power converter was selected through analyzing the load of the corresponding distribution line. The presented design method of all devices in AC/DC converter may offer a guideline with the actual demonstrations for constructions of high-efficiency and high-reliability power converters. In addition, the output voltage control method was presented to improve the current quality of grid side by suppressing the 120 Hz voltage ripple component in DC-link. An automatic re-input function was also proposed for detecting and preventing faults, such as short or grounding faults in the DC distribution line and, thus, the reliability of the LVDC distribution system increases.
In order to verify the feasibility of the proposed distribution system, the power converter was constructed and various tests were conducted in the LVDC demonstration site that is built in KEPCO power test center. A demonstration of the basic performance and protection was completed at the demonstration site. We applied the equipment to an actual grid and conducted operation history analysis. This verified that the AC/DC power converter provided high-quality power in an LVDC distribution system. It was confirmed that the power converter was practically operating at a 30% to 60% load with efficiency of 98.03%. It was also confirmed that the power supply was stably applied to the load through its strong response, even when the load suddenly changes. This was verified through this study, where the design and protection method in the AC/DC power converter in the LVDC distribution was appropriate.
Many studies on LVDC distribution are active in response to the increased availability of renewable energy sources globally. This technology is still in the early stages and applying a high-efficiency bi-directional AC/DC power converter to an actual grid system is still rare. We believe that the results of this study will be useful for making the power converter suitable for use in LVDC distribution lines. In addition, it will contribute to the expansion of LVDC distribution systems by its capability of supplying stable power in an actual grid system.

Author Contributions

Conceptualization, J.K.; Data curation, Y.C.; Formal analysis, H.K.; Investigation, J.C.; Resources, J.C.; Software, H.K.; Writing—original draft, Y.C.; Writing—review & editing, J.K. and Y.C.

Funding

This research was funded by KEPCO (Korea Electric Power Corporation) Research Institute grant number R17DA10.

Conflicts of Interest

The authors declare no conflicts of interest.

References

  1. Donald, J. Hammerstrom “AC Versus DC Distribution Systems Did We Get it Right?”. In Proceedings of the 2007 IEEE Power Engineering Society General Meeting, Tampa, FL, USA, 24–28 June 2007. [Google Scholar]
  2. Karppanen, J.; Kaipia, T.; Mattsson, A.; Lana, A.; Nuutinen, P.; Pinomaa, A.; Peltoniemi, P.; Partanen, J.; Cho, J.; Kim, J.; et al. Selection of Voltage Level in Low Voltage DC Utility Distribution System. In Proceedings of the 23th International Conference on Electricity Distribution, CIRED Conference, Lyon, France, 15–18 June 2015; p. 1174. [Google Scholar]
  3. Afamefuna, D.; Chung, I.; Hur, D.; Kim, J.Y.; Cho, J. A Techno-Economic Feasibility Analysis on LVDC Distribution System for Rural Electrification in South Korea. J. Electr. Eng. Technol. 2014, 9, 1501–1510. [Google Scholar] [CrossRef] [Green Version]
  4. Cho, J.; Kim, J.; Chae, W.; Lee, H.J.; Roy, J.K. Design and Construction of Korean LVDC Distribution System for supplying DC Power to Customer. In Proceedings of the 23th International Conference on Electricity Distribution the CIRED Conference, Ljubljana, Slovenia, 1–4 June 2015. [Google Scholar]
  5. Woo, Y.; Kim, Y. Digital Control of a Single-Phase UPS Inverter for Robust AC-Voltage Tracking. In Proceedings of the 30th Annual Conference of IEEE Industrial Electronics Society, 2004. IECON 2004, Busan, Korea, 2–6 November 2004; Volume 2, pp. 1623–1628. [Google Scholar]
  6. Sultani, J.F. Modelling, Design and Implementation Of D-Q Control in Single-Phase Grid-Connected Inverters for Photovoltaic Systems Used in Domestic Dwellings; De Montfort University: Leicester, UK, 2013. [Google Scholar]
  7. Cai, F.; Lu, D.; Lin, Q.; Wang, W. Control Strategy Design of Grid-Connected and Stand-Alone Single-Phase Inverter for Distributed Generation. J. Power Electron. 2016, 16, 1813–1820. [Google Scholar] [CrossRef] [Green Version]
  8. Liu, H. Control Design of a Single-Phase DC/AC Inverter for PV Applications; University of Arkansas: Fayetteville, AR, USA, 2016. [Google Scholar]
  9. Byen, B.; Choe, J.; Choe, G. High-Performance Voltage Controller Design Based on Capacitor Current Control Model for Stand-alone Inverters. J. Electr. Eng. Technol. 2015, 10, 1635–1645. [Google Scholar] [CrossRef] [Green Version]
  10. Zong, X. A Single Phase Grid Connected DC/AC Inverter with Reactive Power Control for Residential PV Application; Electrical and Computer Engineering University of Toronto: Toronto, ON, Canada, 2011. [Google Scholar]
  11. Verma, A. Algorithm for Design of Digital Notch Filter Using Simulation. Int. J. Adv.Res. Artif. Intell. (IJARAI) 2013, 2, 8. [Google Scholar] [CrossRef]
  12. Wang, C.M.; Xiao, W.C. Second-order IIR Notch Filter Design and implementation of digital signal processing system. Appl. Mech. Mater. 2013, 347–350, 729–732. [Google Scholar]
  13. IEC 60364-4-41, Low Voltage Electrical Installations–Part 4-41: Protection for Safety –Protection against Electric Shock, 5th ed.; International Standard; IEC: Geneva, Switzerland, 2005.
  14. IEC 60364-4-44, Low Voltage Electrical Installations–Part 4-44: Protection for Safety–Protection against Voltage Disturbances and Electromagnetic Disturbance, 2nd ed.; International standard; IEC: Geneva, Switzerland, 2007.
  15. Salonen, P.; Nuutiene, P.; Peltoniemi, P.; Partanen, J. Protection Scheme for an LVDC Distribution System. In Proceedings of the CIRED 2009—20th International Conference and Exhibition on Electricity Distribution—Part 1, Prague, Czech Republic, 8–11 June 2009. [Google Scholar]
  16. Salomonsson, D.; Soder, L.; Sannino, A. Protection of low-voltage DC microgrids. IEEE Trans. Power Deliv. 2009, 24, 1045–1053. [Google Scholar] [CrossRef]
  17. Hirose, K.; Tanaka, T.; Babasaki, T.; Person, S.; Foucault, O.; Sonnenberg, B.J.; Szpek, M. Grounding concept considerations and recommendations for 400VDC distribution system. In Proceedings of the 2011 IEEE 33rd International Telecommunications Energy Conference (INTELEC), Amsterdam, The Netherlands, 9–13 October 2011; pp. 1–8. [Google Scholar]
  18. Salonen, P.; Kaipia, T.; Nuutinen, P.; Peltoniemi, P.; Partanen, J. A Study of LVDC Distribution System Grounding. In Proceedings of the Conference NORDAC, Helsingor, Denmark, 14–16 September 2008. [Google Scholar]
  19. Hofheinz, W. Protective Measures with Insulation Monitoring, 3rd ed.; VDE VERLAG: Berlin, Germany, 2013. [Google Scholar]
  20. Hofheinz, W. Protective Measures with Insulation Monitoring–Application of Unearthed IT Power Systems in Industry, Mining, Railways, Marine/Oil and Electric/Rail Vehicles, 3rd ed.; VDE VERLAG: Berlin, Germany, 2006. [Google Scholar]
  21. Jiang, J.; Ji, H. Study of insulation monitoring device for DC system based on multi-switch combination. In Proceedings of the ISCID’09, Second International Symposium on Computational Intelligence and Design, Changsha, China, 12–14 December 2009; Volume 1, pp. 429–433. [Google Scholar]
  22. IEC 60364-5-51: Selection and Erection of Electrical Equipment; Common rules; IEC: Geneva, Switzerland, 2005.
  23. IEC 60364-5-52: Selection and Erection of Electrical Equipment. Wiring Systems; IEC: Geneva, Switzerland, 2009.
  24. IEC 60364-6: Low-Voltage Electrical Installations. Part 6: Verification; IEC: Geneva, Switzerland, 2006.
  25. IEEE Std 519: IEEE Recommended Practices and Requirements for Harmonic Control in Electrical Power Systems; IEC: Geneva, Switzerland, 1992.
  26. IEEE Std 1547: IEEE Standard for Interconnecting Distributed Resources with Electric Power Systems; IEC: Geneva, Switzerland, 2003.
  27. IEEE C37.20.2 IEEE Standard for Metal-Clad and Station-Type Cubicle; IEC: Geneva, Switzerland, 1993.
  28. ISO 668 (1995(E)) Series 1 Freight Containers-Classification, Dimensions and Ratings; IEC: Geneva, Switzerland, 1995.
  29. IEC std.62109-1. Safety of Power Converters for Use in Photovoltaic Power Systems; IEC: Geneva, Switzerland, 2010.
  30. Cho, Y.; Kim, H.; Kim, J.; Cho, J.; Kim, J. Construction of actual LVDC distribution line. CIRED-Open Access Proc. J. 2017, 2017, 2179–2182. [Google Scholar] [CrossRef]
Figure 1. Generic DC link voltage waveform.
Energies 12 02191 g001
Figure 2. Circuit diagram of the AC/DC converter.
Energies 12 02191 g002
Figure 3. Control block diagram of the AC/DC power converter.
Energies 12 02191 g003
Figure 4. Korea Electric Power Corporation (KEPCO) demonstration site for low-voltage DC (LVDC) distribution.
Energies 12 02191 g004
Figure 5. Waveforms resulting from the performance test of the AC/DC power converter. (a) Maintaining output voltage during a load change. (b) Efficiency and output power ripple during a load change.
Energies 12 02191 g005
Figure 6. Wave resulting from the short circuit test of the AC/DC power converter. (a) Waveform when a short circuit occurs. (b) Enlarged waveform when a short circuit occurs.
Energies 12 02191 g006
Figure 7. Earth ground fault test results of the AC/DC power converter.
Energies 12 02191 g007
Figure 8. Configuration plan of the long-distance LVDC distribution demonstration site.
Energies 12 02191 g008
Figure 9. Results from the DC distribution demonstration site. (a) Spring, (b) summer, (c) autumn, and (d) winter.
Energies 12 02191 g009
Table 1. Circuit design of the AC/DC power converter.
ClassificationInput SideOutput SideSwitching ElementSwitching Frequency
TypeLgCfCcapSiC-MOSFETfs
Spec.700 μH5 μF1200 μF
(4 in parallel)
1200 V 300 A
(2 in parallel)
16 kHz
Table 2. Protection elements in the AC/DC power converter.
ClassificationAC Input SideDC Output Side
TypeMCCBFUSESPDMCCBFUSESPD
Spec.690 V
250 A
250 V
100 A
230 V
40 kA
1000 V
100 A
1000 V
120 A
1000 V
50 kA
Table 3. Protection level at the input/output of the AC/DC power converter.
ClassificationSetting the Value of the Protection Level
Detection setting 1Detection setting 2
AC inputOvervoltage118%1 s--
Low voltage60%1 s55%2 ms
Overcurrent150%60 s162%2 ms
DC outputOvervoltage120%1 s127%2 ms
Low voltage70%1 s65%2 ms
Overcurrent184%60 s200%2 ms
Table 4. AC/DC power converter specifications.
ConfigurationSpecification
Input Voltage1Φ 220 V ± 10%, 60 Hz
Rated Output Power30 kW
Rated Output Voltage750 V (±1%)
Power Factor>0.98 at rated power
THD<5% at Full load
efficiency≥97%
Communication PortEthernet
Operating Temperature−20 to 50 °C
Table 5. Results of the AC/DC power converter performance test.
DC Load1AC LoadDC Load2Input [A]Output [A]Input P [kW]Output P [kW]Efficiency [%]THD [%]Ripple [V]Ripple [%]
OnOnOff8.902.303.252.7082.9613.500.300.04
2 kWOnOff17.204.873.933.5290.9511.230.500.07
4 kWOnOff25.807.505.905.5493.869.800.800.11
6 kWOnOff34.3510.147.867.4995.278.801.100.15
8 kWOnOff43.1212.819.829.4596.008.001.400.19
10 kWOnOff51.9115.4411.8411.4396.567.401.700.23
10 kW2 kWOff60.3418.0513.8113.7796.916.902.000.27
10 kW4 kWOff69.5120.8515.8915.4397.126.402.300.31
10 kW6 kWOff78.0023.5017.8217.3897.326.002.600.34
10 kW8 kWOff86.9026.0019.8319.3197.425.702.800.38
10 kW10 kWOff95.4328.7421.7821.2497.505.453.100.42
10 kW10 kWOn95.0029.3522.0021.4097.485.452.900.39
10 kW10 kW2kW105.232.0024.0623.4797.545.163.100.42
10 kW10 kW4kW114.734.8526.2125.5897.614.903.600.48
10 kW10 kW6kW124.137.8128.3622.7297.624.653.900.52
10 kW10 kW8kW129.139.2529.4828.7897.624.604.000.54
10 kW10 kW10kW133.740.6930.5529.8297.604.484.200.56
Table 6. Voltage quality results from the AC/DC power converter demonstration site.
InputDC OutputEfficiencyInsulation Resistance
Power FactorVoltage VarianceVoltage Ripple
0.99±4.4 V±0.59%98.03%486.25 kΩ

