Article

Impacts of an Increased Substitution of Fossil Energy Carriers with Electricity-Based Technologies on the Swiss Electricity System

Swiss Federal Laboratories for Materials Science and Technology (Empa), Überlandstrasse 129, CH-8600 Dübendorf, Switzerland
*
Author to whom correspondence should be addressed.
Energies 2019, 12(12), 2399; https://doi.org/10.3390/en12122399
Submission received: 13 May 2019 / Revised: 14 June 2019 / Accepted: 17 June 2019 / Published: 21 June 2019

Abstract

:
Electrifying the energy system with heat pumps and battery electric vehicles (BEV) is a strategy of Switzerland and many other countries to reduce CO2 emissions. A large electrification, however, poses several new challenges for the electricity system, particularly in combination with a simultaneous substitution of nuclear power plants (NPP) by volatile renewables such as photovoltaics (PV). In this study, these challenges in terms of additional electricity demands, deficits and surpluses as well as effective CO2 mitigation are assessed in a dynamic and data-driven approach. To this end, electricity demand and production profiles are synthesized based on measured data and specifications and assumptions of the key technologies at a high temporal resolution. The additional electricity demand of heat pumps is estimated from hourly measured heat demand profiles of a Swiss district heating provider, while for BEV different recharging patterns are combined. For electricity production, NPP are deducted from the current electricity production profile, while PV is added at an hourly resolution. In order to estimate CO2 emissions, life-cycle analysis (LCA) CO2 intensities of the different technologies are used. It is shown that with a BEV and heat pump penetration of 20% and 75%, respectively, there is an almost 25% (13.7 TWh/year) increase of the electricity demand and—just as challenging—an additional maximum power requirement of 5.9 GWh/h (hourly-averaged power). Without additional storage options, large amounts of electricity must be imported in winter and at night, while in summer at noon there is a large surplus from PV. Due to their high CO2 intensities—at least for the next decades—electricity imports and PV may—depending on the reference scenario (with or without NPP) and assumptions on other key parameters—even offset the overall CO2 savings of a highly electrified Swiss energy system.

Graphical Abstract

1. Introduction

In order to achieve the primary goal of the 2015 Paris Agreement [1] to limit the average global warming to less than 1.5 °C, Switzerland and many other countries follow a strategy to mitigate greenhouse gas (GHG) emissions and global warming by a transition from a fossil-based to a renewables-based energy system [2]. In particular, the substitution of fossil fuels by alternatives based on electricity from renewables is an oft-cited option [3,4,5,6].
In Switzerland, currently about 60% of all fossil CO2 emissions occur in the sectors of mobility and buildings [7]. Therefore, a substitution of fossil energy carriers in these two sectors by electricity-based technologies seems to be most effective. With respect to buildings, it is primarily the substitution of fossil heaters and boilers operated on heating oil and natural gas by heat pumps [8,9]. With regard to mobility, it is primarily the substitution of internal combustion engines (ICE) running on fossil gasoline and diesel fuels by battery electric vehicles (BEV) [10,11,12].
While these electricity-based technologies do not directly emit CO2 during their operation, their actual (life cycle) CO2 emissions highly depend on the CO2 intensity of the used electricity [13]. Especially in winter, when electricity demand is high, while in Switzerland the contribution of renewables is lower due to their seasonal and volatile nature, imports are needed. If electricity-based technologies are fed with highly CO2 intensive imports such as from coal or oil-fired power plants, their overall global warming impact may even be higher than their fossil counterparts. Moreover, due to their additional electricity consumption, electricity-based technologies pose several new challenges for the electricity system. These challenges encompass the additional total amount of electricity itself as well as the additional power needed to cope with increased demand and production peaks.
The “Swiss Energy Strategy 2050” (ES2050) of Prognos [2] is based on a fixed overall socio-economic scenario regarding population (9 million), GDP growth (+1.1% p.a) and living floor area (+20%) by 2050. There are three demand scenarios (a conservative “Business As Usual” (BAU), a low-demand “New Energy Policy” (NEP) and a regulations-driven “Political Measures” (POM) scenario) along with two supply variants (“C” and “E” and a combination thereof “C&E”). The demand scenarios differ in their assumptions on efficiency gains, new regulations such as higher CO2 taxes, guidelines for heating, appliances, and vehicle drivetrains, etc., and social activity and behavioral changes such as less person-kilometers-per-year [14]. The two supply scenarios both feature a phase-out of nuclear power plants (NPP), yet variant “C” stipulates new centralized Swiss “Combined Cycle Gas Turbine” (CCGT) power plants to avoid imports and no extra promotion of renewables, while variant “E” stipulates a substantial promotion of renewables such as photovoltaics (PV), wind, biomass and geothermal along with (partially) more imports, yet no CCGT.
With the renewable variant “E”, demand and supply challenges are in particular great as the expansion of renewables will most likely occur with volatile electricity produced by PV [15], while simultaneously base-load electricity from NPP is discarded [16,17]. Moreover, without load shifting strategies, also the electricity demand will become more volatile, partly because of additional demand peaks due to heat pumps and BEV, but also due to peer-to-peer trades in a liberalized electricity market causing non-grid friendly impacts without corresponding regulations and controls [18].
In literature, the additional electricity demand by a substantial electrification of the Swiss energy system is discussed inconsistently [14]. While Barmettler et al. [19] and Andersson et al. [20]—depending on their chosen scenario—report a rise from currently about 60 TWh to about 70–90 TWh per year, other studies [21,22] assume that the additional electricity demand of about 10 TWh per year of heat pumps and BEV is just about offset by an overall reduction of the electricity consumption.
In existing studies, typically bottom-up energy system (optimization) models are used to investigate the future Swiss energy system based on given targets in the ES2050 [16,23,24,25,26,27]. These models rely on forecasts and fixed scenarios of the whole energy system and use cost optimization to generate cost-optimal energy scenarios under technological, resource, environmental, and/or policy constraints [23]. For the Swiss energy system, there are models with a high (mostly hourly) temporal resolution, but only in the electricity sector [24,28,29]; and models with a distinction between the electricity, heat and mobility sector, but only at a coarse (weekly, monthly) temporal resolution [25,26] or only with typical (averaged) days per season [27]. While electricity-only models also (indirectly) incorporate the penetration of BEV and heat pumps by taking annual demand values (e.g., from “POM”, which implicitly also includes additional BEV and heat pumps) and linearly scaling them to historic (hourly) load profiles [16], they are still not capable of representing additional and/or shifted demand peaks due to BEV and heat pumps. On the other hand, models that explicitly include the heat and mobility sector [25,30] typically do not have input data at an adequately high temporal resolution. Therefore, they need to estimate the energy demand in these sectors on a coarser time scale and by the aid of surrogates such as heating degree days (HDD), etc., [25] or, in the mobility sector, by not explicitly accounting for the time of recharging/fueling [30]. Also, the translation of heat demand to an actual electricity demand (by heat pumps) is generally not modelled with time-dependent ambient temperature data, etc., but with yearly constant values [26]. Moreover, these studies do not incorporate, if any, time-dependent CO2 emissions of the used electricity [27].
For these reasons, this study investigates the impacts and challenges of a large electrification and simultaneous denuclearization of the Swiss energy system by means of a dynamic and data-driven approach. With this approach, there is no more need for predictions or forecasts on the evolution of the future energy system. This offers the benefit that large uncertainties and ambiguities such as on population growth, GDP growth, penetration of new technologies, social and behavioral changes, etc., do not need to be taken into account explicitly. In turn, the energy system is taken as it is and strategic measures (of the ES2050) are added or subtracted based on actual measurements and data of the electricity, heat and mobility sectors along with meteorological data and state-of-the-art specifications on the employed technologies (e.g., heat pumps, BEV, etc.). In particular, the high temporal resolution of the used data in all energy sectors (electricity, heat and mobility) allows for a dynamic analysis of the impacts of strategic measures also in the light of short-term effects such as additional and higher peak power demands, intermittent surpluses and deficits as well as momentary fluctuations of CO2 intensities in the electricity grid, etc.
The scope of this study is to primarily investigate technological and physical aspects of this large electrification and denuclearization of the energy system on the national scale of Switzerland. Socio-economic aspects, although also of high relevance to this topic, are out of the scope of this study. On a global scale such socio-economic aspects have already been investigated by Jacobson et al. [31].
The organisation of this study is as follows: In Section 2, the methodology and data to obtain hourly profiles of a highly electrified Swiss energy system in the heat and mobility sector as well as a simultaneous substitution of NPP by PV is presented. In Section 3, results from these profiles on the additional electricity and power demand as well as the impacts on the overall electricity system in terms of total load, surpluses/deficits and CO2 mitigation are discussed. Section 4 summaries the conclusions of this study and provides an outlook for further study.

2. Methodology

2.1. Current Swiss Electricity Production and Consumption

The Swiss electricity production and consumption is based on actual measurements provided by the Swiss transmission system operator (TSO) Swissgrid. The electricity production is the sum of all feed-ins which are recorded by load-level measurements in the control block Switzerland. They are reported by the distribution system operators (DSO) to Swissgrid. The end-use consumption is the electricity consumed by end-users at all network levels, while the total consumption also includes (grid) losses and electricity consumed by the power plants themselves (e.g., for pumping water in pumped-hydro storage, etc.). The sum of imported and exported electricity includes the amount of electricity that has flowed into and out of all border crossing points in Switzerland at the corresponding time interval.
There are complete Swissgrid datasets at a 15-min time resolution as of 2010 [32]. In this study, the dataset of 2010 will primarily be used as only for this year a complete dataset of district heating demand is available (see Section 2.2.2). In 2010, Switzerland had a total electricity consumption of 64.3 TWh (median 2010–2016: 63.2 TWh) and a total production of 62.3 TWh (median 2010–2016: 62.9 TWh). Additionally, there were (gross) imports and exports of 32.9 TWh and 30.9 TWh, respectively, which are the median of 2010–2016. Hence, in 2010, there was a net import of 2.0 TWh. Other years are used, if they are relevant to put 2010 results into context. In order to be at a congruent time resolution with other datasets, Swissgrid datasets are aggregated to an hourly time resolution.

2.2. Electrification of the Heat Demand in Switzerland

2.2.1. Total Heat Demand

In this study, only heat demand for space heating (SH) and domestic hot water (DHW) in private households, services and industries, but no process heat demand of some industries, is considered. This heat demand is characterized by (low) temperatures up to about 60 °C, which can readily be delivered by heat pumps, as opposed to process heat with temperatures above 100 °C, typically about 200 °C, where heat pumps are no option.
In the reference year 2010, which was the coldest year since 1996 [33], the heat demand for SH and DHW of private households, services and industries was, respectively, 82 TWh t h and 12.8 TWh t h with a total of 94.8 TWh t h [34]. In total 70.8 TWh t h or a proportion of 75% (61.7 TWh t h for SH) and 66% (8.5 TWh t h for DHW) of these 82 TWh t h and 12.8 TWh t h were delivered from fossil sources such as oil, natural gas, and coal, respectively. The remaining 26% (24.1 TWh t h ) were produced by electricity, district heating, wood as well as solar and ambient heat [34].

2.2.2. Hourly Heat Demand in a District Heating Grid

In order to disaggregate the total annual fossil heat demand of Switzerland to an hourly time resolution, measured hourly heat feed-in data of the Swiss district heating provider REFUNA are used as a surrogate.
REFUNA delivers district heat to 11 municipalities in the lower Aare valley of the Swiss Central Plateau [35]. Their grid has a total length of 292 km (forward and return flow) and their roughly 2600 customers are well diversified with private households (single- and multi-family homes), services, public buildings, and some industries.
Besides some spare heat sources operated on heating oil for business continuity reasons, REFUNA’s only heat source is the NPP in Beznau. This single heat source allows for an exact measurement of the feed-in heat at a high temporal resolution.
Only in 2010, there were no revisions of REFUNA’s process control system, thus only the 2010 dataset is complete and of high quality. Nonetheless, there were some missing values, which could be imputed by linear interpolation. The red line in Figure 1 (top) displays the hourly feed-in heat of 2010 with a total of 194 GWh t h and a maximum of 70 MWh t h /h.
The actual heat demand of the customers in the REFUNA grid is estimated by subtracting seasonally-varying losses from the measured feed-in heat. REFUNA provide in their annual report [35] the total loss in the grid in the “heat year” 2010/2011 as 29 GWh t h (average 3.3 MWh t h /h) or 15.8%. According to REFUNA [36], in winter, the forward T F F and backward T R F flow temperatures are 110 °C and 50 °C, respectively. In summer, they are 80 °C and 40 °C, respectively. With an assumed winter and summer soil temperature T s o i l of 8 °C and 12 °C [37], respectively, the average temperature difference Δ T between the thermal fluid and the environment (soil) is estimated with
Δ T = 0.5 · T F F + T R F T s o i l
as 72 °C and 48 °C in winter and summer, respectively. These temperature differences are used to proportionally split the annual loss of 29 GWh t h to 17.4 GWh t h and 11.6 GWh t h in the winter and summer half-year, respectively. The hourly average loss is then 4.0 MWh t h /h and 2.6 MWh t h /h, respectively. In relation to the median feed-in heat in winter and summer of 43.3 MWh t h /h and 4.4 MWh t h /h, seasonal losses account for about 10% and 50%, respectively (see Figure 1, bottom, right y-axis).
In order to have a seasonally-varying heat loss at time t, the following cosine function with an average loss of 3.3 MWh t h /h and an amplitude of 1.1 MWh t h /h is defined
L o s s ( t ) = 3.3 + 1.1 · c o s 2 π t 8760 1 12
The phase shift of this cosine function is such that a periodic, annual cycle with the above calculated seasonal average losses and a maximum of 4.4 MWh t h /h on 1st of February and a minimum of 2.2 MWh t h /h on 1st of August is reached (see Figure 1, bottom).
By subtracting these losses from the measured feed-in heat, the aggregated hourly heat demand of REFUNA is obtained (see blue line in Figure 1, top). The total heat demand for 2010 is 165 GWh t h and the average loss is 14.9%, which is in line with the reported annual loss of 15.8% [35].

2.2.3. Domestic Hot Water and Space Heating Demand

The hourly distribution of the DHW demand is estimated from REFUNA’s hourly heat demand for the period 9–15 July 2010, when daily minimum temperatures in Beznau did not drop below 18 °C even at night. Ambient air temperature data for Beznau is obtained from meteorological reanalysis of MERRA-2 satellite data [38]. Thus, in this period, no SH demand is assumed. The median hourly heat demand of that period is shown in Figure 2. There are three DHW demand peaks: Midnight, 6 a.m. and 7 p.m. The midnight peak results from a mandatory DHW recharging due to hygienic reasons. All costumers of REFUNA are equipped with thermal DHW storage.
It is assumed that the hourly DHW demand from Figure 2 is constant throughout the year. This is in agreement with Prognos [37], who state that the additional energy needed to produce DHW in winter due to lower temperatures of the used cold water can be neglected.
For SH, the DHW profile in Figure 2 is subtracted from the total heat demand in Figure 1 (top) at an hourly basis to obtain the hourly SH demand in the REFUNA grid.

2.2.4. Extrapolation to National-Scale

For DHW, the profile in Figure 2 is assumed to be representative for the hourly DHW demand in all Switzerland and, therefore, linearly scaled to the annual Swiss fossil DHW demand of 8.5 TWh t h (see Section 2.2.1).
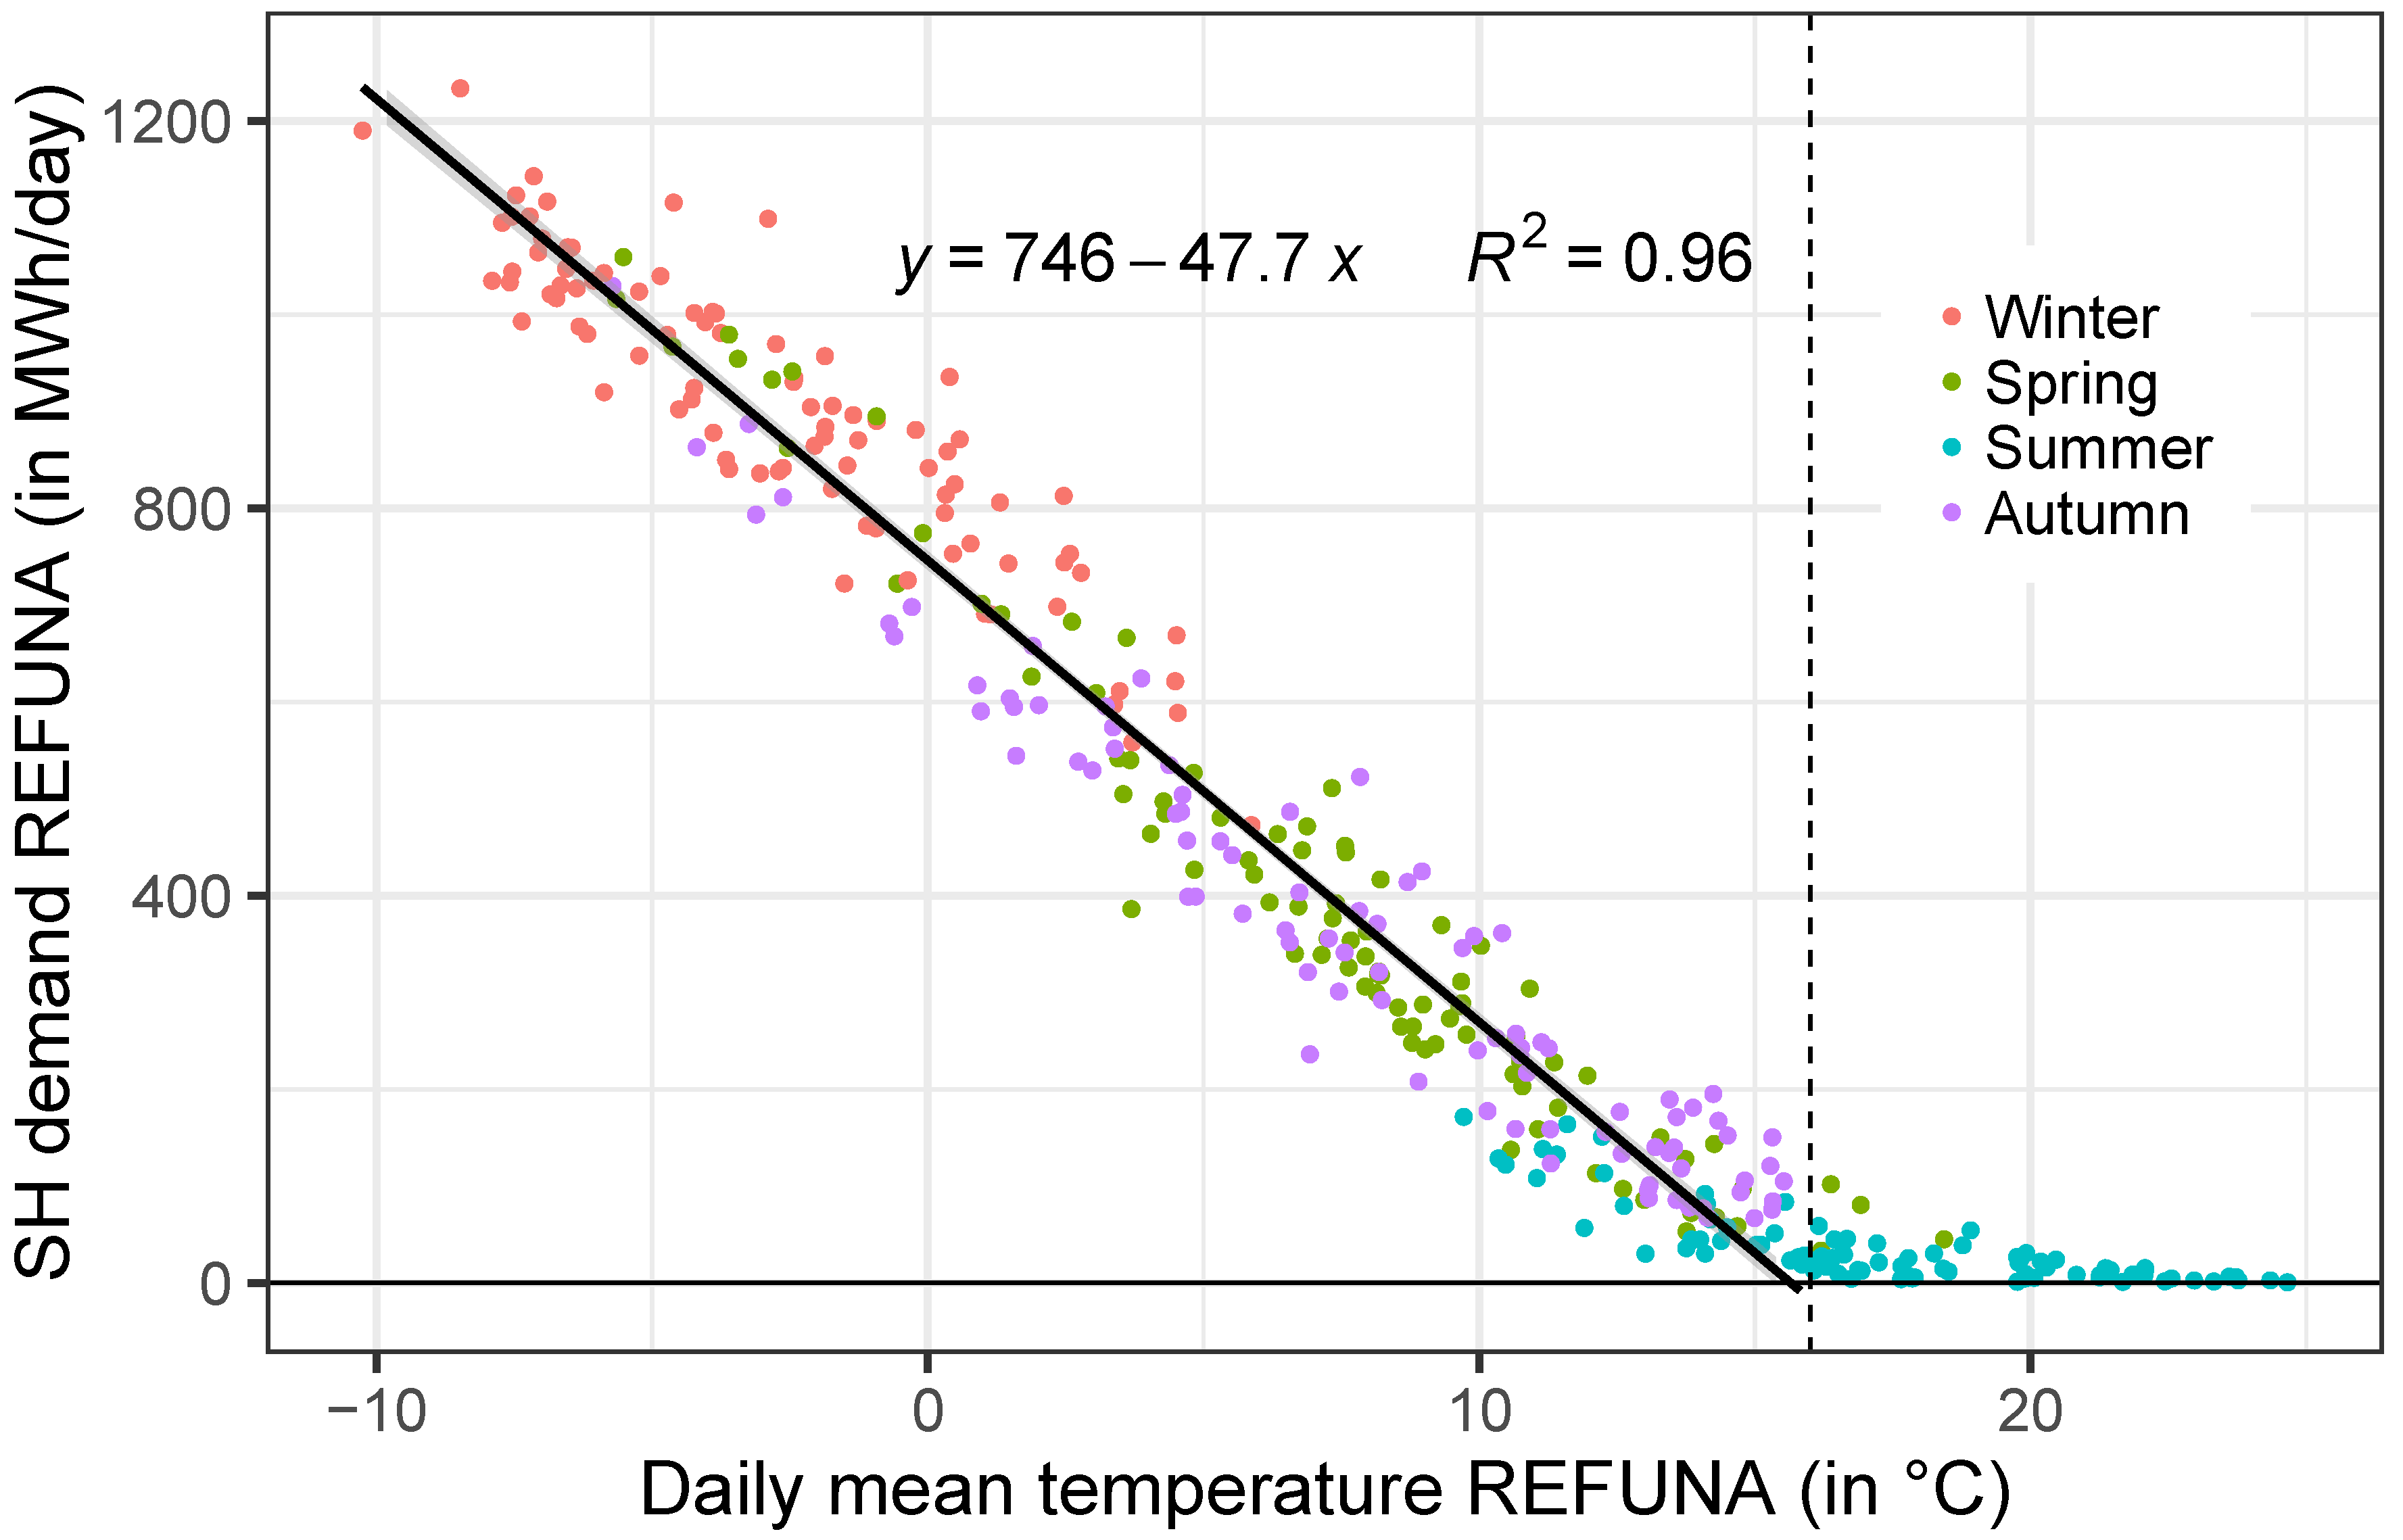
For SH, in a first step, it is checked whether REFUNA’s SH demand is representative for all Switzerland. To this end, the heating degree days (HDD) of REFUNA and all Switzerland are compared. The HDD are a measure to estimate SH demand [39]. It is defined as the difference between the average daily ambient air temperature and a reference indoor temperature for all days, when the average daily ambient air temperature is below a heating threshold temperature. In this study, the reference indoor temperature is set to 20 °C as in SIA [40]. The heating threshold temperature is taken from the correlation between the average daily temperature and the daily SH demand in the REFUNA grid in Figure 3 at 16 °C, where the linear regression intersects the x-axis.
In order to calculate HDD for REFUNA and Switzerland, ambient air temperatures are taken from Gelaro et al. [38] for both Beznau and a “population-weighted” Switzerland (CH). “Population-weighted” means that areas with a high population density (e.g., large cities, etc.) are weighted more than sparsely populated areas (e.g., alpine regions, etc.).
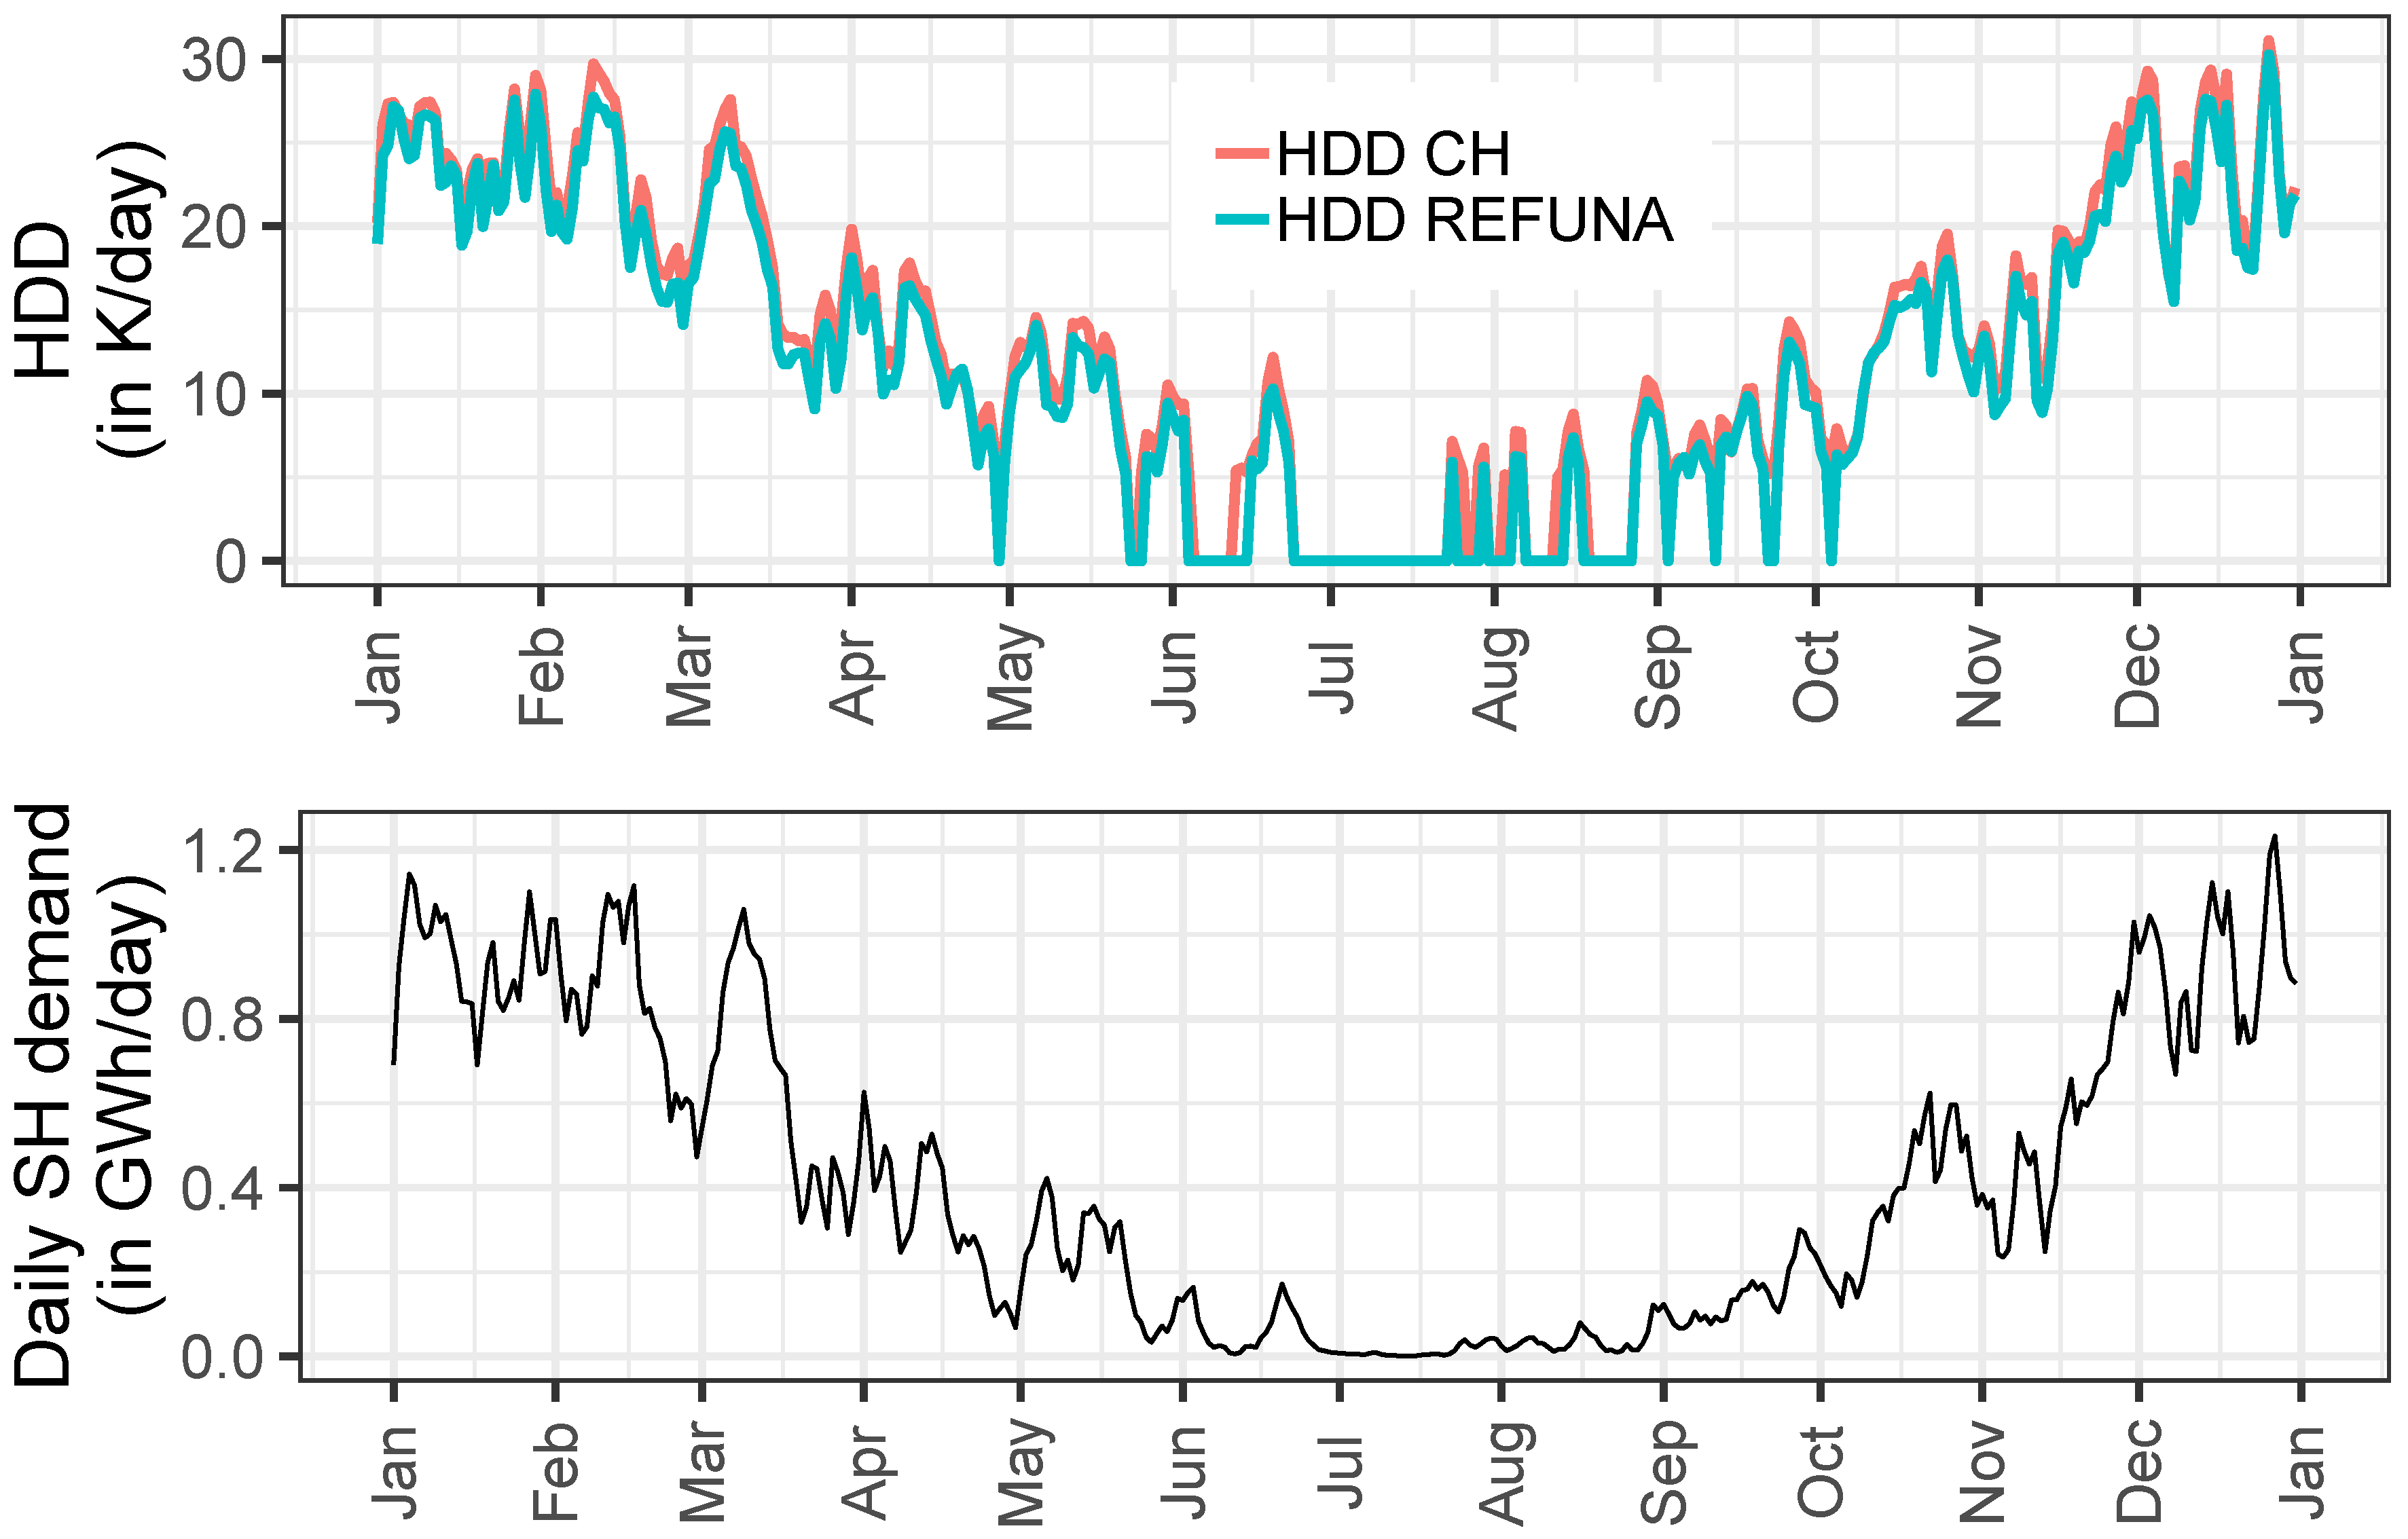
Figure 4 (top) displays the HDD of REFUNA and CH along with the SH demand of REFUNA (bottom). By visual comparison, there is a good agreement in the course and magnitudes of the HDD of REFUNA and CH. The summed HDD of REFUNA and CH are 4883 and 4483, respectively. Thus, the SH demand in CH is about 10% higher than in REFUNA. This is due to the fact that the annual mean temperature in REFUNA (7.6 °C) is slightly higher than the corresponding annual mean temperature of CH (6.5 °C). In order to account for global warming and a consequent lower SH demand in general, REFUNA’s hourly SH demand profile can still be regarded as representative for CH and is therefore linearly scaled to the annual Swiss fossil SH demand of 61.7 TWh t h (see Section 2.2.1).

2.2.5. Influence of Building Retrofitting

In the ES2050, a reduction of the SH demand of buildings by −42% is envisaged for the most conservative scenario “BAU”. This percentage reduction is in line with a bottom-up statistical extrapolation model for the estimation of the geo-dependent heat demand of the Swiss building stock [41]. The SH demand reduction shall—along with other measures—be achieved by more energy efficient new buildings and a retrofit (renovation) of existing buildings. In this study, it is also assumed that the Swiss (fossil) SH demand of 61.7 TWh t h can be reduced by −42% to 35.8 TWh t h by means of retrofitting. For DHW, no reduction of the energy demand is assumed, which is also in line with ES2050.
If the hourly Swiss fossil SH demand S H t (derived in the previous section) was just reduced by a constant −42% throughout the year, then the influence of retrofitting at a specific ambient temperature would not be taken into account correctly. That is, with retrofitting the heating threshold temperature, as defined by the HDD (see Section 2.2.4), could be reduced to lower temperatures. In other words, at a particular temperature, with retrofitting, there is no more demand for SH compared to no retrofitting.
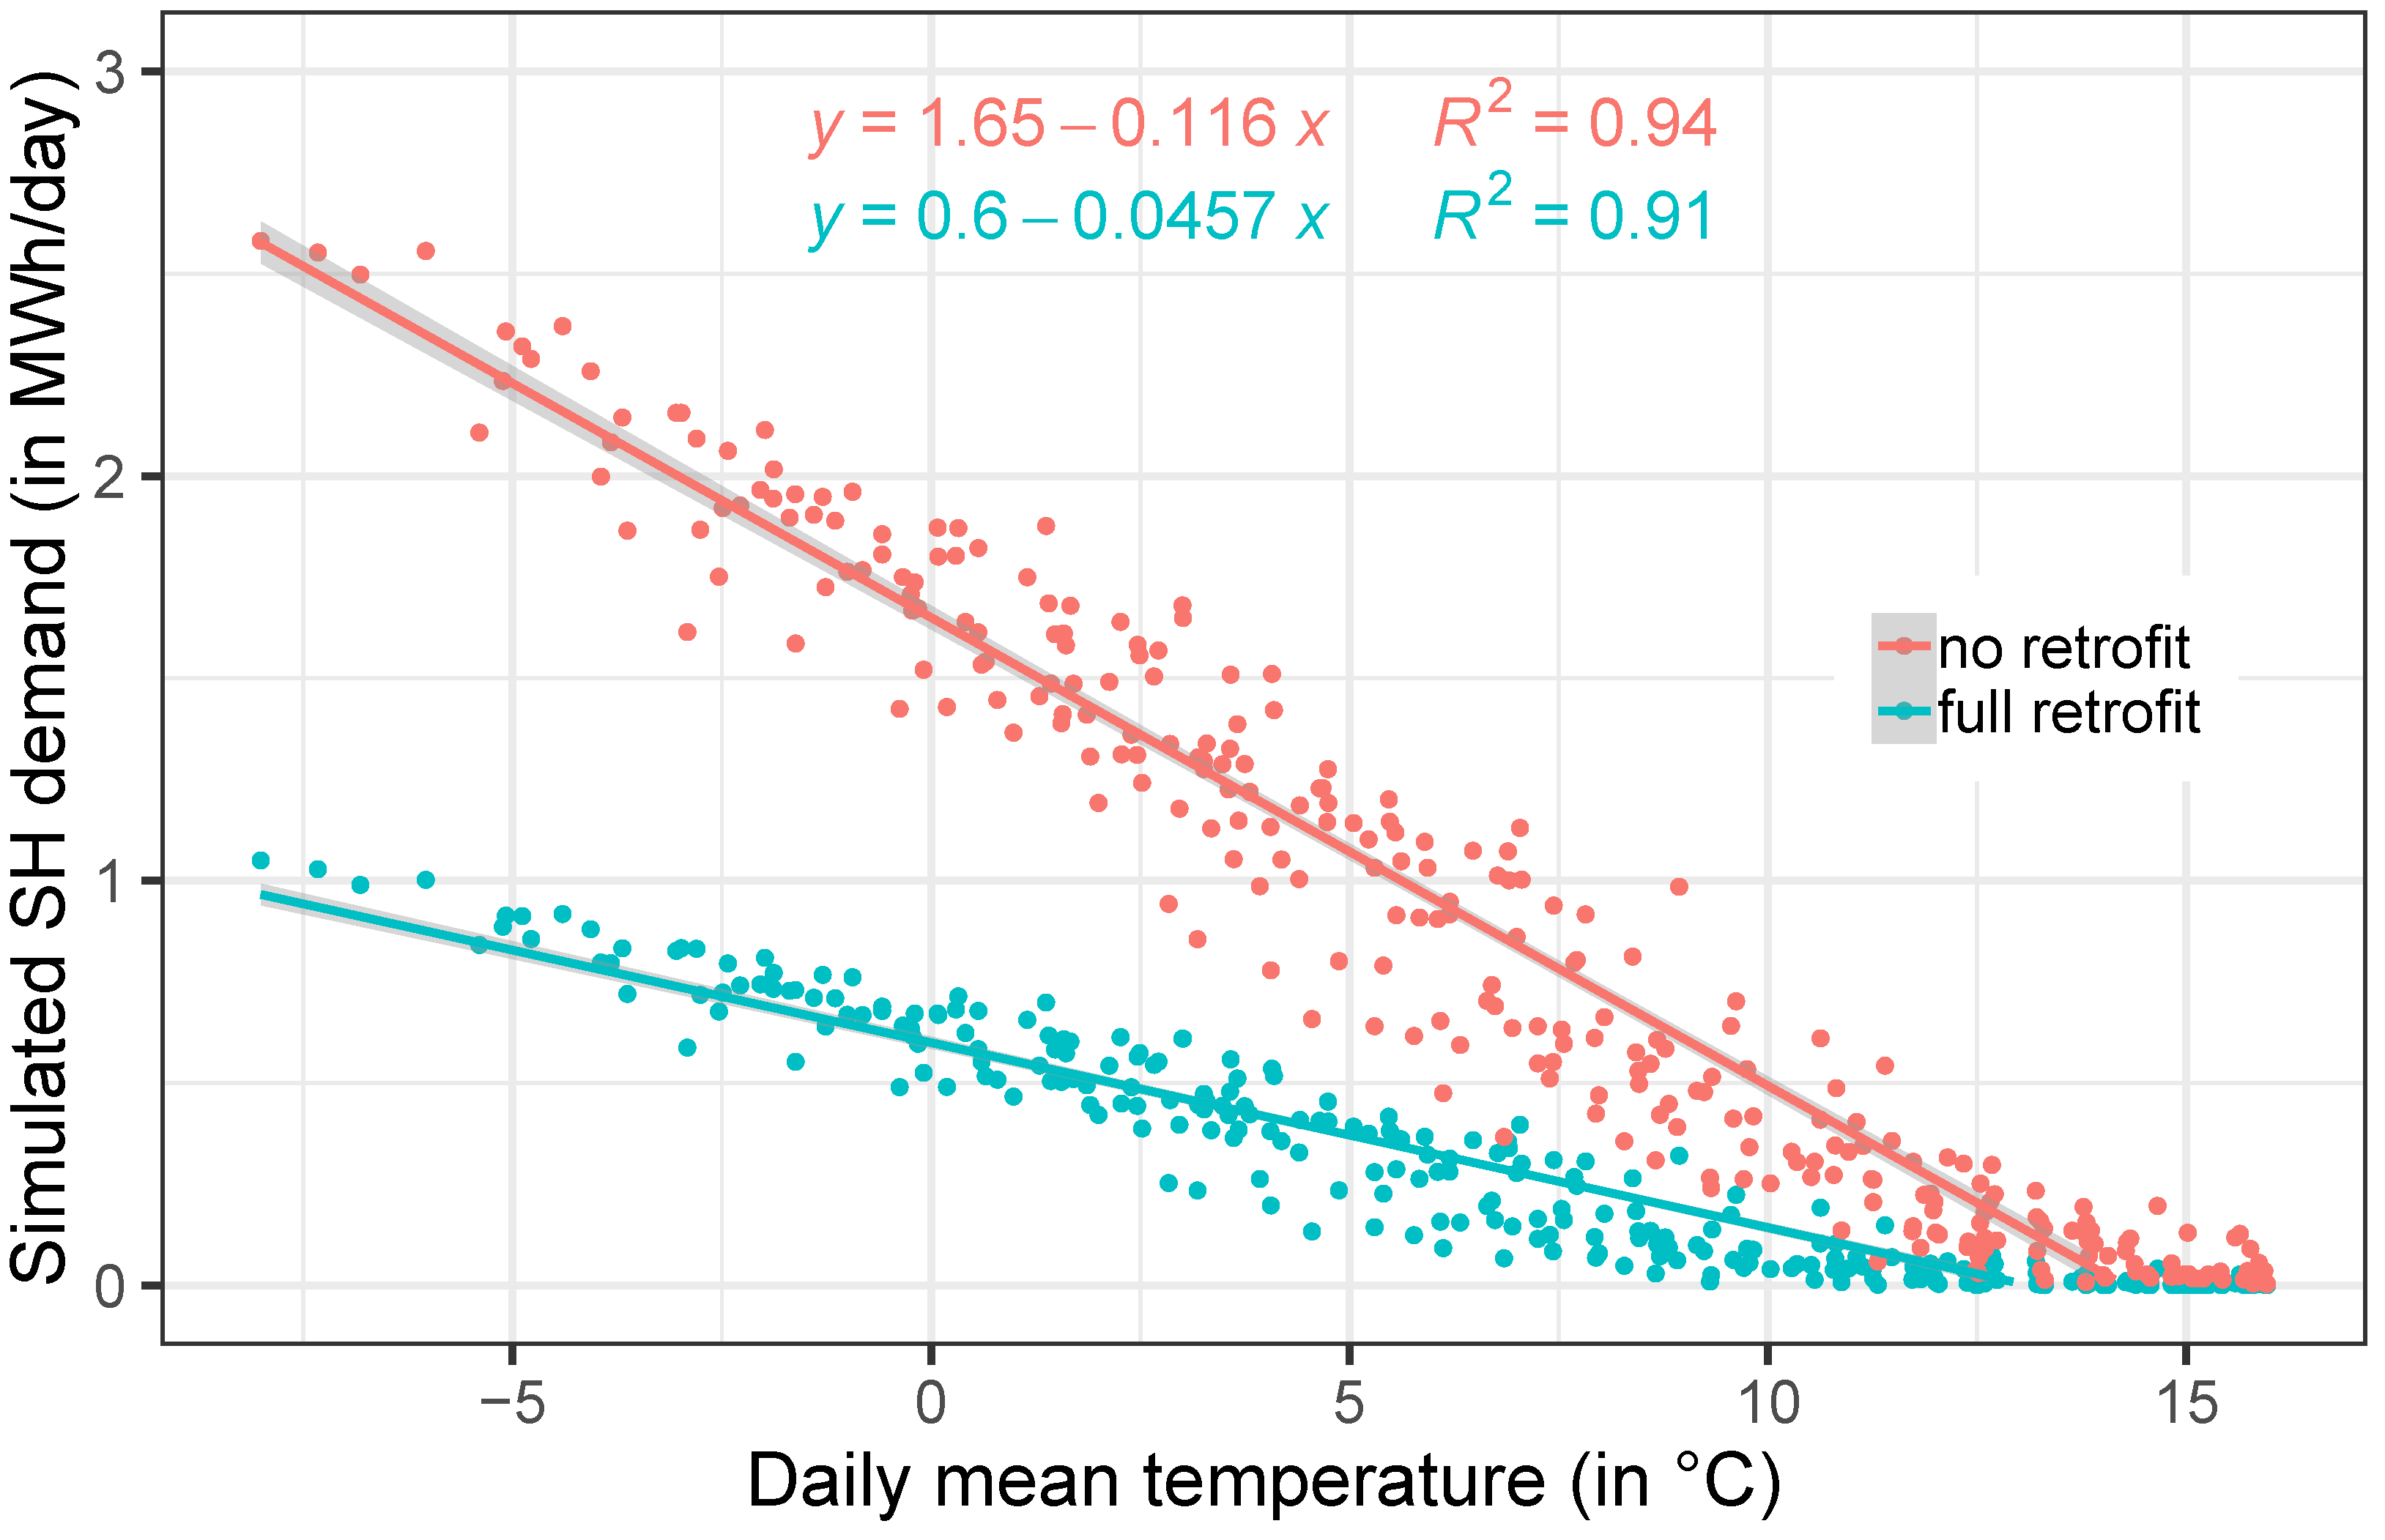
In this study, the temperature-dependent influence of retrofitting on the SH demand is estimated by means of the “Combined Energy Simulation and Retrofitting“ (CESAR) model [42]. With CESAR, 500 single- and 500 multi-family houses, which in sum are representative of all construction ages and all geographic regions of residential buildings in Switzerland, are simulated with regard to their hourly SH demand with no retrofit and with a full retrofit of windows, walls, roofs and grounds [43]. Figure 5 depicts this daily SH demand as a function of the daily mean ambient temperature for a whole year.
The daily SH demand reduction R e d d a i l y is calculated from the linear regressions in Figure 5 as
R e d d a i l y ( T d a i l y ) = F R d a i l y ( T d a i l y ) N R d a i l y ( T d a i l y ) N R d a i l y ( T d a i l y )
where F R d a i l y and N R d a i l y are the daily SH demand for a full retrofit (FR) and no retrofit (NR), respectively, and T d a i l y is the daily mean ambient temperature.
In the CESAR simulation, with a full retrofit compared to no retrofit, the annual SH demand is reduced by −67%. In Figure 6 (top), R e d d a i l y is displayed for each individual day of the year along with its corresponding daily mean ambient temperature (bottom). As stated above, in days with warmer temperatures, retrofitting leads to a complete reduction (−100%) of the SH demand compared to no retrofitting (0%).
However, already in the original S H t , which was derived from the building stock of REFUNA in the previous section, a certain percentage of the buildings are retrofitted. Therefore, if the daily SH reduction R e d d a i l y of CESAR in Figure 6 (top) was applied to S H t , an annual SH demand reduction of −67% would be achieved. In order to achieve an annual SH demand reduction of only −42%, as stated in ES2050, R e d d a i l y is only applied to a certain percentage p c t r e t r o of S H t , while the other ( 1 p c t r e t r o ) percent of S H t remains untouched. Thus, the “retrofitted” SH demand profile S H t , r e t r o of CH is calculated as
S H t , r e t r o = 1 p c t r e t r o · S H t + p c t r e t r o · 1 + R e d d a i l y · S H t
The percentage p c t r e t r o of S H t , which is (mathematically) fully retrofitted, is found by solving the following equation
1 t = 1 8760 S H t , r e t r o t = 1 8760 S H t = ! 0.42
Equation (5) yields a percentage p c t r e t r o of 63.6%. In Figure 7 (bottom), S H t , r e t r o with an annual SH demand reduction of −42% is displayed. As a comparison, in Figure 7 (top) the original SH demand S H t (without additional retrofitting) is shown.

2.2.6. Heat Pumps

In a highly electrified Swiss energy system, the authors assume that 80% (i.e., 28.6 TWh t h ) of the “retrofitted” fossil SH demand of 35.8 TWh t h and 50% (i.e., 4.3 TWh t h ) of the fossil DHW demand of 8.5 TWh t h can be produced by heat pumps. In total, an electrification by heat pumps of 32.9 TWh t h , which is about 75% of the total “retrofitted” fossil heat demand (SH and DHW) of Switzerland, is assumed. The assumed share of heat pumps is in line with the estimated 34 TWh t h of heat produced by heat pumps by 2050 in Greenpeace [21]. The remaining percentage of fossil heat is either still produced by fossil sources or substituted by other renewable heating systems such as biomass, solar thermal, etc.
The additional electricity consumption of these heat pumps is calculated at an hourly resolution by means of the coefficient of performance (COP):
C O P = Q h e a t / P e l
with Q h e a t as the heat demand and P e l as the electricity consumption of the heat pump. The maximum attainable COP depends only on the temperature difference between the upper ( T u p p e r ) and the lower ( T l o w e r ) heat reservoir according to the Carnot efficiency:
C O P C a r n o t = 1 T u p p e r T l o w e r
In reality, the actual COP is always lower than Carnot due to losses and inefficiencies. Therefore, the actual, temperature-dependent COP is estimated with the linear correlations in Figure 8a for a current state-of-the-art ambient air-water heat pump [44] for any ambient air temperature ( T a i r ) and three forward flow temperatures 35 °C, 45 °C, and 50 °C. In this study, only ambient air heat pumps are investigated, other (potentially more efficient) types such as ground source heat pumps (GSHP) shall, however, be incorporated in further studies. The temperature-dependent ambient air temperature is again taken from Gelaro et al. [38] for a “population-weighted” Switzerland (CH). Figure 8b shows the annual variability of the COP for the three forward flow temperatures in Figure 8a.
In order to have a rather low quality implementation of heat pumps (owing to a “performance gap of heat pumps” [45]), a forward flow temperature of 45 °C is chosen for SH. For DHW, the maximum flow temperature of 50 °C is chosen due to hygienic reasons. For SH, however, the other flow temperatures of 35 °C and 50 °C are used in a sensitivity analysis (see Section 2.6). Lower flow temperatures of heat pumps could for instance be used in well-insulated (retrofitted) buildings even with radiators [46].

2.3. Electrification of Mobility in Switzerland

2.3.1. Energy Demand

The total consumption of fossil fuels (gasoline, diesel and others) for ICE in Switzerland’s mobility sector is constantly about 60 TWh [34]. This number includes all individual and public passenger as well as freight transportation by road, but without air, rail, and water. By far the largest share with roughly 45 TWh or 75% are passenger cars. Currently, less than 0.03 TWh of electricity is used for BEV. At an assumed average efficiency of 25% for ICE (including hybrids, etc.), these 60 TWh of fossil energy can be converted into 15 TWh of useful kinetic energy at the wheel.
In this study, it is assumed that 20% or 3 TWh of this useful kinetic energy is replaced by BEV. As passenger cars are by far the largest consumer of fossil energy in the mobility sector and their replacement by BEV is currently the most likely and most advanced scenario, it is assumed that these 3 TWh are fully attributed to passenger cars. In other words, 30% k m of the total Swiss mileage (useful kinetic energy) of passenger cars is assumed to be replaced by BEV.
According to Küng et al. [47], these 30% k m correspond to about 2/3 of all (private) passenger car trips in Switzerland. Furthermore, these 2/3 of all trips are short trips of less than 50 km, where a replacement of ICE by BEV indeed makes sense [48]. The actual number of BEV vehicles to replace 30% k m is, however, open to research.
At an assumed overall tank-to-wheel BEV efficiency of 85% [49], 3.5 TWh of electricity are needed to cover their mileage. Moreover, BEV need about 20% more electricity in winter (December, January and February) for heating purposes, if no other energy carriers or technologies (e.g., ethanol-based heating [50]) are considered.

2.3.2. Recharging

The daily recharging profile of BEV is assumed to be constant throughout the year. That is, there are neither seasonal (e.g., holidays) nor weekly variations (e.g., weekdays vs. weekends). Neither are there any load shifting strategies implemented. Only in winter, a constant (hourly) additional electricity surcharge of +20% is added. This way, the annual electricity demand is distributed by means of the hourly recharging profiles of Robinson et al. [51]. In their study, Robinson et al. [51] classified BEV recharging patterns into four categories: “Home”, “Work”, “Public” and “Other”. In this study, the following percentages (weights) are assumed: 70% at home, 15% at work, 10% in public (places) and 5% others. These weights are adapted from a study [52] on BEV mobility in Basel (Switzerland). The hourly share of these recharging categories plus their weighted average used in this study is displayed in Figure 9.

2.4. Denuclearization of Electricity in Switzerland

Following the ES2050, NPP will be phased out and replaced by a large expansion of renewable energy technologies (mainly PV). Currently, on average, about 25 TWh are annually produced by the five NPP in Switzerland [53]. In the GIS project “sonnendach.ch” [54,55], it is estimated that about 68% of all Swiss roofs are “suitable” for PV with a total (technical) potential of about 50 TWh per year (not considering façades, etc.). If all NPP electricity of 25 TWh is to be replaced by PV—which is currently the most likely scenario in Switzerland [15,56]—about 50% of these “suitable” roofs must be equipped with PV panels. Other renewable energy technologies such as wind, biomass, and geothermal are not considered as they most likely only play a minor role in Switzerland in the short- and medium-term future [15,57].
In 2017, in Switzerland, 1.85 TWh of PV electricity was produced by an installed peak capacity of 1.9 GW p [58,59]. This corresponds to about 950 equivalent full load hours for 2017. Thus, to produce 25 TWh only with PV based on 950 equivalent full load hours, a peak capacity of 26.5 GW p is needed. This is substantially more than the 12 GW p in “POM” of ES2050 and also higher than the maximum (technical) potential by 2050 of about 18–20 GW p reported in other studies [15,19,21]. However, these studies also include a substantial increase of other renewables (wind, biomass, geothermal) to replace NPP.
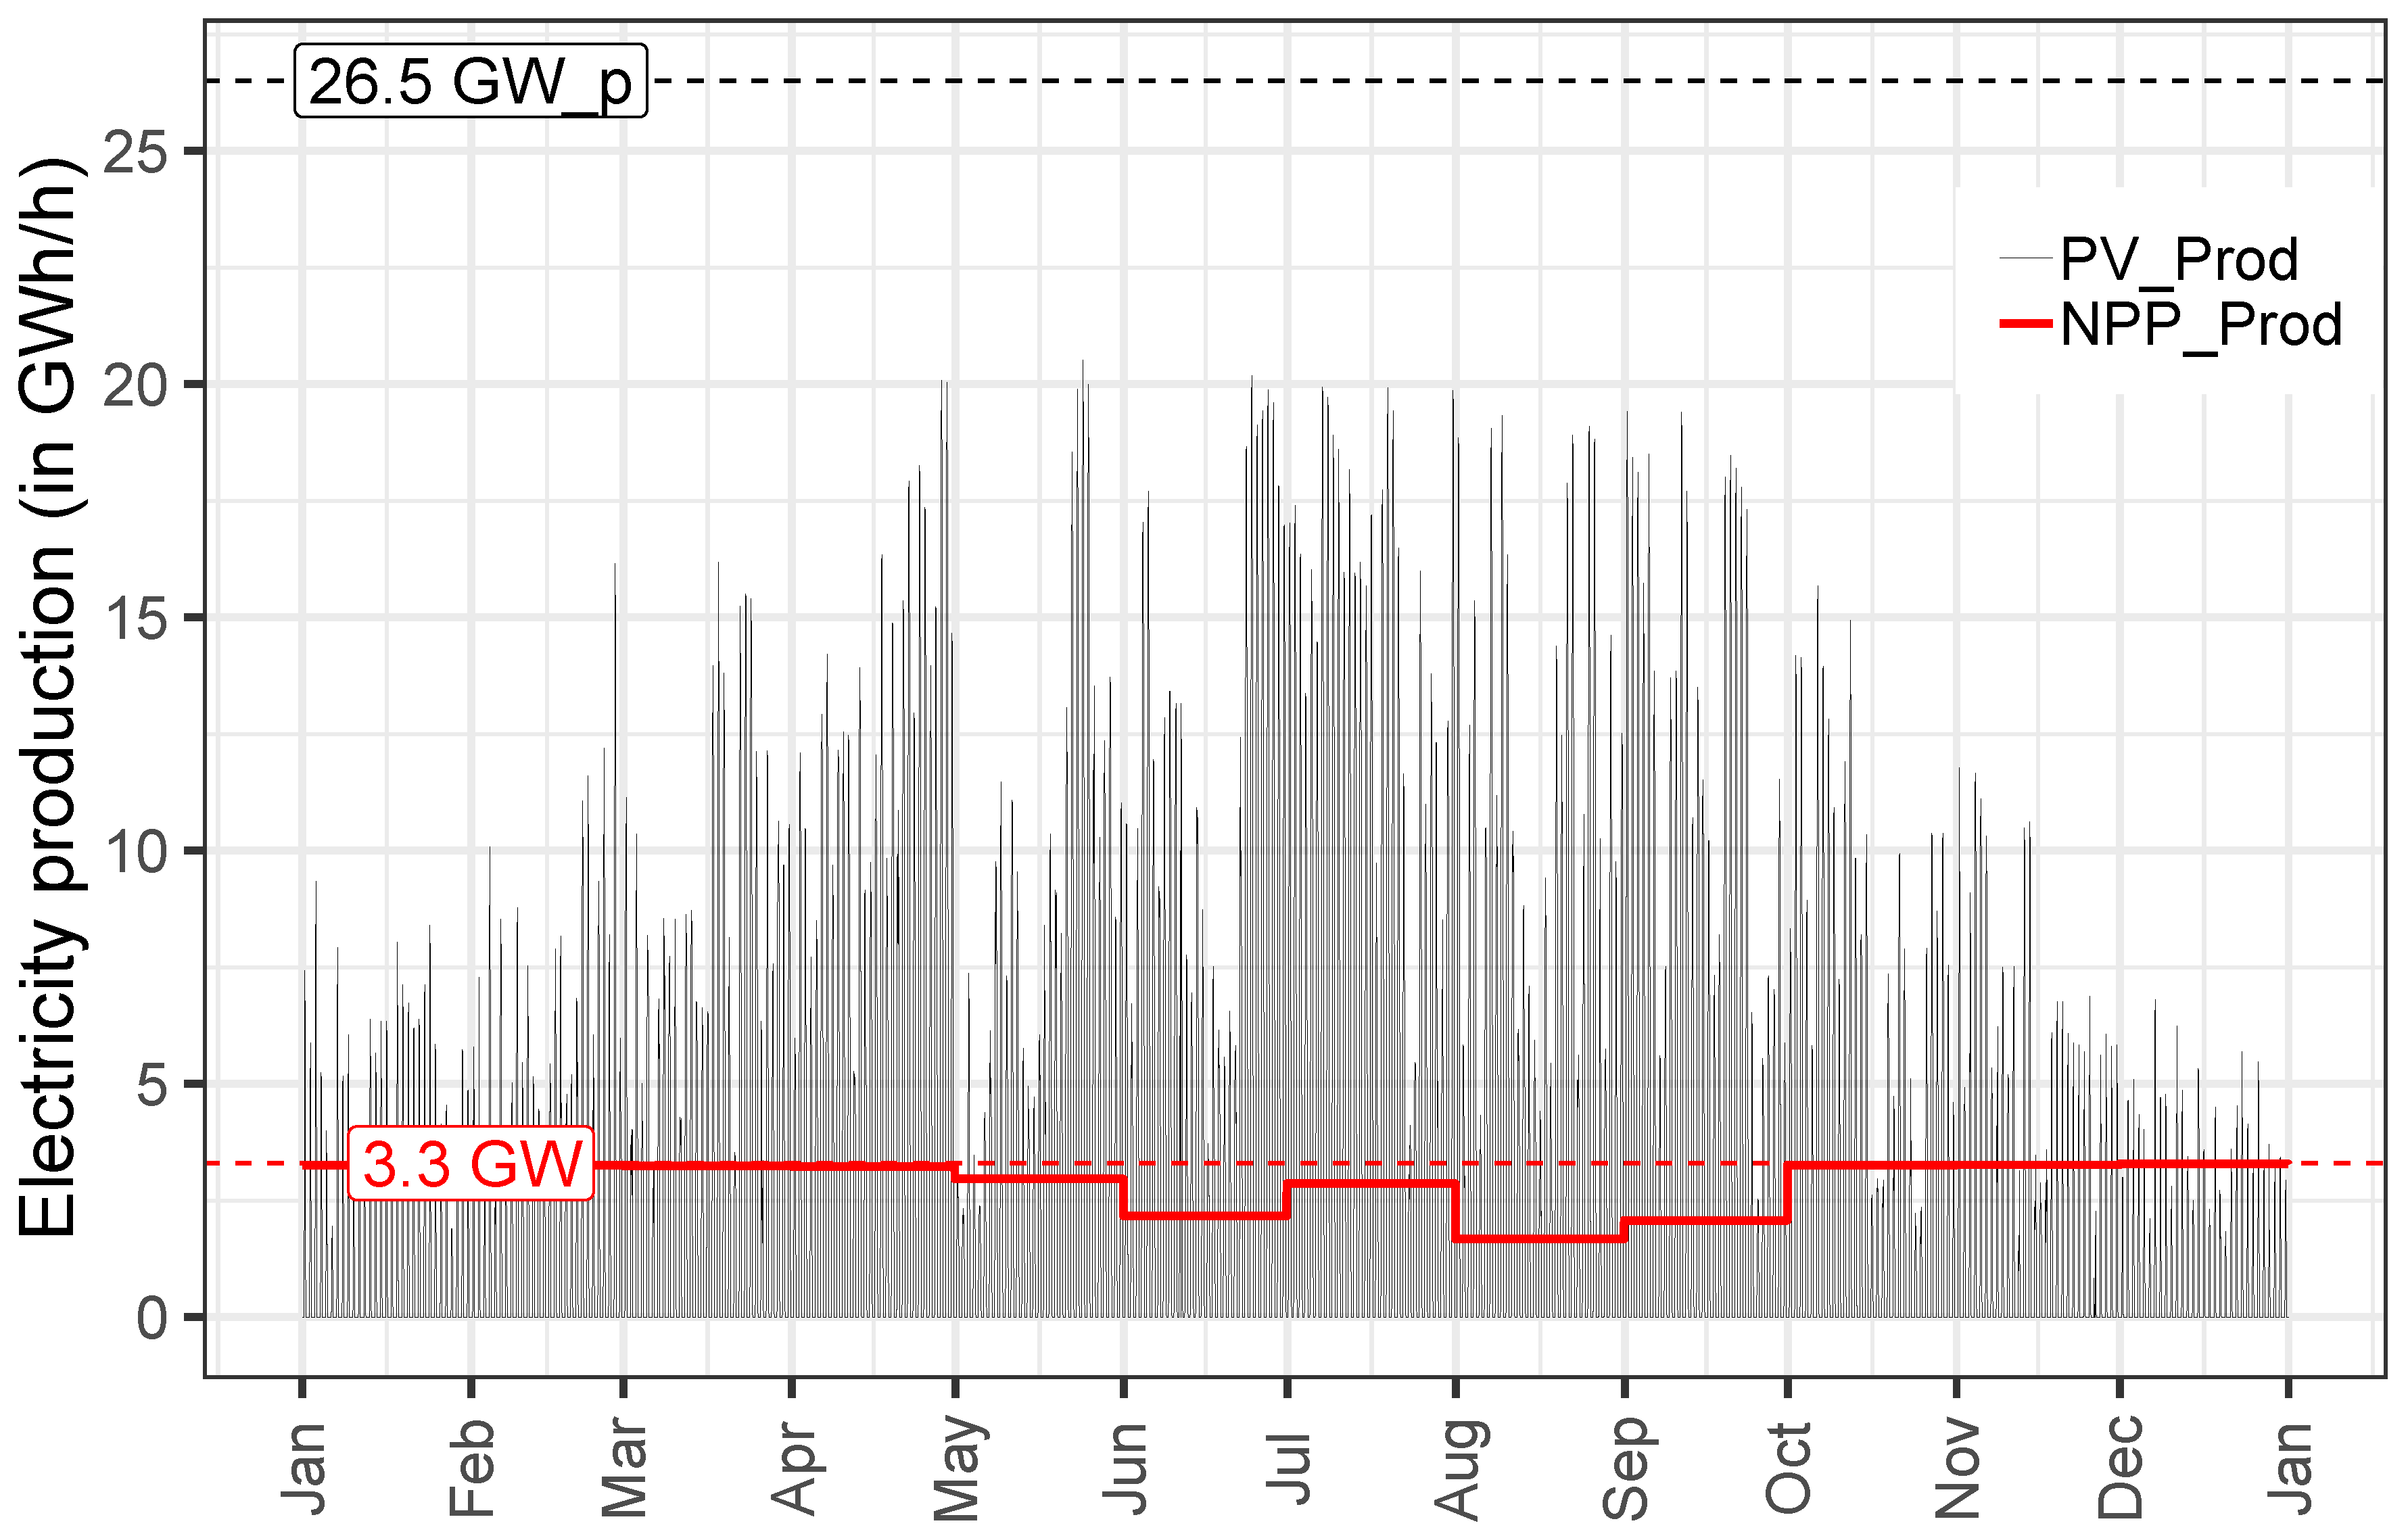
Pfenninger and Staffell [60] used CM-SAF SARAH satellite-derived irradiance data at a spatial resolution of 0.05° × 0.05° (roughly 5 × 5 km) to estimate hourly PV capacities for all Switzerland at a total of 1049 equivalent full load hours. In order to obtain an hourly distribution of PV capacities for 2010, their data has been linearly scaled such that 25 TWh are produced with an installed capacity of 26.5 GW p in 950 equivalent full load hours. The resulting hourly profile is displayed in Figure 10.
In order to obtain modified hourly electricity production profiles of Switzerland with PV and without NPP, the measured electricity production profiles of Swissgrid are taken (see Section 2.1) and for each month, the monthly averaged NPP production of BFE [53] is subtracted at an hourly time resolution (see Figure 10). The remaining (i.e., “denuclearized”) electricity production is roughly from hydro power (run-of-river and dams). Conventional-thermal and currently installed renewable electricity is implicitly included in this “hydro” production. Finally, the total modified electricity production profile is obtained by adding the PV production from Figure 10 on top of this “hydro” production.
If no adjustments for hydro production are made, production peaks of PV and hydro would oftentimes coincide at noon. Moreover, pumps of pumped-hydro storage (PHS) would be operated at night to shift inexpensive (base-load) NPP electricity to more economically lucrative noon hours. This business strategy of (current) hydro power would not be suitable for a denuclearized electricity system with a high penetration of PV, as this strategy would promote additional surplus production at noon and additional deficits at night. Therefore, hydro production and total consumption are adjusted in the following way: Hydro production is smoothed by averaging it to its daily mean value, while total consumption is smoothed by adding a daily averaged “pumps+losses” profile (the difference between total and end-use consumption) to the original Swissgrid end-use consumption. A more involved optimization (e.g., hourly) of hydro production in the light of PV expansion is not conducted in this study, yet intended for further studies.
For a more detailed description of all electricity demand and production profiles used in this study, refer to Table 1 and Figure 11, where these profiles are displayed for one randomly selected day in summer (5 July 2010) and winter (5 February 2010).
In order to properly see and compare the influence of the electrification and denuclearization of the Swiss energy system, the three scenarios in Table 2 have been defined.

2.5. CO2 Intensities

The potential CO2 savings of an electrification and denuclearization of the Swiss energy system are estimated with specific CO2 emissions per kWh (CO2 intensity) of one good (e.g., electricity, heating oil, gasoline, etc.). These CO2 intensities are taken from a life cycle analysis (LCA) “well-to-tank” by means of the ecoinvent database (version 3.4 of Wernet et al. [61]). This approach includes all life cycle CO2 emissions of one good including all associated steps and technologies (e.g., production, conversion, transportation, etc.) from its origin (“well”) until it is in a “tank” (in a vehicle or building) from which it can finally be used to produce heat or kinetic energy. CO2 emissions associated with the life cycle of the final energy converter (vehicle, gas boiler, heat pump, etc.) are out of the scope of this study, since they strongly depend on the actual manufacturing and usage of that technology (e.g., mileage, mode of operation, etc.). If not stated otherwise, “CO2” means “CO2 equivalents”, which also includes the global warming potentials of other greenhouse gases (GHG) such as methane (CH4), nitrous oxide (N2O) and sulfur hexafluoride (SF6) [62].

2.5.1. Fossil Energy Carriers

In 2016, about 67% of the fossil SH demand of private households in Switzerland was covered by heating oil and 33% by natural gas [34]. For hot water production of private households this share in 2016 was 60% heating oil and 40% natural gas [34].
According to Wernet et al. [61], the CO2 intensities of heating oil and natural gas are 322 g C O 2 , e q /kWh and 235 g C O 2 , e q /kWh, respectively. Weighting these CO2 intensities by their shares of 67% and 33%, an average CO2 intensity of 293 g C O 2 , e q /kWh is assumed for fossil heating.
In the mobility sector, with a total fossil energy consumption of 60 TWh, the share of gasoline and diesel for passenger and freight transport was, respectively, 45% and 55% in 2016 [34]. According to Wernet et al. [61] the CO2 emissions per km of gasoline and diesel are 250 g C O 2 , e q /km and 208 g C O 2 , e q /km, respectively. From KBOB [63], the average energy consumption per km of gasoline and diesel is 0.85 kWh/km (7.2 l/100 km) and 0.90 kWh/km (8.8 l/100 km), respectively. This leads to a CO2 intensity of 294 g C O 2 , e q /kWh for gasoline and 270 g C O 2 , e q /kWh for diesel. Upon weighting these CO2 intensities by their shares of 45% and 55%, an average CO2 intensity for mobility of 283 g C O 2 , e q /kWh is assumed. For natural gas vehicles, the following values are taken: 186 g C O 2 , e q /km, 0.90 kWh/km (7 kg/100 km) and 207 g C O 2 , e q /kWh [61,63,64].

2.5.2. Electricity

Regarding life-cycle CO2 emissions of electricity, it must be noted that renewables and NPP only emit CO2 during their production, commissioning and decommissioning, while fossil power plants (e.g., coal, gas, etc.) also emit substantial amounts of CO2 during their operation.
In this study, the following CO2 intensities of different electricity production technologies are used:
  • Hydro (13 g C O 2 , e q /kWh): This is a weighted average according to the Swiss production expectation of run-of-river (4.3 g C O 2 , e q /kWh, weight 48%), dam (6.9 g C O 2 , e q /kWh, weight 48%) and PHS (196 g C O 2 , e q /kWh, weight 4%) [53,61]. For PHS, 86% of the CO2 emissions are attributed to the electricity needed to pump water into the reservoir. Wernet et al. [61] assume that the average Swiss electricity mix at 112 g C O 2 , e q /kWh (domestic production plus imports) is used and that PHS has a 70% round-trip efficiency. Only 11% of the CO2 intensity is attributed to direct CO2 and CH4 emissions of the reservoir.
  • PV (50 g C O 2 , e q /kWh): The 2018 CO2 emissions based on LCA of single-Si PV electricity produced on roofs of European residences is approximately 90 g C O 2 , e q /kWh [61]. In the future (2030 to 2050), for a scenario with “realistic” improvements, these CO2 emissions could be reduced to 25 g C O 2 , e q /kWh because of projected changes in key parameters and the background system [65]. Therefore, in this study, a reasonable intermediate value of 50 g C O 2 , e q /kWh is used.
  • NPP (12 g C O 2 , e q /kWh): This is a weighted average according to the Swiss production expectation of all pressurised water reactors (PWR) with 11.9 g C O 2 , e q /kWh and boiling water reactors (BWR) with 12.6 g C O 2 , e q /kWh [61].
  • Imports (443 g C O 2 , e q /kWh): The CO2 intensity of imported electricity is set to 443 g C O 2 , e q /kWh, which is the CO2 intensity of modern CCGT power plants and is substantially less than the 2017 Swiss import mix with a share of 67% from Germany (679 g C O 2 , e q /kWh), 8% from France (109 g C O 2 , e q /kWh) and 25% from Austria (389 g C O 2 , e q /kWh) for a weighted average CO2 intensity of 560 g C O 2 , e q /kWh [53,61]. The CO2 intensity of imported electricity is assumed to be constant throughout the year. That is, no variability with regard to surplus production of e.g., wind electricity (with 18 g C O 2 , e q /kWh) in other countries is considered. In addition, not considered is the fact that most electricity is imported in winter and the CO2 intensity in winter is higher due to a higher overall demand in Europe—as well as the fact that within a day, imports usually are higher during high demand hours with higher CO2 intensities. Another reasoning behind taking the CO2 intensity of CCGT for imports is that instead of importing electricity (at deficit hours), it could also be produced in Switzerland by newly built CCGT power plants (running mostly on imported natural gas). This corresponds to variant “C” in ES2050.
According to TEP [66], there are four balancing methods (BM) to estimate the CO2 intensity of the Swiss electricity mix. In this study, an adaptation of their method “BM4” is used, in which the CO2 intensity at a particular hour is calculated from the CO2 intensity of the domestic electricity production plus the CO2 intensity of the net imports divided by the corresponding electricity consumption at that particular hour. Any CO2 emissions associated to exported and transit electricity are not taken into account.

2.6. Sensitivity Analysis

In order to see how uncertainties in the assumptions on the key parameters in this study affect the results and conclusions, a one-way sensitivity analysis on each key parameter is performed. While a one-way sensitivity analysis is one of the simplest forms of sensitivity analyses since only one parameter is changed at a time and correlations between parameters are not considered, it is still employed as it shows the influence of each parameter in an obvious and straightforward way. In order to also see the interrelationships (correlations) between parameters in all dimensions, more advanced methods such as probabilistic sensitivity analysis (PSA) could be employed. However, in order to do so, the explicit (linear and non-linear) correlations between the parameters (e.g., forward flow temperature of heat pumps and degree of building retrofit) need to be studied. This is out of the scope of this study.
Table 3 shows all of these key parameters including their default values as well as their plausible range of values. Absolute parameter ranges, if they exist, are taken as the physical or logical boundaries of that parameter, while the plausible parameter ranges are obtained either by calculating the median value between the default value and the absolute minimum and maximum, respectively, or by taking a sensible extreme value/scenario from literature.
For the sensitivity analysis all key parameters in Table 3 are altered from their default by a certain percentage (usually up to ±30%), while all other parameters remain at their defaults. However, if the percentage change of the parameter (e.g., at +30%) falls outside of its plausible range of values, the maximum plausible value (e.g., at +27%) is taken as an upper (or lower) limit.
Results of this sensitivity analysis are visualized in so-called “spider graphs” [67], where the positive or negative slope of the curve (line) shows the influence of the parameter on the results. Parameters with no influence are not displayed in the spider graphs.

3. Results and Discussion

3.1. Additional Electricity Demand by Heat Pumps and BEV

3.1.1. Total Electricity Demand

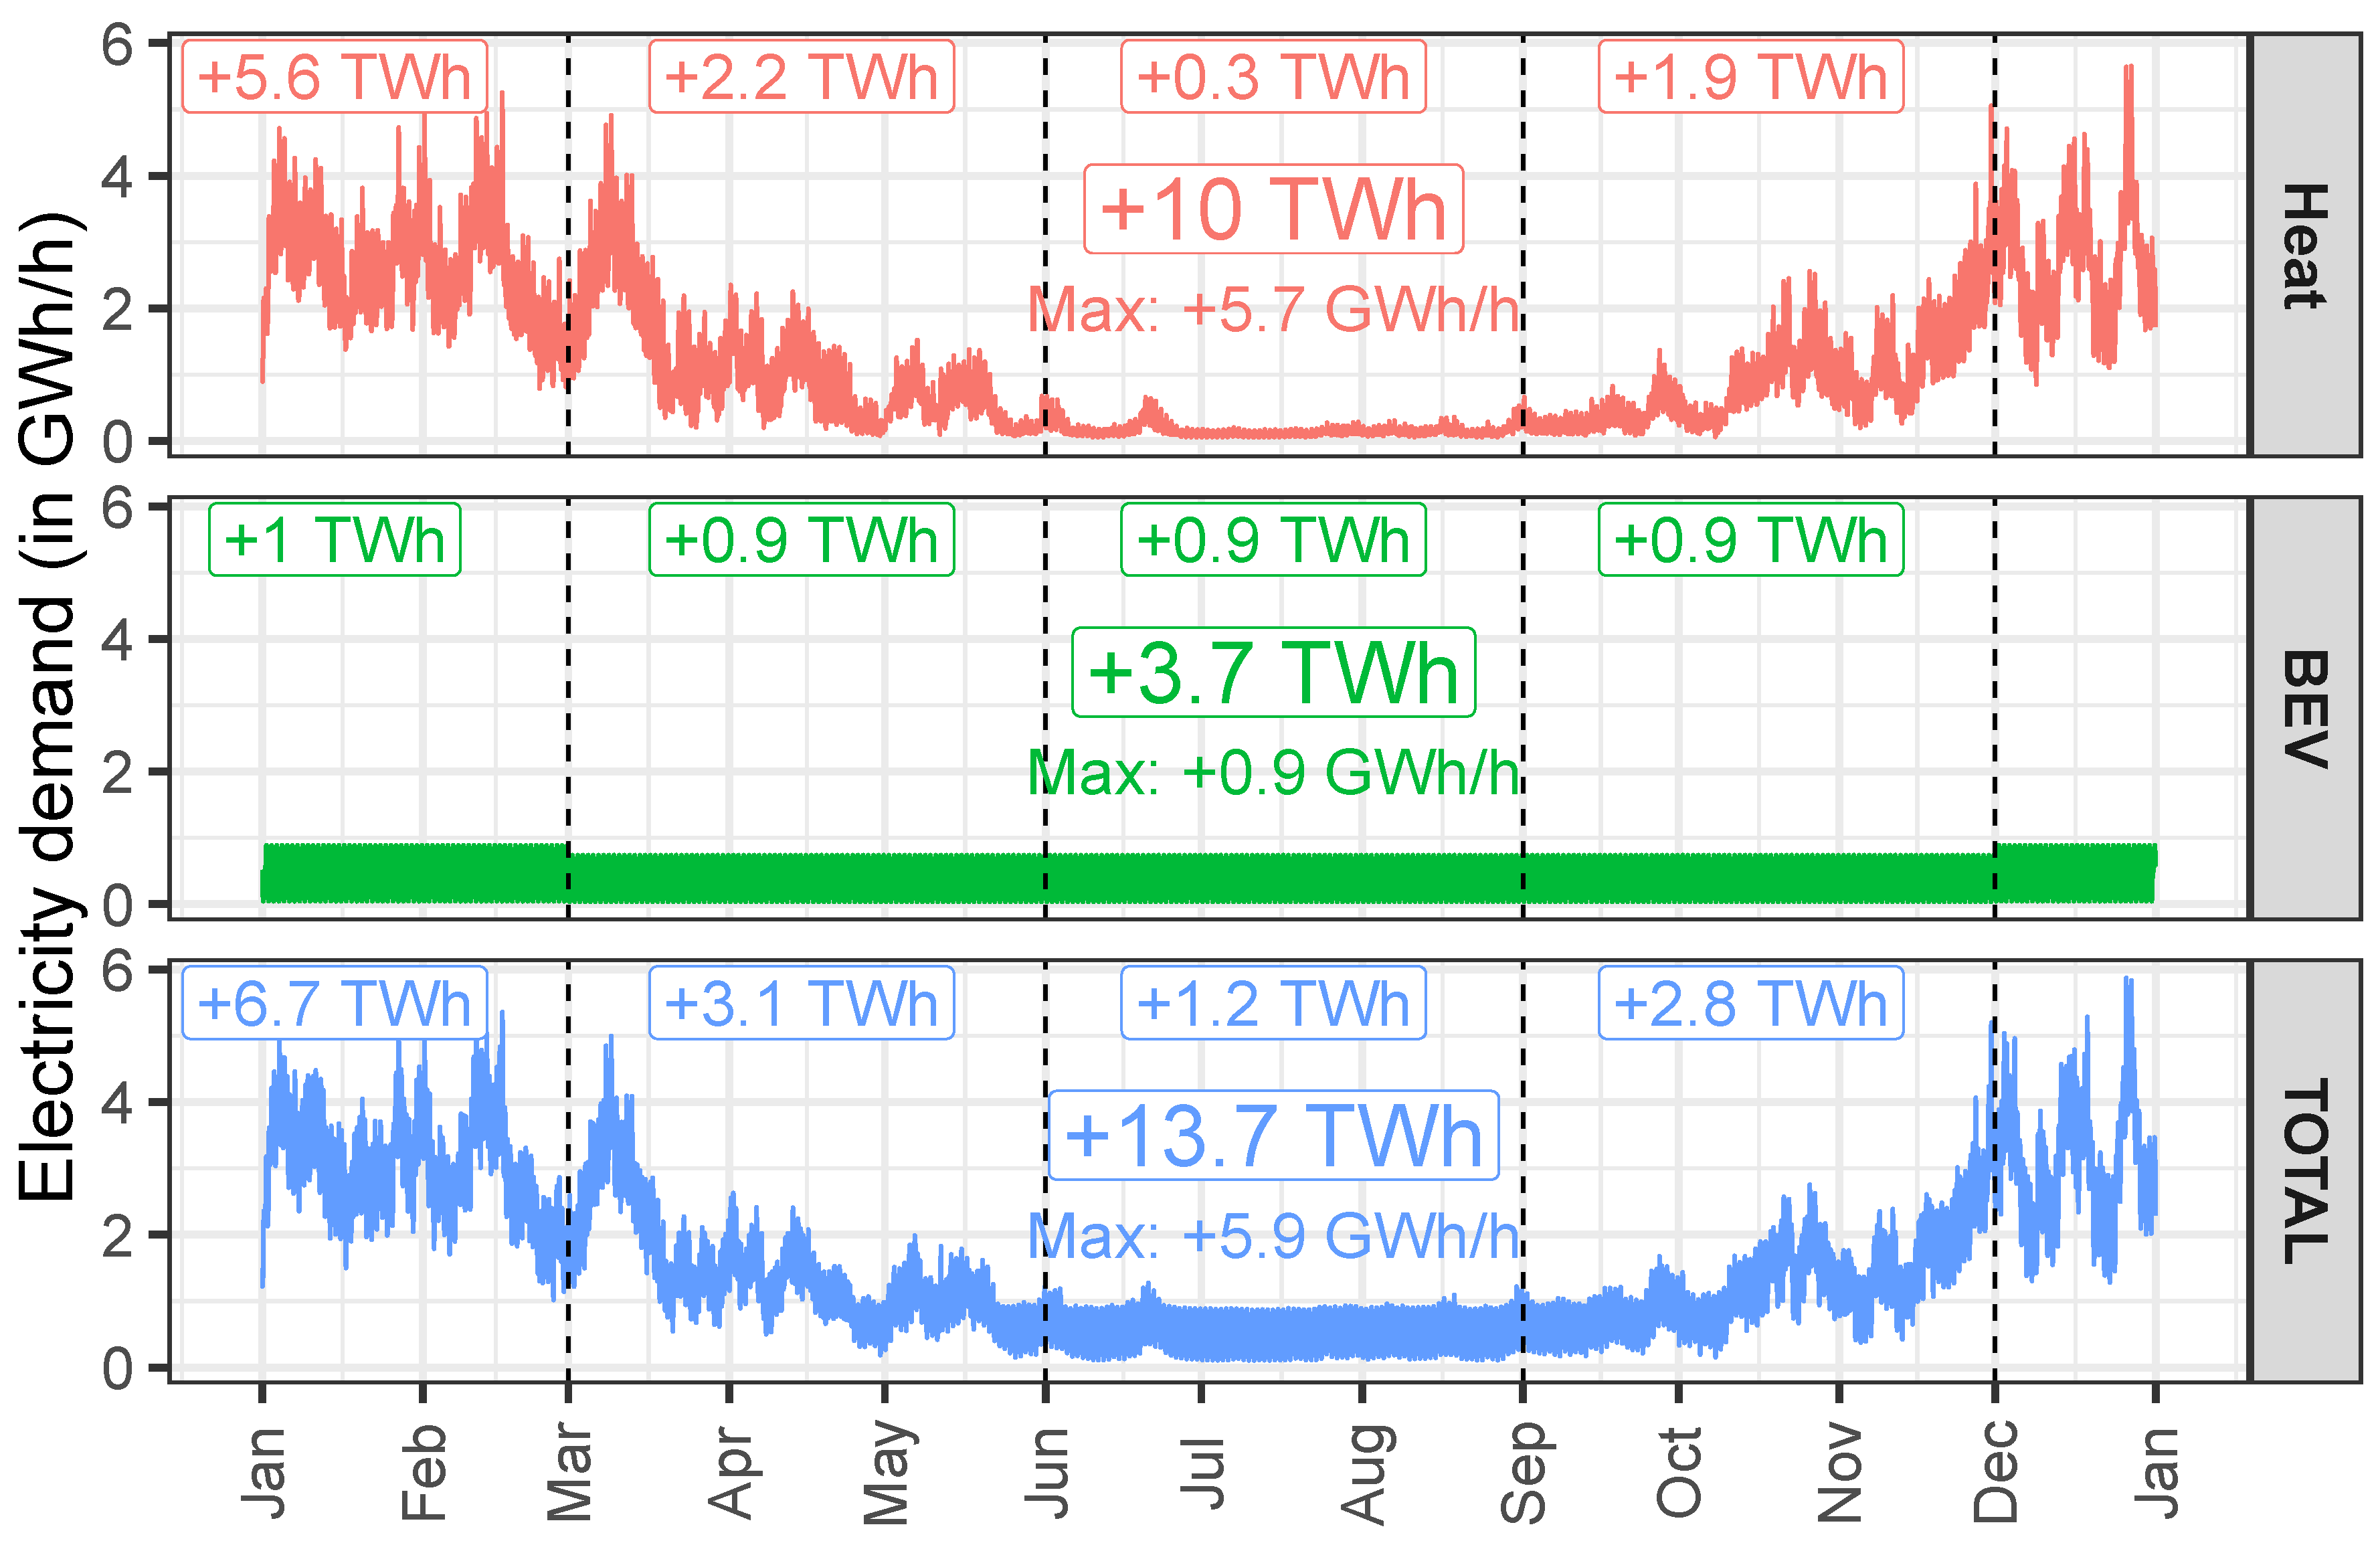
The hourly additional electricity demand due to a 75% and 20% electrification of the Swiss heat and mobility sector by heat pumps and BEV, respectively, is displayed in Figure 12. The total additional electricity demand is 13.7 TWh, of which 10 TWh and 3.7 TWh are for heating (SH and DHW) and BEV, respectively. To put these numbers into perspective, the 2017 end-use electricity demand in Switzerland was 58.5 TWh [53]. Therefore, in relative terms, the additional electricity demand of heat pumps and BEV is 23% of the current Swiss electricity demand.
The sensitivity plot in Figure 13 shows that if only one parameter is varied by a maximum ±30%, the additional electricity demand may range from 11.1 TWh to 15.6 TWh, if the share of heat pumps for SH (“HP share SH”) is reduced to 56% and if “SH savings” is reduced to −29%, respectively. In addition, the flow temperature of heat pumps (“HP flow temp.”) has a strong influence on the additional electricity demand. Contrarily, the share of heat pumps for DHW (“HP share DHW”) only marginally affects the additional electricity demand. Synergetic effects of parameter combinations, if they are (more or less) additive, can also be assessed (at least qualitatively) from Figure 13: For instance, if there is a large degree of retrofitting (i.e., 55%) and hence the flow temperature of heat pumps can be reduced to 35 °C, the additional electricity demand is reduced to about 10.7 TWh (13.7 TWh (default)–1.2 TWh–1.8 TWh). An actual rerun with “SH savings” = 55% and “HP flow temp.” = 35 °C yields an additional electricity of 10.8 TWh.
Regarding efficiency gains, in mobility an efficiency factor of 3.2 is obtained between BEV and ICE. For heating, a demand-weighted average COP for SH and DHW of 3.3 and 3.5 is obtained, respectively. Considering both SH and DHW combined, it is 3.3, which is the efficiency gain of heat pumps compared to their fossil counterparts.

3.1.2. Maximum Power Demand

In this study, power demand is not expressed as the instantaneous power in “GW”, but approximated as the hourly electricity demand in “GWh/h” (hourly averaged power), in order to clearly distinguish between power as an equivalent of the averaged energy demand per time unit and the installed power (capacity) of a power plant. In winter, the maximum additional power demand of heat pumps and BEV is 5.9 GWh/h, whereof 5.7 GWh/h are attributed to heat pumps. In summer, the additional power demand is mainly attributed to BEV with a maximum of 0.9 GWh/h.
The sensitivity plot in Figure 14 shows a range of values from 4.3 GWh/h to 6.9 GWh/h. As with the total additional electricity demand, the most influential parameters on the maximum power demand are “SH savings”, “HP share SH” and “HP flow temp.”. By having a lower “SH savings” of −29%, the maximum power demand (in winter) would increase from its default 5.9 GWh/h to about 7 GWh/h. Again the effect of having a low “SH savings” could be accompanied by higher flow temperatures of heat pumps (e.g., from 45 °C to 50 °C), which would additionally increase the maximum power demand by another 0.5 GWh/h. With respect to the maximum power demand, the “BEV km share” only plays a minor role in the range of investigated parameter values.
In Figure 15, the additional hourly electricity and power demand for BEV and heat pumps is displayed for a randomly selected day in winter (1 February 2010) and summer (1 July 2010). In Figure 15, also the daily average of these demands is illustrated in order to discern typical diurnal patterns with peaks and troughs at distinct hours of the day. In winter, there are two peaks: a first—and more dominant one—in the morning at about 6 a.m., which is mostly attributed to heat demand, and a second one in the evening at about 6 p.m., which is attributed both to heating and BEV recharging. A trough in demand in winter is at noon and midnight. In summer, there is a peak demand in the evening at about 6 p.m. from BEV recharging and a trough at night.
From these peaks and troughs in the hourly electricity demand patterns of heat pumps and BEV, it can be seen that there is a substantial potential to reduce demand peaks by means of load shifting strategies (demand side management). This potential is even larger, if also hourly electricity production patterns (e.g., of PV) are considered (see Section 3.2.2).

3.2. Total Swiss Electricity Demand and Production

3.2.1. Demand

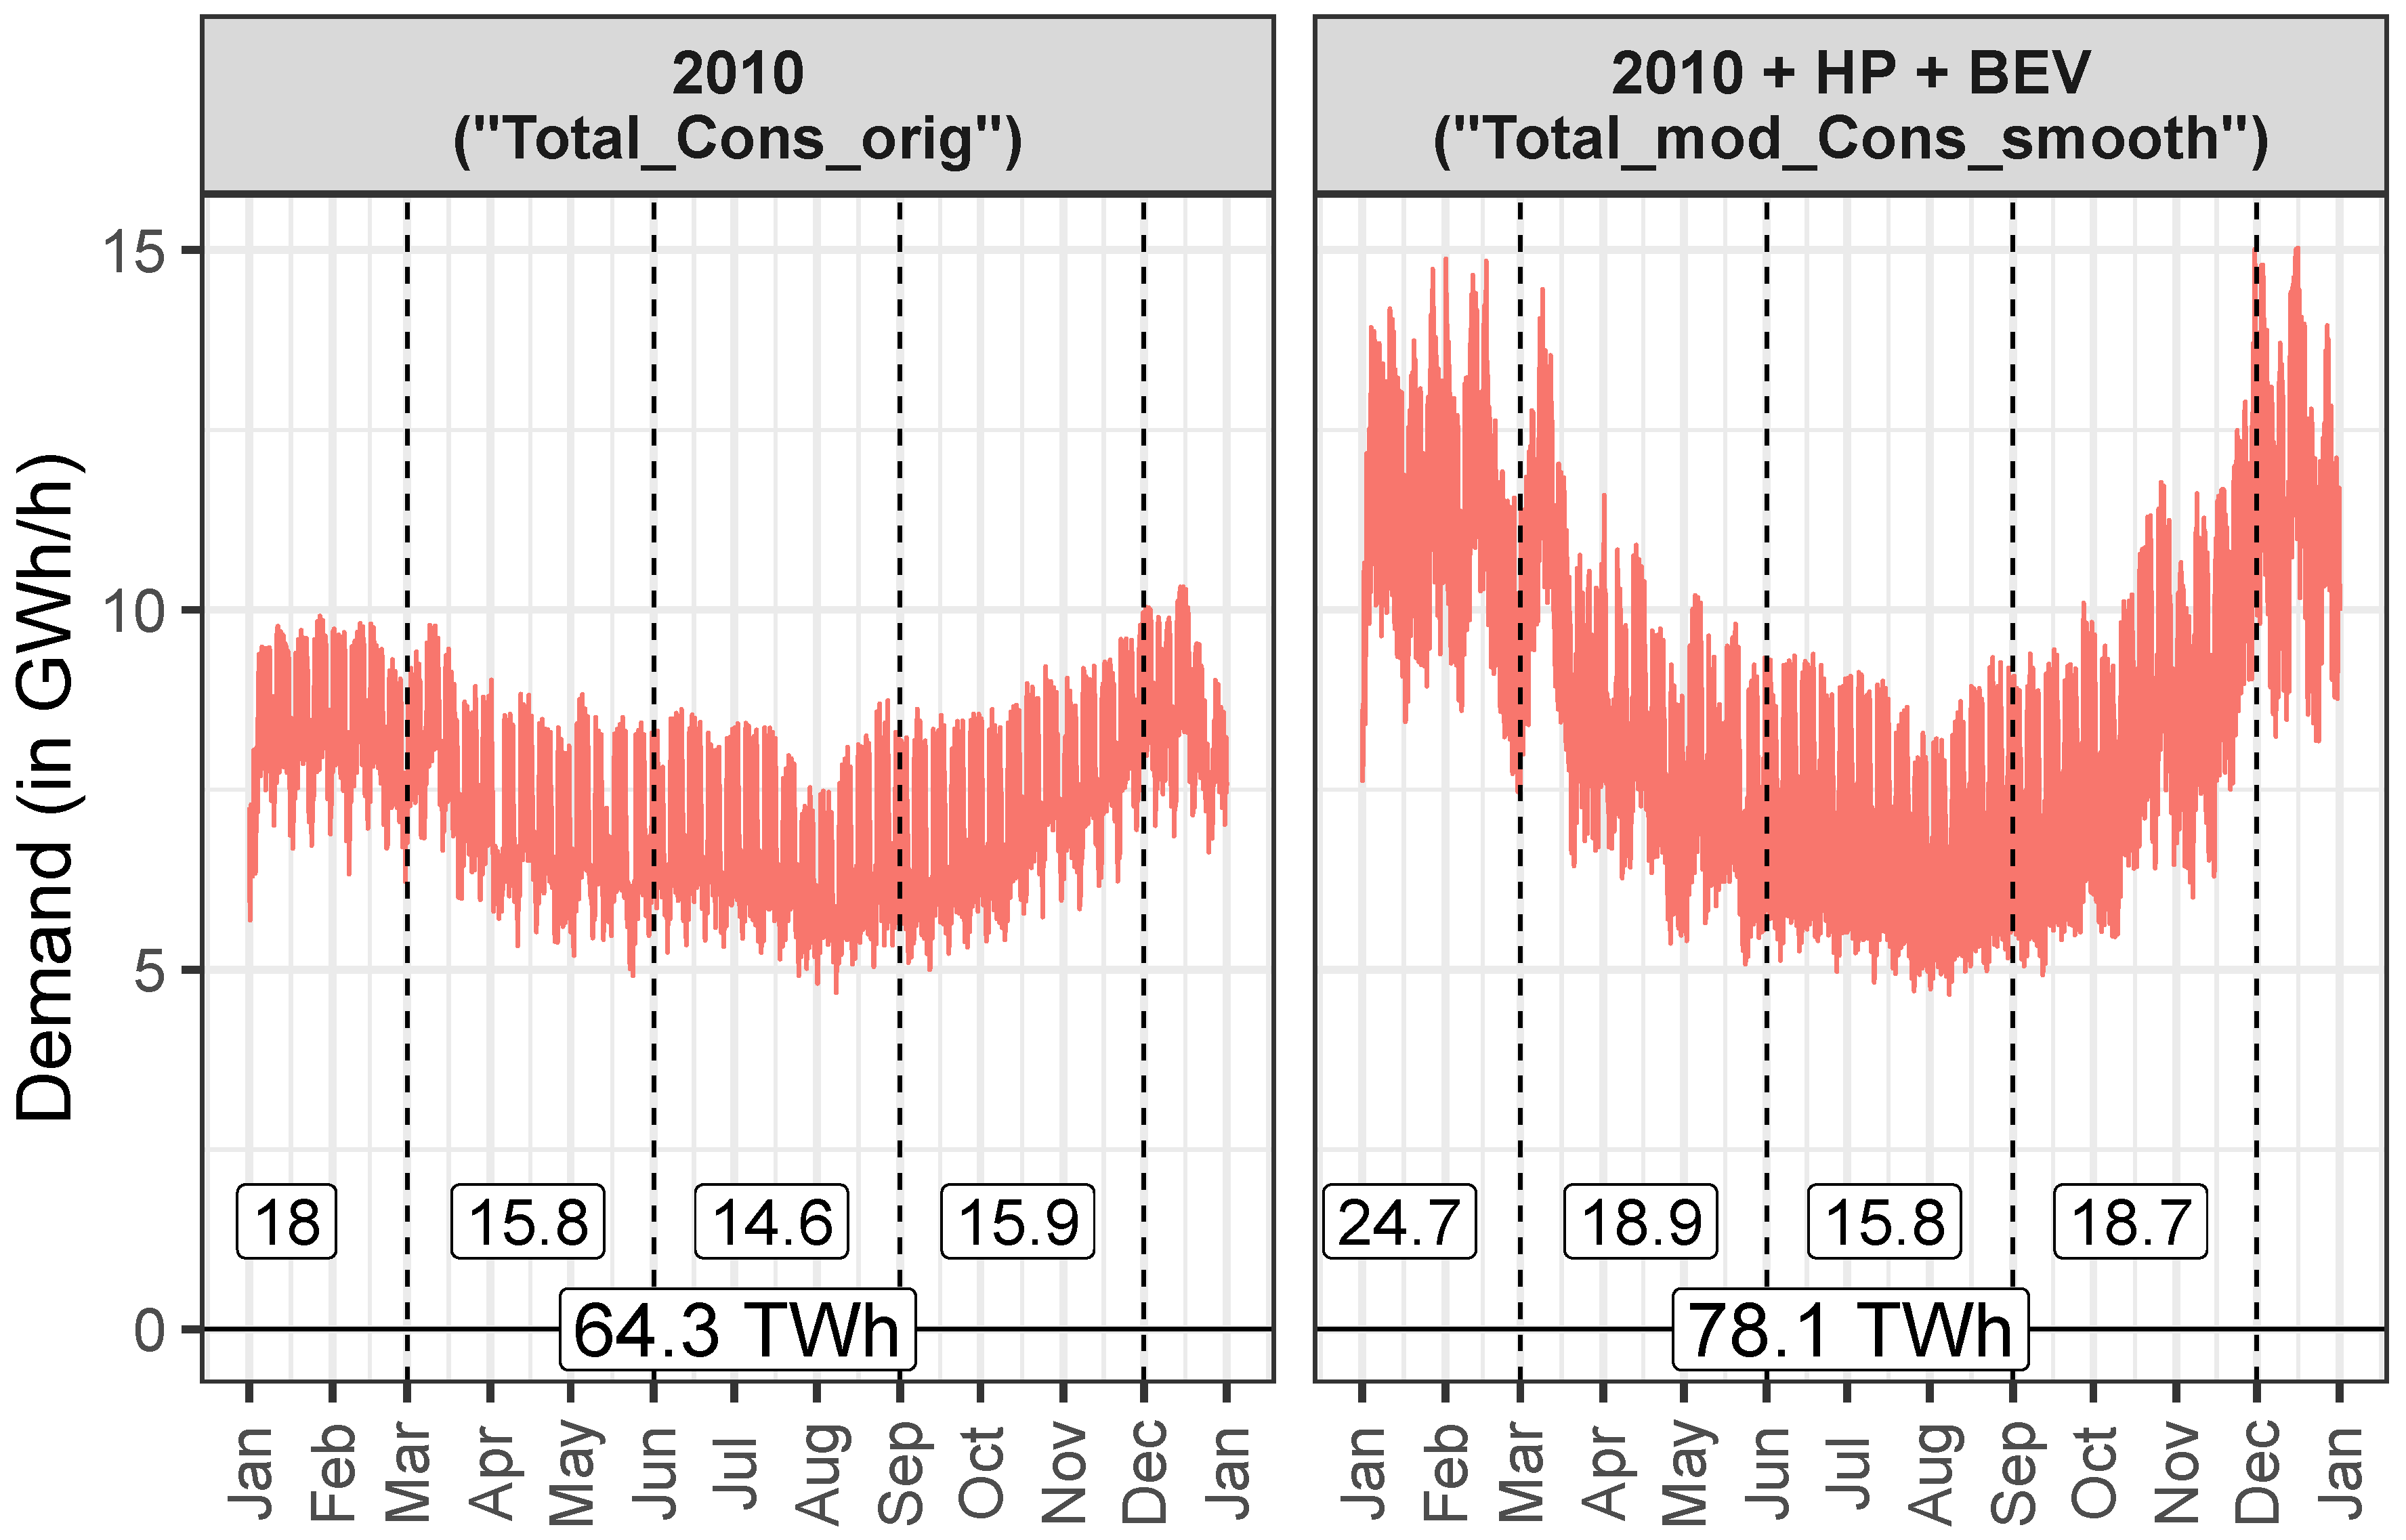
Comparing the original total electricity demand of Swissgrid (“Total_Cons_orig” in Table 1) to the modified total electricity demand with the additional heat pumps and BEV (“Total_mod_Cons_smooth” in Table 1), there is a rise from 64.3 TWh to 78.1 TWh (see Figure 16). The corresponding maximum power demand increases from 10.3 GWh/h in “Total_Cons_orig” to 15 GWh/h in “Total_mod_Cons_smooth”.
Figure 17 displays a randomly selected week in winter and summer with the original (“Total_Cons_orig”) and modified (“Total_mod_Cons_smooth”) electricity demand. In winter, a substantial increase in the demand both in terms of consumed electricity and required power can be seen. In summer, there is a visible increase in the electricity demand (mainly in the evening hours due to BEV recharging), too, yet to a much lower degree than in winter.
For comparison, in 2017, the total installed power of Switzerland’s main electricity production infrastructure was [68]:
  • Nuclear     3.3 G W e l
  • Run-of-river   4.0 G W e l
  • Dam        8.7 G W e l
  • PHS         2.0 G W e l (as of 2020: 4.0 G W e l )
  • PV        1.7 G W e l
  • Others       1.1 G W e l
  • TOTAL:        20.8 G W e l
In sum, there is enough installed power to produce these additional demand peaks of heat pumps and BEV. However, in practice, only dam and PHS plants are flexible enough to shift parts of their production in time. All other technologies are either base-load production without much flexibility or stochastic in nature (PV and wind) such that they cannot flexibly adapt their production to demand peaks. Therefore, domestic electricity production capacities are a limiting factor to cope with the maximum required additional power demands by heat pumps and BEV. In order to deliver the necessary electricity on time, increased amounts of imports (in particular in winter) are needed (see Section 3.3). This, however, goes at the cost of a higher CO2 footprint of the used electricity (see Section 3.4).

3.2.2. Production

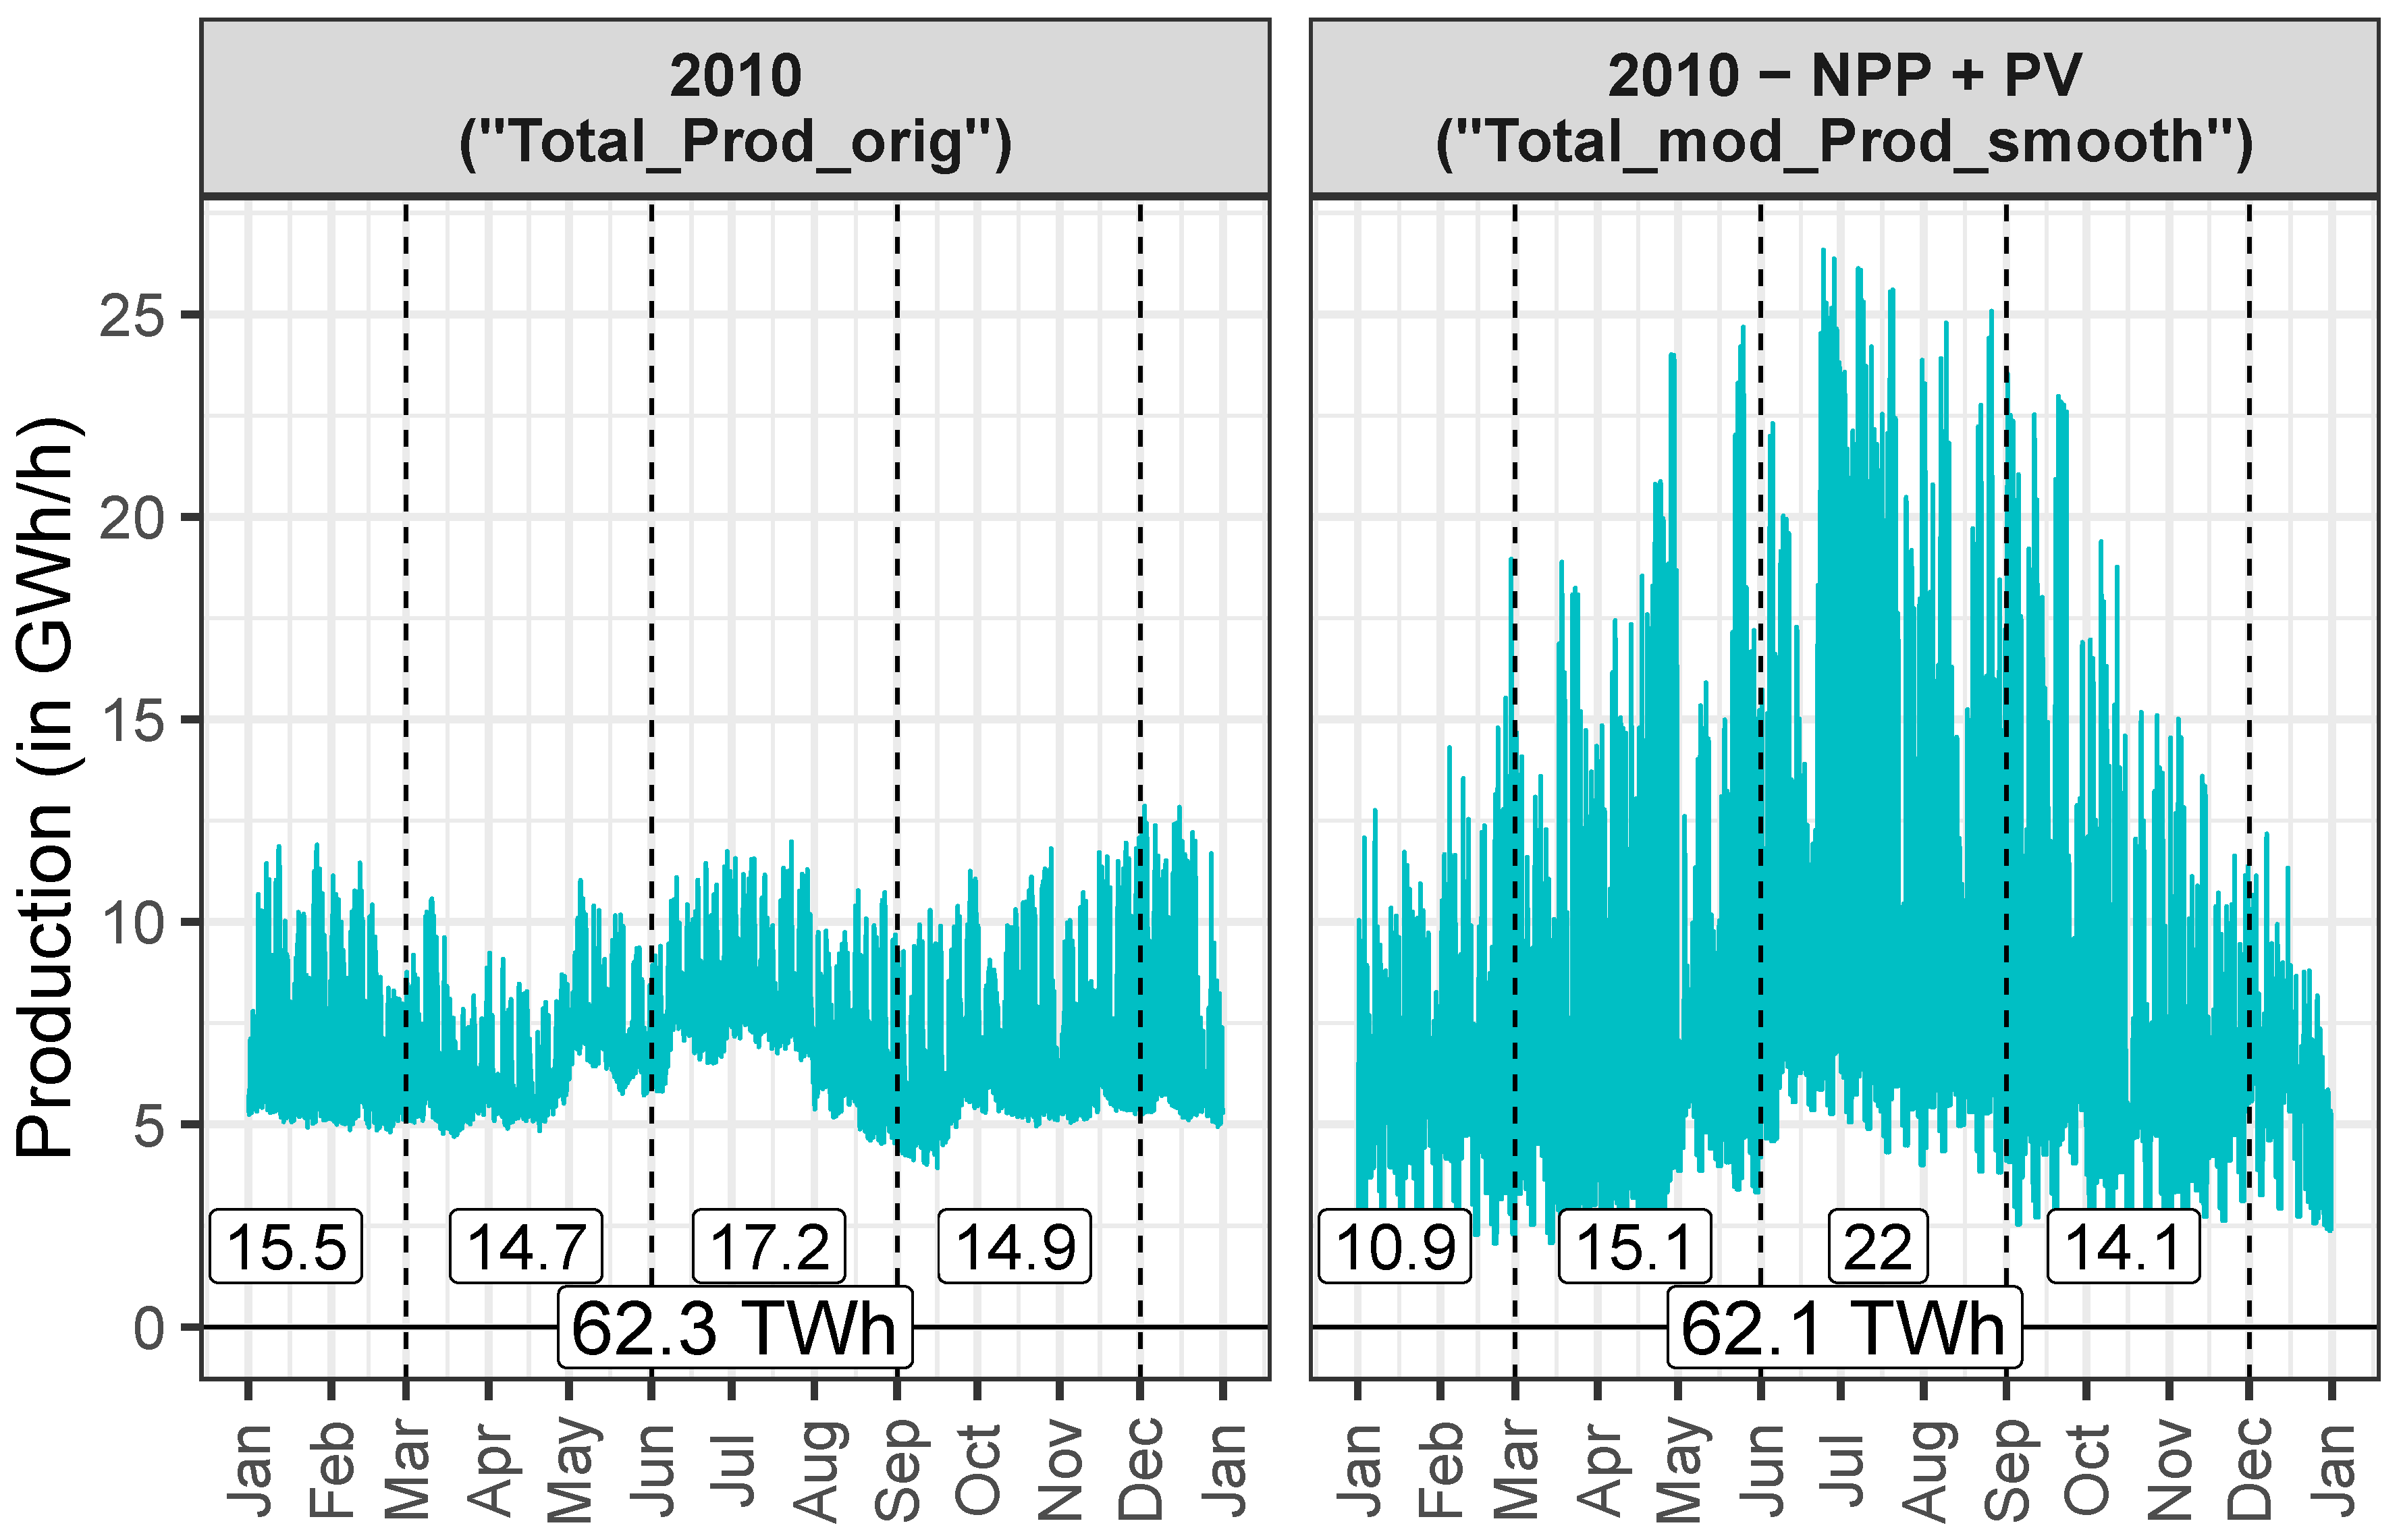
The yearly electricity production for the original profile of Swissgrid with NPP (“Total_Prod_orig” in Table 1) and the modified profile with a complete substitution of NPP by PV (“Total_mod_Prod_smooth” in Table 1) is displayed in Figure 18.
The total electricity production in both cases is almost equal with 62.3 TWh and 62.1 TWh, respectively. However, the seasonal total production shows that in the modified profile about 5 TWh are shifted from winter to summer. In spring and autumn, the total production remains almost unchanged. In the modified profile, electricity production peaks in summer rise to 26.6 GWh/h, compared to 12.9 GWh/h in the original profile. Handling these additional PV production peaks, poses a major challenge for the electricity systems and will be discussed in more detail in Section 3.3 on electricity surpluses and deficits.
The electricity production for a randomly selected week in winter and summer in the original and modified case is displayed in Figure 19. Due to the massive penetration of PV, there is much more volatility with a typical peak production at noon (both in winter and even more pronounced in summer) and a decreased production at night due to the discarded base-load production of NPP.
The daily (and weekly) demand and production cycles in Figure 17 and Figure 19, respectively, are, in particular, relevant for demand and supply side management strategies. This could for instance be a preferential recharging of BEV at noon (e.g., at work), when PV production is highest, instead of in the evening (see Figure 15). Such load shifting strategies shall be addressed in more detail in a subsequent study.

3.3. Deficits and Surpluses

3.3.1. Hourly Values

The hourly electricity surpluses and deficits for the scenarios “Status quo”, “PV-NPP” and “PV-NPP-HP-BEV” (see Table 2) are plotted in Figure 20 along with their seasonal and annual sums.
Without countermeasures such as long- and/or short-term storage, the surpluses and deficits in “PV-NPP” and “PV-NPP-HP-BEV” at particular hours of the day and particular seasons of the year increase substantially compared to “Status quo”. While the total amount of surplus electricity for one year is highest in “PV-NPP” with 14.7 TWh—due to volatile PV production and unchanged consumption—the total electricity deficit is highest for “PV-NPP-HP-BEV” with 28.5 TWh.
Even with unlimited storage, the net deficit of 2.0 TWh, 2.2 TWh and 15.9 TWh, respectively, has to be imported in any case due to a higher electricity consumption than production. The difference of −0.2 TWh between “Status quo” and “PV-NPP” is the difference in the total amount of the annual electricity production (see Figure 18). Hence, in the “PV-NPP-HP-BEV” scenario—without the construction of additional Swiss power plants (e.g., CCGT)—the additional electricity demand of 13.7 TWh from heat pumps and BEV has to be imported in any case.
Regarding seasonal characteristics of deficits and surpluses, in summer, in “PV-NPP” and “PV-NPP-HP-BEV” a net surplus of 7.4 TWh (8.0–0.6 TWh) and 6.2 TWh (7.3–1.1 TWh) can be seen, respectively. For comparison, in “Status quo”, the net surplus in summer is 2.7 TWh (2.8–0.1 TWh). In winter, there is a net deficit of −7.1 TWh and −13.8 TWh in “PV-NPP” and “PV-NPP-HP-BEV”, respectively. In “Status quo”, the net deficit in winter is −2.5 TWh. This shows that in the denuclearized and electrified scenarios, there is a much stronger seasonal variation in terms of surpluses in summer and deficits in winter.
The sensitivity plot of annual surpluses in Figure 21 shows a range of values from 6.9 TWh to 18.8 TWh with the default at 12.6 TWh. By far the most influential parameter is the annual PV production (“PV prod.”). An important parameter with an opposite effect on surpluses is “BEV km share”. This is due to the fact that BEV are a potential additional consumer of surplus electricity from PV in summer, in particular if they are recharged at noon. This may be achieved by load shifting (from evening hours to noon) or short-term storage options. However, compared to “PV prod.”, all other parameters do only marginally affect electricity surpluses.
Regarding annual deficits, the sensitivity plot in Figure 22 shows a range of values from 26.0 TWh to 30.3 TWh with the default at 28.5 TWh. There are several strongly influential parameters such as “HP share SH”, “SH savings” as well as “PV prod.” and “BEV km share”. For instance, if “HP share SH” is reduced to its plausible minimum of 50% (see Table 3) and all other parameters remain at their defaults, imports are reduced to 25.4 TWh. On the other hand, if the SH demand is only reduced by −20% (instead of −42%) and still 80% of the SH demand is electrified by heat pumps, deficits rise to 31.5 TWh.
The required power to cope with the maximum momentary surplus in summer in “Status quo”, “PV-NPP” and “PV-NPP-HP-BEV” (see Figure 20) are 4.2 GWh/h, 19.3 GWh/h, and 18.7 GWh/h, respectively. This is for instance the required nominal charging power to store all momentary surpluses in long- and/or short-term storage facilities such as (stationary) batteries, PHS or power-to-gas. In the near future (as of 2020) only about 4 GW of pumping power and a storage capacity of about 200–400 GWh [22,69,70] can be provided by PHS in Switzerland to flexibly store electricity. However, Dujardin et al. [69] showed that storage power of PHS is often the limiting factor to effectively store a large surplus production of PV. Moreover, PHS storage is only possible, if also the necessary downstream and upstream water quantities are available. Additional amounts of charging power and storage capacity can only be provided by a large distributed set of (stationary) batteries such as, for instance, the currently largest stationary battery in Switzerland at a rated charging/discharging power of 18 MW and a capacity of 7.5 MWh [71] or vehicle-to-grid technologies [72].
In winter, the maximum additional production power to cope with the maximum momentary deficit in “Status quo”, “PV-NPP” and “PV-NPP-HP-BEV” are 3.4 GWh/h, 6.4 GWh/h, and 10.9 GWh/h. This is for instance the required nominal power of new Swiss CCGT power plants or the discharging power of storage facilities (PHS, batteries, etc.) and dams to offset all momentary deficits without resorting to electricity imports, etc.

3.3.2. Weekly Aggregation

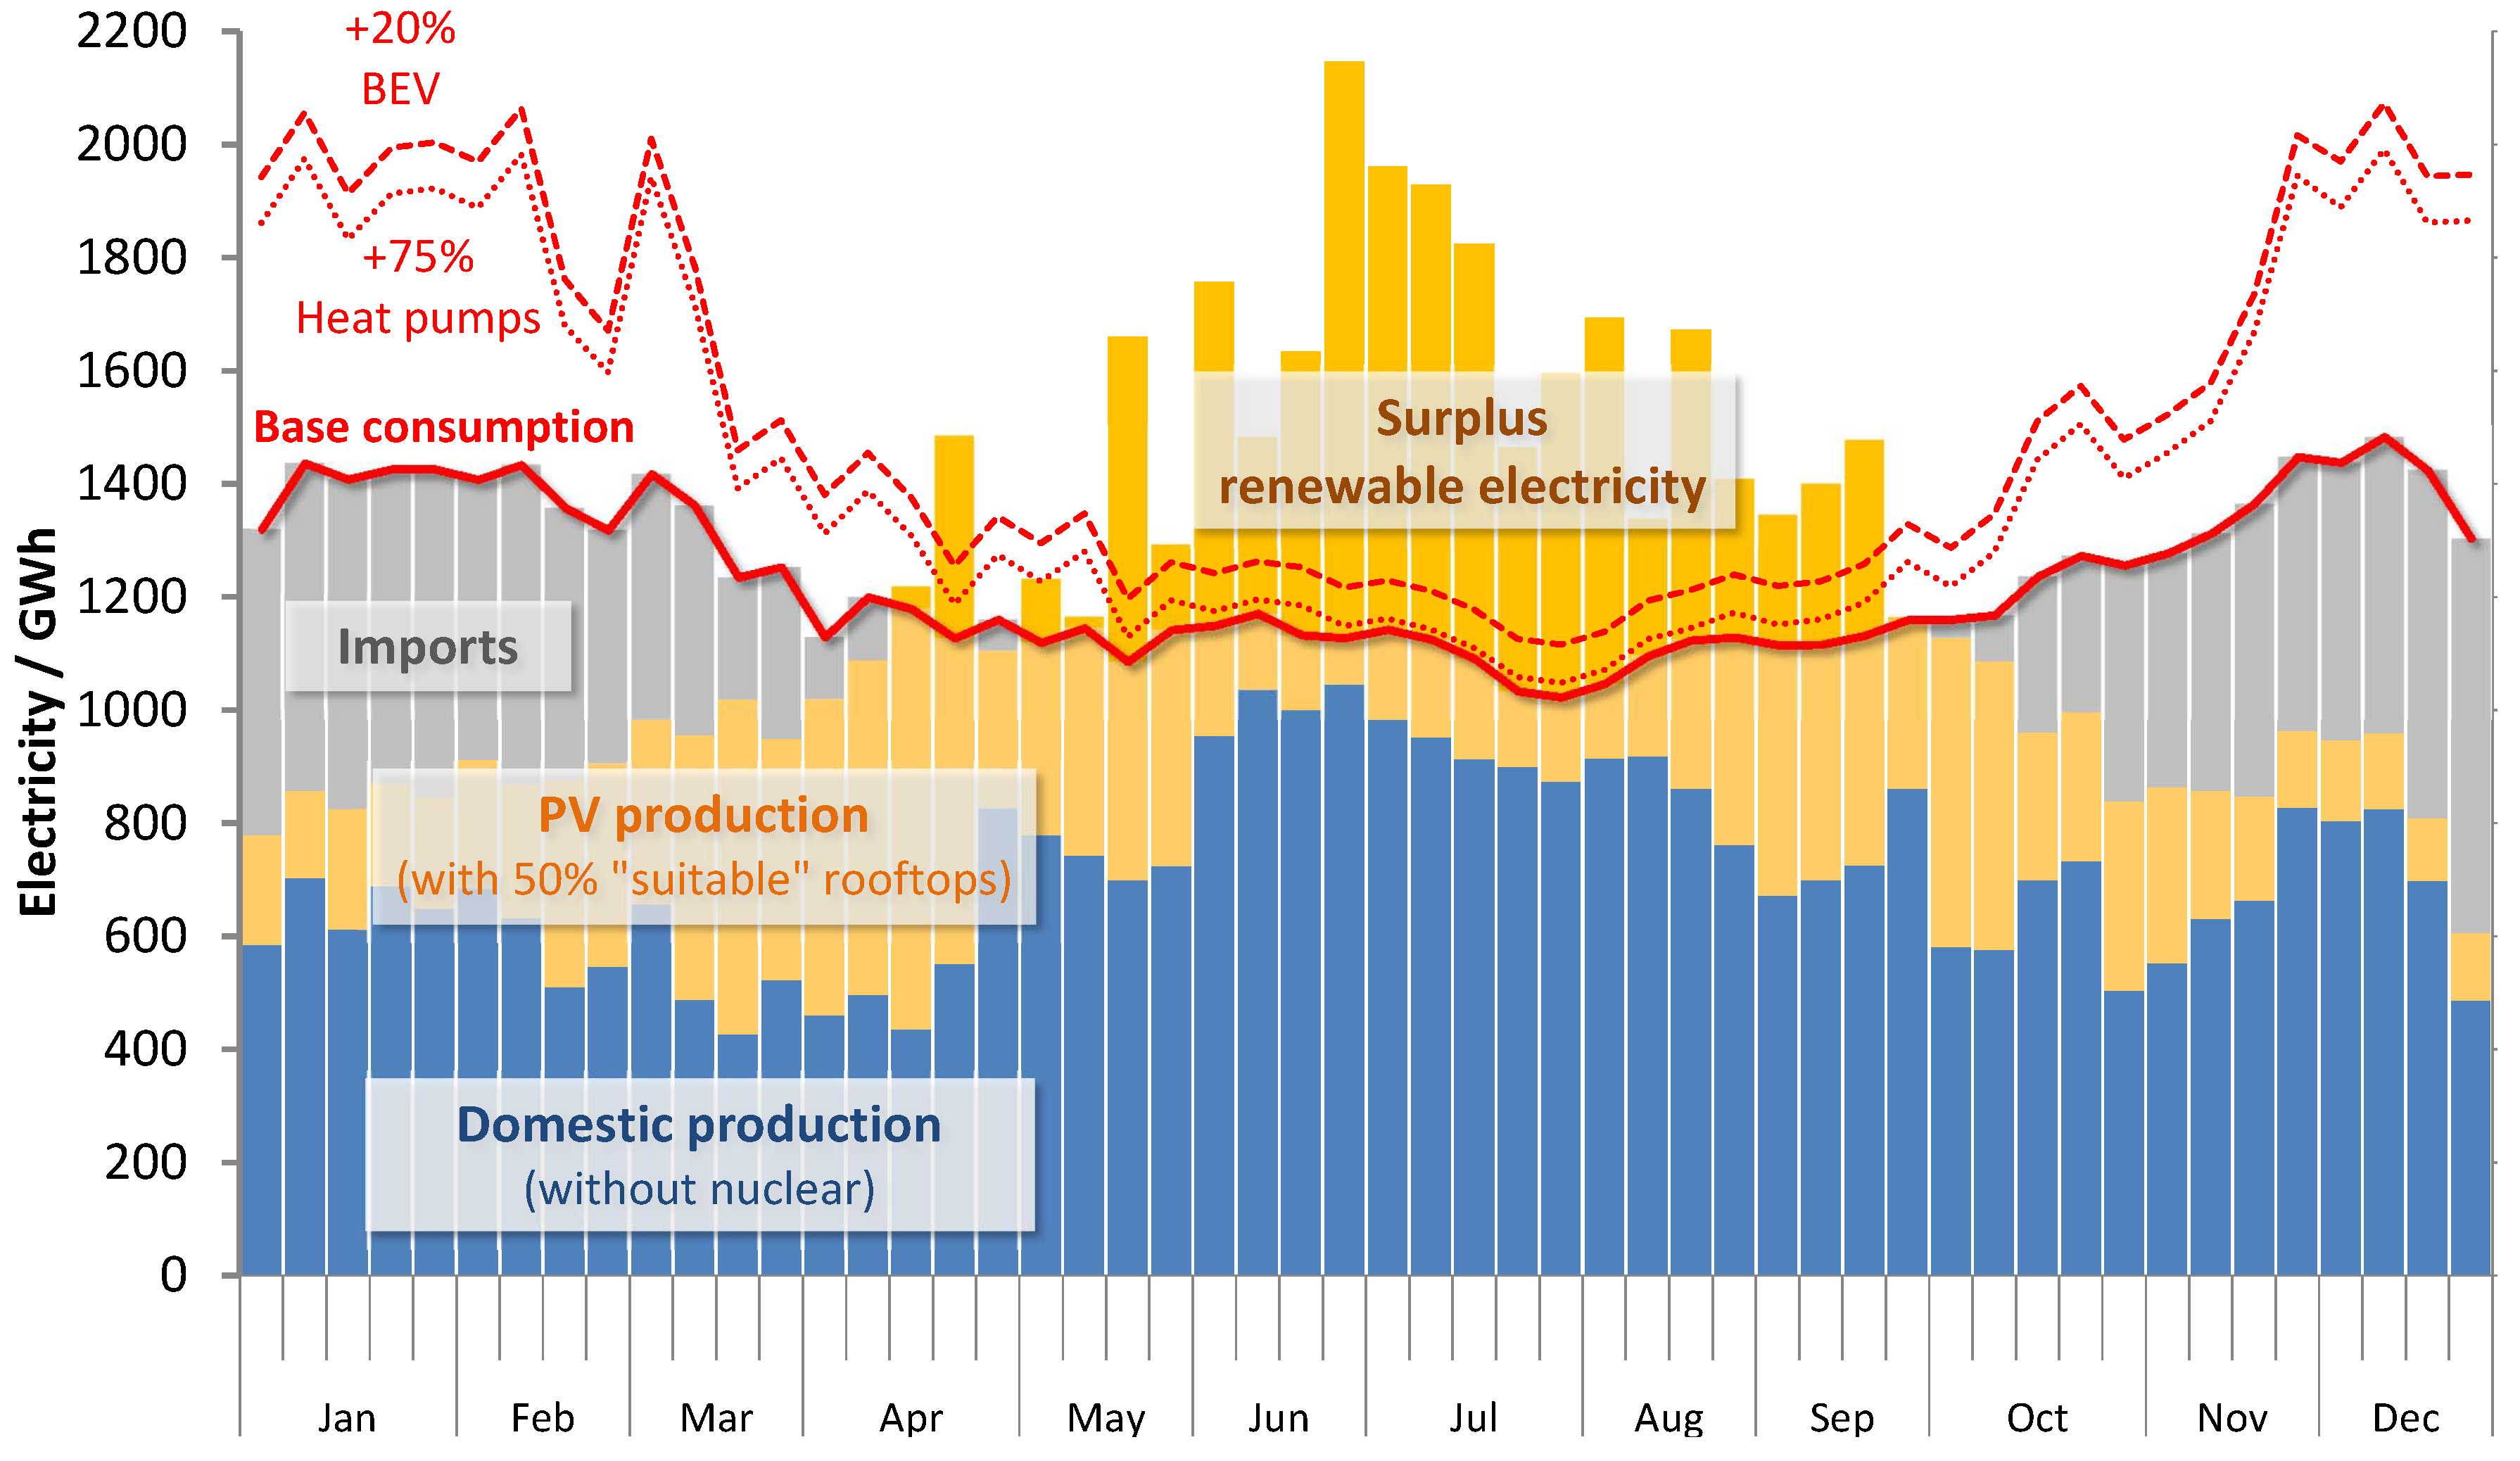
A weekly aggregation of the Swiss electricity consumption (with and without heat pumps and BEV) and production (with PV and without NPP) is displayed in Figure 23. Mathematically, this weekly aggregation is nothing more than a highly efficient weekly storage, where hourly deficits and surpluses are compensated within one week at an (unrealistic) round-trip-efficiency of 100% and unlimited storage capacities. Without heat pumps and BEV (“PV-NPP”) total deficits and surpluses are 11.7 TWh and 9.6 TWh, respectively. With an electrification (“PV-NPP-HP-BEV”), total deficits rise to 24.1 TWh, while surpluses slightly decrease to 7.5 TWh. Compared to the annual deficits and surpluses in Figure 20 of 28.5 TWh and 12.6 TWh for “PV-NPP-HP-BEV” and 16.9 TWh and 14.7 TWh for “PV-NPP”, respectively, the weekly aggregation results in a reduction of the deficits by −15% and the surpluses by −40% for “PV-NPP-HP-BEV” and a reduction of the deficits by −31% and the surpluses by −35% for “PV-NPP”. In particular, the reduction of the surpluses by this weekly aggregation is substantial. The remaining deficits and surpluses (e.g., 24.1 TWh and 7.5 TWh) are net deficits and net surpluses, which cannot be compensated by weekly storage and hence must be imported, exported, curtailed or stored by means of long-term (seasonal) storage such as power-to-gas [73,74].

3.3.3. Summary

In summary, the following statements about deficits and surpluses can be made: In an electrified and denuclearized Swiss energy system (“PV-NPP-HP-BEV”)—without enhanced storage—there are annual deficits and surpluses of 28.5 TWh and 12.6 TWh, respectively. If hydro power would not be adjusted (“smoothed”) according to Section 2.4, deficits and surpluses would even rise to 30.3 TWh and 14.4 TWh (not shown), respectively. By means of short-term (weekly) storage with PHS and stationary batteries, these numbers can be reduced to 24.1 TWh and 7.5 TWh, respectively. With (highly efficient) seasonal-storage, surpluses could be eliminated completely, while deficits would remain at 15.9 TWh, which is the absolute difference of the annual electricity consumption and production in “PV-NPP-HP-BEV” (see Section 3.2). In order to further reduce deficits (in winter)—at a given heat and mobility demand—also thermal storage, sector coupling (e.g., power-to-gas) and demand/supply side management, etc., have to be considered. Thermal storage could for instance be to seasonally store excess heat and electricity in summer (e.g., in the soil) and retrieving it in winter (e.g., by means of ground-source heat pumps) to cover at least some of the heat demand in winter. All of these storage options and strategies shall be assessed in a subsequent study.

3.4. CO2 Mitigation

3.4.1. Hourly CO2 Intensities

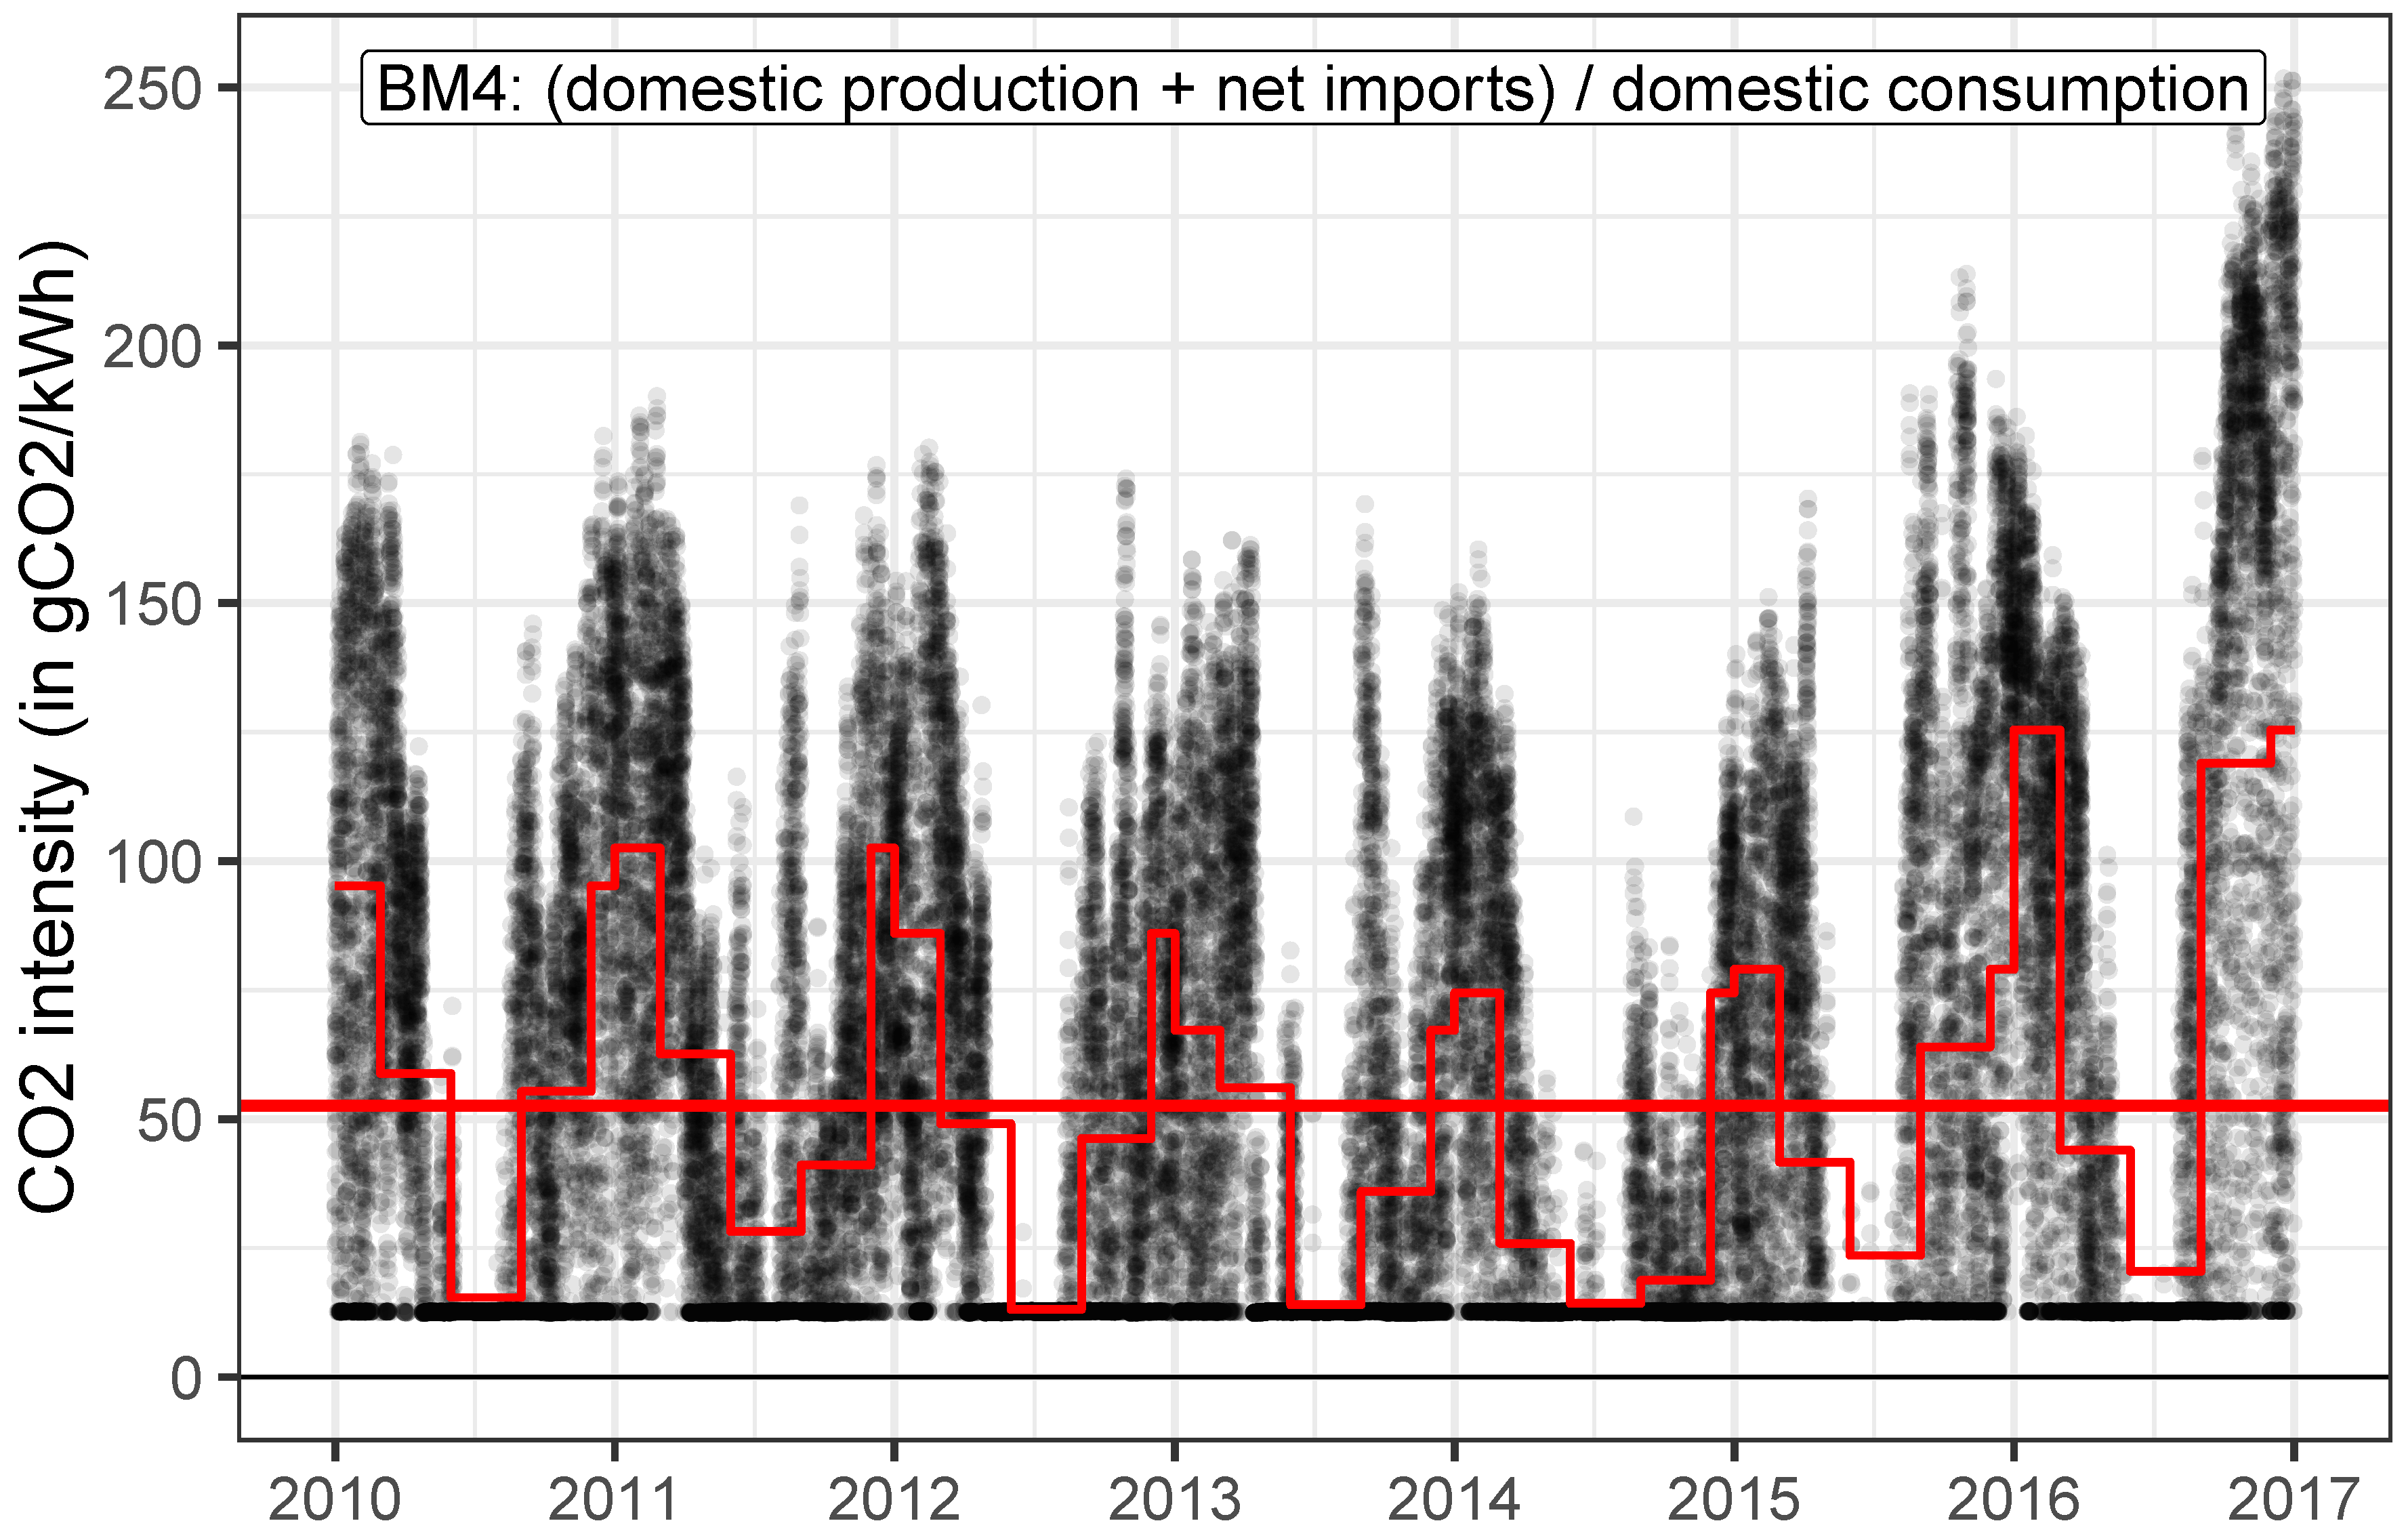
Figure 24 displays the CO2 intensities of the Swiss electricity mix calculated for every hour as well as the seasonal and overall average of the years 2010 through 2016 according to balancing method “BM4” (see Section 2.5.2).
Particularly high CO2 intensities are observed in autumn and winter of 2016, when large amounts of electricity had to be imported due to unexpected outages of two Swiss NPP [53]. The reference year 2010, in comparison, can be regarded as “average” in terms of CO2 intensity.
The average CO2 intensity over the years 2010 to 2016 is 53 g C O 2 , e q /kWh. This value is in agreement with the 50 g C O 2 , e q /kWh obtained with the same balancing method (“BM4”) in TEP [66], yet substantially lower than the 149 g C O 2 , e q /kWh and 197 g C O 2 , e q /kWh reported in Messmer and Frischknecht [62] and Romano et al. [75], respectively. However, these studies employed different balancing methods: Messmer and Frischknecht [62] used a balancing method, which also accounts for transit electricity, while Romano et al. [75] dynamically accounted for the marginal effect of one additional unit of electricity on the CO2 intensity based on marginal production costs (merit order) of all available electricity production technologies in Switzerland and abroad. This way, Romano et al. [75] obtained hourly CO2 peak intensities of up to 1300 g C O 2 , e q /kWh. This marginal approach for CO2 intensities may also be incorporated and investigated in a subsequent study.
In Figure 25, the hourly CO2 intensities of the used electricity in the “Status quo” (left) and the scenarios “PV-NPP” and “PV-NPP-HP-BEV” (center and right) are plotted. Additionally, the demand-weighted averages for all seasons and the full year are plotted.
The average CO2 intensity in “PV-NPP” and “PV-NPP-HP-BEV” is 143 and 184 g C O 2 , e q /kWh, respectively. This is substantially larger than in “Status quo” with 56 g C O 2 , e q /kWh for 2010. For the seasonal averages, the highest CO2 intensities are observed in winter with averages of 196 g C O 2 , e q /kWh and 258 g C O 2 , e q /kWh, respectively. Maximum hourly values, which also occur in winter, reach maxima of about 175 g C O 2 , e q /kWh in “Status quo” and above 350 g C O 2 , e q /kWh in “PV-NPP” and “PV-NPP-HP-BEV”.
In particular winter and summer months in the scenarios “PV-NPP” and “PV-NPP-HP-BEV” feature a 2.5–3.5 times larger CO2 intensity of the used electricity than “Status quo”. In winter, this is mainly due to the fact that electricity deficits have to be covered by either electricity imports or additional Swiss CCGT plants, which substantially increase the hourly CO2 intensity. In summer, it is the large share of PV electricity that increases the hourly CO2 intensity, as the CO2 intensity of PV, in this study, is 50 g C O 2 , e q /kWh (currently even 92 g C O 2 , e q /kWh, see Section 2.5.2) and therefore substantially higher than the reported 12 g C O 2 , e q /kWh of NPP. However, in the future (2030 to 2050) CO2 intensities of PV in the range of 15–25 g C O 2 , e q /kWh are reported in Frischknecht et al. [65]. Contrarily, the CO2 intensity of PV would even increase, if a certain amount of the PV production must be curtailed, as CO2 emissions of PV almost exclusively occur at the production, installation and disposal of the modules. Thus, every kWh that is not produced (i.e., curtailed), would increase the CO2 intensity of a PV module over its (constant) lifetime of about 30–40 years [65]. This production-dependent CO2 intensity of PV shall be incorporated and investigated in a subsequent study.
As the CO2 intensity of the employed electricity is of paramount importance to the effective global warming mitigation potential of electricity-based technologies and as the CO2 intensities of individual parameters such as PV and imports are subject to a large degree of uncertainty, the sensitivity plot of the average CO2 intensity is shown in Figure 26 for the scenario “PV-NPP-HP-BEV”. The CO2 intensity of the imported electricity (“CO2 int. imp.”) is by far the most influential parameter. If a 30% lower, i.e., more “renewable” CO2 intensity of imports (i.e., with a larger share of wind and PV) is assumed, the average CO2 intensity drops to values of about 130 g C O 2 , e q /kWh, which is substantially less than the default value of 184 g C O 2 , e q /kWh at an assumed CO2 intensity for imports of 443 g C O 2 , e q /kWh, which is in fact the CO2 intensity of CCGT and presumably the “best” fossil case (see Section 2.5.2). On the other hand, if “CO2 int. imp.” is assumed to be 30% higher at 576 g C O 2 , e q /kWh, which corresponds about to the EU mix, the average CO2 intensity of the used electricity would rise to about 240 g C O 2 , e q /kWh. Other parameters do not have such a strong influence on the average CO2 intensity. For example, the influence of the CO2 intensity of PV (“CO2 int. PV”) is only about ±10 g C O 2 , e q /kWh.

3.4.2. CO2 Savings

With the current fossil energy demand for heating (SH and DHW) of 70.8 TWh and for mobility of 60 TWh as well as the electricity demand and production of 2010 (“Status quo”), annual CO2 emissions of 41.1 Mt are calculated with the specific CO2 intensities from Section 2.5. The contribution of each energy sector to the overall 41.1 Mt CO2 emissions in the “Status quo” can be found in the leftmost bar in Figure 27.
By reducing the SH demand of “Status quo” by −42%, as stated in “BAU” of ES2050, the annual CO2 emissions could be reduced by −7.6 Mt from 41.1 Mt to 33.5 Mt CO2 (see bar of “SQ + Retrofit” in Figure 27). By replacing NPP with PV, an additional 5.7 Mt of CO2 are emitted annually for a total of 39.2 Mt CO2 (see bar of “PV-NPP” in Figure 27).
Finally, with the electrification of the heat and mobility sector, the annual CO2 emissions are reduced to 31.3 Mt (see rightmost bar in Figure 27). Thus, by choosing scenario “SQ + Retrofit” as the reference (“Reference 1” in Figure 27), −2.2 Mt of CO2 are saved, which is only −7%. If, however, the denuclearised scenario “PV-NPP” is the reference scenario (“Reference 2” in Figure 27)—due to safety issues and as stated in ES2050—then the effective CO2 mitigation potential of the electrification amounts to −7.7 Mt CO2 per year, which is −20%.
The absolute CO2 emissions stated in this section can only roughly be compared to the unconditional reduction target of Switzerland of 50% below the level of 1990 by 2030 (i.e., 26.6 Mt CO2, excl. LULUCF [76]) as pledged in the 2017 ratified Paris Agreement. This is due to the fact that those 26.6 Mt CO2 also include emission reductions abroad (carbon credits) and are based on other assumptions on CO2 intensities of imported electricity, etc.
The corresponding sensitivity plot for scenario “PV-NPP-HP-BEV” is displayed in Figure 28. Again the most influential parameter is the CO2 intensity of the imported electricity (“CO2 int. imp.”). At a 30% lower CO2 intensity of imports at 310 g C O 2 , e q /kWh, CO2 emissions would reach about 27.5 Mt CO2 per year, which is a CO2 reduction of −18% compared to “SQ + Retrofit”. In turn, if CO2 intensities are taken 30% higher at 576 g C O 2 , e q /kWh (current EU mix), CO2 emissions would total at about 35 Mt per year, which is even higher than in the reference “SQ + Retrofit”.

3.4.3. General Discussion

Figure 27 shows that by means of retrofitting and a large electrification of SH and DHW, CO2 emissions in the buildings sector can be substantially reduced from 18.1 Mt to 10.5 Mt and 5.6 Mt CO2, respectively. This is an overall percentage reduction of −69%. It can furthermore be seen that retrofitting itself is at least as effective for CO2 mitigation as the consequent electrification. Retrofitting is, moreover, a prerequisite for an effective electrification because heat pumps can be operated more efficiently at lower forward flow temperatures, etc.
On the other hand, in the mobility sector in Figure 27, CO2 emissions are only reduced from 17 Mt to 14.3 Mt (−16%) by means of a 20% electrification. A larger electrification would of course increase this reduction potential, however, a substitution of ICE by BEV is currently only suitable for (small) vehicles taking mostly shorter trips [47,48]. A higher substitution of ICE by BEV e.g., for other (larger) vehicle types and/or long-distance transportation is currently rather unlikely. A further CO2 reduction in the mobility sector can, therefore, only be achieved by also reducing CO2 emissions of ICE vehicles. This can, for instance, be achieved by also “retrofitting” ICE vehicles, that is, by increasing their efficiency (e.g., making them more light-weight), introducing less CO2 intensive fuels (e.g., (renewable) natural gas) or by an increased hybridization. Incidentally, such CO2 mitigation measures on the fossil fuels side also hold for buildings, where CO2 emissions could further be reduced by e.g., substituting oil-based heating systems with (renewable) natural gas-based ones (e.g., in non-retrofitable buildings, etc.).
A comparison between scenarios “PV-NPP” and “PV-NPP-HP-BEV” in Figure 27 shows that owing to the electrification, CO2 emissions also increase from 9.2 Mt to 11.3 Mt CO2 in the base electricity demand (“Elec. Base”). This has to do with the fact that by increasing the electricity demand, marginal effects start to happen when an additional unit of electricity is demanded by heat pumps and BEV. This additional demand may induce a supply deficit that would otherwise not occur and which must therefore be offset by importing an extra unit of CO2 intensive electricity. As the share of imported electricity is the most sensitive parameter with respect to the overall CO2 intensity of the used electricity (see Section 3.4.1), every unit of imported electricity disproportionately increases the overall CO2 emissions of all electricity consumers. By means of a marginal effects consideration [75], these additional CO2 emissions in “Elec. Base” could be attributed proportionally to the actual causers (heat pumps and BEV). However, this is currently out of the scope of this study.
If an additional electrification leads to a disproportionate increase of imports in the overall used electricity, it is generally more sensible—with regard to CO2 mitigation—to take measures on the fossil fuels side, e.g., by substituting a diesel vehicle with a natural gas vehicle instead of a BEV. Therefore, in order to achieve a maximum of CO2 migitation, decarbonisation of the whole energy system should be investigated with respect to an integral and smart combination (and competition) of all energy sources and technologies. This way, synergetic effects may result in a more effective and economically sound decarbonisation than a sole electrification of the energy system. This has already been discussed by Sarsfield-Hall and Unger [77], who compared a balanced “Zero Carbon Gas” pathway, where hydrogen, synthetic and biomethane as well as carbon capture and storage (CCS) compete with renewables, biomass and nuclear in all sectors (buildings, transportation, industry) to an “All-Electric” pathway, where gas infrastructure and gas technologies are excluded.
Furthermore, in order to properly understand the actual factors that drive CO2 mitigation, not only technology-related aspects such as the CO2 intensity, but also socio-economic aspects should be considered. This can for instance be achieved by evaluating an energy system according to the Kaya identity [78]
C = C E · E G D P · G D P c a p · c a p
which decomposes CO2 emissions (C) into a product of four socio-techno-economic factors: human population ( c a p ), GDP per capita ( G D P / c a p ), energy intensity per unit of GDP ( E / G D P ), and carbon intensity as emissions per unit of energy consumed ( C / E ). If any of these factors is decreased, a CO2 mitigation will take place. However, oftentimes a reduction of one factor is accompanied by an increase of another factor. For example, a reduction of the energy demand per capita may be offset by a general growth of the population, GDP, etc., Especially costs and constraints of adapting infrastructure to a modified electricity system and retrofitting buildings as well as costs of disinvestment of other energy carriers may amount to a crucial factor and must not be ignored. Therefore, the choice of which parameters to reduce in an international CO2 emission reduction strategy becomes a highly complex and controversial challenge [79].

3.5. Imports from Neighbouring Countries

A central assumption in ES2050 as well as in this study is that Swiss electricity deficits can be compensated by importing electricity from abroad—or by building new CCGT power plants [80]. In this section, it is roughly assessed how a similar penetration of electricity-based technologies would affect Germany and France, which are currently the neighbouring countries, from which Switzerland primarily imports electricity [53].
It is assumed that Germany and France also substitute 20% and 75% of their fossil mobility and heat demand, respectively, with equally efficient electricity-based technologies, that is, an efficiency factor of 3.2 for BEV and of 3.3 for heat pumps (see Section 3.1.1).
Based on 2015 IEA data [81], the fossil energy demand in Germany and France for mobility was 606 TWh and 465 TWh, which after a 20% substitution results in an additional electricity demand of 38 TWh e l and 29 TWh e l , respectively. In the residential and services sector, Germany and France had a fossil energy demand of 578 TWh and 339 TWh, respectively. It is assumed that about 80% of this fossil energy demand is heat demand for SH and DHW, such as roughly in Switzerland [34]. By retrofitting also −42% of the heat demand, the remaining heat demand amounts to about 268 TWh t h and 157 TWh t h , respectively. After a 75% substitution by heat pumps an additional electricity demand of 61 TWh e l and 36 TWh e l is required, respectively. Notwithstanding any additional electricity demand in the industrial sector, a total additional electricity demand of 99 TWh e l and 65 TWh e l results for Germany and France, respectively. Regarding their 2015 renewable electricity production of 203 TWh e l and 98 TWh e l , this yields an additional renewable electricity demand of 49% and 66%, respectively.
If the same calculations are conducted for Switzerland with 2015 IEA data [81], Switzerland used 39.5 TWh e l (2015) of renewable electricity. With the additional electricity demand of heat pumps and BEV of 13.7 TWh e l (2010), which may also roughly apply for 2015, an additional renewable electricity demand of 35% would arise. Consequently, decarbonization challenges, as stipulated by the Paris Agreement, are even greater in Germany and France compared to Switzerland. Therefore, it is open to debate whether and how much (renewable) electricity Switzerland will be able to import from these countries. In other words, the decarbonisation of the Swiss energy systems will rely more and more on the schedule of the European energy system decarbonisation. Moreover, as there are oftentimes similar weather conditions across wide parts of (Western) Europe, the demand for exports and imports of renewable electricity will also coincide temporarily. In this respect, the role of long-term storage (e.g., power-to gas, etc.) or long-distance transportation of energy in liquified forms (e.g., LNG) will become even more important.

4. Conclusions

This study investigates a large electrification of the Swiss heat and mobility and shows the implications of this, taking into account the already decided phasing out of nuclear power and a large penetration of PV, by means of a dynamic and data-driven scenario analysis.
With an estimated substitution of fossil energy in the mobility and heating sector by 20% BEV and 75% heat pumps, there is an additional electricity demand of 13.7 TWh, of which 10 TWh and 3.7 TWh are for heat pumps and BEV, respectively. This is an increase of the current electricity (end-use) demand by 23%. Moreover, most of this additional demand is in winter, when domestic electricity production is lowest and more CO2 intensive electricity imports or new Swiss CCGT power plants are needed.
In terms of maximum power demand, an additional 5.9 GWh/h (hourly average power) is required. This is also a major challenge for the electricity system as capacities and flexibilities in the Swiss electricity production are limited and de facto only available from (pumped-hydro) storage power plants.
In a highly electrified Swiss energy system with a large share of PV and no base-load nuclear power, there are large amounts of electricity deficits (mostly in winter and at night) and surpluses (mostly in summer and at noon), which can only partially be offset by short-term (e.g., batteries, pumped-hydro storage) and long-term (e.g., power-to-gas) storage.
Depending on the reference scenario (with or without nuclear power) and assumption on the key parameters (e.g., extend of building retrofit, CO2 intensity of imports, heat pump and BEV penetration, etc.), CO2 savings of an electrified energy system vary and may even be offset by an increase of CO2 intensive imports in winter. Therefore, the most crucial parameter for a successful electrification of the energy system in terms of CO2 mitigation is a low CO2 intensity of electricity imports in winter. Moreover, for an effective CO2 mitigation, energy systems should be regarded integrally with focus and mitigation steps on all energy sources (also fossil ones) and technologies.
As neighbouring countries such as Germany and France are faced with similar challenges to decarbonize their energy system, renewable electricity imports from these countries are more challenging (and costly) to obtain. Therefore, a Swiss energy strategy and decarbonisation, which heavily relies on (renewable) electricity imports is economically and technically more and more dependent on the schedule of the European energy system decarbonisation.
Results show that an electrification cannot be the sole solution of an energy transition to less CO2. Nonetheless, the electrification of heat and mobility will play an important role in the future energy system, not least for reasons other than CO2 reduction (e.g., local air pollution and noise mitigation, etc.). It seems important that the expansion of renewable sources, be it electricity or other sources of energy, is matched to the additional consumption of the respective energy sources in a timely and quantitative manner.
With respect to further studies, in particular the following investigations should be conducted:
  • Production side:
    (a)
    Investigations on the effective potentials to manage hydro and pumped-hydro storage in the various scenarios and along with other storage technologies (e.g., batteries, etc.)
    (b)
    Investigations on the impacts of varying nuclear phase-out scenarios (in time and intensity) on CO2 mitigation and electricity supply
  • Demand side:
    (a)
    Investigations on tangible building flexibility options such as local and district heat storage, storage options on both sides of heat pumps (electricity or heat), etc.
    (b)
    Investigations on tangible demand side control strategies for mobility (e.g., recharging scheduling, vehicle-to-grid, etc.)
Last but not least, also costs associated with all options in this and further studies are a crucial factor to investigate. Therefore, a cost estimation of different approaches for CO2 mitigation, for example with respect to infrastructure adaption, etc., should also be conducted.

Author Contributions

M.R., S.L.T. and U.E. conceptualized the ideas of this study, developed the methodology and validated the results; M.R. did the programming, visualisation, formal analysis, and wrote the original draft; S.L.T. and U.E. supervised the study, reviewed the original draft, and did the project administration.

Funding

This research received no external funding.

Acknowledgments

The authors kindly acknowledge the Swiss Federal Laboratories for Materials Science and Technology (Empa) for its financial support, Kurt Hostettler (REFUNA) for providing district heating feed-in data, Didier Beloin-Saint-Pierre (Empa) for providing LCA values of CO2 intensities according to ecoinvent (v3.4), Portia Murray (Empa) for providing data of the retrofitting model CESAR as well as Peter Richner (Empa) and Kristina Orehounig (Empa) for reviewing the original draft.

Conflicts of Interest

The authors declare no conflict of interest.

References

  1. United Nations. Adoption of the Paris Agreement. Framework Convention on Climate Change; Technical Report; United Nations: Paris, France, 2015. [Google Scholar]
  2. Prognos. Die Energieperspektiven für die Schweiz bis 2050. Energienachgefrage und Elektrizitätsangebot in der Schweiz 2000–2050; Technical Report; Prognos AG: Basel, Switzerland, 2012. [Google Scholar]
  3. Sugiyama, M. Climate change mitigation and electrification. Energy Policy 2012, 44, 464–468. [Google Scholar] [CrossRef]
  4. Williams, J.H.; DeBenedictis, A.; Ghanadan, R.; Mahone, A.; Moore, J.; Morrow, W.R.; Price, S.; Torn, M.S. The technology path to deep greenhouse gas emissions cuts by 2050: The pivotal role of electricity. Science 2012, 335, 53–59. [Google Scholar] [CrossRef] [PubMed]
  5. Steinberg, D.; Bielen, D.; Eichman, J.; Eurek, K.; Logan, J.; Mai, T.; McMillan, C.; Parker, A.; Vimmerstedt, L.; Wilson, E. Electrification & Decarbonization: Exploring U.S. Energy Use and Greenhouse Gas Emissions in Scenarios with Widespread Electrification and Power Sector Decarbonization; Technical Report; National Renewable Energy Laboratory (NREL): Golden, CO, USA, 2017.
  6. Ruhnau, O.; Bannik, S.; Otten, S.; Praktiknjo, A.; Robinius, M. Direct or indirect electrification? A review of heat generation and road transport decarbonisation scenarios for Germany 2050. Energy 2019, 166, 989–999. [Google Scholar] [CrossRef]
  7. BFS. Treibhausgasemissionen in der Schweiz. Entwicklung in CO2-Äquivalente und Emissionen nach Sektoren; Technical Report; BFS: Neuchâtel, Switzerland, 2018. [Google Scholar]
  8. Tarroja, B.; Chiang, F.; AghaKouchak, A.; Samuelsen, S.; Raghavan, S.V.; Wei, M.; Sun, K.; Hong, T. Translating climate change and heating system electrification impacts on building energy use to future greenhouse gas emissions and electric grid capacity requirements in California. Appl. Energy 2018, 225, 522–534. [Google Scholar] [CrossRef] [Green Version]
  9. Love, J.; Smith, A.Z.; Watson, S.; Oikonomou, E.; Summerfield, A.; Gleeson, C.; Biddulph, P.; Chiu, L.F.; Wingfield, J.; Martin, C.; et al. The addition of heat pump electricity load profiles to GB electricity demand: Evidence from a heat pump field trial. Appl. Energy 2017, 204, 332–342. [Google Scholar] [CrossRef]
  10. McCollum, D.; Krey, V.; Kolp, P.; Nagai, Y.; Riahi, K. Transport electrification: A key element for energy system transformation and climate stabilization. Clim. Chang. 2014, 123, 651–664. [Google Scholar] [CrossRef]
  11. Singh, B.; Ellingsen, L.A.W.; Strømman, A.H. Pathways for GHG emission reduction in Norwegian road transport sector: Perspective on consumption of passenger car transport and electricity mix. Transp. Res. Part D Transp. Environ. 2015, 41, 160–164. [Google Scholar] [CrossRef]
  12. Moro, A.; Lonza, L. Electricity carbon intensity in European Member States: Impacts on GHG emissions of electric vehicles. Transp. Res. Part D Transp. Environ. 2018, 64, 5–14. [Google Scholar] [CrossRef]
  13. Guminski, A.; Böing, F.; Murmann, A.; Von Roon, S. System effects of high demand-side electrification rates: A scenario analysis for Germany in 2030. Wiley Interdiscip. Rev. Energy Environ. 2018. [Google Scholar] [CrossRef]
  14. Densing, M.; Hirschberg, S.; Turton, H. Review of Swiss Electricity Scenarios 2050; Technical Report; Paul Scherrer Institute (PSI): Villigen, Switzerland, 2014. [Google Scholar]
  15. Bauer, C.; Bäuerle, Y.; Biollaz, S.; Calbry-Muzyka, A.; Cox, B.; Heck, T.; Hirschberg, S.; Lehnert, M.; Meier, A.; Prasser, H.M.; et al. Potentials, Costs and Environmental Assessment of Electricity Generation Technologies; Technical Report; Paul Scherrer Institute (PSI): Villigen, Switzerland, 2017. [Google Scholar]
  16. Díaz Redondo, P.; van Vliet, O. Modelling the Energy Future of Switzerland after the Phase Out of Nuclear Power Plants. Energy Procedia 2015, 76, 49–58. [Google Scholar] [CrossRef] [Green Version]
  17. Bartlett, S.; Dujardin, J.; Kahl, A.; Kruyt, B.; Manso, P.; Lehning, M. Charting the course: A possible route to a fully renewable Swiss power system. Energy 2018, 163, 942–955. [Google Scholar] [CrossRef]
  18. Sousa, T.; Soares, T.; Pinson, P.; Moret, F.; Baroche, T.; Sorin, E. Peer-to-peer and community-based markets: A comprehensive review. Renew. Sustain. Energy Rev. 2019, 104, 367–378. [Google Scholar] [CrossRef] [Green Version]
  19. Barmettler, F.; Beglinger, N.; Zeyer, C. Cleantech Energiestrategie—Richtig rechnen und wirtschaftlich profitieren, auf CO2-Zielkurs; Technical Report; Foundation for Global Sustainability: Bern, Switzerland, 2013. [Google Scholar]
  20. Andersson, G.; Boulouchos, K.; Bretschger, L. Energiezukunft Schweiz; Technical Report; ETH Zürich: Zürich, Switzerland, 2011. [Google Scholar]
  21. Greenpeace. Energieszenario Schweiz 2013—Energy [r]evolution—Eine nachhaltige Energieversorgung für die Schweiz; Technical Report; Greenpeace International: Zürich, Switzerland, 2013. [Google Scholar]
  22. Gunzinger, A. Kraftwerk Schweiz—Plädoyer für eine Energiewende mit Zukunft; Zytglogge: Zürich, Switzerland, 2015. [Google Scholar]
  23. Berntsen, P.B.; Trutnevyte, E. Ensuring diversity of national energy scenarios: Bottom-up energy system model with Modeling to Generate Alternatives. Energy 2017, 126, 886–898. [Google Scholar] [CrossRef] [Green Version]
  24. Schlecht, I.; Weigt, H. SwissMod—A Model of the Swiss Electricity Market; Technical Report; University of Basel: Basel, Switzerland, 2013. [Google Scholar]
  25. Codina Gironès, V.; Moret, S.; Maréchal, F.; Favrat, D. Strategic energy planning for large-scale energy systems: A modelling framework to aid decision-making. Energy 2015, 90, 173–186. [Google Scholar] [CrossRef]
  26. Moret, S. Strategic Energy Planning under Uncertainty Stefano MORET. Ph.D. Thesis, EPFL, Lausanne, Switzerland, 2017. [Google Scholar]
  27. Kannan, R.; Turton, H. Switzerland Energy Transistion Scenarios-Devlopment and Application of Swiss TIMES Energy System Model (STEM); Technical Report; Paul Scherrer Institut (PSI): Villigen, Switzerland, 2014. [Google Scholar]
  28. Pfenninger, S. Dealing with multiple decades of hourly wind and PV time series in energy models: A comparison of methods to reduce time resolution and the planning implications of inter-annual variability. Appl. Energy 2017, 197, 1–13. [Google Scholar] [CrossRef]
  29. Trutnevyte, E. EXPANSE methodology for evaluating the economic potential of renewable energy from an energy mix perspective. Appl. Energy 2013, 111, 593–601. [Google Scholar] [CrossRef]
  30. Kannan, R.; Hirschberg, S. Interplay between electricity and transport sectors—Integrating the Swiss car fleet and electricity system. Transp. Res. Part A Policy Pract. 2016, 94, 514–531. [Google Scholar] [CrossRef]
  31. Jacobson, M.Z.; Delucchi, M.A.; Bauer, Z.A.; Goodman, S.C.; Chapman, W.E.; Cameron, M.A.; Bozonnat, C.; Chobadi, L.; Clonts, H.A.; Enevoldsen, P.; et al. 100% Clean and Renewable Wind, Water, and Sunlight All-Sector Energy Roadmaps for 139 Countries of the World. Joule 2017, 1, 108–121. [Google Scholar] [CrossRef] [Green Version]
  32. Swissgrid. Aggregated Energy Data of the Control Block Switzerland, 2019. Available online: https://www.swissgrid.ch/en/home/customers/topics/energy-data-ch.html (accessed on 18 June 2019).
  33. Begert, M.; Frei, C. Long-term area-mean temperature series for Switzerland—Combining homogenized station data and high resolution grid data. Int. J. Climatol. 2018, 38, 2792–2807. [Google Scholar] [CrossRef]
  34. Prognos. Analyse des Schweizerischen Energieverbrauchs 2000–2017—Auswertung nach Verwendungszwecken; Technical Report; BFE: Bern, Switzerland, 2018. [Google Scholar]
  35. REFUNA. Geschäftsbericht 2010/2011; Technical Report; REFUNA: Döttingen, Switzerland, 2011. [Google Scholar]
  36. REFUNA. Technische Anschlussvorschrift (TAV); Technical Report; REFUNA: Döttingen, Switzerland, 2005. [Google Scholar]
  37. Prognos. Witterungsbereinigung auf Basis von Gradtagen und Solarstrahlung—Aufarbeitung und Dokumentation; Technical Report; Prognos AG: Basel, Switzerland, 2015. [Google Scholar]
  38. Gelaro, R.; McCarty, W.; Suárez, M.J.; Todling, R.; Molod, A.; Takacs, L.; Randles, C.A.; Darmenov, A.; Bosilovich, M.G.; Reichle, R.; et al. The Modern-Era Retrospective Analysis for Research and Applications, Version 2 (MERRA-2). J. Clim. 2017, 30, 5419–5454. [Google Scholar] [CrossRef]
  39. Christenson, M.; Manz, H.; Gyalistras, D. Climate warming impact on degree-days and building energy demand in Switzerland. Energy Convers. Manag. 2006, 47, 671–686. [Google Scholar] [CrossRef]
  40. SIA. SIA Standard 381/3: Heating Degree-Days In Switzerland; Technical Report; Swiss Association of Engineers and Architects (SIA): Zürich, Switzerland, 1982. [Google Scholar]
  41. Schneider, S.; Hollmuller, P.; Le Strat, P.; Khoury, J.; Patel, M.; Lachal, B. Spatial–Temporal Analysis of the Heat and Electricity Demand of the Swiss Building Stock. Front. Built Environ. 2017, 3, 1–17. [Google Scholar] [CrossRef]
  42. Wang, D.; Landolt, J.; Mavromatidis, G.; Orehounig, K.; Carmeliet, J. CESAR: A bottom-up building stock modelling tool for Switzerland to address sustainable energy transformation strategies. Energy Build. 2018, 169, 9–26. [Google Scholar] [CrossRef]
  43. Murray, P.; Niffeler, M.; Mavromatidis, G.; Orehounig, K. Optimal retrofitting measures for residential buildings at large scale: A multi-objective approach. In Proceedings of the International Building Simulation Conference, Rome, Italy, 2–4 September 2019. [Google Scholar]
  44. Effiziento. Performance Diagrams; Effiziento: Güglingen, Germany, 2019. [Google Scholar]
  45. Roost, M.; Ménard, M.; Lehmann, M.; Ott, W.; Sitzmann, B. WP-GAP: Performance Gap bei Mehrfamilienhäusern mit Wärmepumpe—Die Rolle der Betreiber; Technical Report; BFE: Bern, Switzerland, 2018. [Google Scholar]
  46. Maivel, M.; Kurnitski, J. Low temperature radiator heating distribution and emission efficiency in residential buildings. Energy Build. 2014, 69, 224–236. [Google Scholar] [CrossRef]
  47. Küng, L.; Bütler, T.; Georges, G.; Boulouchos, K. Decarbonizing passenger cars using different powertrain technologies: Optimal fleet composition under evolving electricity supply. Transp. Res. Part C Emerg. Technol. 2018, 95, 785–801. [Google Scholar] [CrossRef]
  48. Weber, C.; Figenbaum, E. Transition from ICEV to BEV: How do personal usage patterns change? In Proceedings of the EVS32 International Battery, Hybrid and Fuel Cell Electric Vehicle Symposium, Lyon, France, 19–22 May 2019. [Google Scholar]
  49. Hänggi, S.; Elbert, P.; Bütler, T.; Cabalzar, U.; Teske, S.L.; Bach, C.; Onder, C. A Review of Synthetic Fuels for Passenger Vehicles. Energy Rep. J. 2019, 5, 555–569. [Google Scholar] [CrossRef]
  50. Kohle, U.; Pfister, W.; Apfelbeck, R. Bioethanol Heater for the Passenger Compartments of Electric Cars; Technical Report 1; ATZ live: Wiesbaden, Germany, 2012; Volume 114. [Google Scholar]
  51. Robinson, A.; Blythe, P.; Bell, M.; Hübner, Y.; Hill, G. Analysis of electric vehicle driver recharging demand profiles and subsequent impacts on the carbon content of electric vehicle trips. Energy Policy 2013, 61, 337–348. [Google Scholar] [CrossRef] [Green Version]
  52. EBP. Elektromobilität—Studie Ladeinfrastruktur Region Basel; Technical Report; EBP, Sustainserv: Zürich, Switzerland, 2014. [Google Scholar]
  53. BFE. Schweizerische Elektrizitätsstatistik 2017; Technical Report; BFE: Bern, Switzerland, 2017. [Google Scholar]
  54. Portmann, M.; Galvagno-Erny, D.; Lorenz, P.; Schacher, D. Sonnendach.ch: Berechnung von Potenzialen in Gemeinden; Technical Report; BFE: Bern, Switzerland, 2016. [Google Scholar]
  55. Klauser, D. Solarpotentialanalyse für Sonnendach.ch. Schlussbericht; Technical Report; Meteotest: Bern, Switzerland, 2016. [Google Scholar]
  56. Plum, C.; Olschewski, R.; Jobin, M.; van Vliet, O. Public preferences for the Swiss electricity system after the nuclear phase-out: A choice experiment. Energy Policy 2019, 130, 181–196. [Google Scholar] [CrossRef]
  57. Thees, O.; Burg, V.; Erni, M.; Bowman, G.; Lemm, R. Biomassepotenziale der Schweiz für die energetische Nutzung, Ergebnisse des Schweizerischen Energiekompetenzzentrums SCCER BIOSWEET; Technical Report; WSL: Birmensdorf, Switzerland, 2017. [Google Scholar]
  58. Hostettler, T. Bericht zur Markterhebung Sonnenenergie 2017—Deutsche Fassung; Technical Report; Swisssolar: Zürich, Switzerland, 2018. [Google Scholar]
  59. Kaufmann, U. Schweizerische Statistik der Erneuerbaren Energien—Ausgabe 2017; Technical Report; BFE: Bern, Switzerland, 2018. [Google Scholar]
  60. Pfenninger, S.; Staffell, I. Long-term patterns of European PV output using 30 years of validated hourly reanalysis and satellite data. Energy 2016, 114, 1251–1265. [Google Scholar] [CrossRef] [Green Version]
  61. Wernet, G.; Bauer, C.; Steubing, B.; Reinhard, J.; Moreno-Ruiz, E.; Weidema, B. The ecoinvent database version 3 (part I): Overview and methodology. Int. J. Life Cycle Assess. 2016, 21, 1218–1230. [Google Scholar] [CrossRef]
  62. Messmer, A.; Frischknecht, R. Umweltbilanz Strommix Schweiz 2014; Technical Report; treeze Ltd.: Uster, Switzerland, 2016. [Google Scholar]
  63. KBOB. KBOB Ökobilanzdatenbestand v2.2:2016; Grundlage für die KBOB-Empfehlung 2009/1:2016: Ökobilanzdaten im Baubereich, Stand 2016; KBOB: Bern, Switzerland, 2016. [Google Scholar]
  64. Flury, K.; Frischknecht, R. Ökobilanz Erdgasauto; Technical Report; ESU-Services Ltd.: Uster, Switzerland, 2012. [Google Scholar]
  65. Frischknecht, R.; Itten, R.; Wyss, F.; Blanc, I.; Heath, G.; Raugei, M.; Sinha, P.; Wade, A. Subtask 2.0 “LCA”, IEA-PVPS Task 12; Technical Report; National Renewable Energy Laboratory (NREL): Golden, CO, USA, 2014.
  66. TEP. CO2-Intensität des Stromabsatzes an Schweizer Endkunden—Schlussbericht; Technical Report; TEP Energy GmbH: Zürich, Switzerland, 2009. [Google Scholar]
  67. Marshall, H.E. Sensitivity analysis. In Technology Management Handbook; CRC Press: Boca Raton, FL, USA, 1999; pp. 59–63. [Google Scholar]
  68. ElCom. Stromversorgungssicherheit der Schweiz 2018; Technical Report; ElCom: Bern, Switzerland, 2018. [Google Scholar]
  69. Dujardin, J.; Kahl, A.; Kruyt, B.; Bartlett, S.; Lehning, M. Interplay between photovoltaic, wind energy and storage hydropower in a fully renewable Switzerland. Energy 2017, 135, 513–525. [Google Scholar] [CrossRef]
  70. Beer, M. Abschätzung des Potenzials der Schweizer Speicherseen zur Lastdeckung bei Importrestriktionen. Zeitschrift für Energiewirtschaft 2018, 42, 1–12. [Google Scholar] [CrossRef]
  71. EKZ. NEC Installs Switzerland’s Largest Battery; EKZ: Zürich, Switzerland, 2019. [Google Scholar]
  72. Guttinger, M.; Ahcin, P. The potential of Demand Side Management and Vehicle-to-Grid for the city of Bern, Switzerland. In Proceedings of the 2011 10th International Conference on Environment and Electrical Engineering, Rome, Italy, 8–11 May 2011; pp. 1–5. [Google Scholar] [CrossRef]
  73. Teske, S.L.; Rüdisüli, M.; Bach, C.; Schildhauer, T.J. Potentialanalyse Power-to-Gas in der Schweiz; Technical Report; Empa: Dübendorf, Switzerland, 2019. [Google Scholar]
  74. Kober, T.; Bauer, C.; Bach, C.; Beuse, M.; Georges, G.; Held, M.; Heselhaus, S.; Korba, P.; Küng, L.; Malhotra, A.; et al. White Paper “Power-to-X: Perspectives in Switzerland”; Technical Report; Paul Scherrer Institut (PSI): Villigen, Switzerland, 2019. [Google Scholar]
  75. Romano, E.; Hollmuller, P.; Patel, M.K. Real-time carbon emission due to electricity consumption—A marginal approach for an open economy: The case of Switzerland. In Proceedings of the 3rd AIEE Energy Symposium—Current and Future Challenges to Energy Security, Milano, Italy, 10–12 December 2018; pp. 26–27. [Google Scholar]
  76. Climate Action Tracker. Country Assessments 2018. Available online: https://climateactiontracker.org/countries/switzerland (accessed on 18 June 2019).
  77. Sarsfield-Hall, R.; Unger, B. Fully Decarbonising Europe’s Energy System by 2050; Technical Report; Pöyry Point of View: London, UK, 2018. [Google Scholar]
  78. Kaya, Y. Impact of Carbon Dioxide Emission Control on GNP Growth: Interpretation of Proposed Scenarios. Paper presented at the IPCC Energy and Industry Subgroup, Response Strategies Working Group, Paris, France, 1990; Available online: https://www.ipcc.ch/report/emissions-scenarios/?idp=50 (accessed on 21 June 2019).
  79. Mavromatidis, G.; Orehounig, K.; Richner, P.; Carmeliet, J. A strategy for reducing CO2 emissions from buildings with the Kaya identity—A Swiss energy system analysis and a case study. Energy Policy 2016, 88, 343–354. [Google Scholar] [CrossRef]
  80. Díaz, P.; Vliet, O.V.; Patt, A.; Díaz, P.; Van Vliet, O.; Patt, A. Do We Need Gas as a Bridging Fuel? A Case Study of the Electricity System of Switzerland. Energies 2017, 10, 861. [Google Scholar] [CrossRef]
  81. IEA. World Energy Balances; Technical Report; International Energy Agency: Paris, France, 2016. [Google Scholar]
Figure 1. (Top): Measured hourly feed-in heat (red line) and derived hourly heat demand (blue line) in the district heating grid of REFUNA. (Bottom): Approximated cosine function of the time-varying losses in the REFUNA grid to derive the hourly heat demand (red line, left y-axis) and percentage heat losses (blue line, right y-axis).
Energies 12 02399 g001
Figure 2. Hourly median heat demand in the REFUNA grid for the period 9–15 July 2010, when daily minimum temperatures did not drop below 18 °C. This profile is taken as the hourly domestic hot water (DHW) demand.
Energies 12 02399 g002
Figure 3. Linear regression of REFUNA’s daily space heating (SH) demand versus Beznau’s daily mean temperature, for daily mean temperatures below 16 °C (heating threshold temperature).
Energies 12 02399 g003
Figure 4. (Top): Heating degree days (HDD) in the REFUNA area and (population-weighted) Switzerland (CH). (Bottom): Daily space heating (SH) demand in REFUNA derived from actual heat feed-in measurements.
Energies 12 02399 g004
Figure 5. Linear regression of the daily space heating (SH) demand calculated with the CESAR model for a set of 500 single- and 500 multi-family houses—representative for all Switzerland—with no retrofit and with a full retrofit versus the daily mean temperature at their location. Each dot represents one day of a whole year.
Energies 12 02399 g005
Figure 6. (Top): Daily space heating (SH) demand reduction R e d d a i l y calculated according to Equation (3) and the CESAR simulation in Figure 5. (Bottom): Corresponding daily mean ambient temperature T d a i l y in the CESAR model.
Energies 12 02399 g006
Figure 7. Hourly SH demand in Switzerland (CH) without (top) and with (bottom) a full retrofit of 63.6% of all building according to Figure 5 for a total annual SH demand reduction of −42%, as stated in the scenario “BAU” in ES2050.
Energies 12 02399 g007
Figure 8. (a) Coefficient of performance (COP) of a state-of-the-art air-water heat pump [44] as a function of the ambient air temperature at three forward flow temperatures of 35 °C, 45 °C, and 50 °C. (b) Hourly COP of the heat pump in (a) for 35 °C, 45 °C, and 50 °C depending on the hourly ambient air temperature of “population-weighted” Switzerland in 2010 from Gelaro et al. [38].
Energies 12 02399 g008
Figure 9. Hourly recharging profile of battery electric vehicles (BEVs) with shares of 70% at home, 15% at work, 10% in public (places) and 5% others according to Robinson et al. [51] and no load shifting strategies implemented.
Energies 12 02399 g009
Figure 10. Hourly photovoltaics (PV) and nuclear power plant (NPP) production profiles “PV_Prod” and “NPP_Prod” (see Table 1) for 2010 at an installed PV peak capacity of 26.5 GW p (950 full load hours) derived from meteorological satellite-data reanalysis of Pfenninger and Staffell [60] and the monthly averaged NPP production at an installed capacity of 3.3 GW of BFE [53] for an annual total of 25 TWh each.
Energies 12 02399 g010
Figure 11. “Smoothed” (averaged) and “original” (unadjusted) profiles of the Swiss electricity consumption and modified production for one randomly selected day in winter and summer. A proper description of each line can be found in Table 1.
Energies 12 02399 g011
Figure 12. Additional hourly electricity demand of an electrification of the Swiss heat (SH and DHW) and mobility sector with 75% heat pumps and 20% BEV. Seasonal and annual sums are displayed in labels.
Energies 12 02399 g012
Figure 13. Sensitivity plot of the additional total electricity demand of heat pumps and BEV with respect to plausible percentage changes of the key parameters in Table 3.
Energies 12 02399 g013
Figure 14. Sensitivity plot of the additional maximum power demand of heat pumps and BEV with respect to plausible percentage changes of the key parameters in Table 3.
Energies 12 02399 g014
Figure 15. Profile of the hourly electricity demand for heat (SH and DHW), BEV and their sum in a randomly selected day in winter (1 February 2010) and summer (1 July 2010).
Energies 12 02399 g015
Figure 16. (Left): Hourly Swiss electricity demand for 2010 in the original profile of Swissgrid (“Total_Cons_orig” in Table 1). (Right): Modified profile with an additional electrification by heat pumps and BEV (“Total_mod_Cons_smooth” in Table 1). Labels are the seasonal and annual sums.
Energies 12 02399 g016
Figure 17. Comparison of the hourly total electricity demand for the original (“Total_Cons_orig” in Table 1) and modified profile (with heat pumps and BEV; “Total_mod_Cons_smooth” in Table 1) in a randomly selected week in winter and summer. Differences are the red shaded areas.
Energies 12 02399 g017
Figure 18. (Left): Hourly Swiss electricity production for 2010 in the original profile of Swissgrid (“Total_Prod_orig” in Table 1) with nuclear power plants (NPP). (Right): Modified profile with a complete substitution of NPP by PV (“Total_mod_Prod_smooth” in Table 1). Labels are the seasonal and annual sums.
Energies 12 02399 g018
Figure 19. Comparison of the total hourly electricity production for the original (“Total_Prod_orig” in Table 1) and modified profile (with PV and no nuclear power plants (NPP); “Total_mod_Prod_smooth” in Table 1) in a randomly selected week in winter and summer. Positive differences are shaded in blue; negative differences are shaded in grey.
Energies 12 02399 g019
Figure 20. Hours with momentary surpluses (positive values) and deficits (negative values) for the three scenarios in Table 2. Labels indicate seasonal and annual sums of surpluses and deficits.
Energies 12 02399 g020
Figure 21. Sensitivity plot of the total annual electricity surplus with respect to plausible percentage changes of the key parameters in Table 3.
Energies 12 02399 g021
Figure 22. Sensitivity plot of the total annual electricity deficits with respect to plausible percentage changes of the key parameters in Table 3.
Energies 12 02399 g022
Figure 23. Weekly aggregated values of the 2010 modified Swiss electricity system with production (filled bars; including imports) and demand (red lines; including +75% heat pumps and +20% BEV).
Energies 12 02399 g023
Figure 24. Hourly CO2 intensities for the scenario “Status quo” for the years 2010 to 2016 calculated with balancing method “BM4”. Demand-weighted seasonal averages and the overall average at 53 g C O 2 , e q /kWh are indicated with red lines.
Energies 12 02399 g024
Figure 25. Hourly CO2 intensities for the three scenarios in Table 2 calculated with balancing method “BM4” (see Section 2.5.2). Demand-weighted seasonal averages and the annual average are indicated as lines and labels.
Energies 12 02399 g025
Figure 26. Sensitivity plot of the average CO2 intensity with respect to plausible percentage changes of the key parameters in Table 3.
Energies 12 02399 g026
Figure 27. Cumulated CO2 emissions of the sectors “mobility” (Mob.), “heat” (SH and DHW) and “electricity” (Elec.) in the different scenarios investigated in this study (see Table 2). “Elec. Base” is the base electricity demand (i.e., without the additional electricity demand of heat pumps and BEV).
Energies 12 02399 g027
Figure 28. Sensitivity plot of the total CO2 emissions for scenario “PV-NPP-HP-BEV” with respect to plausible percentage changes of the key parameters in Table 3. “Reference 1” is the reference scenario “SQ + Retrofit” from Figure 27.
Energies 12 02399 g028
Table 1. Electricity production and consumption (demand) profiles used in this study.
TypeProfileNotes/Sources
ProductionTotal_Prod_origSwissgrid: Total production control block CH 2010
ProductionNPP_ProdBFE: monthly nuclear production CH 2010
ProductionPV_ProdRenewables.ninja: hourly PV production CH 2010 at 26.5 GW p
ProductionHydro_Prod_origTotal_Prod_orig - NPP_Prod
ProductionHydro_Prod_smoothsmooth(Hydro_Prod_orig)
ProductionTotal_mod_Prod_origHydro_Prod_orig + PV_Prod
ProductionTotal_mod_Prod_smoothHydro_Prod_smooth + PV_Prod
DemandTotal_Cons_origSwissgrid: Total end-use consumption control block CH 2010
DemandEnduse_Cons_origSwissgrid: Total consumption control block CH 2010
DemandLossPump_origTotal_Cons_orig - Enduse_Cons_orig
DemandLossPump_smoothsmooth(LossPump_orig)
DemandTotal_Cons_smoothEnduse_Cons_orig + LossPump_smooth
DemandHP_ConsHeat pump electricity consumption
DemandBEV_ConsBEV electricity consumption
DemandTotal_mod_Cons_smoothTotal_Cons_smooth + HP_Cons + BEV_Cons
Table 2. Scenarios of this study with their electricity production and consumption (demand) profiles. For the individual profiles refer to Table 1.
ScenarioProduction ProfileConsumption ProfileNotes
“Status quo”Total_Prod_origTotal_Cons_orig“Original” electricity production and demand of Swissgrid for 2010
“PV-NPP”Total_mod_Prod_smoothTotal_Cons_smooth“Smoothed” electricity production with PV instead of NPP; “smoothed” electricity demand without additional heat pumps and BEV
“PV-NPP-HP-BEV”Total_mod_Prod_smoothTotal_mod_Cons_smoothElectricity production as in “PV-NPP”; electricity demand of “PV-NPP” plus additional electricity demand of heat pumps and BEV
Table 3. Key parameters of this study with their default and plausible range of values. “HP share SH/DHW”: Percentage (share) of heat pumps (HP) for space heating (SH)/domestic hot water (DHW); “BEV km share”: Percentage (share) of annual Swiss mileage (km) covered by battery electric vehicles (BEV); “PV prod.”: Electricity production by photovoltaics (PV); “eta BEV”: Tank-to-Wheel efficiency of BEV; “HP flow temp.”: Forward flow temperature of HP; “SH savings”: Percentage SH demand reduction by refrofitting; “CO2 int. nuc./hydro/PV/ imp.”: Life-cycle CO2 intensity of nuclear/hydro/PV electricity production and imports.
ParameterDefaultPlausible RangeNotes [Sources]
HP share SH80%[50–90%]-
HP share DHW50%[25–75%]-
BEV km share20%[10–50%]-
PV prod.25 TWh[12 *–50 **]* POM [2]; ** Portmann et al. [54]
eta BEV85%[80–90%]-
HP flow temp.45 °C[35, 50]Effiziento [44]
SH savings−42% *[−20%, −64% **]* BAU [2]; ** NEP [2]
CO2 int. nuc.12 g C O 2 , e q /kWh[10–15]Wernet et al. [61]
CO2 int. hydro13 g C O 2 , e q /kWh[10–20]Wernet et al. [61]
CO2 int. PV50 g C O 2 , e q /kWh[15 *–92 **]* OPT [65]; ** current [61]
CO2 int. imp.443 * g C O 2 , e q /kWh[109 **–679 ***]* CCGT [61]; ** France import mix [61];
*** Germany import mix [61]