Article

A Fast Fault Identification in a Grid-Connected Photovoltaic System Using Wavelet Multi-Resolution Singular Spectrum Entropy and Support Vector Machine

by
Masoud Ahmadipour
1,2,*,
Hashim Hizam
1,2,
Mohammad Lutfi Othman
1,2,
Mohd Amran Mohd Radzi
1,2 and
Nikta Chireh
3
1
Department of Electrical and Electronic Engineering, Universiti Putra Malaysia, Serdang, Selangor 43400, Malaysia
2
Advanced Lightning and Power Energy Research (ALPER), Universiti Putra Malaysia, Selangor 43400, Malaysia
3
Department of Architecture Engineering, Alaodoleh Semnani Institute of Higher Education, Garmsar 33335815, Semnan, Iran
*
Author to whom correspondence should be addressed.
Energies 2019, 12(13), 2508; https://doi.org/10.3390/en12132508
Submission received: 2 May 2019 / Revised: 21 May 2019 / Accepted: 30 May 2019 / Published: 28 June 2019
(This article belongs to the Section F: Electrical Engineering)

Abstract

:
A new protection scheme based on applying a combination of wavelet multi-resolution singular spectrum entropy and support vector machine is proposed to identify different types of grid faults in a three-phase grid-tied photovoltaic system. In this technique, discrete wavelet transform with multi-resolution singular spectrum entropy is utilized to extract the unique features of three-phase voltage signals at the point of common coupling. The three-phase voltage signals are decomposed to provide detail and approximation coefficients of wavelet transform. Then, various features between different types of grid faults can be extracted by a combination of multi resolution analysis and spectrum analysis with entropy as the output. The constructed features vector is utilized as input data of a support vector machine classifier to identify and classify various types of faults. The results illustrate that the proposed intelligent technique not only recognizes different types of grid faults correctly, but also performs quickly in identifying grid faults in a grid-connected photovoltaic system. Apart from this, a graphical investigation is executed to observe the effects of different types of grid faults in photovoltaic (PV) operation which highlight the necessity of intelligent protection methods to protect PV systems.

1. Introduction

The rapid growth of photovoltaic (PV) installations around the world is no surprise owing to their benefits such as no pollution, easy installation and integration, noiseless operation, and economic benefits. The total installed capacity of PV systems reached 310 GW by the end of 2016 [1]. In that year, PV generation was 200 TWh, about 1% of worldwide electricity demand [2]. By 2050, about 20% of the world electricity will be provided by photovoltaics. As matter of fact, PV-based generation is the third most important source of renewable energy in terms of global installed capacity [2]. However, in spite of the benefits, PV systems could be subject to different varieties of failures, mainly due to external operating conditions. The reliability of electrical systems can be put at risk by these failures [3]. The main catastrophic failures in PV systems are symmetrical and asymmetrical faults [4]. These faults in PV systems can cause a massive amount of energy loss and fire hazard [5]. Hence, new methods need to be developed to assist in assessing the power production during normal operating situations and for fault recognition in PV systems. Recently, different techniques have been proposed to recognize and classify grid faults. For all methods, increasing the operational reliability of PV systems with low grid cost and detecting the causes of disturbance in PV systems are important. A review of these techniques can be found in [6,7,8,9]. For example, rate of change of frequency (ROCOF) [10], the vector surge method [11], real-valued negative colon selection [12], under/over voltage (U/OV) [13], the high impedance method [14], the hypothesis testing method [15], and external events vectors [16] have been presented as traditional protection techniques in PV systems. Therefore, to solve the threshold problem in conventional fault detection techniques, intelligent fault detection techniques have been used in PV systems. In [17], a Slantlet transform in combination with Ridgelet probabilistic neural network was presented to detect grid faults in a grid-tied photovoltaic system. Wavelet singular entropy theory in combination with fuzzy logic was proposed to detect faults in a multiple distributed generation (DG) system [18]. In [19], a methodology based on probabilistic neural network and wavelet packet transform was presented to predict and classify grid faults in a PV system. Various intelligent fault detection methods in PV systems have been proposed based on computational intelligent methods and modern signal processing techniques to detect grid faults correctly and to improve the performance of PV systems [20,21,22,23,24,25,26]. The cumulative sum algorithm (CUSUM) [27] and permanent magnet synchronous motor [28] have been used to improve the performances of fault detection and diagnosis. In spite of the performed research work in this field, a more accurate intelligent fault detection method in PV systems is still required.
In this article, wavelet multi-resolution singular spectrum entropy in combination with support vector machine is presented to predict and classify grid faults in a grid-tied photovoltaic system. The protection scheme is divided into the following steps. Firstly, three-phase voltage signals at the point of common coupling (PCC) are measured for grid faults during different situations, e.g., type of fault, resistance, and distance. Using the discrete wavelet transform (DWT) with multi-resolution singular spectrum entropy (MRSSE), the prominent feature vectors are extracted for different types of grid faults. Then, the obtained feature vector values are used to train the SVM classifier for identifying and classifying the different types of faults in the system. The major priorities of the proposed approach are to achieve a simple, easy to implement method with a fast detection time, that is effective in recognizing grid faults and protecting the grid-connected photovoltaic system. Apart from this, a graphical investigation is executed to observe the effects of different types of grid faults in PV operation which highlight the necessity of intelligent protection methods for protecting PV systems.
The rest of the article is prepared as follows: Section 2 and Section 3 describe the theoretical background and the proposed protection scheme, respectively. The studied model and simulation results are given in Section 4. The performance of the SVM classifier and comparative examination are presented in Section 5. The investigation of PV operation under different fault conditions is given in Section 6. Finally, the discussion and conclusions are given in Section 7 and Section 8, respectively.

2. Theoretical Background

2.1. Discrete Wavelet Transform

Discrete wavelet transform (DWT) is an influential tool to examine the steady-state and non-stationary signals. It cuts up information, then interprets and scales versions of a single function [29]. Mathematically, DWT for a discrete signal f ( k ) ( k = 1 , 2 , 3 , , N ) with regard to the wavelet function ψ ( . ) is assumed to be as follows [30]:
D W T ψ f ( m , n ) = k f ( k ) ψ m , n * ( k )
where ψ m , n * is the discretized mother wavelet, given as follows:
ψ m , n * ( k ) = 1 a 0 m ψ ( n k b 0 a 0 m a 0 m )
where a 0 ( > 0 ) and b 0 ( > 0 ) are adjusted as real values, and m and n are positive integers.
Generally, the selection of a suitable mother wavelet for analysis, depending on the type of information used and the determination of decomposition at the best level, plays a prominent role in DWT applications. Different mother wavelets have been presented to examine the grid fault studies such as Haar, Mexican, Biorthogonal, Daubechies, and Morlet. In this article, the mother wavelet at scale 4 (DB4, Daubechies 4) is considered to extract features of grid fault waveforms by experimentation and trial and error.

2.2. Multi-Resolution Singular Spectrum Entropy

Multi-resolution analysis (MRA) was firstly introduced by Mallat as a necessary part of decomposition and reconstruction of the signal at different resolution levels [31]. The easy implementation and low memory usage are two important merits of MRA. The discrete signal f ( k ) ( k = 1 , 2 , 3 , , N ) with respect to the selection of the mother wavelet and the best decomposition layer is processed by the MRA algorithm. The DWT of a discrete signal can be calculated as follows [32]:
{ c j ( k ) = m = + H ( m 2 k ) c j + 1 ( m ) d j ( k ) = m = + G ( m 2 k ) c j + 1 ( m )
where H is the low-pass filter and G is the high-pass filter. c j and d j are approximate and detailed parts of the signal scale, respectively. j represents the decomposition layer.
The signal f ( k ) can be decomposed in terms of the wavelet coefficients at ( J = 1 , 2 , 3 , , j ) resolution levels into d 1 ,   d 2 , d 3 , , d j , c j , which illustrate detailed (high-frequency) and approximation (low-frequency) data coefficients. The coefficient vector data for signal f ( k ) is given as follows:
Mcoeff = [d1, d2, d3, …, dj, cj].
The reconstruction of DWT coefficients for the parsed signal of each layer is implemented as follows:
c j 1 = H * c j + G * d j
where H * is the dual operator of H and G * is the dual operator of G .
In order to reconstruct the reconstruction signal of layer j in an n-dimensional phase space, an ( N n + 1 ) * n dimensional matrix M is given as follows:
M ( N n + 1 ) * n = [ d j ( 1 ) d j ( 2 ) d j ( n ) d j ( 2 ) d j ( 3 ) d j ( n + 1 ) d j ( N n + 1 ) d j ( N n ) d j ( N ) ] .
In order to compute the singular spectrum entropy, matrix M is decomposed by singular value decomposition as follows [33]:
M = U ( N n + 1 ) Λ l * l V n * l T
where Λ l * l possesses a nonzero diagonal element, which is called singular values of the matrix M from layer j . Hence, the signal singular spectrum entropy is calculated as follows:
H j = i = 1 l P j i log ( 2 * P i j )
where H j indicates the information entropy of level j and P j i shows the undefined probability distribution of the nonzero diagonal elements. P j i is expressed as follows:
P j i = λ j i i = 1 l λ j i i = 1 , 2 , 3 , . l
where λ j i is the nonzero diagonal elements from Λ l * l .

2.3. Support Vector Machine

One of the intelligent classifiers that is commonly utilized for classification in power system applications is support vector machine (SVM). It is developed based on determining a decision boundary to divide the training examples into their relevant classes. To classify the normal and grid fault cases, SVM creates a hyperplane to separate data into their respective classes in a d-dimensional feature space. In this paper, a linear decision boundary is used. A class decision function linked with a hyperplane is defined as follows [34].
y ( x ) = 𝓌 T φ ( x r ) + b ( x r R d )
where 𝓌 indicates the weight vector normal to the hyperplane and b is the bias. x r is the training vector that is mapped into a d-dimensional feature space by the function φ . Mathematically, the learning task of SVM is defined as follows [34]:
min 𝓌 , b , ξ 1 2 | 𝓌 | 2 + C ( r = 1 l ξ r )
which is subject to
y r ( 𝓌 T φ ( x r ) + b ) 1 ξ r ,   ( r )       ξ r 0 ,   y r { 1 , 1 } l
where parameter (C > 0) shows the error’s penalty factor. ξ r is the slack variable. Furthermore, the kernel function is shown by k ( x r , x s ) = φ ( x r ) T φ ( x s ) . In this work, radial basis function (RBF) is used as the kernel function because of its excellent performance in practice and because it is relatively easy to calibrate, which is also mentioned in [35], as opposed to many kernels being utilized. It is defined as follows:
k ( x r , x s ) = exp ( γ X r X s 2 ) γ > 0 .
The steps to determine the optimum values of C and γ parameters are given below:
Step 1.
The values of C and γ parameters are specified experimentally by a grid search and cross-validation process.
Step 2.
The values of C and γ parameters are changed in increments of the power of 2.
Step 3.
A k-fold validation is used for any parameter combination. The training data set is partitioned into k subsamples of equal size. k – 1 subsamples from the whole of k subsamples are utilized as the training data, and only the remaining subsample is applied as validation data.
Step 4.
The cross-validation process is iterated k times, and SVM is trained by all subsamples except the validation data.
Step 5.
The trained SVM is tested only via the validation data, and the classification error for this subsample is computed.
Step 6.
The training subsamples are tested separately once and the percentage of correct classification is calculated as the cross-validation accuracy.
Step 7.
To select the best value combinations of C and γ parameters, this process is repeated until the best pair gives the maximum assessment accuracy.

3. Proposed Protection Scheme

Figure 1 illustrates the application procedure of the proposed protection scheme using wavelet multi-resolution singular spectrum entropy (WMRSSE) and SVM for identifying and classifying grid faults. The steps in detecting and classifying grid faults are given as follows:
Step 1.
The three-phase voltage signals at the PCC are measured for different types of grid faults by simulating a three-phase grid-tied photovoltaic system in a Matlab/Simulink (r2015a, Mathworks, Natick, MA, USA) environment.
Step 2.
A suitable mother wavelet is selected and the number of levels of decomposition is determined. In this paper, Daubechies 4 (DB4) was designated as the mother wavelet by experimentation and trial and error and the measured PCC voltage signals were decomposed by eight layers.
Step 3.
The reconstruction voltage signals of each layer are reconstructed in the phase space. In this article, the number of sampling points is N = 29700 . The n-dimensional phase space is 2970-dimensional. Hence, matrix M ( N n + 1 ) * n is reconstructed into ( 26731 * 2970 ) dimensions.
Step 4.
Matrix M is decomposed by singular value decomposition in order to compute the singular spectrum entropy of each layer. So, 2970 singular values of each layer are obtained.
Step 5.
The entropy value of each layer, e.g., H j , is calculated.
Step 6.
The extracted H j for different types of grid faults are collected in vector T and used to train the SVM classifier:
T = [ h 1 ,   h 2 , h 3 , , h j ] .
Step 7.
The grid faults are detected and classified by SVM.
Step 8.
A command block diagram is considered to specify whether a fault occurs or not. The proposed fault detection technique transfers a “trip signal is set to 1” command if fault cases are predicted; otherwise, for normal conditions a “trip signal is set to 0” command is set.

4. System Model and Simulation Results

4.1. Studied System

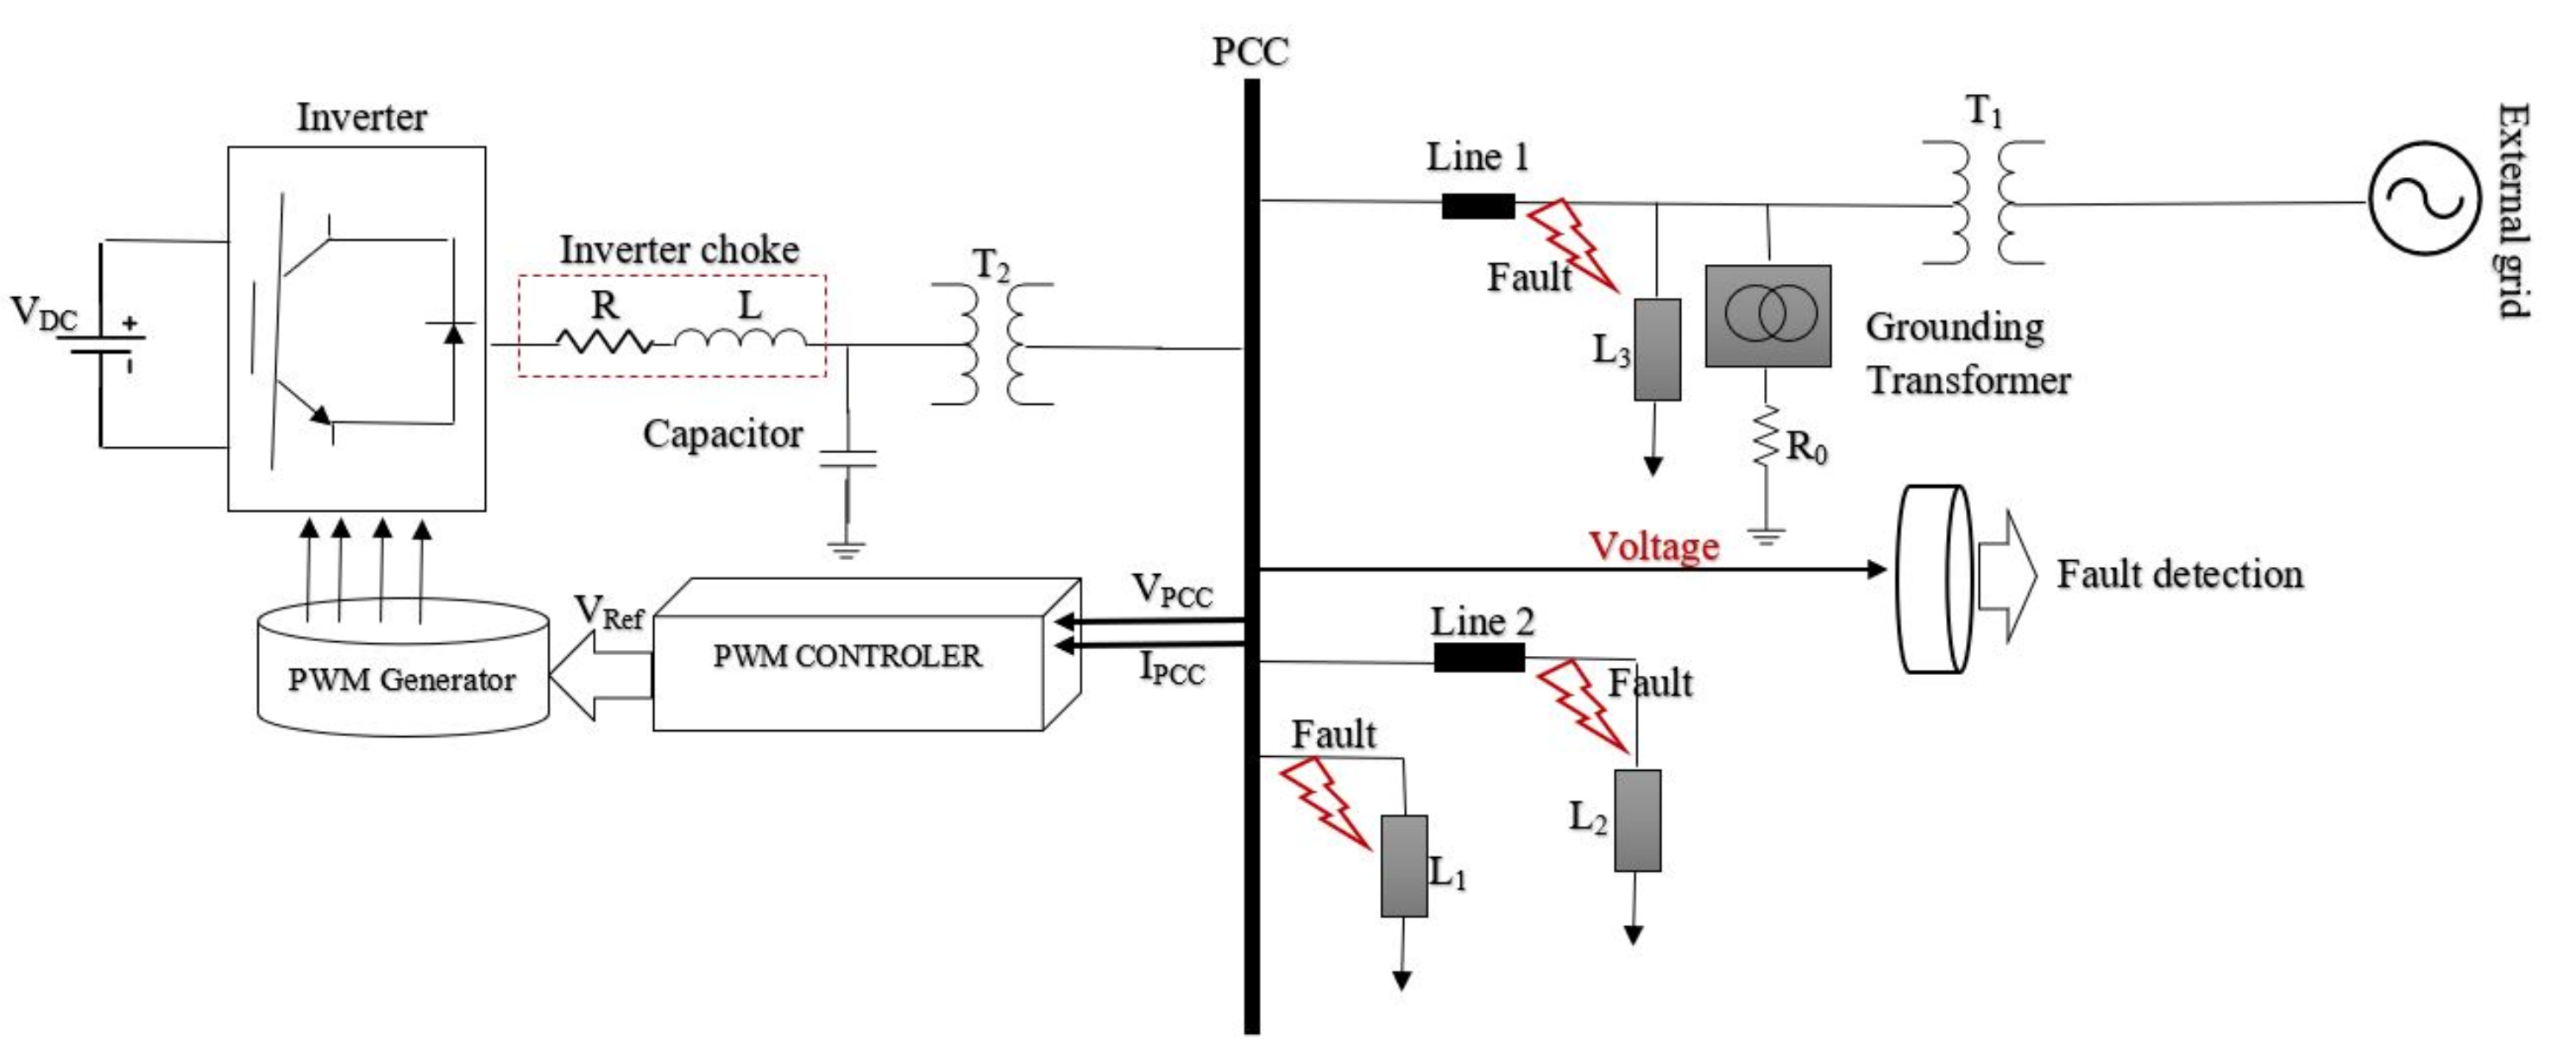
Figure 2 shows a 250 kW grid-connected PV system, the details for which are given in [19]. The studied system was modeled using the MATLAB simulation tool. This electrical system consists of a PV system that is connected to a 25 kV electrical grid with the frequency of 60 Hz by a 250 kVA 250 V/25 kV three-phase transformer. In the utility grid part, two feeders (Line 1 and Line 2) are connected to the PCC, having lengths of 14 km and 8 km, respectively. There is a ground transformer between Line 1 and transformer T1. The relay is located at the end of the DG to obtain voltage and current signals at different types of fault conditions. The studied grid fault conditions were simulated with different types, resistances, and distances away from the PCC of the PV system. The grid fault locations were selected as follows:
  • At the PCC location;
  • At two different distances of 8 km and 14 km away from the PV system.
  • The type of fault conditions are as follows:
  • Single phase to ground fault (SP-G);
  • Phase to phase to ground fault (PP-G);
  • Three phase to ground fault (PPP-G);
  • Phase to phase fault (PTP).
  • The grid faults occurred at t = 0.3 s, and after 150 ms they were cleared.

4.2. Simulation Results

In this study, three-phase voltage signals at the PCC were retrieved and an analysis based on the algorithm in Figure 1 was executed. The abnormal voltage changes must be detected by the proposed protection scheme in a timely manner when faults occur. Moreover, the protection relay must transfer the disconnection command to arrest the DG in the main utility grid based on the IEEE Std. 1547 [36]. The simulation sampling frequency was 19.8 kHz and sampling time was 1.5 s. The signals were decomposed by eight layers and the mother wavelet at scale 4 (DB4, Daubechies 4) was examined. The obtained results are described as follows:
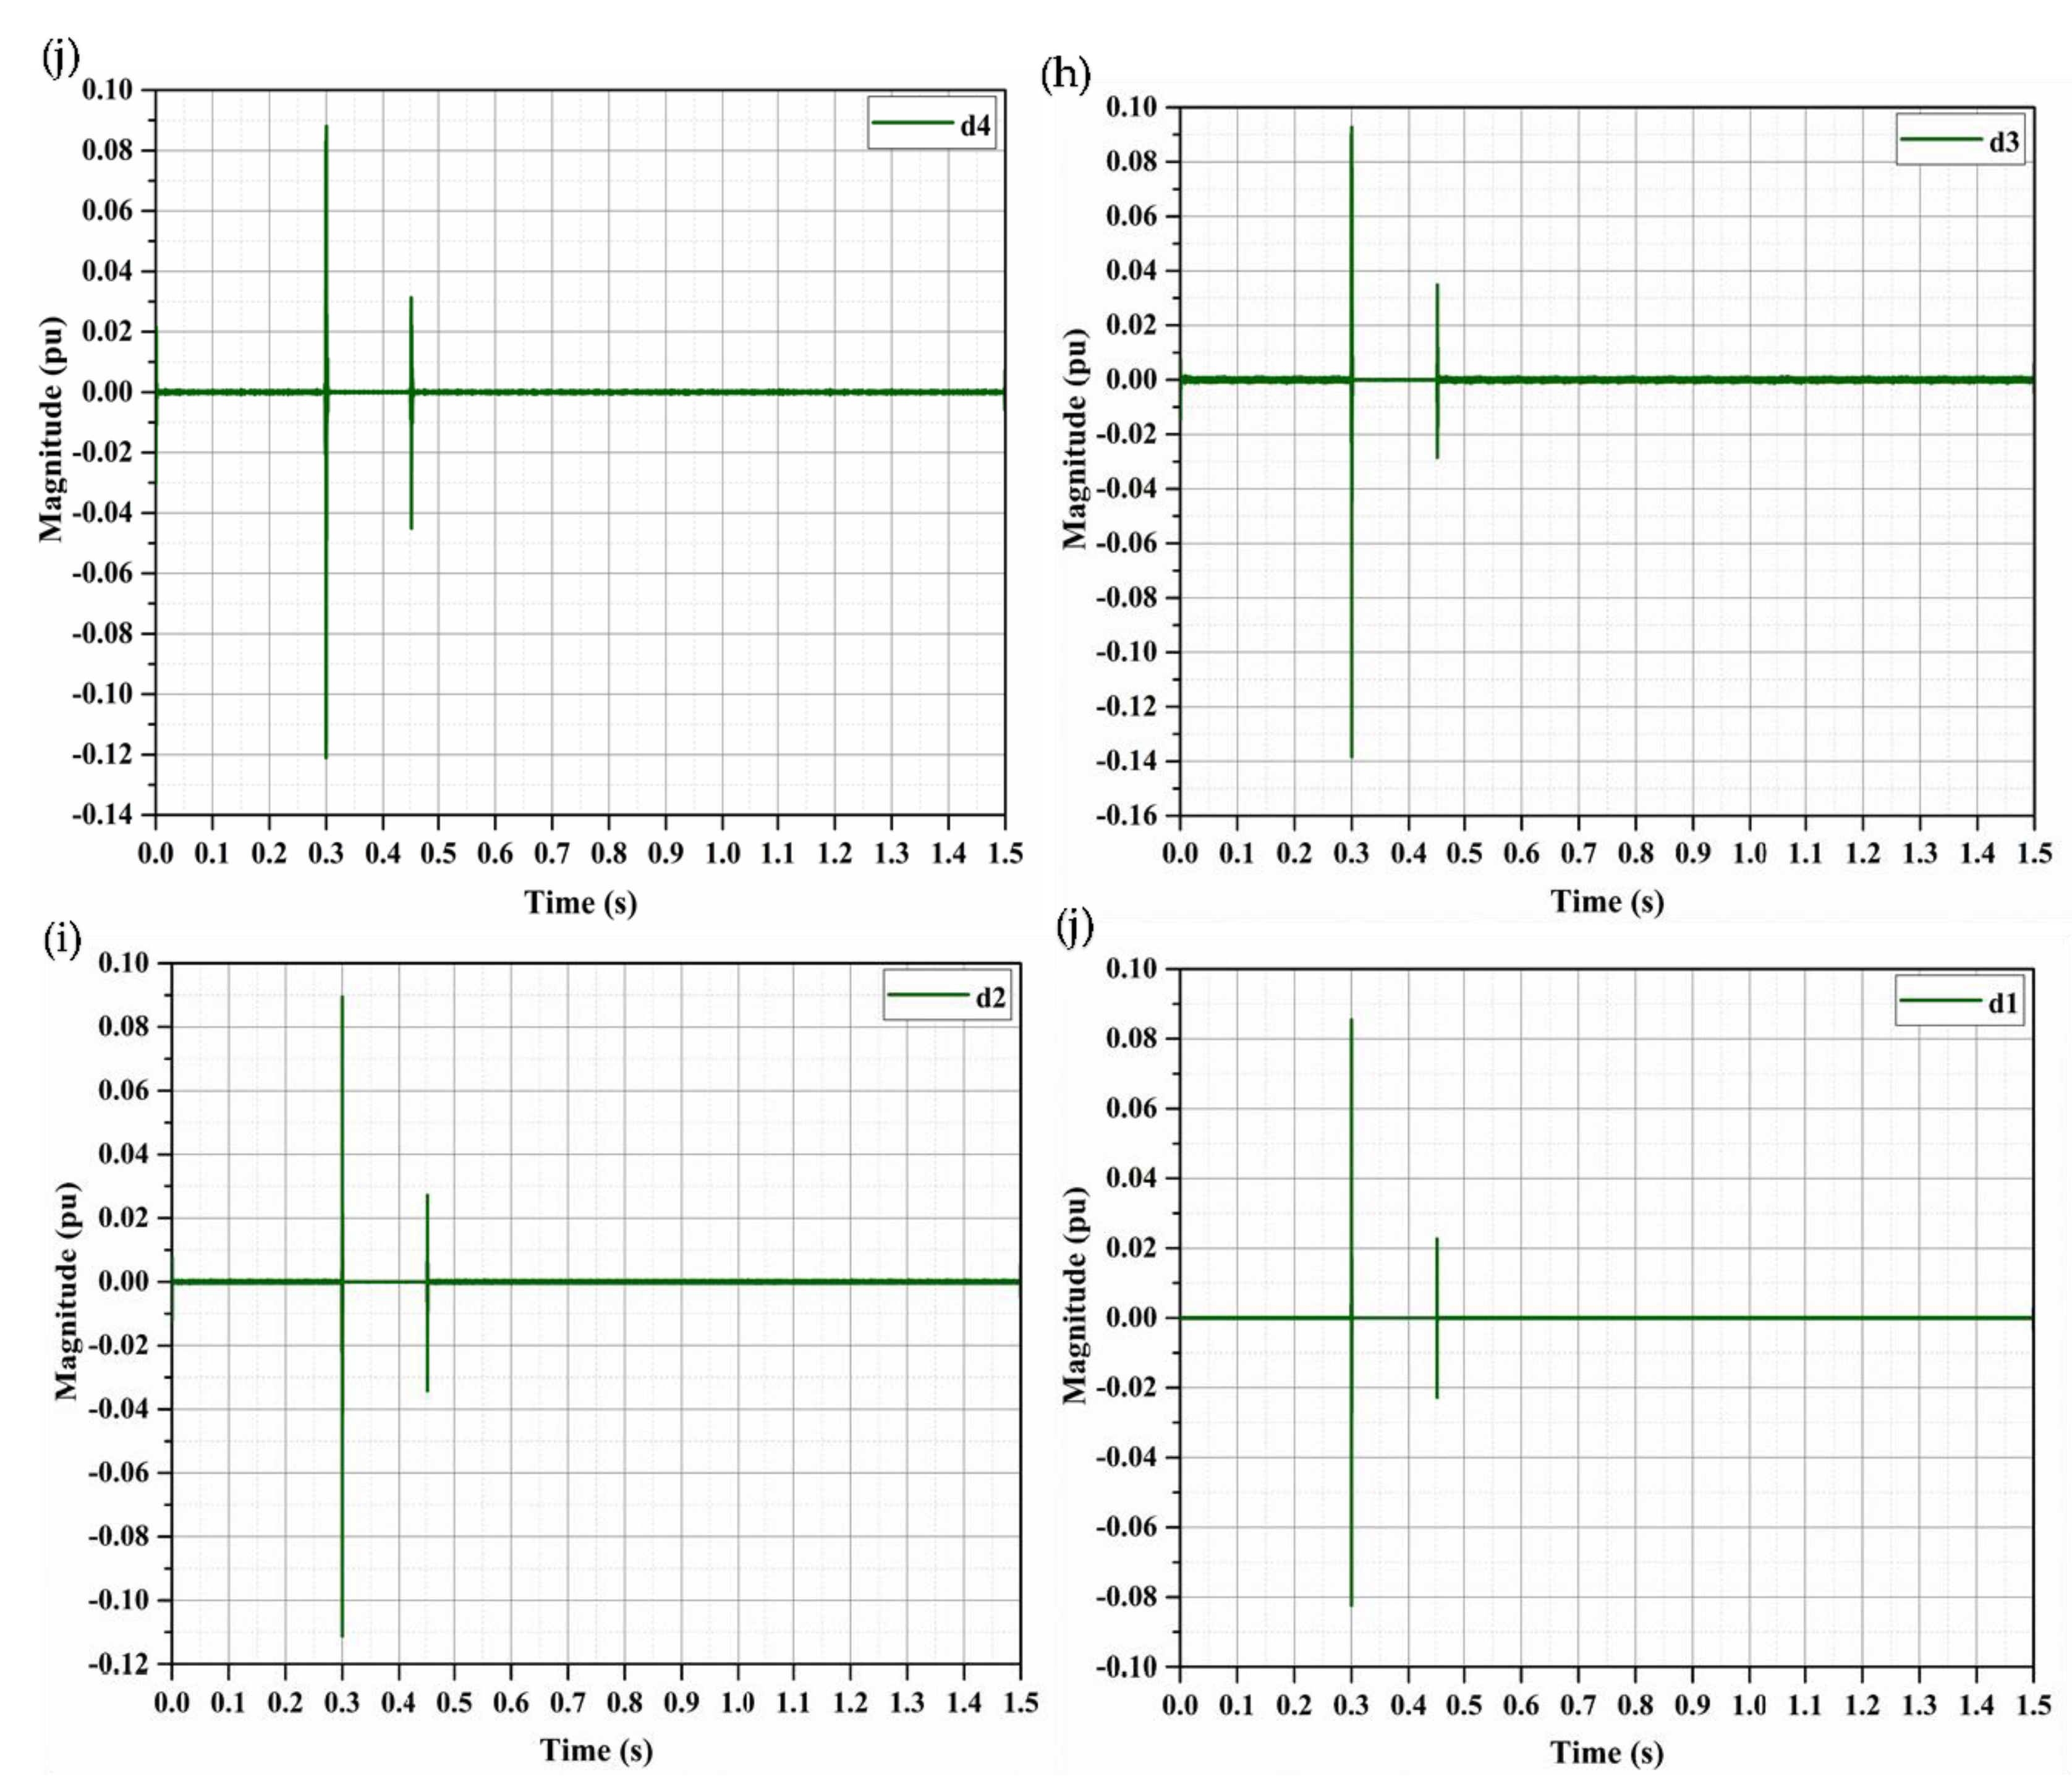
Figure 3 illustrates the wavelet decomposition levels of the PCC voltage signal for a PPP-G fault located 8 km away from the PCC in phase A. The DWT coefficients ( d 1 ,   d 2 , d 3 , d 4 , d 5 , d 6 , d 7 , d 8 ) were utilized to provide the singular spectrum entropy that was used to calculate the entropy value of each layer, e.g., H j , to recognize faults in the PV system. As mentioned above, different types of faults such as SP-G fault, PTP fault, PP-G fault, and PPP-G fault were explored at different distances and at different fault resistances in this model. The entropy values of fault conditions that occurred 8 km away from the PCC of the PV system with a fault resistance of 120 ohm under normal conditions are presented in Table 1. As seen, the differences between the entropy of different types of faults and the normal condition are noticeable and the entropy of each layer is different. Thus, the fault conditions influence the entropy values in the system and the classification results. Hence, entropy feature vectors were obtained by MRSSE, which was utilized to simplify the identification and classification as input data for the training SVM so as to specify the response time required to detect faults in the system with the relevant provisions.
Table 2 indicates the new entropy results for all measured signals under noisy conditions. A White Gaussian Noise was applied to the abovementioned cases, where the signal to noise ratio SNR was 20 dB.
As observed in Table 2, the noise does not have much effect on the MRSSE, and the proposed protection scheme can be employed in practical applications.

5. Performance of SVM Classifier and Comparative Examination

To investigate the performance of the proposed method, i.e., SVM and wavelet multi-resolution singular spectral entropy, to detect grid faults in PV systems, evaluation metrics such as accuracy and F-measure were taken into account as follows:
Accuracy = T P + T N T P + T N + F P   × 100 %
F m e a s u r e = 2 T P 2 T P + F N + F P   × 100 %
where TP is the total number of fault cases correctly detected by the model and TN is the total number of other cases (e.g., normal and other fault events) correctly predicted. FP indicates the total number of fault cases wrongly detected as other cases and FN is the total number of other cases wrongly predicted as fault events.
The C and γ parameters were determined by varying their values in ranges of 2−5 to 210 and 2−8 to 28, respectively. Four-fold cross-validation was implemented to provide the optimum values of C and γ parameters. The data set was partitioned into four parts, where three parts were utilized for training and one part for testing. To ensure that the error is consistent, the four parts were rotated until all cases were covered. Table 3 indicates the performance result of the SVM classifier in the training phase with different combinations of values of C As seen, the suitable values of parameters C and γ were 8 and 0.125, respectively. According to Equations (15) and (16), the accuracy and F-measure of SVM were 100% when the values of C and γ were 8 and 0.125, respectively. To achieve a good generalization performance of SVM, the training and testing processes were repeated 11 times, until the error rate converged, with 80% of the data set for training and 20% of the data set for testing. The average detection accuracy was then calculated. In the training phase, the overall detection accuracy was 100%.
Table 4 illustrates the classification accuracy per event and the overall detection accuracy in the testing phase. To examine the performance of the proposed method in detail, the test data were mentioned separately according to the event type, i.e., SP-G fault, PTP fault, PP-G fault, or PPP-G fault. The detection time of each event is shown in Table 4. As seen, the proposed method can detect grid faults a few milliseconds after they occur. The overall response time for the proposed protection scheme was 11 ms.
Compared with other methods, the proposed method exhibits a better performance. The comparison results are given in Table 5. As seen, the overall detection accuracy for the protection scheme in [37] is lower than other mentioned methods. WSE + FL [18] and the proposed method possess high classification accuracy and detection accuracy.

6. Investigation of PV Operation under Different Fault Conditions

In order to better understand the PV system operation during the aforementioned grid fault conditions, its performance was investigated graphically. The results are presented below.
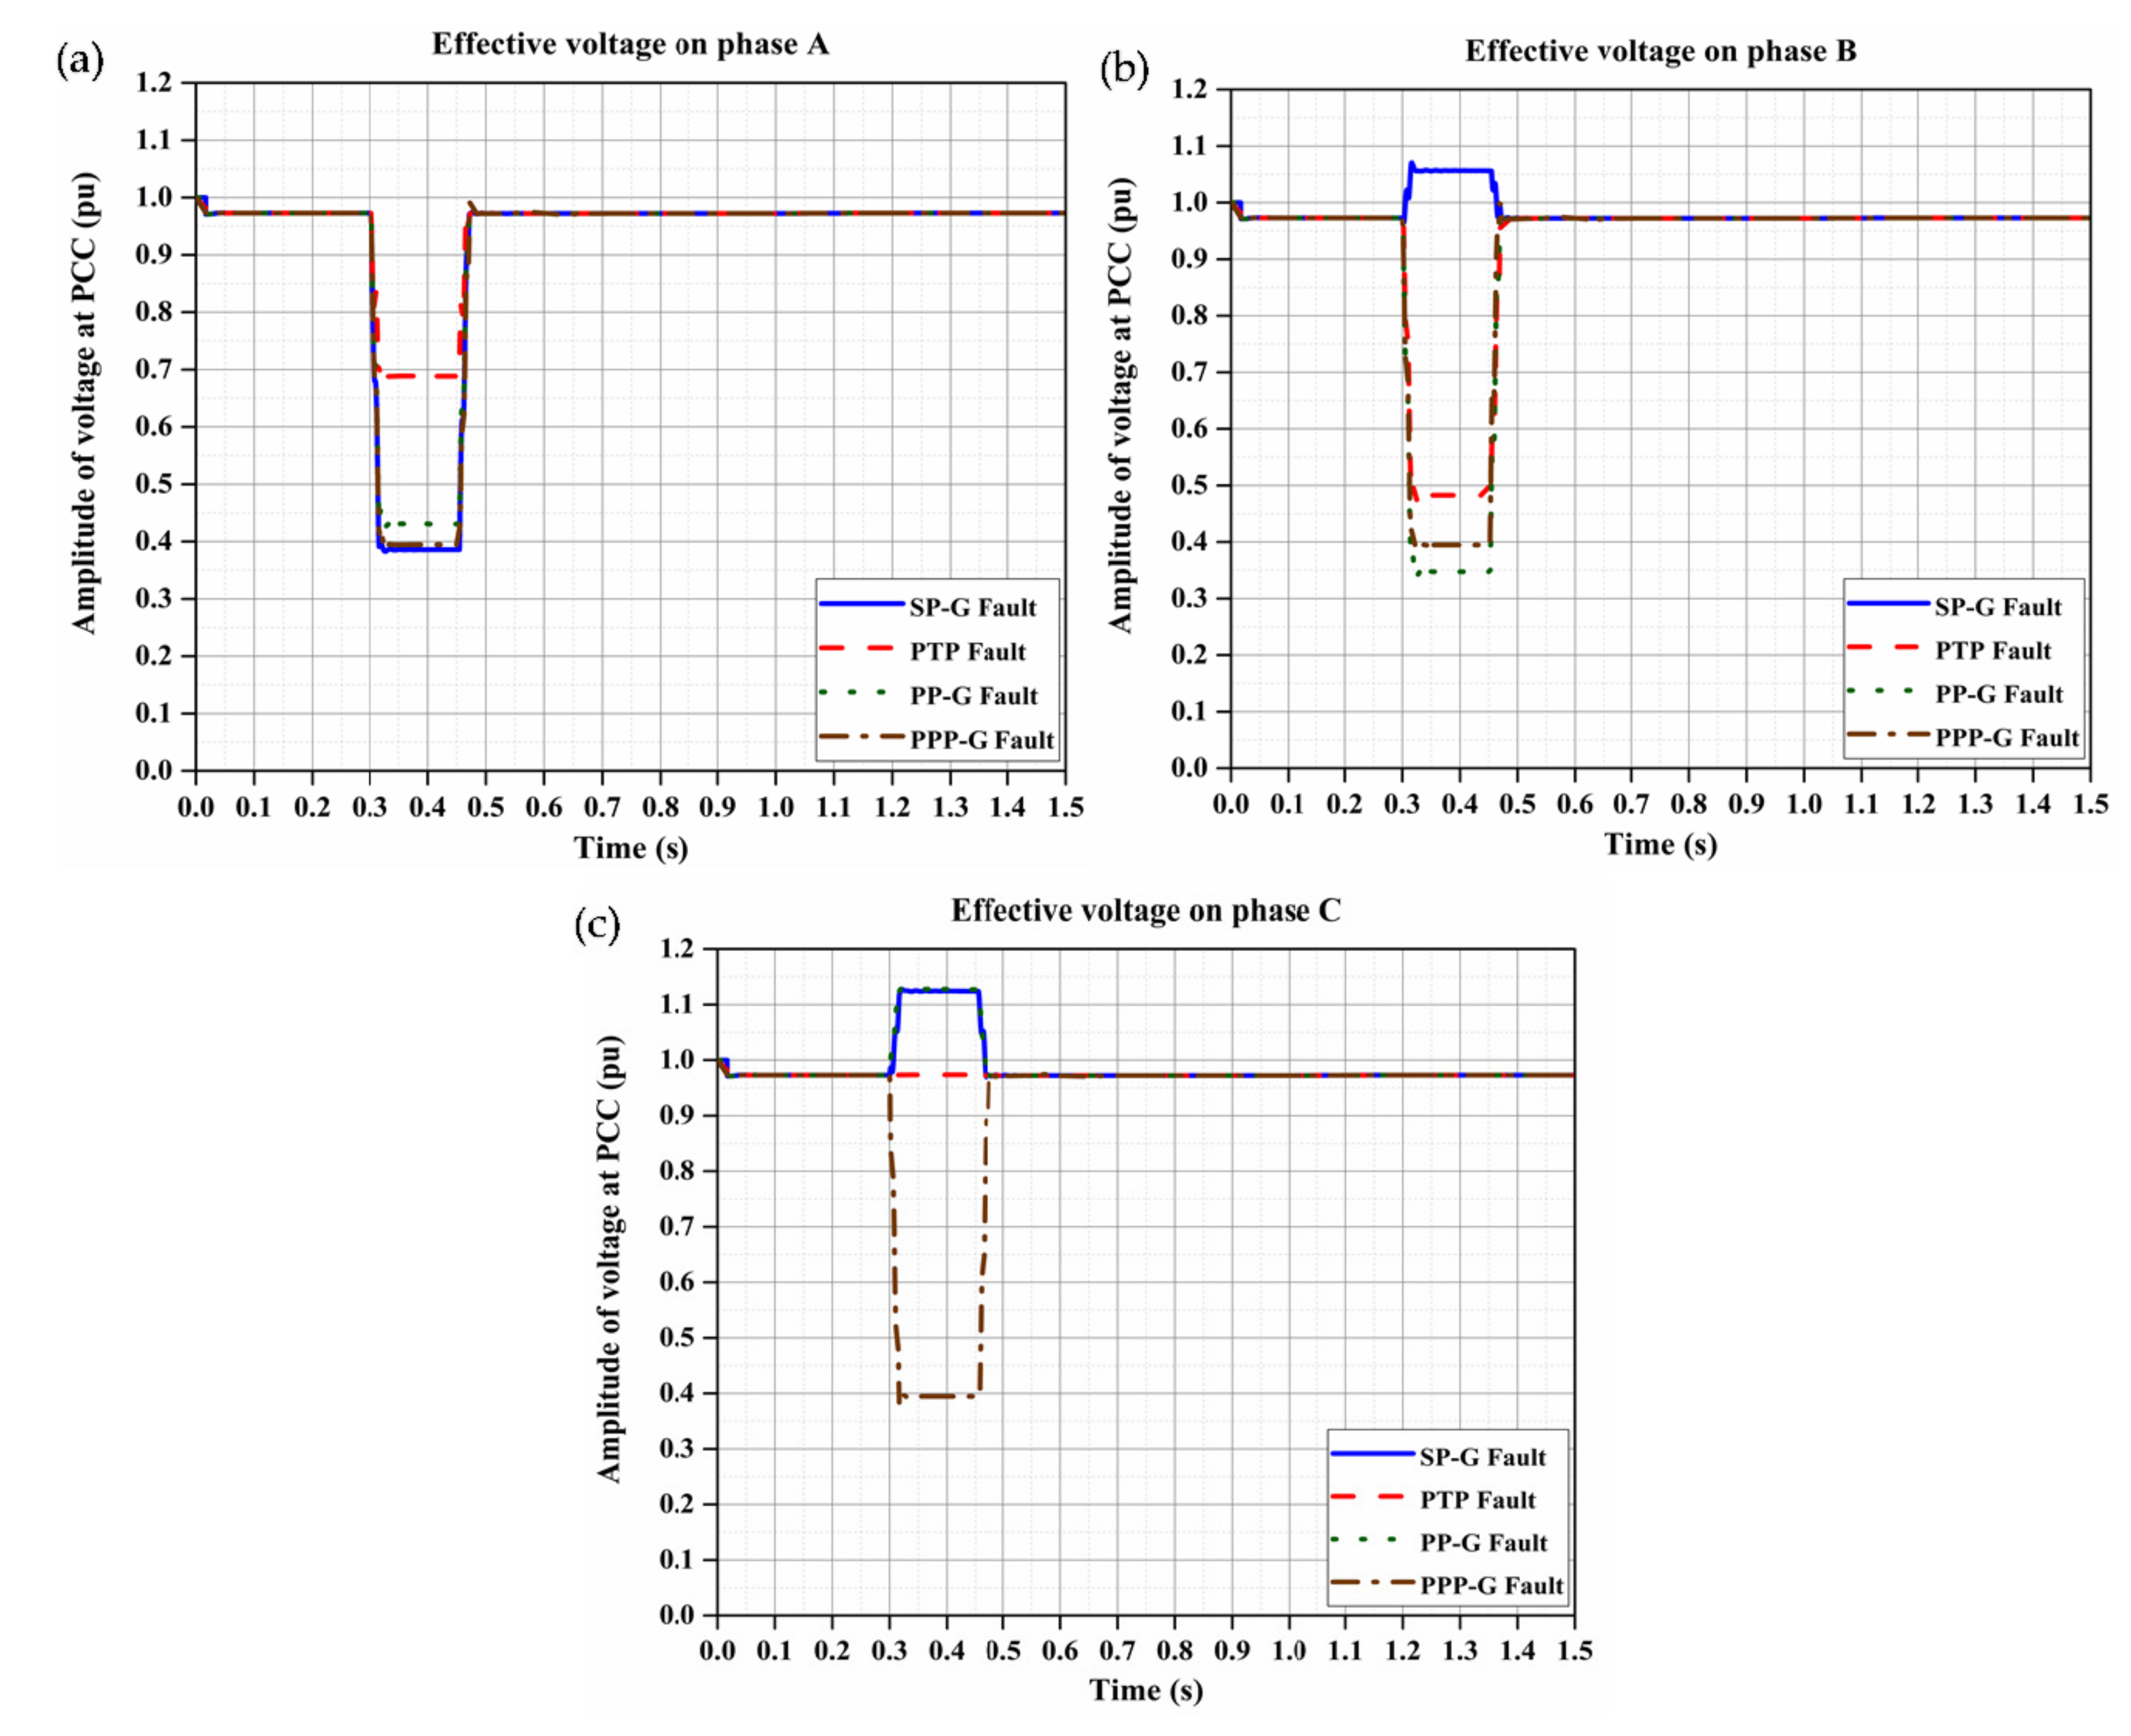
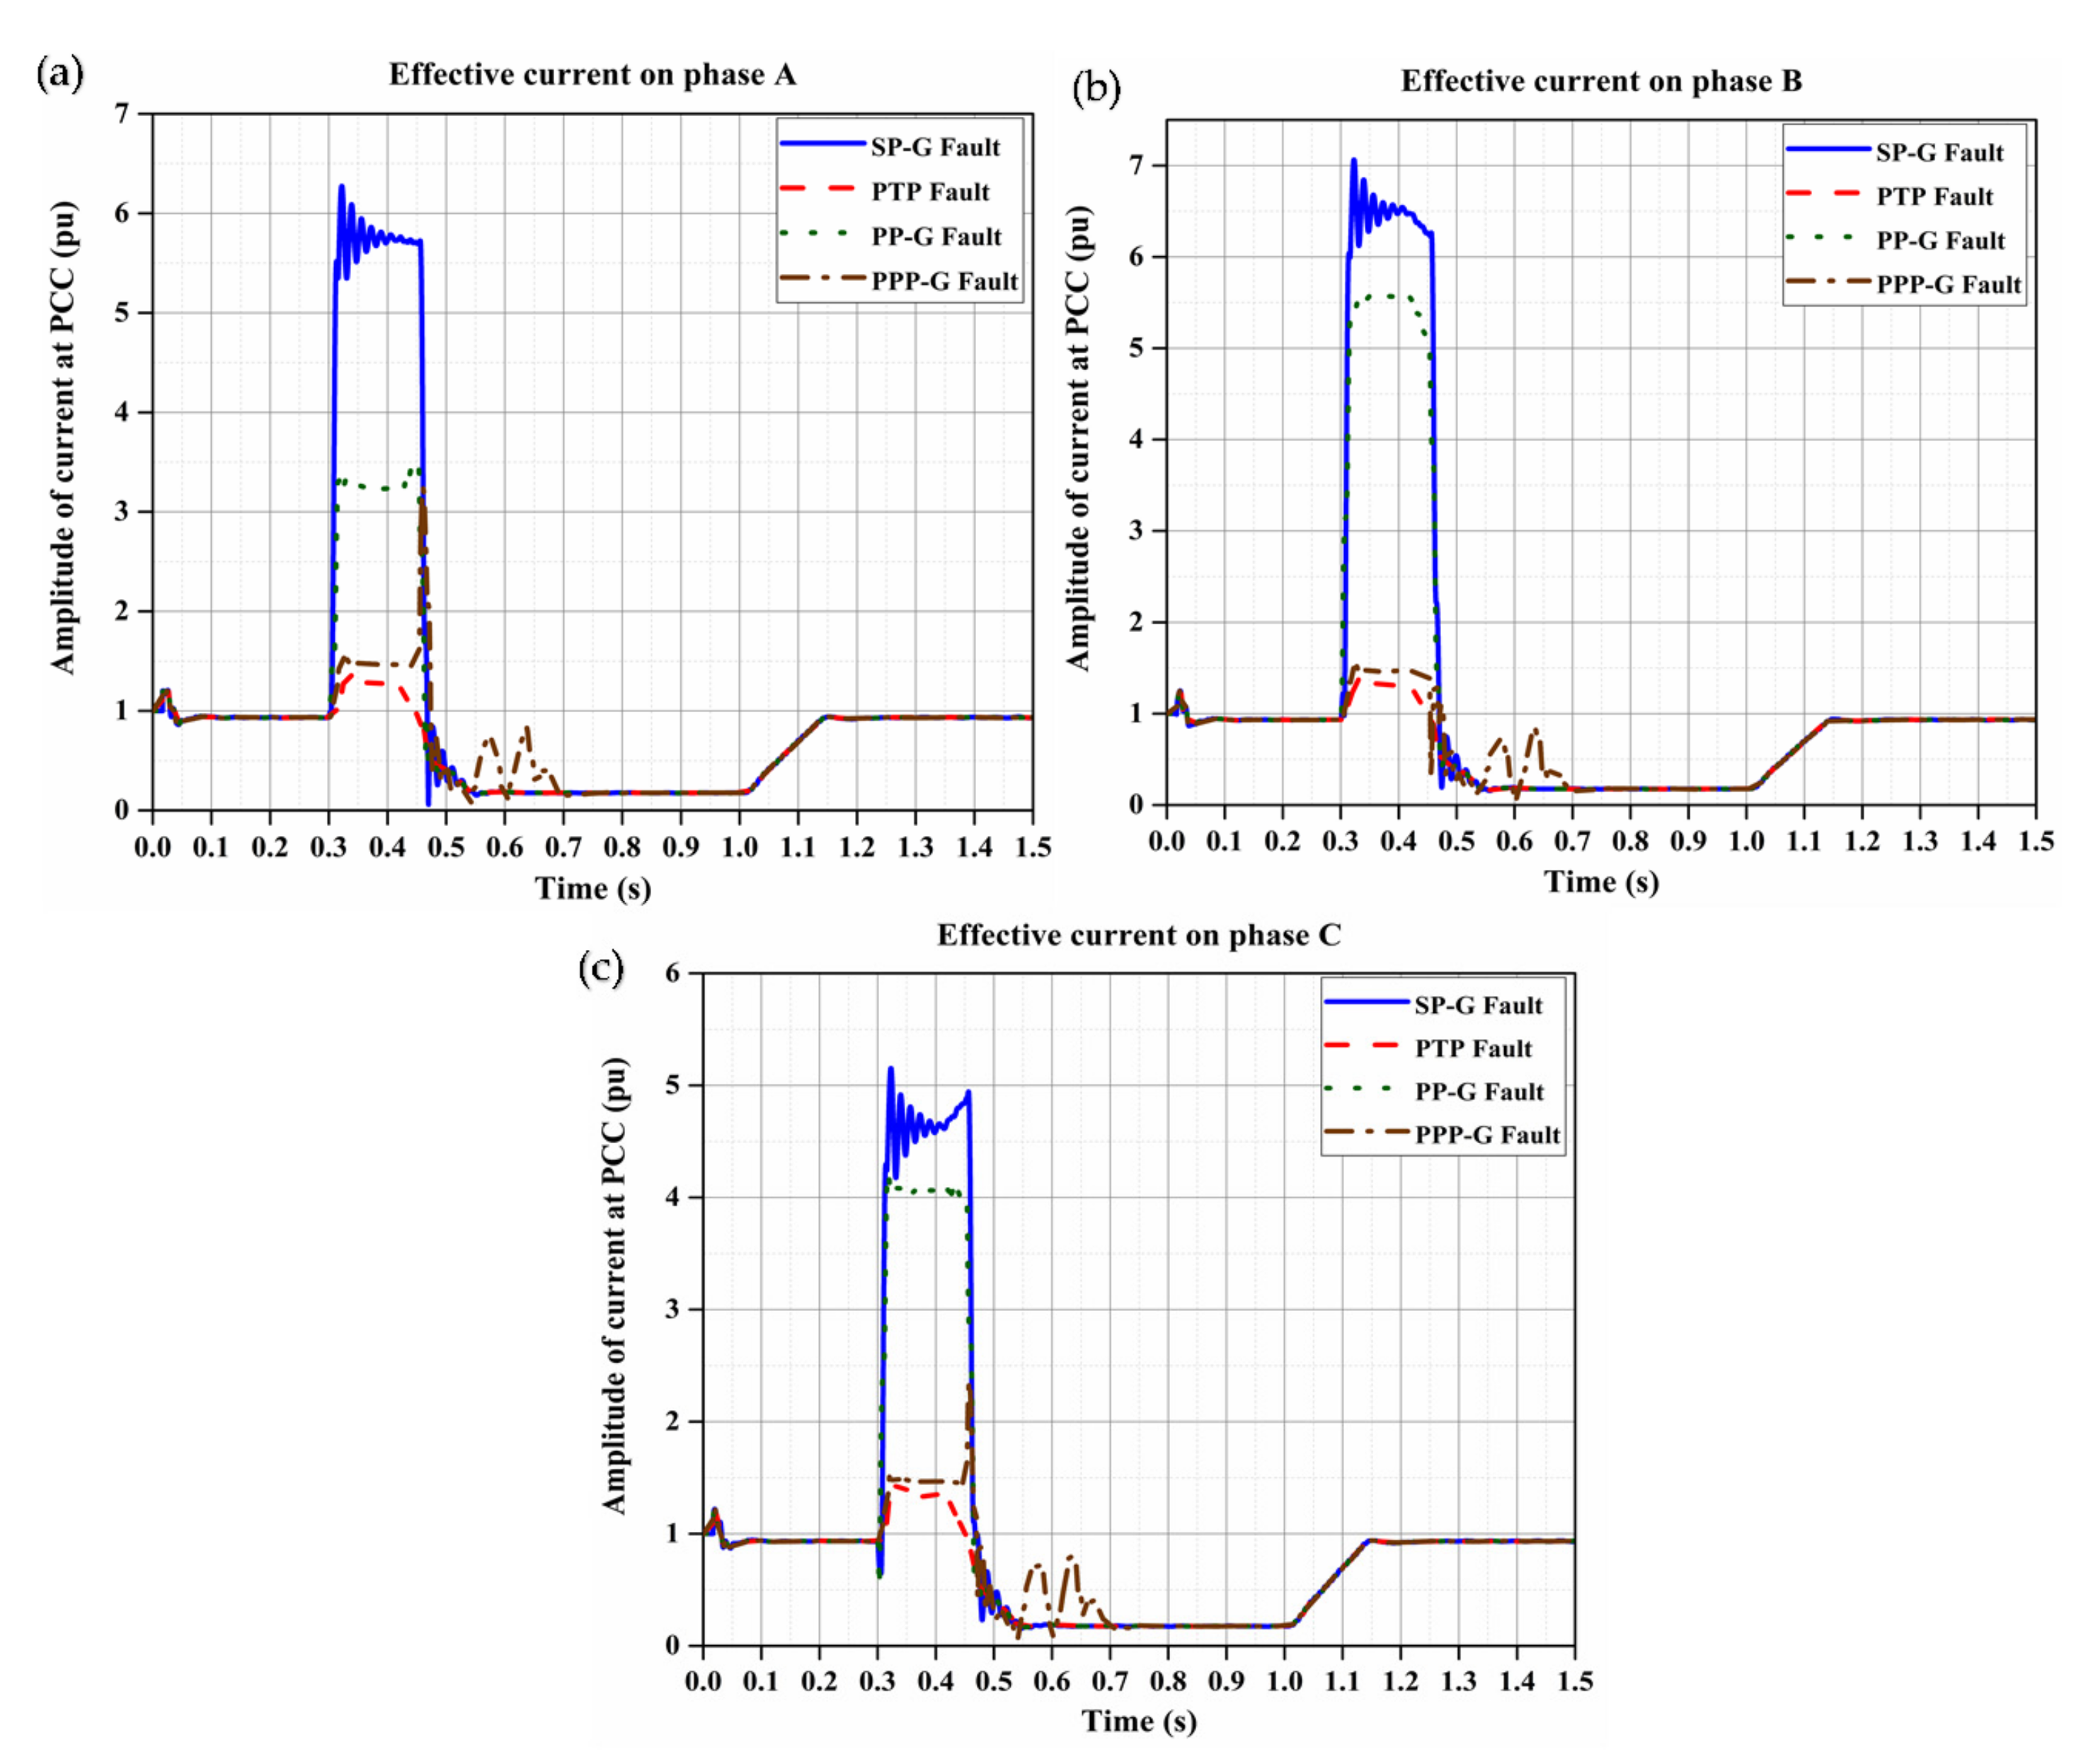
The measured effective value of the PCC voltage and current under grid faults, i.e., SP-G fault, PTP fault, PP-G fault and PPP-G, at a distance of 8 km from the PCC with a fault resistance of 200 ohm are illustrated in Figure 4 and Figure 5. Figure 4 shows the variations of amplitude of the effective PCC voltage in different phases. As seen, in phase A, the amplitude of the effective PCC voltage for all types of faults decreased significantly, whilst in phase B the amplitude of voltage increased only under SP-G faults.
This increase in amplitude of the PCC voltage was observed during SP-G, PTP, and PP-G faults, whilst the effective PCC voltage during PPP-G fault decreased in each of the three phases. Figure 5 shows that the highest and lowest values of the short circuit current belonged to ground faults and line to line faults, respectively.
Figure 6 shows the changes of the PCC frequency under fault conditions at a distance of 8 km from the PCC. As seen, during PPP-G faults, the frequency exceeded the boundaries imposed by the grid standards regardless of the fault location, whilst for PP-G, PTP, and SP-G faults, the frequency rose, but stayed inside the threshold.
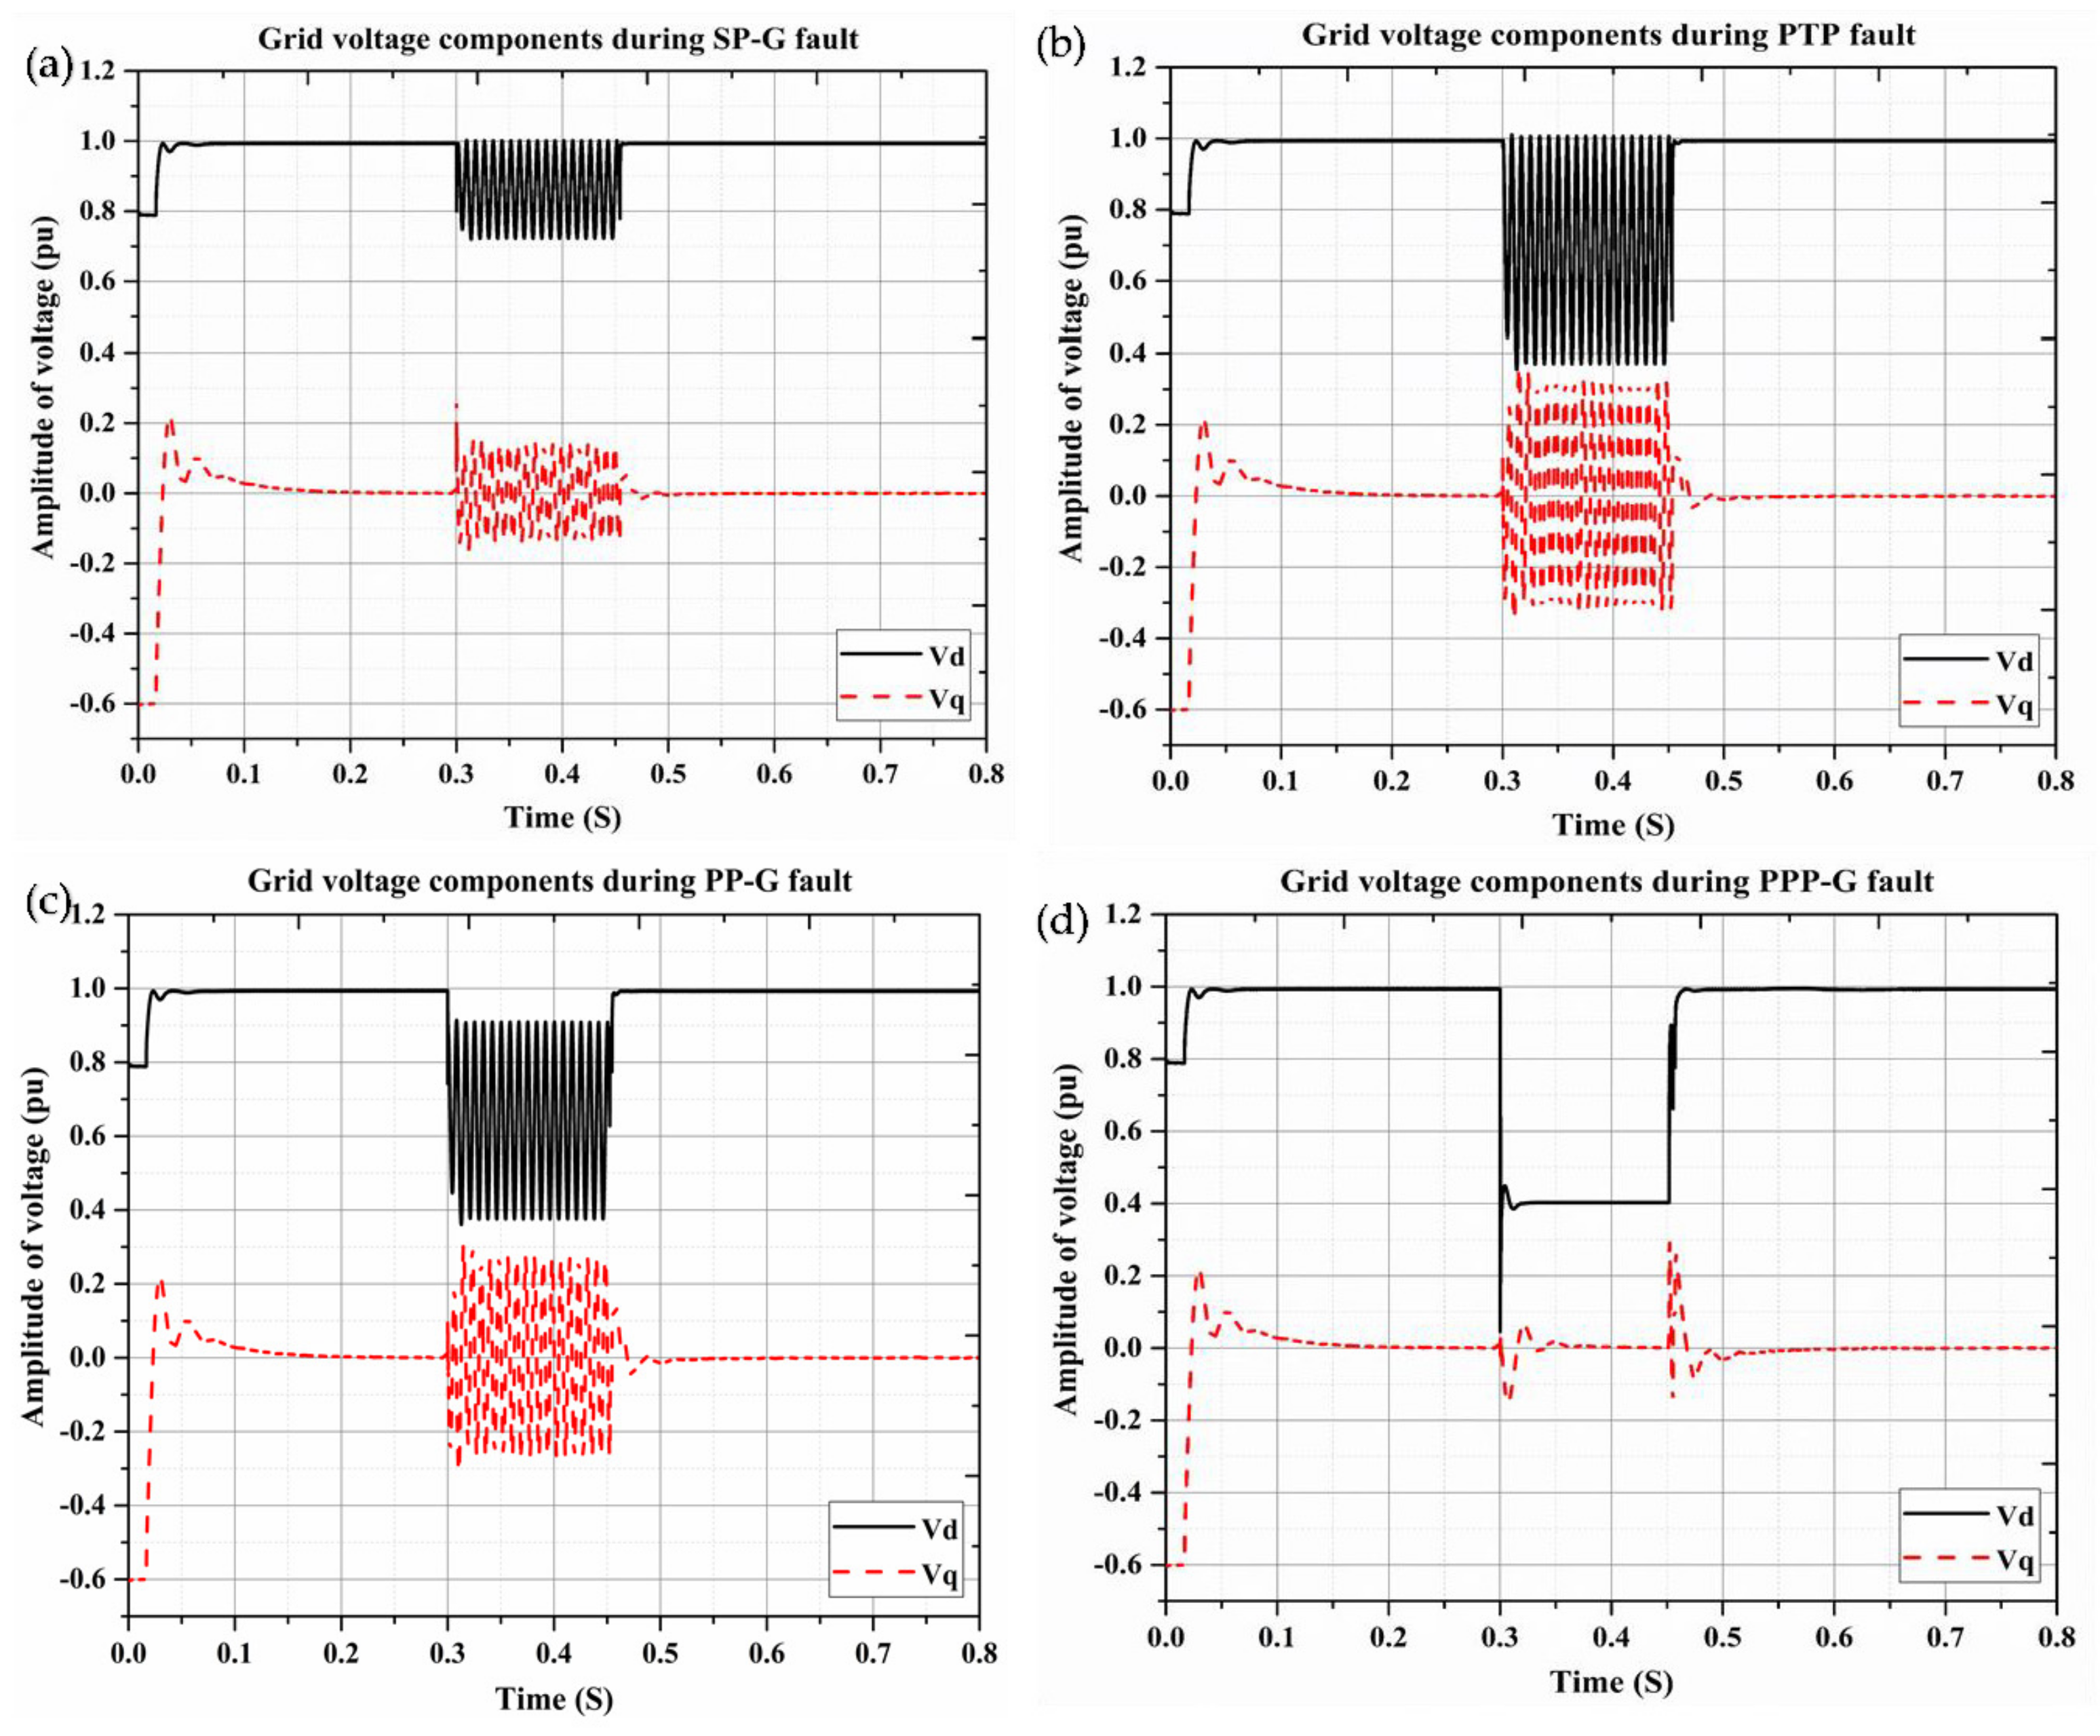
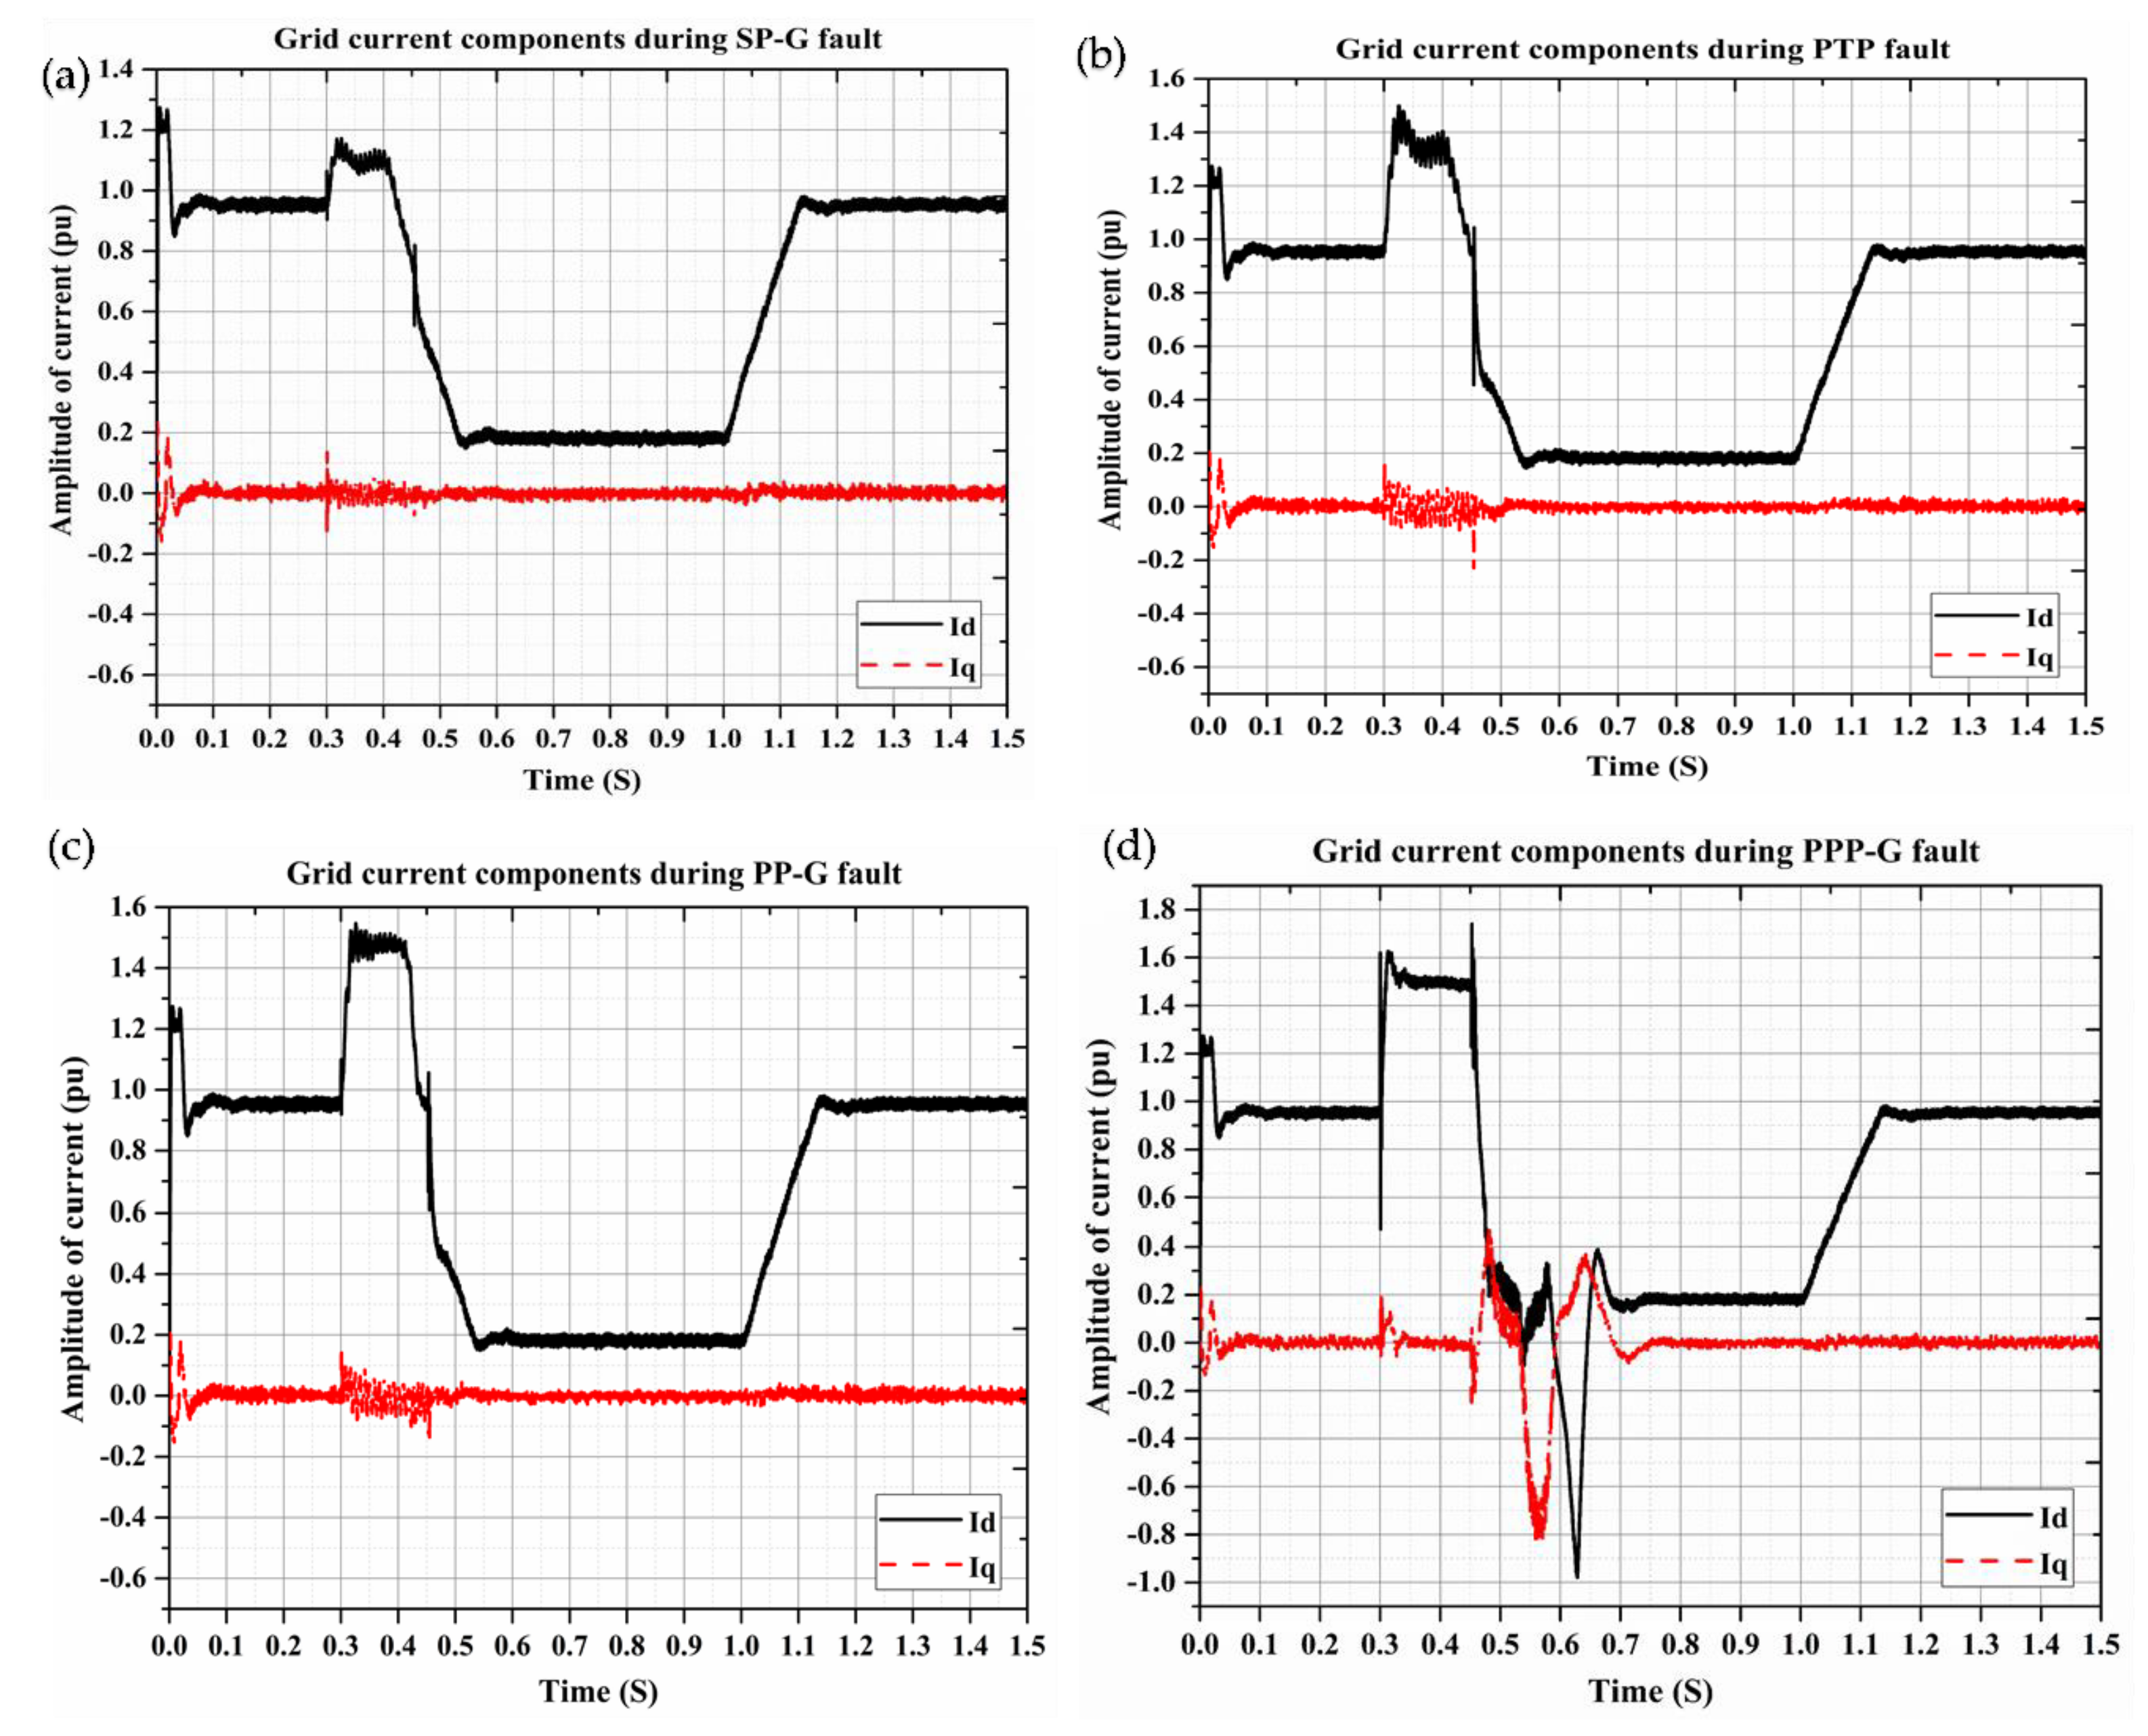
Moreover, two important components, i.e., voltage components and current components, are illustrated in Figure 7 and Figure 8 during different types of faults at 8 km away from the PCC. The mentioned components were computed in the phase locked loop (PLL) and measurements block of the voltage source control (VSC), as explained in [38], by means of the abc to dq0 transformation. When Id is positive, the converter produces active power and engages reactive power once Iq is in inductive mode [38].
The modulation index of Uabc_ref, utilized by the pulse-width modulation (PWM) generator of VSC [38], can be seen in Figure 9 during fault conditions at a distance of 8 km from the PCC.
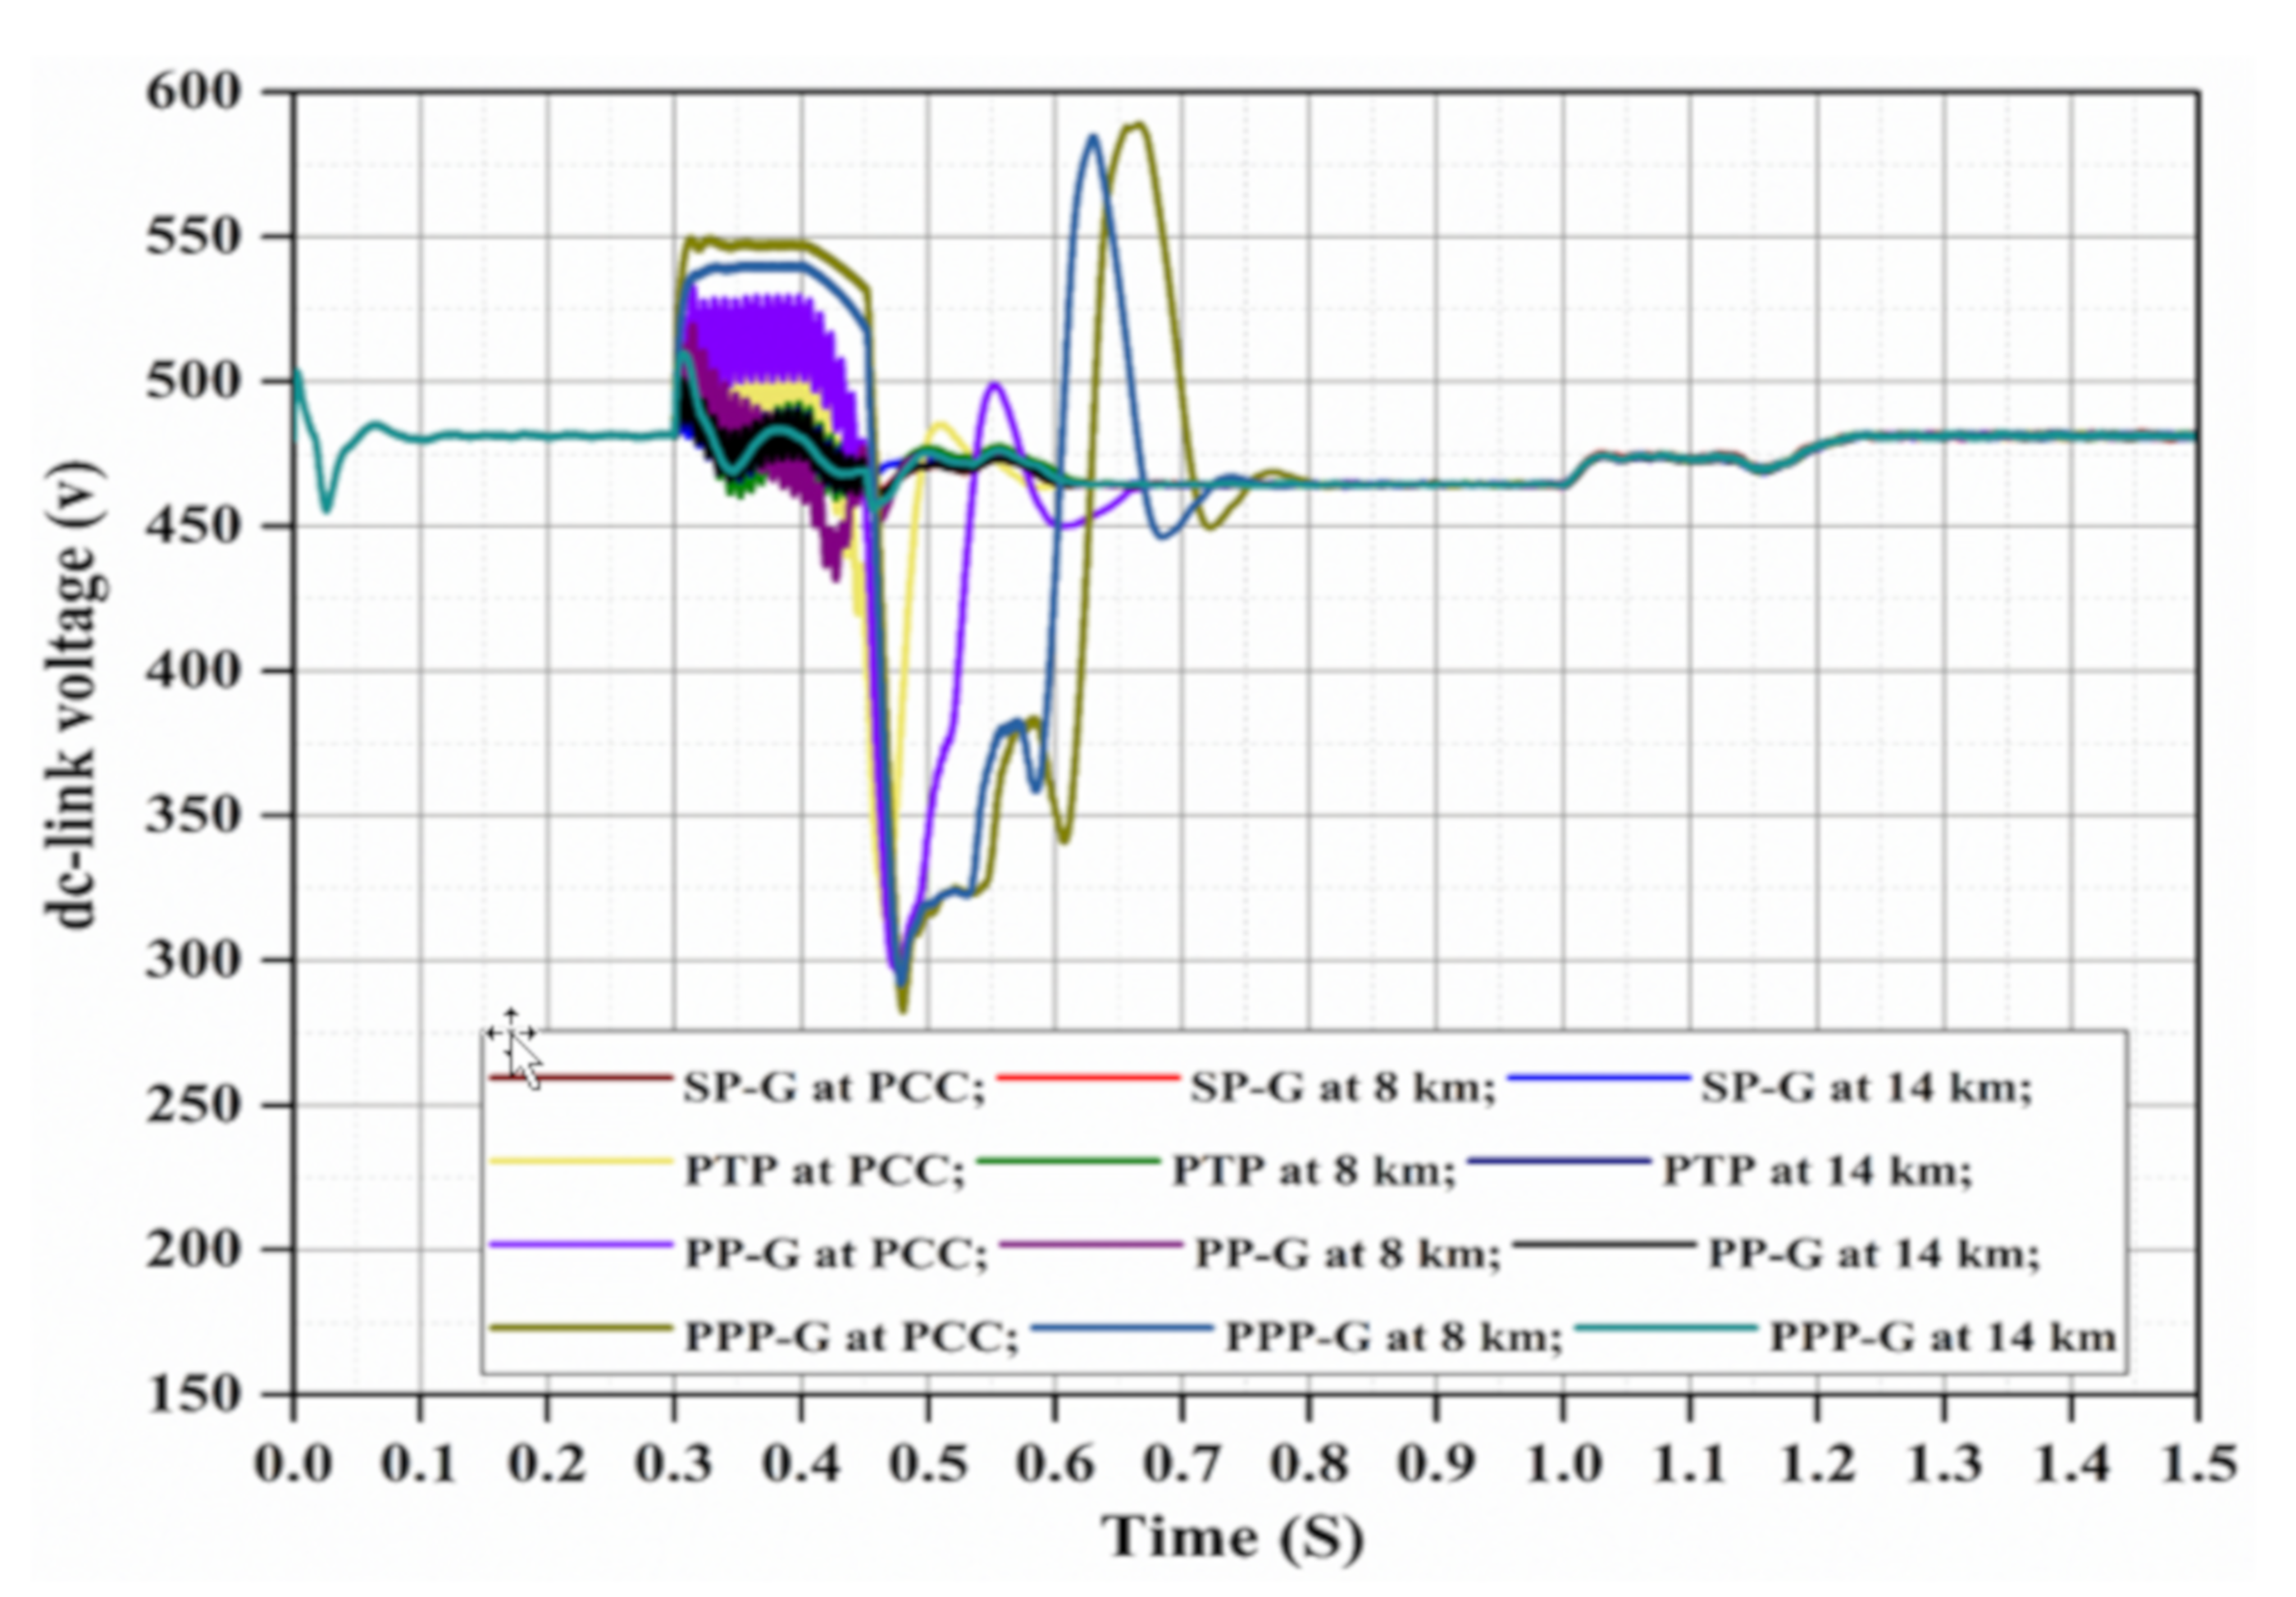
The dc-link voltage fluctuation for all types of grid faults at different fault locations is illustrated in Figure 10. As seen, when the grid faults occurred, the dc-link voltage of PTP, PP-G, and PPP-G faults increased whilst their dc-link voltage reduced after the faults were cleared. Furthermore, for SP-G faults, the dc-link voltage fluctuations were opposite to the frequency changes.
The output PV voltage, current, and diode current [38] during different grid fault conditions that occurred 8 km from the PCC are illustrated in Figure 11. The variation of the PV voltage and current is clearly visible. The rising and dropping of the magnitude of voltage and current at the occurrence of the fault and at the fault clearance can be seen. For the diode current, as expected, the variation of the current is the same as the variation of the PV voltage and current during the grid faults. This influence is more noticeable for PPP-G faults, as can be observed in Figure 11.

7. Discussions

The obtained results indicate that the proposed protection scheme based on WMRSSE and SVM can easily detect symmetrical and asymmetrical faults in PV systems. As shown in Figure 1, the trip signal is activated to command the disconnection of the PV system if faults are detected. In the case of symmetrical faults where the effects are severe, the proposed protection scheme has no problem detecting them and thus can avoid relay maloperations. It is worth mentioning that extracted features based on MRSSE are stable for similar types of signals and samples. This capability gives the proposed technique two advantages, i.e., it is easy to implement and feasible to detect and classify grid faults. Finally, using the optimal combination of both parameters— C = 8 and γ = 0.125 —the overall detection accuracy for the training data set and test data set reached 100%. The obtained results suggest that the proposed method is robust and accurate and can also be used for multiple distributed generation systems. A comparison between the performance of the proposed protection scheme with previous related works in terms of overall fault detection and classification accuracy is shown in Table 6. Most of the mentioned techniques have an acceptable performance to detect and classify grid faults with a fairly high accuracy. However, only a few of the referenced techniques evaluated their performance under noisy conditions. It is worth mentioning that the proposed protection scheme not only has an acceptable performance in terms of detecting and classifying grid faults in ideal and noisy conditions, but is also quick to identify them in real time.

8. Conclusions

In this paper, a protection scheme based on wavelet multi-resolution singular spectrum entropy and support vector machine is proposed to detect and classify different types of faults in a grid-tied photovoltaic system. Wavelet multi-resolution singular spectrum entropy is compounded wavelet transform and multi-resolution singular spectrum entropy, which is used to extract the prominent features of the PCC voltage as input data of a support vector machine that is able to react in fault detection and classification. The results determine which wavelet multi-resolution singular spectrum entropy is not sensitive to noise and sudden changes in signals and has the ability to detect grid faults of different types, at varying distances, and in different situations. Furthermore, it is proven that the proposed intelligent method not only recognizes different types of grid faults correctly, but also performs quickly in identifying grid faults in grid-connected photovoltaic systems. The classification and detection accuracies of the proposed protection scheme are 100% and its detection time is less than 0.12 ms. The algorithm is simple and easy to execute. Apart from this, a graphical investigation is shown to observe the effects of different types of grid faults on PV operation, highlighting the necessity of intelligent protection methods to protect PV systems.
There is still a lack of more complex conditions which need to be studied and solved by applying the proposed protection scheme in multiple DG systems in the future.

Author Contributions

M.A. proposed the research topic with H.H. M.A. took part in discussing the results and gave valuable input. He also wrote the conclusion and wrote most of the paper with H.H. and N.C.H. M.L.O and M.A.M.R. took part in revising the paper and validated the idea as well as reviewed the final paper with M.A. and N.C.H.

Funding

This research received no external funding.

Conflicts of Interest

The authors declare no conflict of interest.

Nomenclature

PVPhotovoltaic
PCCPoint of common coupling
DGDistributed generation
DWTDiscrete wavelet transform
SVMSupport vector machine
f ( k ) Discrete signal
ψ ( . ) Mother wavelet
ψ m , n * Discrete mother wavelet
MRAMulti-resolution analysis
MRSSEMulti-resolution singular spectrum entropy
WMRSSEWavelet multi-resolution singular spectrum entropy
H Low-pass filter
G High-pass filter
c j Approximate parts
d j Detailed parts
j Decomposition layer
M c o e f f Coefficient vector
H * Dual operator of H
G * Dual operator of G
Λ l * l Nonzero diagonal element
H j Information entropy of level j
P j i Undefined probability distribution of the nonzero diagonal elements
𝓌 Weight vector normal to hyperplane
b Bias
ξ r Slack variable
k ( x r , x s ) Kernel function
RBFRadial basis function
SP-GSingle phase to ground fault
PP-GPhase to phase to ground fault
PPP-GThree phase to ground fault
PTPPhase to phase fault
SNRSignal to noise ratio
PWMPulse-width modulation
PLLPhase locked loop
VSCVoltage source control

References

  1. Jäger-Waldau, A. Snapshot of photovoltaics—March 2017. Sustainability 2017, 9, 783. [Google Scholar] [CrossRef]
  2. Masson, G.; Latour, M.; Biancardi, D. Global Market Outlook for Photovoltaics until 2016; EPIA–European Photovoltaic Industry Association: Bruxelas, Belgium, 2012. [Google Scholar]
  3. Colli, A. Failure mode and effect analysis for photovoltaic systems. Renew. Sustain Energy Rev. 2015, 50, 804–809. [Google Scholar] [CrossRef]
  4. Alam, M.K.; Khan, F.; Johnson, J.; Flicker, J. A comprehensive review of catastrophic faults in PV arrays: Types, detection, and mitigation techniques. IEEE J. Photovolt. 2015, 59, 82–97. [Google Scholar] [CrossRef]
  5. Falvo, M.C.; Capparella, S. Safety issues in PV systems: Design choices for a secure fault detection and for preventing fire risk. Case Stud. Fire Saf. 2015, 3, 1–6. [Google Scholar] [CrossRef]
  6. Mellit, A.; Tina, G.M.; Kalogirou, S.A. Fault detection and diagnosis methods for photovoltaic systems: A review. Renew. Sustain. Energy Rev. 2018, 91, 1–7. [Google Scholar] [CrossRef]
  7. Van der Walt, H.L.; Bansal, R.C.; Naidoo, R. PV based distributed generation power system protection: A review. Renew. Energy Focus 2018, 24, 33–40. [Google Scholar] [CrossRef]
  8. Madeti, S.R.; Singh, S.N. A comprehensive study on different types of faults and detection techniques for solar photovoltaic system. Sol. Energy 2017, 158, 161–185. [Google Scholar] [CrossRef]
  9. Gururajapathy, S.S.; Mokhlis, H.; Illias, H.A. Fault location and detection techniques in power distribution systems with distributed generation: A review. Renew. Sustain. Energy Rev. 2017, 74, 949–958. [Google Scholar] [CrossRef]
  10. Freitas, W.; Xu, W.; Affonso, C.M.; Huang, Z. Comparative analysis between ROCOF and vector surge relays for distributed generation applications. IEEE Trans. Power Deliv. 2005, 20, 1315–1324. [Google Scholar] [CrossRef]
  11. Freitas, W.; Xu, W. False operation of vector surge relays. IEEE Trans. Power Deliv. 2004, 19, 436–438. [Google Scholar] [CrossRef]
  12. Xin-min, T.; Wan-Hai, C.; Bao-Xiang, D.; Han-Guang, D. A Novel Model of one-class Bearing Fault Detection using RNCS Algorithm based on HOS. In Proceedings of the 2007 2nd IEEE Conference on Industrial Electronics and Applications, Harbin, China, 23 May 2007; pp. 965–970. [Google Scholar]
  13. Ndou, R.; Fadiran, J.I.; Chowdhury, S.; Chowdhury, S.P. Performance comparison of voltage and frequency based loss of grid protection schemes for microgrids. In Proceedings of the 2013 IEEE Power & Energy Society General Meeting, Vancouver, BC, Canada, 21 July 2013; pp. 1–5. [Google Scholar]
  14. Wang, G.; Youn, C.C.; Stankovic, A.M. DC-side high impedance ground fault detection for transformerless single-phase PV systems. In Proceedings of the 2015 North American Power Symposium (NAPS), Charlotte, NC, USA, 4 October 2015; pp. 1–6. [Google Scholar] [CrossRef]
  15. He, Q.; Blum, R.S. New hypothesis testing-based methods for fault detection for smart grid systems. In Proceedings of the 2011 45th Annual Conference on Information Sciences and Systems, Baltimore, MD, USA, 23–25 March 2011; pp. 1–6. [Google Scholar] [CrossRef]
  16. Chybowski, L. Application of External Events Vectors for Defining Reliability Structure of Fishing Vessels Power, Propulsion and Technological Plants. Pol. J. Environ. Stud. 2009, 18, 45–50. [Google Scholar]
  17. Ahmadipour, M.; Hizam, H.; Othman, M.L.; Radzi, M.A.; Murthy, A.S. Islanding detection technique using Slantlet Transform and Ridgelet Probabilistic Neural Network in grid-connected photovoltaic system. Appl. Energy. 2018, 231, 645–659. [Google Scholar] [CrossRef]
  18. Dehghani, M.; Khooban, M.H.; Niknam, T. Fast fault detection and classification based on a combination of wavelet singular entropy theory and fuzzy logic in distribution lines in the presence of distributed generations. Int. J. Electr. Power Energy Syst. 2016, 78, 455–462. [Google Scholar] [CrossRef]
  19. Ahmadipour, M.; Hizam, H.; Lutfi Othman, M.; Amran Mohd Radzi, M. An Anti-Islanding Protection Technique Using a Wavelet Packet Transform and a Probabilistic Neural Network. Energies 2018, 11, 2701. [Google Scholar] [CrossRef]
  20. Chiacchio, F.; Famoso, F.; D’Urso, D.; Brusca, S.; Aizpurua, J.; Cedola, L. Dynamic performance evaluation of photovoltaic power plant by stochastic hybrid fault tree automaton model. Energies 2018, 11, 306. [Google Scholar] [CrossRef]
  21. Chaitanya, B.K.; Yadav, A. An intelligent fault detection and classification scheme for distribution lines integrated with distributed generators. Comput. Electr. Eng. 2018, 69, 28–40. [Google Scholar] [CrossRef]
  22. Dashti, R.; Ghasemi, M.; Daisy, M. Fault location in power distribution network with presence of distributed generation resources using impedance based method and applying π line model. Energy 2018, 159, 344–360. [Google Scholar] [CrossRef]
  23. Yi, Z.; Etemadi, A.H. Fault detection for photovoltaic systems based on multi-resolution signal decomposition and fuzzy inference systems. IEEE Trans. Smart Grid 2017, 8, 1274–1283. [Google Scholar] [CrossRef]
  24. Kuo, C.L.; Chen, J.L.; Chen, S.J.; Kao, C.C.; Yau, H.T.; Lin, C.H. Photovoltaic energy conversion system fault detection using fractional-order color relation classifier in microdistribution systems. IEEE Trans. Smart Grid 2017, 8, 1163–1172. [Google Scholar] [CrossRef]
  25. Kumar, B.P.; Ilango, G.S.; Reddy, M.J.; Chilakapati, N. Online fault detection and diagnosis in photovoltaic systems using wavelet packets. IEEE J. Photovolt. 2018, 8, 257–265. [Google Scholar] [CrossRef]
  26. Xia, K.; He, S.; Tan, Y.; Jiang, Q.; Xu, J.; Yu, W. Wavelet packet and support vector machine analysis of series DC ARC fault detection in photovoltaic system. IEEJ Trans. Electr. Electron. Eng. 2019, 14, 192–200. [Google Scholar] [CrossRef]
  27. Baghli, M.; Delpha, C.; Diallo, D.; Hallouche, A.; Mba, D.; Wang, T. Three-Level NPC Inverter Incipient Fault Detection and Classification using Output Current Statistical Analysis. Energies 2019, 12, 1372. [Google Scholar] [CrossRef]
  28. Zhu, Q.; Li, Z.; Tan, X.; Xie, D.; Dai, W. Sensors Fault Diagnosis and Active Fault-Tolerant Control for PMSM Drive Systems Based on a Composite Sliding Mode Observer. Energies 2019, 12, 1695. [Google Scholar] [CrossRef]
  29. Dasgupta, A.; Nath, S.; Das, A. Transmission line fault classification and location using wavelet entropy and neural network. Electr. Power Compon. Syst. 2012, 40, 1676–1689. [Google Scholar] [CrossRef]
  30. Khokhar, S.; Zin, A.A.; Memon, A.P.; Mokhtar, A.S. A new optimal feature selection algorithm for classification of power quality disturbances using discrete wavelet transform and probabilistic neural network. Measurement 2017, 95, 246–259. [Google Scholar] [CrossRef]
  31. Mallat, SG. A theory for multiresolution signal decomposition: The wavelet representation. IEEE Trans. Pattern Anal. Mach. Intell. 1989, 11, 674–693. [Google Scholar] [CrossRef]
  32. Jahedi, G.; Ardehali, M.M. Wavelet based artificial neural network applied for energy efficiency enhancement of decoupled HVAC system. Energy Convers. Manag. 2012, 54, 47–56. [Google Scholar] [CrossRef]
  33. Kong, X.; Xu, X.; Yan, Z.; Chen, S.; Yang, H.; Han, D. Deep learning hybrid method for islanding detection in distributed generation. Appl. Energy 2018, 210, 776–785. [Google Scholar] [CrossRef]
  34. Cortes, C.; Vapnik, V. Support-vector networks. Mach. Learn. 1995, 20, 237–297. [Google Scholar] [CrossRef]
  35. Cristianini, N.; Shawe-Taylor, J. An Introduction to Support Vector Machines and Other Kernel-Based Learning Methods; Cambridge University Press: London, UK, 2000. [Google Scholar]
  36. Samet, H.; Hashemi, F.; Ghanbari, T. Minimum non detection zone for islanding detection using an optimal Artificial Neural Network algorithm based on PSO. Renew. Sustain. Energy Rev. 2015, 52, 1–8. [Google Scholar] [CrossRef]
  37. Shahid, N.; Aleem, S.A.; Naqvi, I.H.; Zaffar, N. Support vector machine based fault detection & classification in smart grids. In Proceedings of the 2012 IEEE Globecom Workshops, Anaheim, CA, USA, 3–7 December 2012; pp. 1526–1531. [Google Scholar] [CrossRef]
  38. Laagoubi, T.; Bouzi, M.; Benchagra, M. MPPT and power factor control for grid connected PV systems with fuzzy logic controllers. Int. J. Power Electron. Drive Syst. 2018, 9, 105. [Google Scholar] [CrossRef]
  39. Wang, N.; Aravinthan, V.; Ding, Y. Feeder-level fault detection and classification with multiple sensors: A smart grid scenario. In Proceedings of the 2014 IEEE Workshop on Statistical Signal Processing (SSP), Gold Coast, Australia, 29 June–2 July 2014; pp. 37–40. [Google Scholar] [CrossRef]
  40. Klomjit, J.; Ngaopitakkul, A. Selection of proper input pattern in fuzzy logic algorithm for classifying the fault type in underground distribution system. In Proceedings of the 2016 IEEE Region 10 Conference (TENCON), Singapore, 22–25 November 2016; pp. 2650–2655. [Google Scholar] [CrossRef]
  41. Shafiullah, M.; Abido, M.A. S-Transform based FFNN approach for distribution grids fault detection and classification. IEEE Access 2018, 6, 8080–8088. [Google Scholar] [CrossRef]
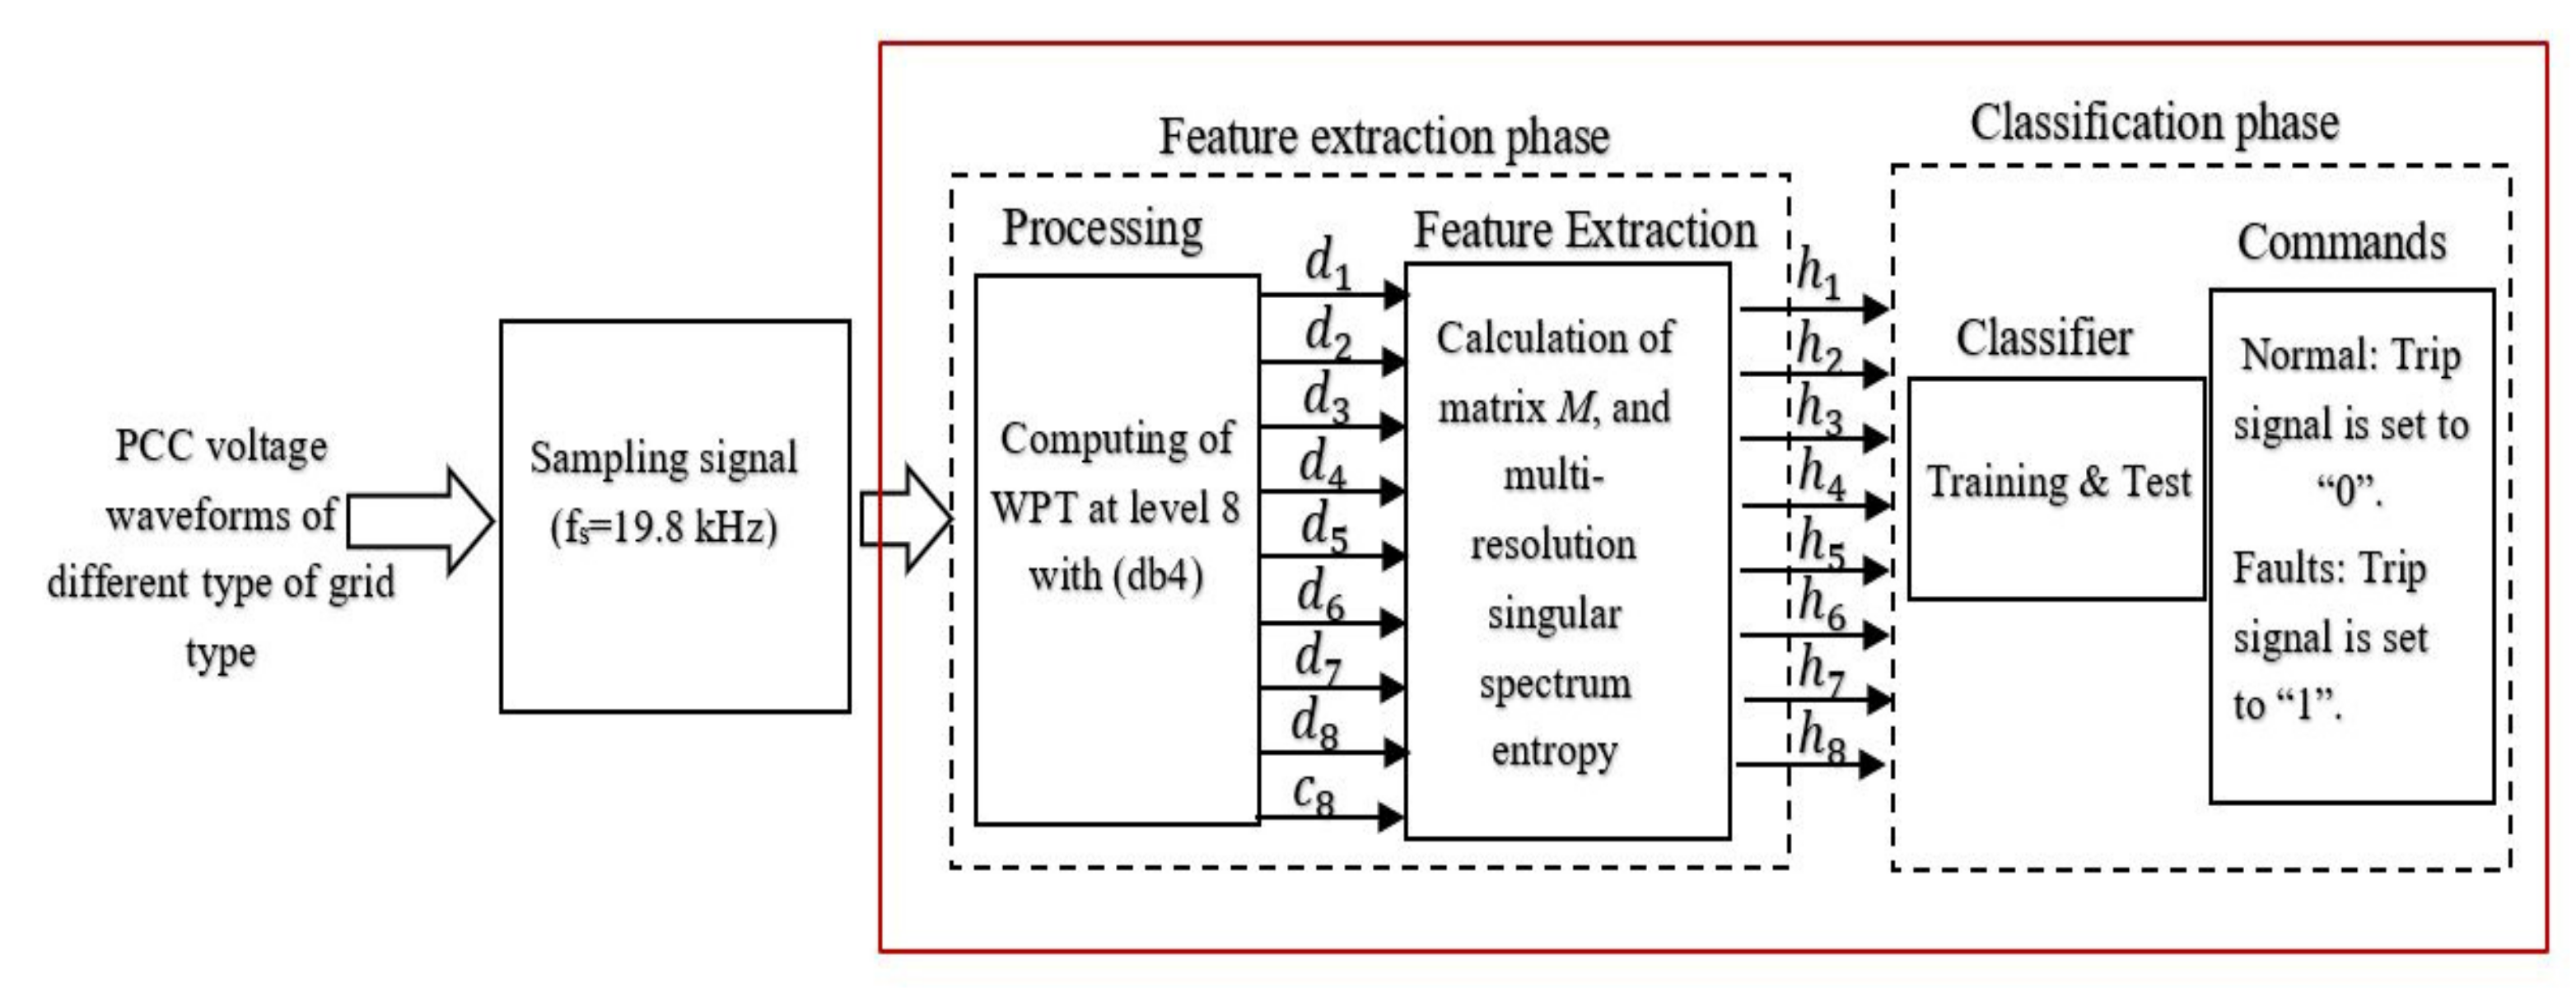
Figure 1. Structure of the proposed protection scheme.
Energies 12 02508 g001
Figure 2. Structure of the studied system.
Energies 12 02508 g002
Figure 3. (aj) Wavelet decomposition levels of the point of common coupling (PCC) voltage signal at phase A during three phase to ground (PPP-G) fault condition.
Energies 12 02508 g003aEnergies 12 02508 g003b
Figure 4. (ac) The changes of effective values of the PCC voltage during grid fault conditions in different phases.
Energies 12 02508 g004
Figure 5. (ac) The variations of effective values of the PCC current during grid fault conditions in different phases.
Energies 12 02508 g005
Figure 6. The variations of frequency at the PCC during grid fault conditions.
Energies 12 02508 g006
Figure 7. (ad) The Vd and Vq grid voltage components during grid faults.
Energies 12 02508 g007
Figure 8. (ad) The Id and Iq grid current components during grid faults.
Energies 12 02508 g008
Figure 9. (ad) The modulation index of Uabc_ref used by the pulse-width modulation (PWM) generator of the voltage source control (VSC).
Energies 12 02508 g009
Figure 10. Variation of the dc-link voltage under grid fault conditions at different distances away from the PCC.
Energies 12 02508 g010
Figure 11. (a) The output photovoltaic (PV) voltage; (b) the output PV current; (c) the PV diode current under grid fault conditions 8 km away from the PCC.
Energies 12 02508 g011
Table 1. The entropy values of different fault types.
CasesFault Typeh1h2h3h4h5h6h7h8
Single phase to ground faultA-G1.6519161.813762.0875692.2403752.3324711.8220761.5157681.212614
B-G1.5841561.6758411.9858082.1920212.2892221.7915971.4904121.19233
C-G1.6058481.7072862.0190932.2091352.3239371.8231471.5166591.213327
Phases to phase faultAB2.2816222.3330292.6264073.0222573.1755122.517772.0945091.675608
AC2.1947322.3104592.7637543.0403233.1741812.4577862.0446091.635687
BC2.1921872.3112522.7658033.0373063.1725452.4557892.0429481.634358
Phase to phase to ground faultAB-G2.42012.5282622.8461913.2751663.4412462.7284632.2697831.815826
AC-G2.3783922.5038032.9950313.2947443.4398042.6634592.2157061.772565
BC-G2.3756342.5046632.9972523.2914753.4380312.6612952.2139061.771125
Three phase to ground faultABC-G3.694084.0560014.6683045.0100145.2159634.0745973.3896192.711695
Normal-0.5679160.6235560.717690.7702230.8018850.6264150.5211090.416887
Table 2. The entropy values of different fault types with noise.
CasesFault Typeh1h2h3h4h5h6h7h8
SP-GA-G1.8560422.0378852.3455282.5172162.6206922.0472281.703071.362456
B-G1.7799081.8829242.2311922.4628862.5720992.0129821.6745811.339665
C-G1.8042811.9182542.2685912.4821162.6111042.0484311.7040711.363257
PTPAB2.5635592.6213192.950953.3957143.5679072.8288882.3533261.882661
AC2.4659332.595963.1052683.4160123.5664122.7614922.2972591.837807
BC2.4630732.5968513.1075713.4126233.5645732.7592482.2953931.836314
PP-GAB-G2.719152.8406773.1978923.6798753.8664773.0656162.5502582.040206
AC-G2.6722882.8131963.3651243.7018723.8648572.992582.4894991.991599
BC-G2.6691892.8141623.367623.6981993.8628652.9901482.4874761.989981
PPP-GABC-G4.1505534.5571975.2451615.6290965.8604944.578093.8084713.046777
Table 3. Support vector machine (SVM) classification results at different values of parameters C and γ .
CasesFault TypeF-Measure (%)Accuracy (%)
C   =   512 ;   γ = 2 C   =   32 ;   γ = 0.3125 C   =   4 ;   γ = 0.25 C   =   8 ;   γ = 0.125 C   =   512 ;   γ = 2 C   =   32 ;   γ = 0.3125 C   =   4 ;   γ = 0.25 C = 8; γ = 0.125
SP-GA-G75.5555682.7586288.3720910098.4415698.9743699.49109100
B-G77.7777882.7586288.3720910098.7046698.9743699.49109100
C-G77.7777882.3529488.0952410098.7046698.7212399.23858100
PTPAB78.6516985.0574788.0952410098.7080199.2327499.23858100
AC78.6516982.7586288.3720910098.7080198.9743699.49109100
BC76.9230882.3529489.4117610098.701398.7212399.49239100
PP-GAB-G79.1208883.3333391.7647110098.9637398.7244999.74684100
AC-G75.5555683.3333391.7647110098.4415698.7244999.74684100
BC-G75.5555685.7142992.6829310098.4415698.9821999.49622100
PPP-GABC-G79.1208890.243997.5609810098.9637399.24242100100
Table 4. Classification results of different types of events.
CasesClassification AccuracyDetection AccuracyResponse Time
SP-G100%100%7 ms after fault occurrence
PTP100%100%8 ms after fault occurrence
PP-G100%100%9 ms after fault occurrence
PPP-G100%100%8 ms after fault occurrence
Overall100%100%11 ms
Table 5. Comparison results of different protection schemes.
ReferenceProtection SchemeClassification AccuracyDetection Accuracy
SP-GPTPPP-GPPP-GSP-GPTPPP-GPPP-GOverall
[37]QS + SVM----80%88.2%84.35%99.33%89.67%
TAQS + SVM----96.1%99.8%96.52%99.33%98.1%
A-QS + SVM99.4%99.1%99%98.7%-----
[18]WSE + FL100%100%100%100%100%100%100%100%100%
-Proposed Method100%100%100%100%100%100%100%100%100%
Table 6. Comparison of the performance of the proposed protection scheme with previous related works.
ReferencesMethodOverall Detection AccuracyOverall Classification Accuracy
Without NoiseWith NoiseWithout NoiseWith Noise
[18]WSE + FL100%Not evaluated100%Not evaluated
[37]Temporal attribute QSSVM98.10%Not evaluatedNot evaluatedNot evaluated
[37]Attribute QSSVMNot evaluatedNot evaluated99.05%Not evaluated
[39]Principle component analysis based SVM99.74%99.79% (30 dB), 99.77% (20 dB)99.93%99.77% (30 dB), 99.70% (20 dB)
[40]Wavelet based fuzzy logic algorithm Not evaluatedNot evaluated89.50%Not evaluated
[41]Hybrid ST approach99.9%99.9% (40 dB), 99.6% (20 dB)99.47%99.33% (40 dB), 99.02% (20 dB)
Proposed MethodWMRSSE + SVM100%100% (20 dB)100%100% (20 dB)