Article

Analyzing the Interaction of Vortex and Gas–Liquid Interface Dynamics in Fuel Spray Nozzles by Means of Lagrangian-Coherent Structures (2D)

1
Institut für Thermische Strömungsmaschinen (ITS), Karlsruher Institut für Technologie (KIT), Kaiserstraße 12, 76131 Karlsruhe, Germany
2
Institut für Visualisierung und Datenanalyse (IVD), Karlsruher Institut für Technologie (KIT), Am Fasanengarten 5, 76131 Karlsruhe, Germany
*
Author to whom correspondence should be addressed.
These authors contributed equally to this work.
Energies 2019, 12(13), 2552; https://doi.org/10.3390/en12132552
Submission received: 14 May 2019 / Revised: 21 June 2019 / Accepted: 24 June 2019 / Published: 2 July 2019
(This article belongs to the Special Issue Experimental and Numerical Analysis of Fuel Spray in Engines)

Abstract

:
Predictions of the primary breakup of fuel in realistic fuel spray nozzles for aero-engine combustors by means of the SPH method are presented. Based on simulations in 2D, novel insights into the fundamental effects of primary breakup are established by analyzing the dynamics of Lagrangian-coherent structures (LCSs). An in-house visualization and data exploration platform is used in order to retrieve fields of the finite-time Lyapunov exponent (FTLE) derived from the SPH predictions aiming at the identification of time resolved LCSs. The main focus of this paper is demonstrating the suitability of FTLE fields to capture and visualize the interaction between the gas and the fuel flow leading to liquid disintegration. Aiming for a convenient illustration at a high spatial resolution, the analysis is presented based on 2D datasets. However, the method and the conclusions can analoguosly be transferred to 3D. The FTLE fields of modified nozzle geometries are compared in order to highlight the influence of the nozzle geometry on primary breakup, which is a novel and unique approach for this industrial application. Modifications of the geometry are proposed which are capable of suppressing the formation of certain LCSs, leading to less fluctuation of the fuel flow emerging from the spray nozzle.

1. Introduction

In order to reduce the environmental impact of air traffic, aero-engine manufacturerers aim at higher efficiencies and less pollutant emissions. The combustion technology and its optimization play a key role in this context. Previous investigations by Lefebvre, Jones, and Knudsen [1,2,3] demonstrated that the formation of pollutants depends on the quality of the fuel spray injected into engine combustors. The characteristics of the fuel spray are significantly influenced by the geometry of the fuel spray nozzle. In order to optimize the nozzle geometry, a detailed understanding of the local flow field and the spray formation inside the nozzle is required.
Due to the high pressure, high temperature, and limited optical access to the nearfield of the fuel spray nozzle, experimental investigations are impossible at realistic operating conditions of aero-engines. Hence, numerical predictions may close the gap to study the spray formation.
Compared to conventional grid-based numerical methods such as the volume-of-fluid (VoF) or level-set (LS) methods, the smoothed particle hydrodynamics (SPH) approach offers a variety of advantages, particularly for the prediction of primary breakup. Due to the fully Lagrangian character of the method, the interface between gas and liquid is inherently advected in space by the movement of the uniquely defined particles. Expensive interface tracking or reconstruction and unwanted interface diffusion are avoided. A numerical code based on the SPH method has been developed at the Institut für Thermische Strömungsmaschinen (ITS). The suitability of the code to predict the primary breakup of fuel in generic, but also realistic, industrial use cases has been demonstrated by Braun and Koch [4,5,6] and Chaussonnet and Dauch [7,8,9].
The fundamentals of the process of primary breakup are not yet understood in detail. In order to investigate the formation of liquid structures during primary breakup, Zandian et al. [10] investigated the interaction of vortex and interphase dynamics by conventional vortex identification methods. In contrast to grid-based methods, the SPH method is particularly suited to the investigation of vortex structures due to its Lagrangian nature, as pointed out by Dauch et al. [11]. Information such as local residence times or Lagangrian-coherent structures (LCSs), which are difficult to derive from grid-based simulations, can easily be retrieved.
A workflow for the prediction of two-phase flows in the close vicinity of fuel spray nozzles by means of the SPH method was developed at the Institut für Thermische Strömungsmaschinen. The spirit of the workflow and the elements of the process chain are depicted in Figure 1.
A CAD file defining the geometry of a nozzle can be used as input for the generation of wall particle distributions supported by the CAD2SPH workflow presented by Dauch et al. [12]. In a next step, the simulation is performed by means of a highly efficient SPH solver as presented according to Braun and Koch [4,5,6] (please refer to Braun et al. [13] for details about the validation). Finally, the resulting SPH data sets are investigated qualitatively and quantitatively by means of the interactive data exploration environment “postAtom”, which was jointly developed and implemented at the Institut für Visualisierung und Datenanalyse as presented by Dauch et al. [11]. The workflow resembles a virtual fuel spray nozzle test rig, as outlined by Chaussonnet et al. [14].
In the current study, the multiphase flow of realistic fuel spray nozzle geometries is presented as predicted by the SPH method in 2D. Fields of the finite-time Lyapunov exponent (FTLE) were derived by means of “postAtom”, indicating the location of Lagrangian-coherent structures and their evolution in time and space. We demonstrate how the time-resolved tracking and analysis of LCSs will help to understand the momentum transfer from the gas to the liquid, and how this affects the formation of ligament structures during primary breakup. For the purpose of demonstrating the suitability of FTLE fields to capture and visualize the interaction of phase interface and vortex dynamics, 2D datasets are particularly convenient as they can be provided at a much finer spatial resolution than in 3D. The results support the approach of Zandian et al. [10] to focus on the interaction of vortex and interface dynamics in order to improve the understanding of the primary breakup process. The investigation highlights how the inherent advantages of SPH (i.e., the evaluation of FTLE fields at lower costs and the inherent advection of the phase interface) can be exploited for scientific and technical purposes.

2. Fundamentals

2.1. SPH—Schemes

In order to simulate the multiphase flow of air and fuel in the vicinity of an airblast atomizer, the smoothed particle hydrodynamics method is used to solve the Navier–Stokes equations. The Lagrangian form of the continuity and momentum equation are required to derive the SPH schemes for calculating density ρ, velocity v , volume forces f, shear stresses τ, and static pressure p as a function of space and time t:
D ρ D t = ρ · v ,
ρ D v D t = p + · τ + ρ f .
In the present paper, the mass of each particle is set constant, resulting in inherent mass conservation. A scheme as introduced by Espanol et al. [15] is used for the computation of the density field:
ρ a = m a b W ( r a b , h ) ,
V a = 1 b W ( r a b , h ) .
As pointed out by Hu [16], this scheme can handle large mass discontinuities, which is required in the present case. The symmetric scheme proposed by Monaghan [17] is used to discretize the pressure gradient, as it conserves linear momentum:
p ρ a = 1 ρ a b m b ρ b ( p a + p b ) W ( r a b , h ) .
Viscosity is taken into account by the viscosity model according to Szewc [18], which is a modification of the model pioneered by Cleary [19]. The resulting term to calculate the shear stress τ with n as the number of dimensions, r a b as distance vector, η as a regularizing parameter, and ν representing the kinematic viscosity is:
· τ ρ a = b 2 n + 2 m b · ν a + ν b ρ a + ρ b v a b · r a b r a b 2 + η 2 W ( r a b , h ) .
Various studies have demonstrated the suitability of this combination of quadratures for the prediction of multiphase flows, as presented by Braun [4], Koch [5], and Dauch [7,8]. Following the weakly compressible approach, the pressure is determined by means of an equation of state (EOS). In this case, Tait’s equation as originally proposed by Cole [20] is used. Background pressure is required to avoid tensile instability (see Liu at al. [21] for details). Indicating background pressure as p b , the polytropic exponent as κ and the subscript “ n o m ” as index for the reference state, the EOS is:
p = ρ n o m c 2 κ · V n o m V κ 1 + p b a c k .
The particles are flagged by an individual ID number, which offers the opportunity to track each particle inside the computational domain at each time step.
In the current investigation, no turbulence modeling was employed because the turbulent length scales were resolved. Hence, the spatial resolution needed to be adjusted to capture the Kolmogorov length as well as the characteristic length scale of the liquid structures of interest. Gorokhovski [22] recommends a resolution of two to five discretization points per liquid structure.

2.2. LCS and FTLE

As there is no universal and unique definition of a vortex in fluid dynamics, many different concepts exist aiming at the identification of a vortex—for example, the λ 2 criterion suggested by Jeong and Hussain [23] and the Q-criterion of Hunt [24]. As demonstrated in the pioneering work by Haller [25], all these concepts suffer from the fact that they are not invariant with regard to a change of coordinates, as described by:
x = Q t x 0 + b t ,
with x 0 as the position in the original and x in the new frame of reference. Q t and b t indicate a time-dependent matrix and vector, respectively.
As an alternative method, Haller [25] proposes to identify Lagrangian-coherent structures and interpret them as a coherent vortex structure. Haller [25] demonstrated that ridges in the fields of the so-called finite-time Lyapunov exponent enable the identification of LCS. The basis for the definition of the FTLE is the flow map. A flow map ϕ t 0 t ( x 0 ) associates a position x 0 at time t 0 with a position x at time t. In the following, the gradient of the flow map F is considered:
F t 0 t ( x 0 ) : = ϕ t 0 t ( x 0 ) .
Based on F t 0 t ( x 0 ) , the symmetric and objective right Cauchy–Green strain tensor can be defined as:
C ( x 0 , t 0 , t ) = [ F t 0 t ( x 0 ) ] F t 0 t ( x 0 ) .
As C is symmetric and positive definite due to the invertibility of ϕ t 0 t , there are n eigenvalues 0 < λ 1 λ n , with n being the number of dimensions. The FTLE t 0 t ( x 0 ) is defined as the scaled and normalized value of the largest eigenvalue λ n ( x 0 , t 0 , t ) :
F T L E t 0 t ( x 0 ) = 1 | t t 0 | log ( λ n ( x 0 , t 0 , t ) ) .
The time difference | t t 0 | is the reference time span Δ t , and needs to be adjusted individually according to the time scale of the underlying flow phenomenon. If t > t 0 , the FTLE is called “forward in time” FTLE + , and for t < t 0 , “backward in time” FTLE . The FTLE + measures the rate of separation, whilst the FTLE measures the attraction between two infinitesimally close particles advected over Δ t .
In order to determine the fields of the FTLE , the trajectories of tracer particles are integrated based on a velocity field which is obtained either from numerical simulations or experimental investigations. In case of SPH, there is no necessity for a transformation from the Eulerian to the Lagrangian frame of reference. As proposed by Sun et al. [26], fields of the FTLE can directly be retrieved from the SPH particles. The regular SPH quadrature for interpolating quantities and their spatial derivatives can be employed:
F t 0 t ( r a , 0 ) = b r a b L ( r a , 0 ) W ( r a b , 0 , h ) V b , 0 ,
L ( r a , 0 ) = b r a b W ( r a b , 0 , h ) V b , 0 1 .
The position of an adjacent particle b relative to central particle a at time t is r a b . The SPH kernel is denoted as W ( r a b , h ) , and its derivative as W ( r a b , h ) . The volume is indicated by V b , t . The subscript “0” indicates the reference point in time t 0 . The symbol ⊗ represents the dyadic product. Depending on the local particle distribution, for the correction of the kernel the tensor L is employed according to Bonet [27]. For further details, the reader is referred to Haller et al. [25] and Sun et al. [26].
In order to efficiently compute FTLE fields based on SPH data sets, the interactive data exploration environment “postAtom” mainly developed and implemented by the Institut für Visualisierung und Datenanalyse (IVD) in joint cooperation with ITS, was used. Recently, further features have been added to the environment, such as parallel coordinate visualization, brushing and linking, as well as histogram views and much more.

3. Computational Setup (2D)

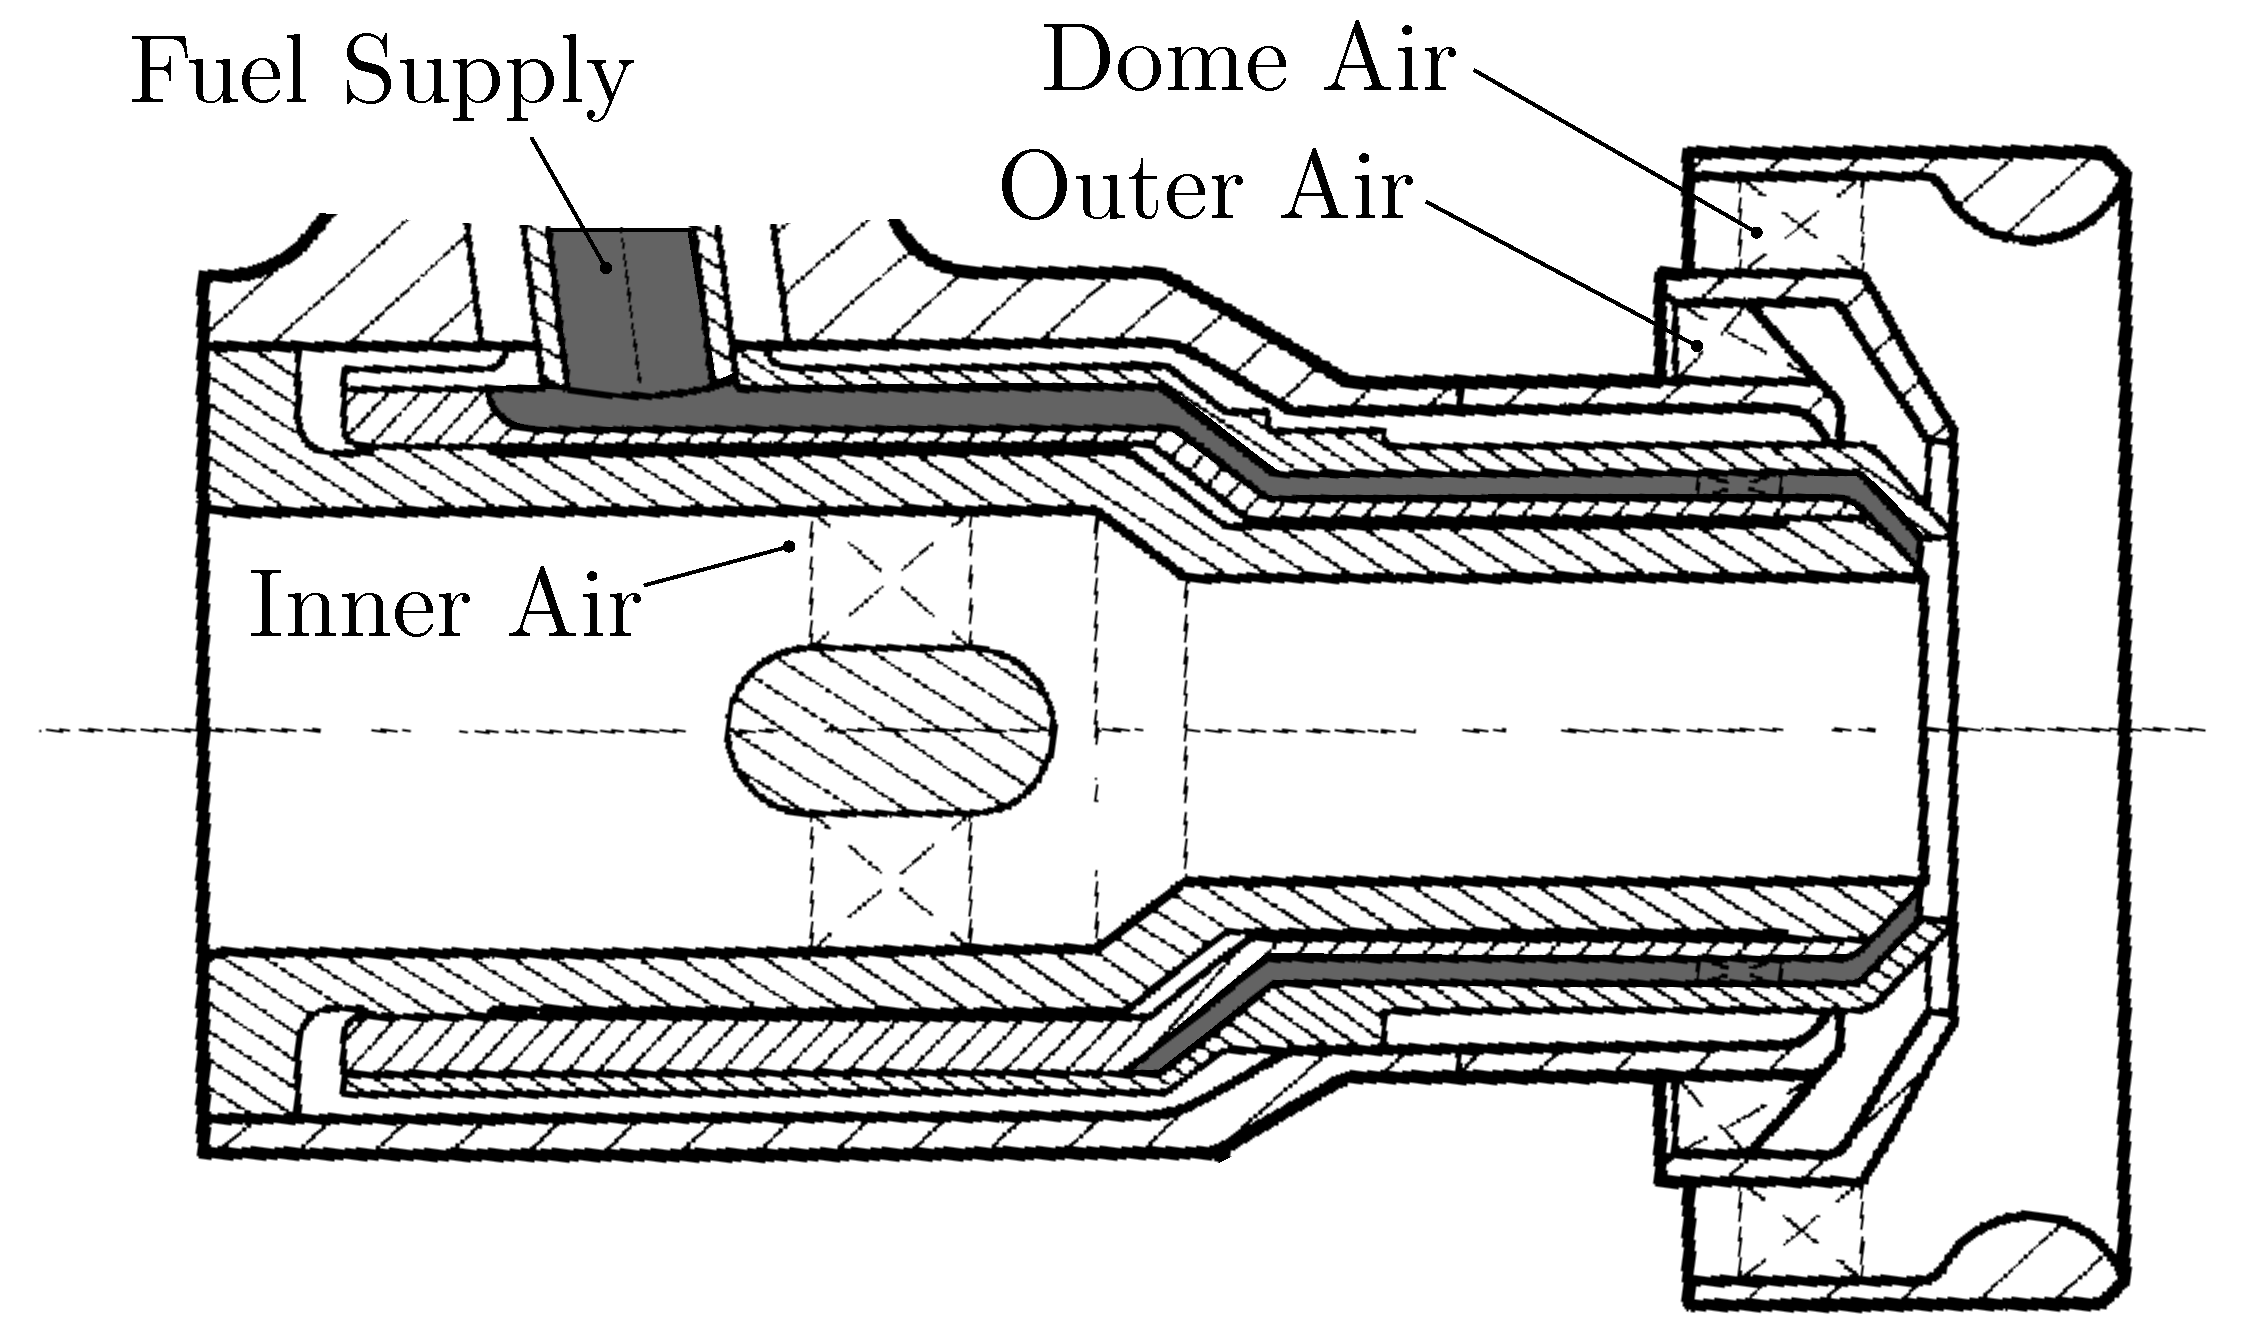
The geometry of the fuel spray nozzle to be considered in this paper is a modified version of the geometries defined in the patents by Steinthorsson [28] and Mansour [29]. It consists of one central cylindrical and two concentric annular flow ducts referred to as inner, outer, and dome air. In between the inner and outer air ducts, fuel emerges from an annular supply channel called the fuel gallery. The configuration as depicted in Figure 2 was extracted from Mansour [29].
As pointed out in Section 2.1, this study aims at the details of primary breakup. Due to the required spatial resolution and the limited computational resources, it is not possible to predict the flow in the whole combustor. Hence, an adequate smaller computational domain and realistic boundary conditions need to be defined. In this study, the computational domain comprises the inner and outer air ducts as well as the exit of the fuel gallery according to Dauch et al. [8]. The fuel spray nozzle geometry is displayed in Figure 3 on the left-hand side, and the resulting computational domain in Figure 3 on the right.
Velocity profiles are imposed at the inlet boundaries as obtained from grid-based CFD predictions of the flow in the whole combustor. The slip walls are defined in order to mimic the movement of the flow in a radially outward direction. Please refer to Dauch et al. [8] for further details about the extraction of the slip walls and the typical shape of the velocity profiles imposed at the inlet of the domain. In the present case, the geometry of the fuel gallery exit is subject to modifications compared to the geometry investigated by Dauch et al. [8]. The fuel emerges from an annular duct and is guided to a conical prefilming surface.
The combustor was operated at a pressure of 1.213 MPa and the average gas temperature was 649 K, corresponding to an average air density of 6.51 kg m−3. The liquid phase was considered to be Jet-A1 at a temperature of 363.15 K with a dynamic viscosity of 0.0007375 kg m−1 s−1, a density of 731.5 kg m−3, and a surface tension coefficient of 0.017922 kg s−2. As pointed out in previous publications by Dauch et al. [7], the elevation of pressure and temperature leads to smaller liquid structures during disintegration, and might drastically change the local flow field. The values of the Mach number inside the inner and the outer air ducts were Ma inner = 0.09 and Ma outer = 0.12 , respectively. The momentum ratio in the case of the wide slit configuration was approximately MR = 16. The gas flow was highly turbulent—the order of magnitude of the Reynolds number was 100,000.
Even though the vaporization is important for the combustion process in gas turbines, it is not taken into account in the present study. As the focus is on the analysis of the interaction of vortex and interface dynamics in the very early stage of primary breakup, vaporization is considered not to play a dominant role with regard to the conclusions that are drawn in this paper. Chemical reactions are not taken into account for the same reason.
For the sake of a more comprehensible visualization of vortex structures and the opportunity to provide a much finer spatial resolution of the flow field, the current study is based on SPH computations in 2D. Thus, an initial particle spacing of 2.5 μm could be realized by only 12.4 Mio. of particles. Due to this simplification, fluctuations and instabilities in circumferential direction were not captured. However, the general conclusions drawn from this paper can analogously be transferred to 3D. Please refer to Dauch et al. [8] for a comparison between 2D and 3D simulations of primary breakup in airblast atomizers in order to learn more about the limitations of 2D setups.

4. Results and Discussion

In the following, the flow dynamics at the gas–liquid interface of different nozzle geometries are investigated. First, conventional concepts of flow visualization, such as glyphs representing the velocity field and vorticity, are used. However, these concepts suffer from various limitations with regard to the analysis of the interaction between vortex and interface dynamics. Hence, in a second step, detailed FTLE fields are presented, enabling a unique insight into the local breakup phenomena. This post-processing tool demonstrates the strengths of SPH in combination with the LCS concept regarding the analysis of liquid breakup phenomena. Finally, the effect of nozzle geometry on primary breakup is analyzed by means of FTLE fields.
All results were selected from instances after both liquid and gas flows reached globally stationary conditions.
The following will distinguish between three variants of the fuel spray nozzle geometry as depicted in Figure 3. Cross sections of the different variants are illustrated in Figure 4. The first geometry “I” is referred to as the reference geometry. Geometry “II” is equal to “I”, but contains a cavity upstream of the prefilmer. Geometry “III” also contains the cavity, but can be distinguished by a much smaller radial extension of the fuel inlet.

4.1. Interaction of Vortices and the Phase Interface

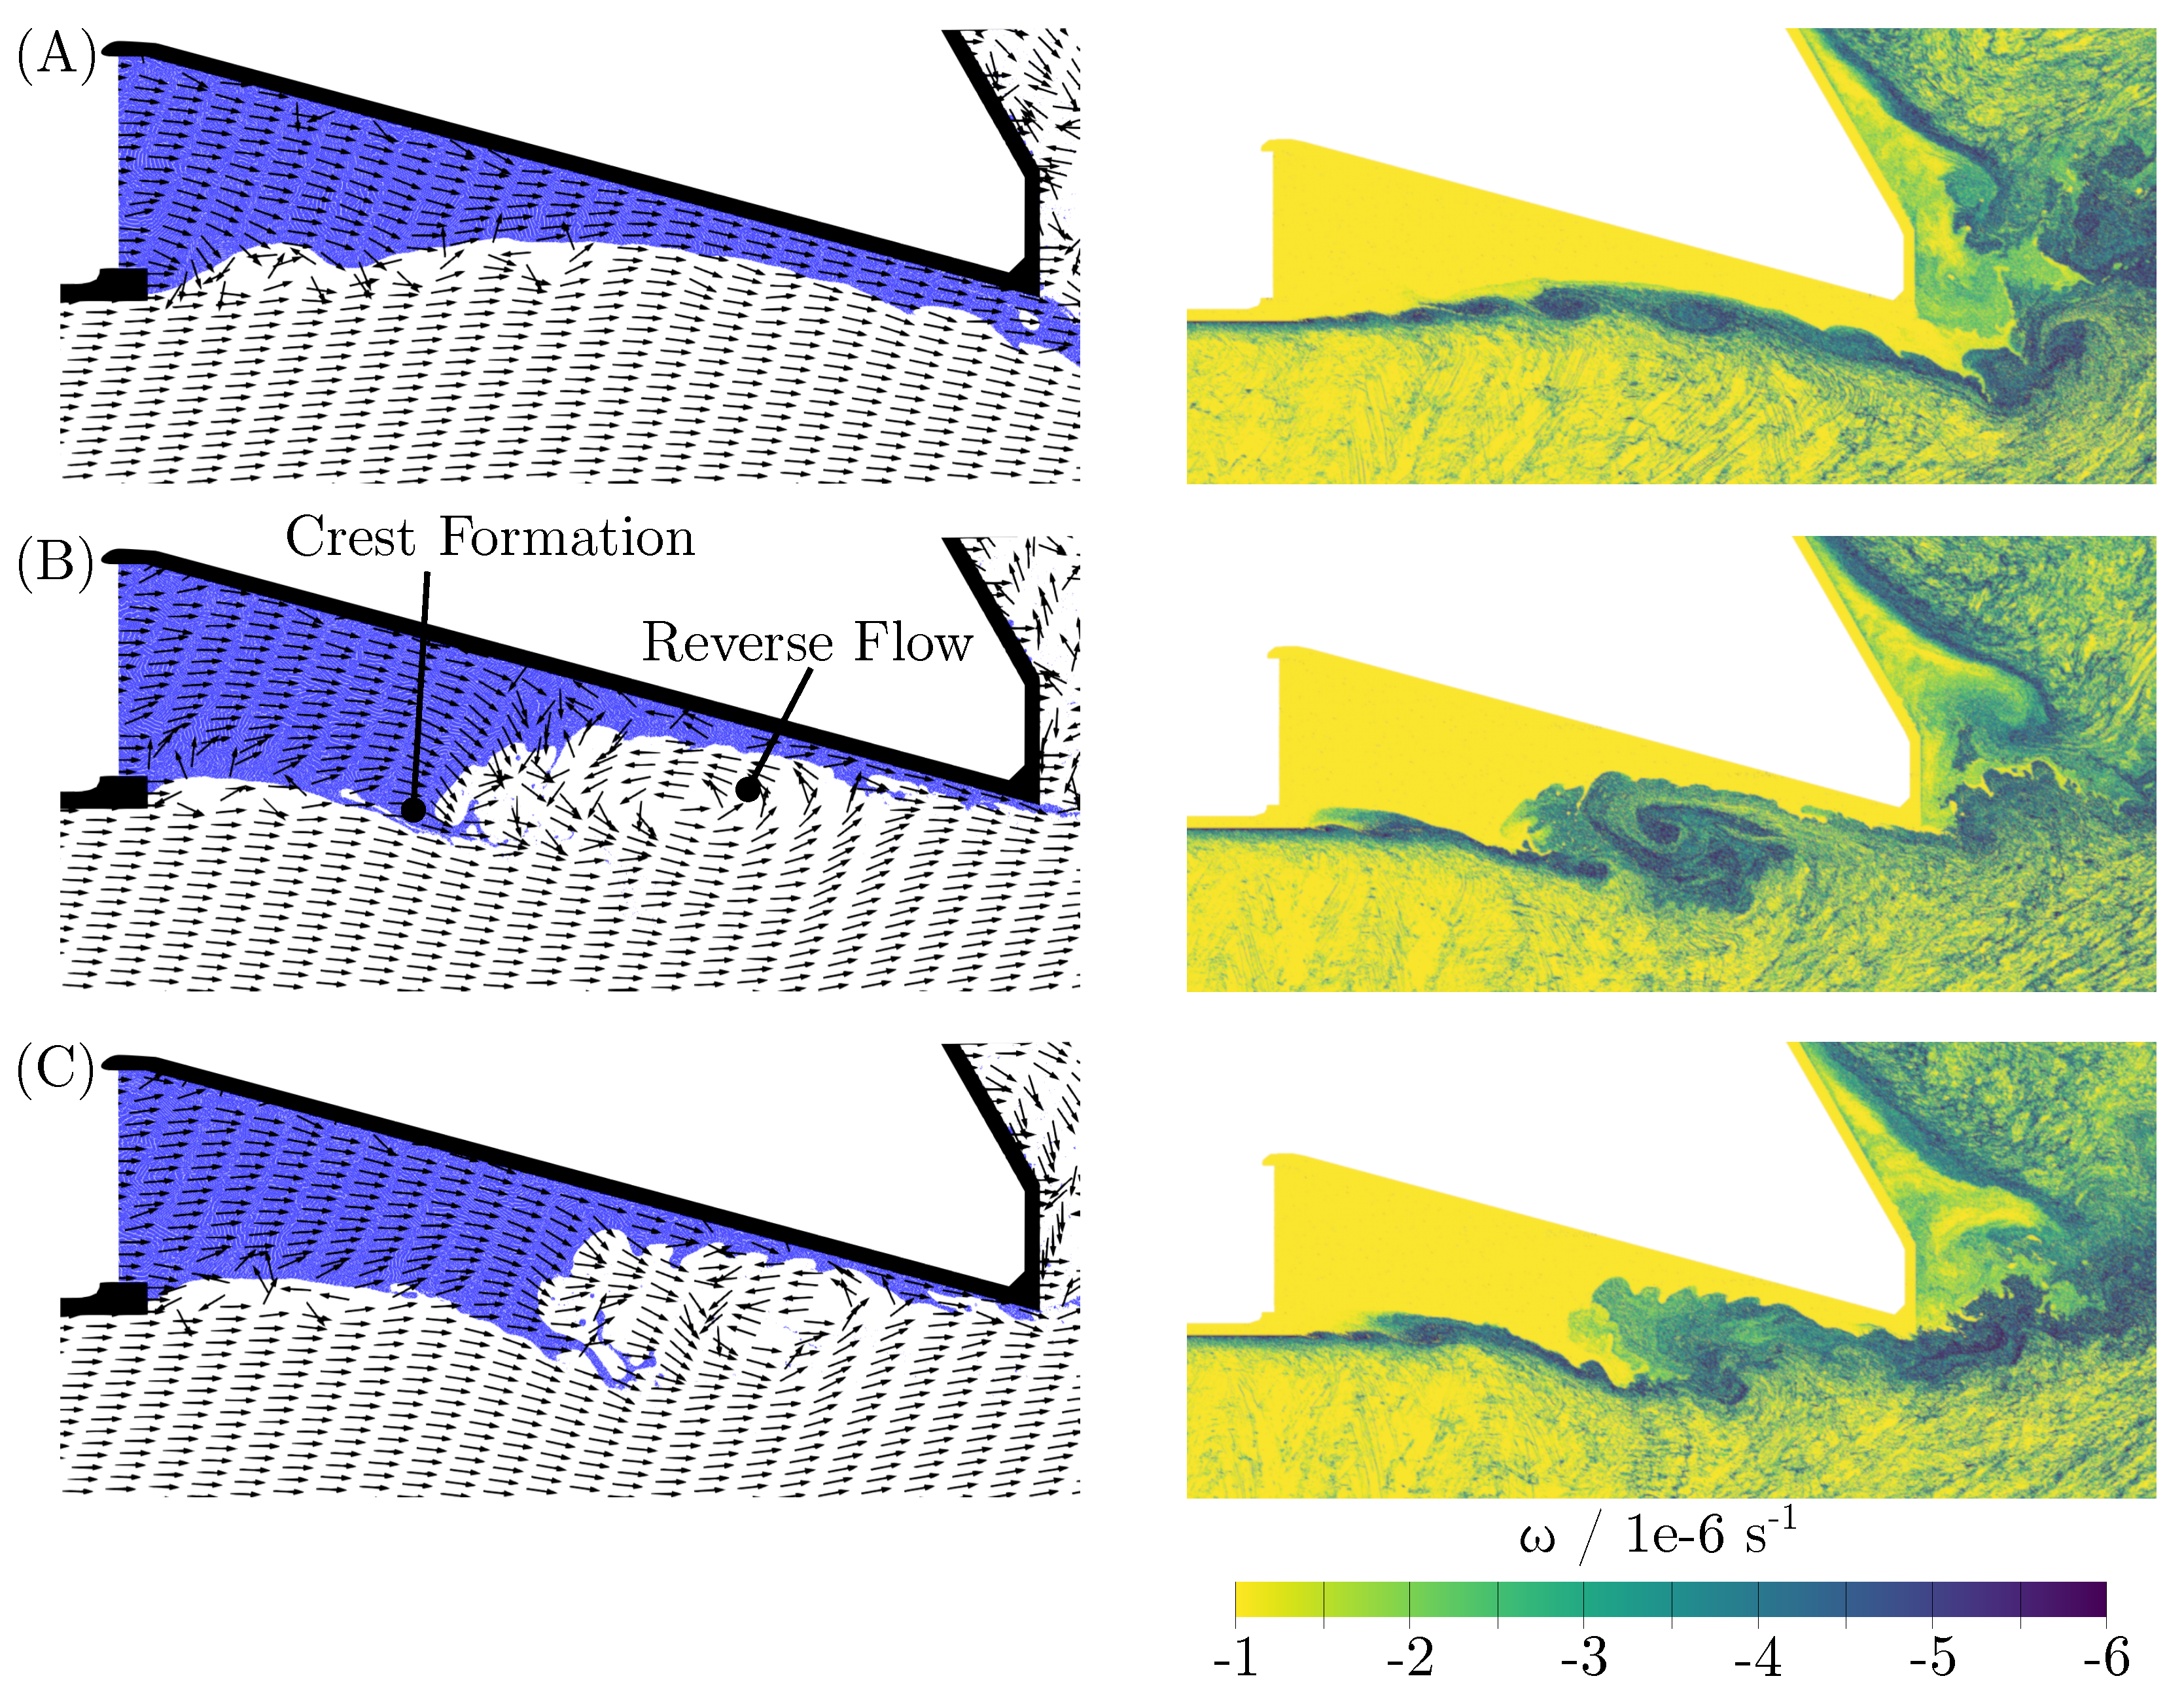
Conventional Visualization—The reference case is based on the nozzle geometry depicted in Figure 4. Several instances of the velocity field around the gas–liquid interface are illustrated in Figure 5 on the left by means of uniformly distributed glyphs representing the direction of the local velocity vector. The glyphs are located on nodes of a uniform grid, and the SPH solution was interpolated on during post-processing. The three instances AC represent three steps of a periodically reoccurring flow pattern. At time point t A , the flow on the prefilmer was balanced and no film instabilities were visible. Due to the onset of an instability at the edge close to the fuel inlet, a film wave was created resulting in a recirculation zone of the gaseous flow directly downstream of the crest of the wave, as presented at instant B. Hence, an inversion of the flow direction became visible in the glyphs’ orientation. At time t B , even the flow direction inside the film was locally and temporarily inverted upstream. The instability grew as did the size of the wave crest until the liquid was discharged downstream of the prefilmer. Finally, both the accumulated bulk liquid and the collapsing ligaments formed at the gas–liquid interface pushed the vortex structures further downstream, which eventually resulted in a stabilized liquid film, coming back to a similar situation as shown in Figure 5A. Please refer to Video S8 for a more vivid visualization of the liquid interface dynamics.
In order to investigate the interaction of vortices and interface dynamics, vortex structures need to be identified in the flow field. In Figure 5 on the right-hand side the vorticity as obtained from the velocity field is illustrated, corresponding to the same instances as shown on the left.
One can conclude from the vorticity distributions that vortices were located at the same spots, where the eddies were roughly implied to exist with the velocity vector fields. In contrast to the vector plots, the growing vortex structures along the gas–liquid interface became more obvious from the vorticity field (e.g., Figure 5A). One can further conclude from the vorticity distributions that more information about the shape and strength of the large eddies can be obtained compared to pure vector plots, especially in Figure 5B,C.
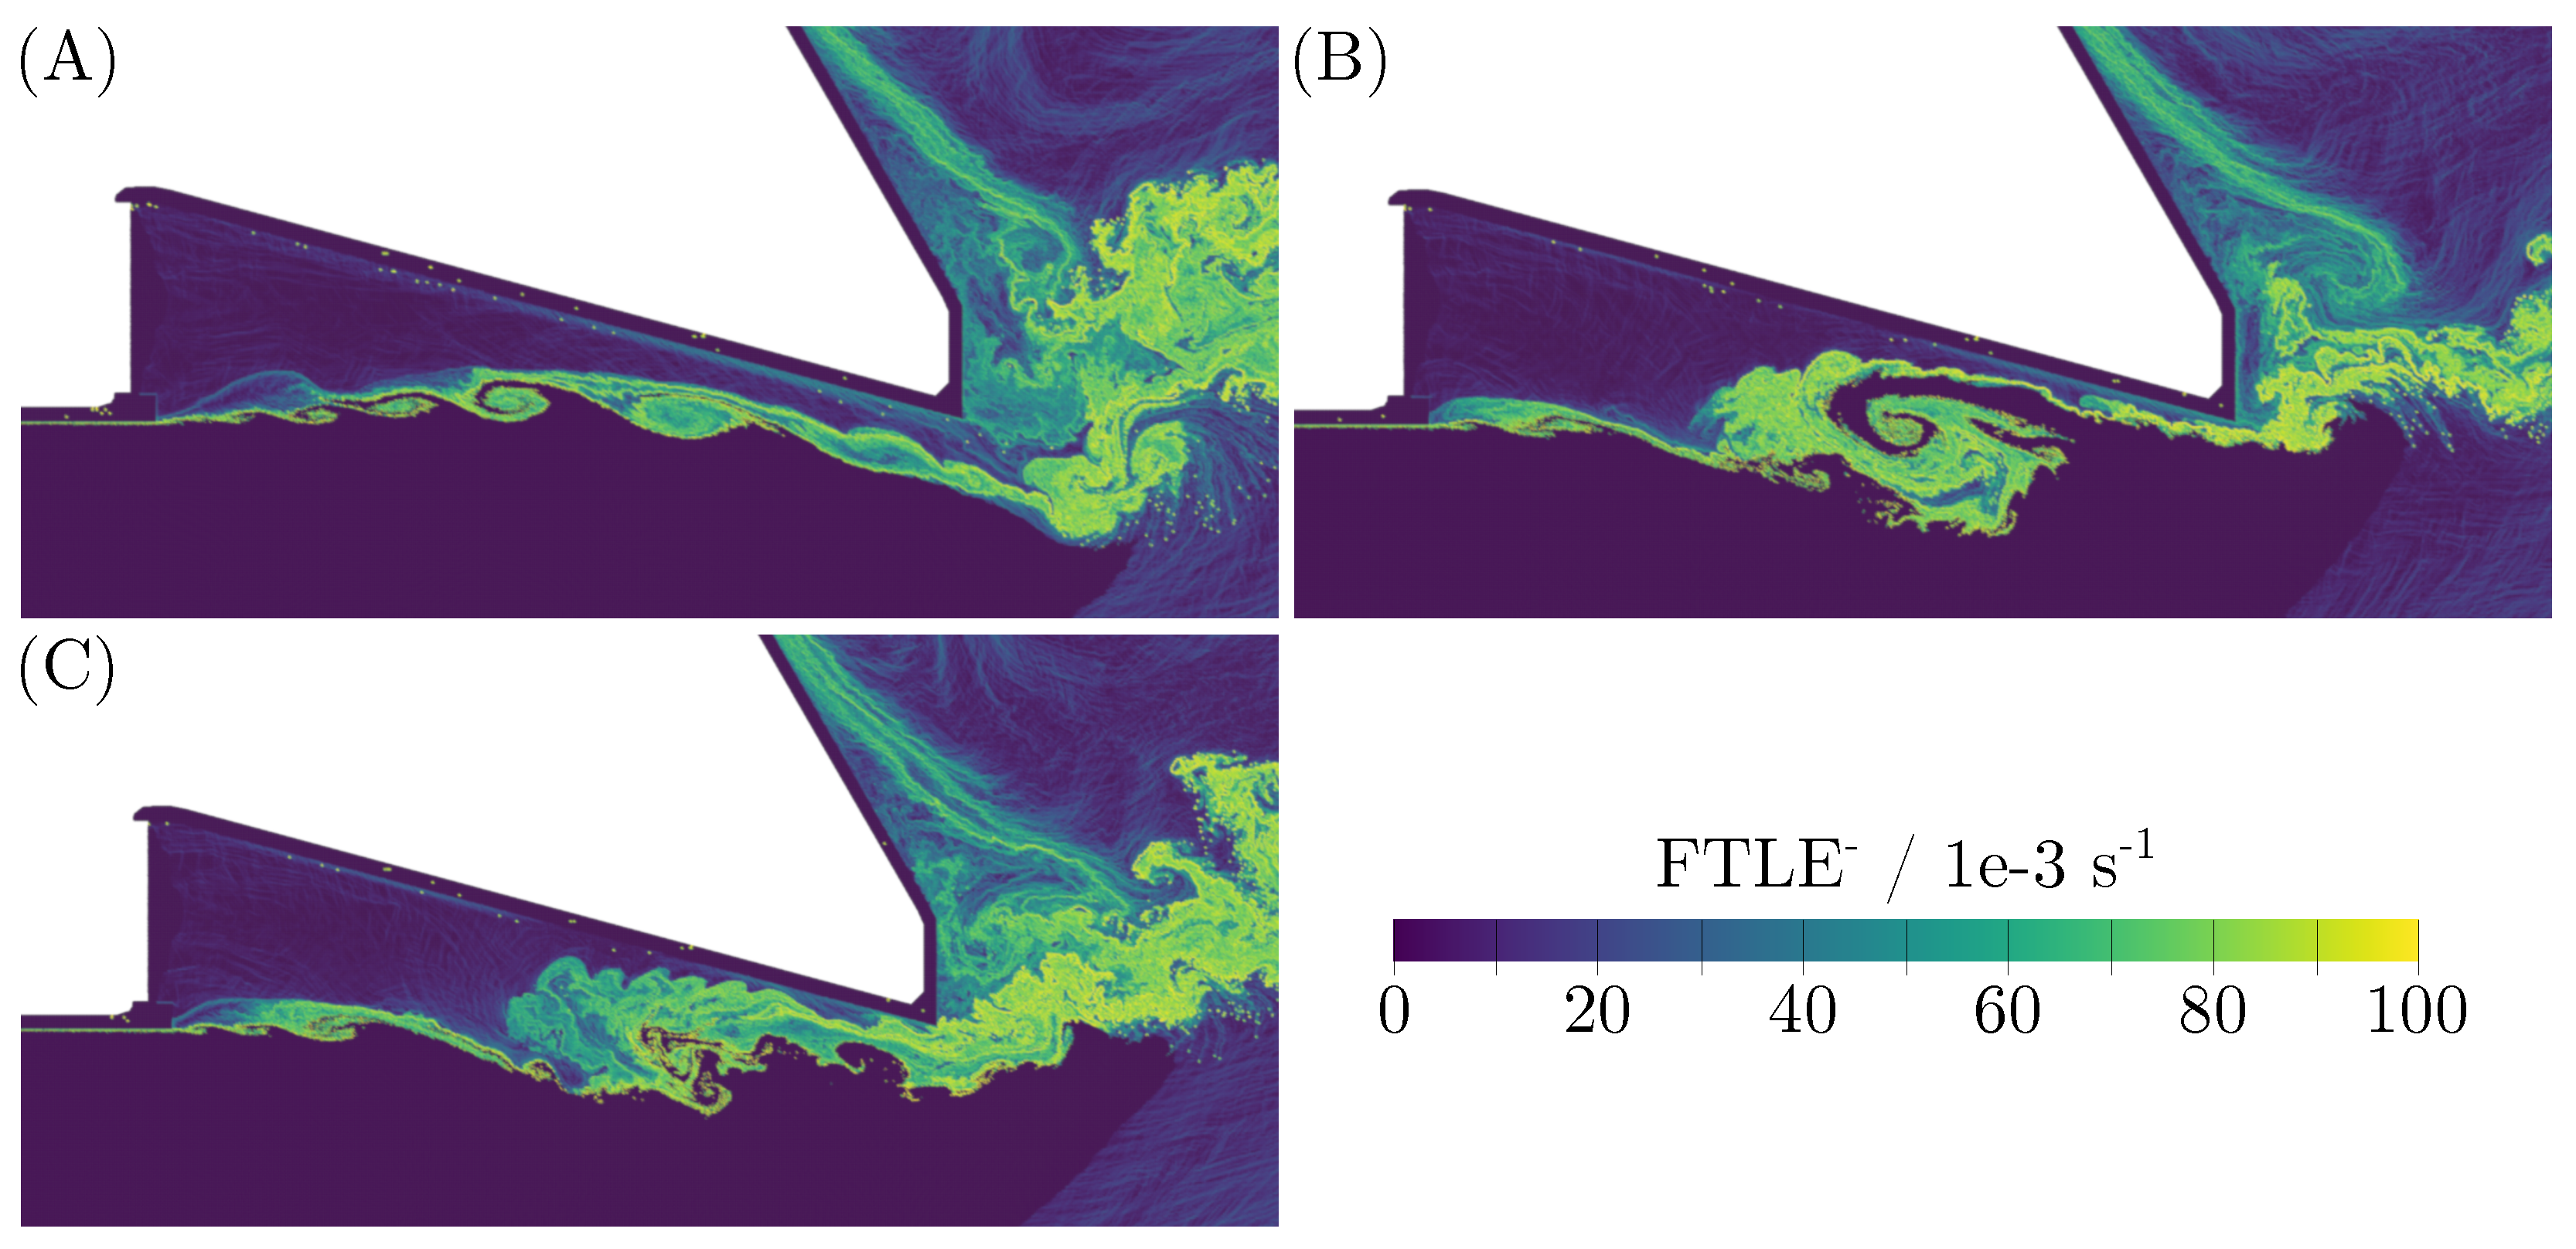
Fields of FTLE and LCS —Fields of the backward-in-time FTLE for the same instances are depicted in Figure 6. As pointed out previously, those fields enable the visual identification of LCS. In the next section, additional information is presented about the sensitivity of FTLE fields with regard to a variation of Δ t . For now, a finite time of Δ t = 61.6 ± 2.8 μ m was applied across all time steps and geometric configurations in order to demonstrate the capability and strength of FTLE compared to velocity and vorticity fields. The temporal evolution of the vortices is also demonstrated by the Videos S1 and S2. The database was the same for both videos. However, Video S2 is played in reverse, which makes it easier to identify the root location of the flow instability causing temporal fluctuations.
Concerning instant A, the vector glyph representation was only capable of indicating variations of the flow direction close to the phase interface. The vorticity field at this instant was dominated by noisy lines. Vortex structures in close vicinity to the phase interface were difficult to see. In contrast, the FTLE fields revealed much more about the vortex structures near the phase interface. From the transient evolution of the LCSs as indicated by FTLE , it can clearly be concluded that an instability was initiated at the beginning of the gas–liquid interface, which led to the formation of small eddies due to the intense shear. These eddies then grew in size along the interface and were advected with the gas flow. These observations imply that a Kelvin–Helmholtz-type instability developed at the interface, which affected the boundary dynamics significantly. From the green line in the boundary layer of the gas flow right below the solid boundary, one can even conclude that the vortex formation in the shear zone emerged from exactly there. The superiority of FTLE fields became even more obvious in the regions where the liquid film experienced back-mixing, and where ligaments were formed (see Figure 6C). The vorticity field indicated only noise in these regions.
Note also that there were significant overlaps between the vorticity distribution and FTLE fields. This was particularly true for the very large structures. The smaller the vortices were, the more difficult was the identification of their location and dynamics from vorticity fields only. FTLE fields were found to be more capable of revealing finer structures, which were disguised in the instantaneous velocity field or in the noisy vorticity field. These results demonstrate that FTLE fields are better suited to capture the flow dynamics of the gas–liquid interface, and hence the underlying physics behind the primary breakup in fuel spray nozzles.
One can conclude that the illustrated results demonstrate the significant entanglement of vortex and interface dynamics. This confirms the observations by Zandian et al. [30], which also lead to the same conclusion. Furthermore, we demonstrated that these interactions could be captured and tracked very easily by FTLE fields. This method demonstrated a clear superiority in the identification of vortex structures on all length scales, and in particular with regard to their temporal evolution.

4.2. Sensitivity of FTLE -Variations of Δ t

The FTLE field depends on the choice of Δ t . The higher Δ t , the more information from the past is taken into account. If the integration time interval used in FTLE calculations is too large compared to the characteristic time scale of the flow, information must be expected to get lost due the time averaging over a very large time difference. In contrast, if Δ t is too small, there is not enough information present for a decisive analysis. In the current subsection, the influence of the choice of Δ t on FTLE will be examined in two parts. In the first part, the sensitivity of FTLE depending on Δ t is investigated with regard to the results presented in the previous section. In the second part, the additive character of FTLE in terms of the integration time Δ t is illustrated based on the growth of a vortex in the gaseous phase detaching from the atomizing edge.
In Figure 7A, a FTLE distribution in the vicinity of the fuel film is illustrated for Δ t = 6.5 μ s . For this value of Δ t , the field was very noisy and fine structures were not visible. Obviously, there was not enough information about the time history available, or in other words the integration time was too small.
In Figure 7B a FTLE distribution for Δ t r e f as used in the previous chapter is presented for comparison. It becomes obvious that there was much less noise and that the vortex structures of relevance could be identified more easily. Whereas in Figure 7A, there was no void region extracted, it became visible in Figure 7B. A void region occurred because of the presence of the inlet boundary. In order to determine fields of the FTLE backwards in time at a reference time t 0 , the particles of the same ID need to be located inside the domain also at t = t 0 Δ t . However, there were particles in the domain at t 0 , which were not present previously at t = t 0 Δ t . As no value of the FTLE could be computed for these particles, void regions occurred in the FTLE fields close to the inlets due to the lacking computability. The location of the void boundary region could be identified by filtering NaN entries in the FTLE field. The size of these void regions depends on the local flow velocity and the integration time Δ t . As the integration time was globally the same for all particles in the domain and only the local velocity varied, the shape of the void region in the bulk flow reflects the shape of the velocity profile imposed at the inlet.
For even larger values of Δ t , as presented in Figure 7C, the size of the void region became even larger. The order of magnitude of Δ t became closer to the characteristic time scale of the flow inside the liquid phase. As a result, in Figure 7D, only structures inside the liquid phase were left visible. In this case, the integration time became as large as required for the analysis of structures inside the liquid film, which are not visible in Figure 7A–C. On the other hand, the information of the gaseous flow was lost because the integration time exceeded the characteristic time of the gaseous flow.
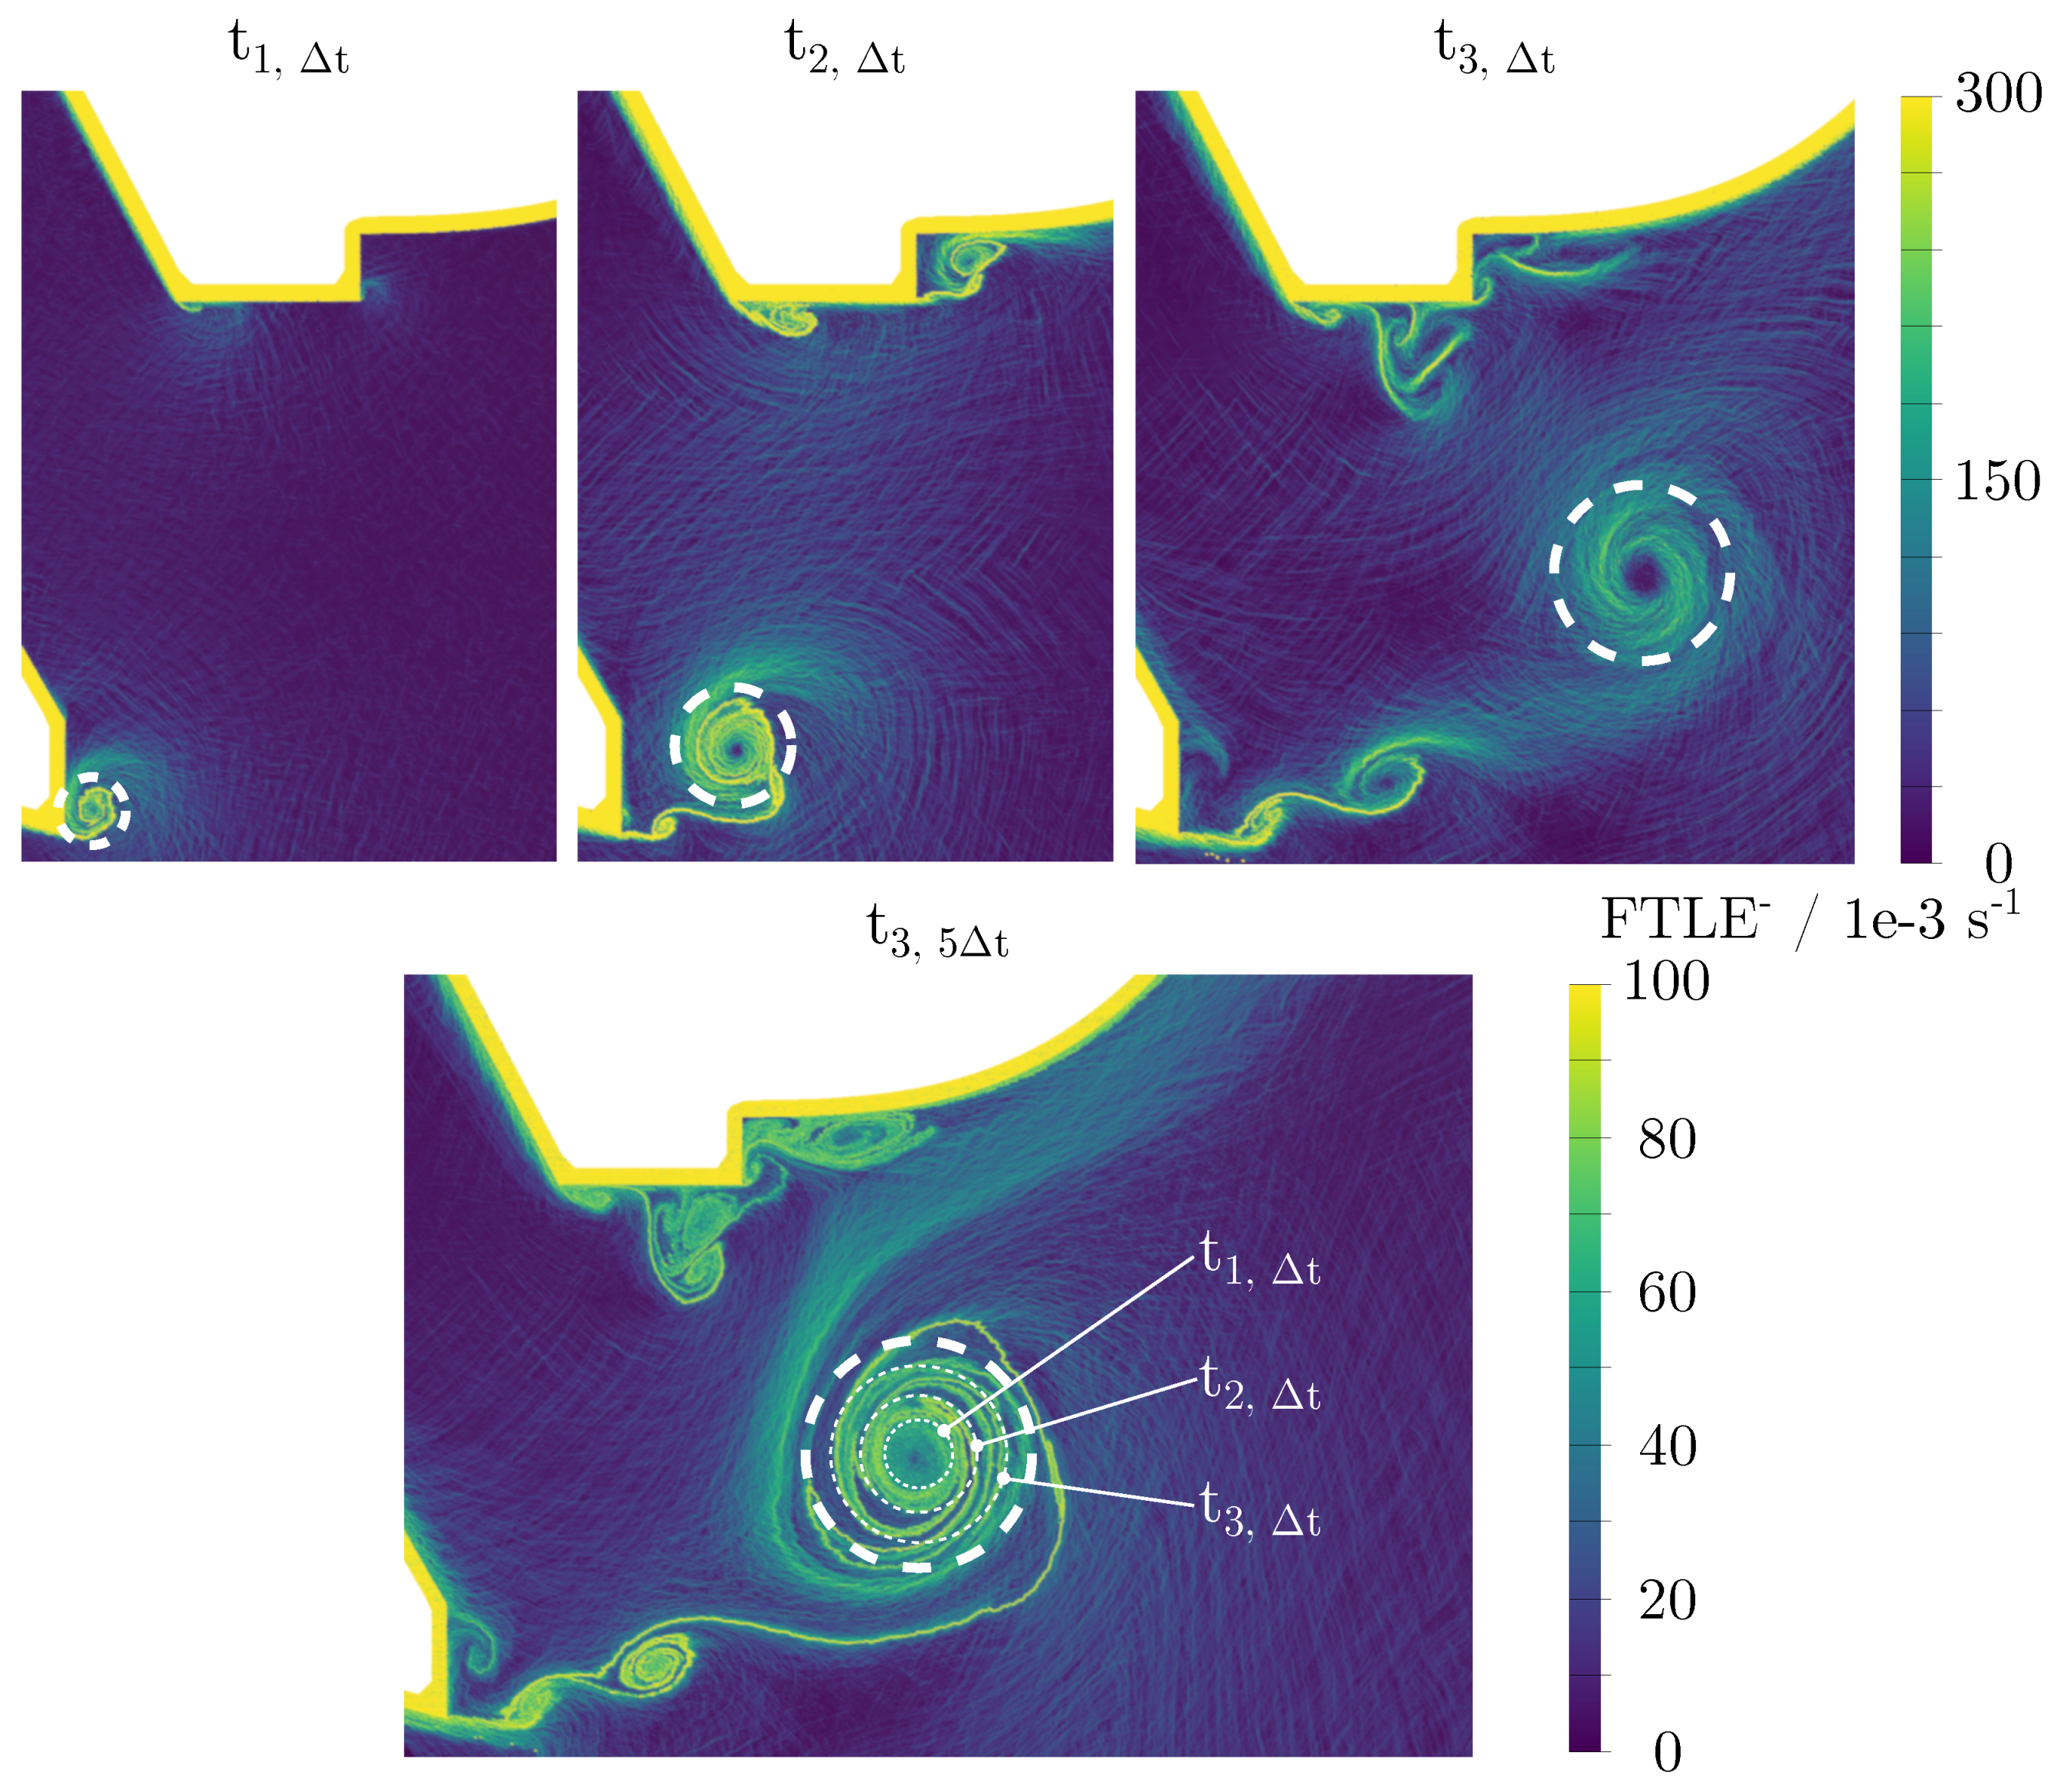
The following illustrates the additive character of FTLE fields in terms of time history. For this purpose, the initial gaseous flow downstream of the atomization edge was analyzed at the early stage of the simulation. At this time there was no fuel in the region downstream of the atomizing edge. In Figure 8 (top), FTLE fields in the vicinity of the atomizing edge at three different points in time t 1 , t 2 , and t 3 are presented. They are based on the same integration backwards in time Δ t . One can observe how a vortex structure was formed downstream of the atomizing edge in the wake of the bluff atomizing edge. It is marked by a white circle. For the sake of clarity the different points in time and the corresponding integration times are illustrated in Figure 9.
In Figure 8 (bottom), the FTLE distribution for time t 3 based on an integration time of 5 Δ t is depicted. The positions of the vortices were equally captured as in the field of FTLE , which was based on an integration time of Δ t . However, it becomes obvious that for 5 Δ t more historical information is contained in the representation. The meanders of the vortex as visible at t 1 and t 2 were contained in the center of the vortex at t 3 for 5 Δ t only (see Video S7 for the temporal evolution), whereas they were not visible for Δ t . This is reasonable because the information about the time history was unavailable if the integration time was just Δ t . Nevertheless, some information about the spatial history of vortices, such as how they are being advected in very small time steps, is lost when larger integration times are deployed.
With regard to the analysis of the interface dynamics in the close vicinity of the film, one can conclude that there is an optimal value Δ t o p t at which the vortex system can be captured depending on the characteristic time scales of the flow. If there are different characteristic time scales in the flow, such as the time scale of the liquid Δ t l i q u i d and the gas flow Δ t g a s , there are different optimal values for Δ t . For Δ t Δ t o p t the FTLE field was noisy and did not contain enough historical information about the vortex formation. If Δ t Δ t o p t , the information about the vortex dynamics was averaged out in time. Furthermore, as presented in the second part of the subsection, more historical information about the vortices was present in FTLE fields for larger values of Δ t , although some local events with shorter lifespans may be lost. Additionally, depending on the size of the computational domain, the local flow velocity, and Δ t , there might be void regions in which no FTLE values can be computed as the particles do not exist at t = t 0 Δ t .

4.3. Influence of Nozzle Geometry on Primary Breakup

In the previous section, it was shown that FTLE fields are capable of shedding light on dynamic vortex structures at the gas–liquid interface in fuel spray nozzles. In this section, the temporal evolution of FTLE fields for the geometries “II” and “III” (Figure 4) is presented. The objective is to demonstrate the opportunity of tracing the influence of geometric variations by analyzing FTLE distributions.
The first modified case was almost identical to the base case design. The only difference was the addition of a cavity upstream of the fuel injection location. FTLE fields for four different instances are presented in Figure 10 (left), in which the added cavity is also visible. As can be seen from the figure, eddies formed inside the cavity (Figure 10A). Some of them stayed inside the cavity, but some also left it and were advected towards the gas–liquid interface. After reaching the prefilmer, they interacted with the developed Kelvin–Helmholtz-type instability described in the previous section. It was observed that vortices interacted with the interface in different ways under the developed flow conditions. While the eddies originating from the cavity were being advected with the gaseous flow, vortices either passed below the interface instability as presented in Figure 10B (left) or they merged with the eddies formed by the Kelvin–Helmholtz instability at the phase interface. It was seen that when the advected vortex originating from the cavity was advected below the vortex layer of the phase interface, it could suppress the growth of boundary instabilities as depicted in Figure 10C. At certain instances, on the other hand, the merge of cavity and boundary vortices may lead to even larger vortex dispersions in the cross-stream direction, as illustrated in Figure 10D. The temporal evolution of the vortex dynamics is demonstrated by the Videos S3 and S4.
It should be highlighted that only one large vortex was found to be developed in the reference case (Figure 6), while the addition of the cavity to the nozzle design may have caused the formation of two large eddies as presented in Figure 10D.
The examples illustrated in Figure 10 can be considered as evidence for the suitability of FTLE fields for monitoring the variations of the nozzle geometry and, thus, the interface dynamics.
The second modified geometry III also exhibited a cavity upstream of the fuel injection location, but had a narrower fuel inlet area. Several FTLE fields for this configuration are shown in Figure 10 on the right. It can be concluded that the gas–liquid interface of the nozzle with the narrower slit was much more stable than in the previously presented designs. Most vortices created by the cavity were found to be carried away below the vortex boundary, as presented in Figure 10B (right). In other words, cavity vortices were observed to encapsulate the boundary layer vortices, leading to two parallel vortex layers below the interface. In rare occasions, however, cavity vortices were also found to interact with the interface instability as in other cases (Figure 10D). Nevertheless, the merging of these vortices always happened towards the end of the prefilmer, and had a much smaller impact on the liquid film flow than in the cases with the larger slit. The temporal evolution of the vortex dynamics is demonstrated by the Videos S5 and S6.
It should be emphasized at this point that all FTLE fields presented in this study were generated by using fixed integration times. In fact, different vortices are expected to have different lifetimes, so the integration time should be selected accordingly for a proper identification of vortex structures. This difference in time scales might also create a diffusion effect in the calculated FTLE fields if the integration time is too long. In other words, several vortices might be superimposed or completely extinguished in the visualized FTLE fields. Nevertheless, the results of this study indicate that it is still possible to obtain highly resolved FTLE fields even if the integration time is constant for the problems under consideration.
The current investigations revealed that vortices show strong dynamic interactions with each other. In other words, the properties of these structures are not only determined by their own, but also affected by other vortices which are present in their vicinity during their lifetime. FTLE fields are shown to be capable of identifying unique insights with regard to complex vortex structures near the gas–liquid interface, such as instantaneous vortex dynamics, how eddies form, grow, merge, and extinguish around the interface. Hence, FTLE fields can be utilized to track down the influence of operational conditions and/or geometric variations on the interface dynamics with a good resolution. This is of significant importance for understanding the dynamics of primary atomization as well as for identifying the source of instabilities.

5. Conclusions

In this study, the interaction between the gaseous and liquid phase inside a fuel spray nozzle of aero-engines was analyzed by investigating Lagrangian-coherent structures in the gas flow as predicted by the SPH method. The LCSs were identified based on backward-in-time finite-time Lyapunov exponents FTLE .
The main findings of this study are the following:
  • The transport of LCSs can effectively be captured by SPH and identified by means of FTLE fields at a fixed integration time Δ t .
  • Investigating the dynamics of LCSs in the gaseous phase helps to understand the momentum transfer from the gas to the liquid phase, leading to disintegration.
  • Suppressing LCSs by a modification of the fuel spray nozzle geometry leads to a suppression of time fluctuations in the fuel flow emerging from the nozzle.

Supplementary Materials

The following are available online at https://www.mdpi.com/1996-1073/12/13/2552/s1, Video S1: SuppMat-01-FTLE-nocav-reduced, Video S2: SuppMat-01R-FTLE-nocav-reverse-reduced, Video S3: SuppMat-02-FTLE-cav-reduced, Video S4: SuppMat-02R-FTLE-cav-reverse-reduced, Video S5: SuppMat-03-FTLE-tiny-reduced, Video S6: SuppMat-03R-FTLE-tiny-reverse-reduced, Video S7: SuppMat-04-DETACH-1-16th, Video S8: SuppMat-05.

Author Contributions

Conceptualization, T.F.D. and T.R.; Software, T.R., M.C.K., G.C., J.K., and M.O.; Formal analysis, T.F.D. and C.A.; Investigation, T.F.D. and C.A.; Supervision, R.K., C.D., and H.-J.B.; Writing—original draft preparation, T.F.D.; Writing—review and editing, C.A., T.R., M.C.K., G.C., M.O., and R.K.; Funding acquisition, R.K., C.D., and H.-J.B.

Funding

These investigations were conducted as part of the aeronautical research program LuFo V. The work was supported by the “Bundesministerium für Wirtschaft und Energie” (BMWi) as per resolution of the German Federal Parliament. This work was performed on the computational resource ForHLR Phase II funded by the Ministry of Science, Research and Arts Baden-Württemberg and DFG (“Deutsche Forschungsgemeinschaft”).

Acknowledgments

Additionally, the authors would like to express their gratitude to Rolls-Royce Deutschland Ltd. & Co. KG for their outstanding cooperation. We acknowledge support by the KIT-Publication Fund of the Karlsruhe Institute of Technology.

Conflicts of Interest

The authors declare no conflicts of interest. The funders had no role in the design of the study, in the collection, analyses, or interpretation of data, in the writing of the manuscript, or in the decision to publish the results.

Abbreviations

CFDComputational Fluid Dynamics
FTLEFinite-Time Lyapunov Exponent
ITSInstitut für Thermische Strömungsmaschinen
IVDInstitut für Visualisierung und Datenanalyse
LCSLagrangian-Coherent Structure
SPHSmoothed Particle Hydrodynamics
Nomenclature
η Regularizing parameter
κ Isentropic coefficient
λ Eigenvalues
ν Kinematic viscosity
ρ Density
τ Shear stress
ϕ Flow map
C Right Cauchy–Green tensor
F Gradient of flowmap
L Tensor for Kernel correction
bArbitrary vector
cSpeed of sound
f Volume forces
hSmoothing length
mMass
nDimension
pPressure
QArbitrary matrix
r Distance vector
tTime
VVolume
v Velocity
WKernel
x Position
Operators
Gradient
Δ Difference
Dyadic product
SPH discretization
Subscripts
aParticle a
bParticle b
b a c k Background
a b Difference between particles a and b
g a s Property of gas
l i q u i d Property of liquid
n o m Reference for EOS
o p t Optimal value for integration time
r e f Reference value for integration time
0Reference point in time
1 , 2 , 3 Indices of certain times

References

  1. Lefebvre, A.; Ballal, D.R. Gas Turbine Combustion, 3rd ed.; CRC Press: Boca Raton, FL, USA, 2010. [Google Scholar]
  2. Jones, W.P.; Lyra, S.; Navarro-Martinez, S. Numerical investigation of swirling kerosene spray flames using Large Eddy Simulation. Combust. Flame 2012, 159, 1539–1561. [Google Scholar] [CrossRef]
  3. Knudsen, E.; Shashank; Pitsch, H. Modeling partially premixed combustion behavior in multiphase LES. Combust. Flame 2015, 162, 159–180. [Google Scholar] [CrossRef]
  4. Braun, S.; Wieth, L.; Dauch, T.; Keller, M.; Chaussonnet, G.; Höfler, C.; Koch, R.; Bauer, H.J. HPC Predictions of Primary Atomization with SPH: Challenges and Lessons Learned. In Proceedings of the 11th International SPHERIC Workshop, Munich, Germany, 13–16 June 2016. [Google Scholar]
  5. Koch, R.; Braun, S.; Wieth, L.; Chaussonnet, G.; Dauch, T.F.; Bauer, H.J. Prediction of primary atomization using Smoothed Particle Hydrodynamics. Eur. J. Mech. B/Fluids 2017, 61 Pt 2, 271–278. [Google Scholar] [CrossRef] [Green Version]
  6. Nagel, W.E.; Kröner, D.H.; Resch, M.M. (Eds.) High Performance Computing in Science and Engineering ’16; Springer: Cham, Switzerland, 2016. [Google Scholar]
  7. Dauch, T.F.; Braun, S.; Wieth, L.; Chaussonnet, G.; Keller, M.C.; Koch, R.; Bauer, H.J. Computation of Liquid Fuel Atomization and Mixing by Means of the SPH Method: Application to a Jet Engine Fuel Nozzle. In Proceedings of the ASME Turbo Expo 2016: Turbine Technical Conference and Exposition (GT2016-56023), Seoul, Korea, 13–17 June 2016. [Google Scholar] [CrossRef]
  8. Dauch, T.F.; Braun, S.; Wieth, L.; Chaussonnet, G.; Keller, M.C.; Koch, R.; Bauer, H.J. Computational Prediction of Primary Breakup in Fuel Spray Nozzles for Aero-Engine Combustors. In Proceedings of the ILASS Europe, 29th Annual Conference on Liquid Atomization and Spray Systems, Valencia, Spain, 6–8 September 2017. [Google Scholar] [CrossRef]
  9. Chaussonnet, G.; Braun, S.; Wieth, L.; Koch, R.; Bauer, H.J.; Sänger, A.; Jakobs, T.; Djordjevic, N.; Kolb, T. SPH Simulation of a Twin-Fluid Atomizer Operating with a High Viscosity Liquid. In Proceedings of the ICLASS 2015, 13th Triennial International Conference on Liquid Atomization and Spray Systems, Tainan, Taiwan, 23–27 August 2015. [Google Scholar]
  10. Zandian, A.; Sirignano, W.A.; Hussain, F. Understanding liquid-jet atomization cascades via vortex dynamics. J. Fluid Mech. 2018, 843, 293–354. [Google Scholar] [CrossRef] [Green Version]
  11. Dauch, T.; Rapp, T.; Chaussonnet, G.; Braun, S.; Keller, M.; Kaden, J.; Koch, R.; Dachsbacher, C.; Bauer, H.J. Highly efficient computation of Finite-Time Lyapunov Exponents (FTLE) on GPUs based on three-dimensional SPH datasets. Comput. Fluids 2018, 175, 129–141. [Google Scholar] [CrossRef]
  12. Dauch, T.F.; Okraschevski, M.; Keller, M.C.; Braun, S.; Wieth, L.; Chaussonnet, G.; Koch, R.; Bauer, H.J. Preprocessing Workflow for the Initialization of SPH Predictions based on Arbitrary CAD Models. In Proceedings of the 12th International SPHERIC Workshop, Ourense, Spain, 12–15 June 2017. [Google Scholar]
  13. Braun, S.; Wieth, L.; Holz, S.; Dauch, T.F.; Keller, M.C.; Chaussonnet, G.; Gepperth, S.; Koch, R.; Bauer, H.J. Numerical prediction of air-assisted primary atomization using Smoothed Particle Hydrodynamics. Int. J. Multiph. Flow 2019, 114, 303–315. [Google Scholar] [CrossRef]
  14. Chaussonnet, G.; Braun, S.; Dauch, T.; Keller, M.; Sänger, A.; Jakobs, T.; Koch, R.; Kolb, T.; Bauer, H.J. Toward the development of a virtual spray test-rig using the Smoothed Particle Hydrodynamics method. Comput. Fluids 2019, 180, 68–81. [Google Scholar] [CrossRef] [Green Version]
  15. Español, P.; Revenga, M. Smoothed dissipative particle dynamics. Phys. Rev. E 2003, 67, 026705. [Google Scholar] [CrossRef] [PubMed]
  16. Hu, X.Y.; Adams, N.A. A multi-phase SPH method for macroscopic and mesoscopic flows. J. Comput. Phys. 2006, 213, 844–861. [Google Scholar] [CrossRef]
  17. Monaghan, J. Smoothed Particle Hydrodynamics. Ann. Rev. Astron. Astrophys. 1992, 30, 543–574. [Google Scholar] [CrossRef]
  18. Szewc, K.; Pozorski, J.; Minier, J.P. Analysis of the incompressibility constraint in the smoothed particle hydrodynamics method. Int. J. Numer. Methods Eng. 2012, 92, 343–369. [Google Scholar] [CrossRef] [Green Version]
  19. Cleary, P.W. Modelling confined multi-material heat and mass flows using SPH. Appl. Math. Model. 1998, 22, 981–993. [Google Scholar] [CrossRef] [Green Version]
  20. Cole, R.H.; Weller, R. Underwater Explosions. Phys. Today 1948, 1, 35. [Google Scholar] [CrossRef]
  21. Liu, M.B.; Liu, G.R. Smoothed Particle Hydrodynamics (SPH): An Overview and Recent Developments. Arch. Comput. Methods Eng. 2010, 17, 25–76. [Google Scholar] [CrossRef]
  22. Gorokhovski, M.; Herrmann, M. Modeling Primary Atomization. Ann. Rev. Fluid Mech. 2008, 40, 343–366. [Google Scholar] [CrossRef]
  23. Jeong, J.; Hussain, F. On the identification of a vortex. J. Fluid Mech. 1995, 285, 69–94. [Google Scholar] [CrossRef]
  24. Hunt, J.C.R. Vorticity and vortex dynamics in complex turbulent flows. In Canadian Society for Mechanical Engineering; NRC Research Press: Ottawa, ON, Canada, 1987; Volume 11, pp. 21–35. ISSN 0315-8977. [Google Scholar]
  25. Haller, G. An objective definition of a vortex. J. Fluid Mech. 2005, 525, 1–26. [Google Scholar] [CrossRef] [Green Version]
  26. Sun, P.N.; Colagrossi, A.; Marrone, S.; Zhang, A.M. Detection of Lagrangian Coherent Structures in the SPH framework. Comput. Methods Appl. Mech. Eng. 2016, 305, 849–868. [Google Scholar] [CrossRef]
  27. Bonet, J.; Lok, T.S.L. Variational and momentum preservation aspects of Smooth Particle Hydrodynamic formulations. Comput. Methods Appl. Mech. Eng. 1999, 180, 97–115. [Google Scholar] [CrossRef]
  28. Steinthorsson, E.; Benjamin, M.A.; Barnhart, D.R. Fuel Nozzle for Turbine Combustion Engines Having Aerodynamic Turning Vanes. U.S. Patent No. 6883332 B2, 26 April 2005. [Google Scholar]
  29. Mansour, A.; Benjamin, M. Pure Airblast Nozzle. U.S. Patent No. 6622488 B2, 23 September 2003. [Google Scholar]
  30. Zandian, A.; Sirignano, W.; Hussain, F. Mechanisms of Liquid Stream Breakup: Vorticity and Time and Length Scales. In Proceedings of the ILASS Europe, 29th Annual Conference on Liquid Atomization and Spray Systems, Valencia, Spain, 6–8 September 2017. Editorial Universitat Politècnica de València. [Google Scholar] [CrossRef]
Figure 1. Virtual fuel spray nozzle test rig. SPH: smoothed particle hydrodynamics.
Energies 12 02552 g001
Figure 2. Fuel spray nozzle by Mansour [29].
Energies 12 02552 g002
Figure 3. Nozzle geometry and computational domain.
Energies 12 02552 g003
Figure 4. Fuel spray nozzle geometries.
Energies 12 02552 g004
Figure 5. Instantaneous velocity vector and vorticity fields. (A): Balanced Condition t 0 ; (B): Vortex Formation t 1 ; (C): Flow Reversal t 2 .
Energies 12 02552 g005
Figure 6. Instantaneous FTLE fields. FTLE : Backward in time Finite-Time Lyapunov Exponent. (A): Balanced Condition t 0 ; (B): Vortex Formation t 1 ; (C): Flow Reversal t 2 .
Energies 12 02552 g006
Figure 7. Fields of the FTLE for different values of Δ t .
Energies 12 02552 g007
Figure 8. FTLE fields—influence of the integration time.
Energies 12 02552 g008
Figure 9. Timeline—variation of Δ t at different reference points in time.
Energies 12 02552 g009
Figure 10. Instantaneous FTLE fields: (left) Wide slit with cavity; (right) Narrow slit. (A): Vortex detaching from cavity; (B): Vortex passing; (C): Vortex merging boundary layer at phase interface w/o interaction; (D): Vortex merging boundary layer at phase interface with interaction.
Energies 12 02552 g010