The Relations of Oil Price Change with Fear Gauges in Global Political and Economic Environment


Abstract
:
1. Introduction
2. Research Methods
2.1. Structural Change Model
2.2. ARDL-ECM Cointegration Model
3. Empirical Result and Analysis
3.1. Data Source
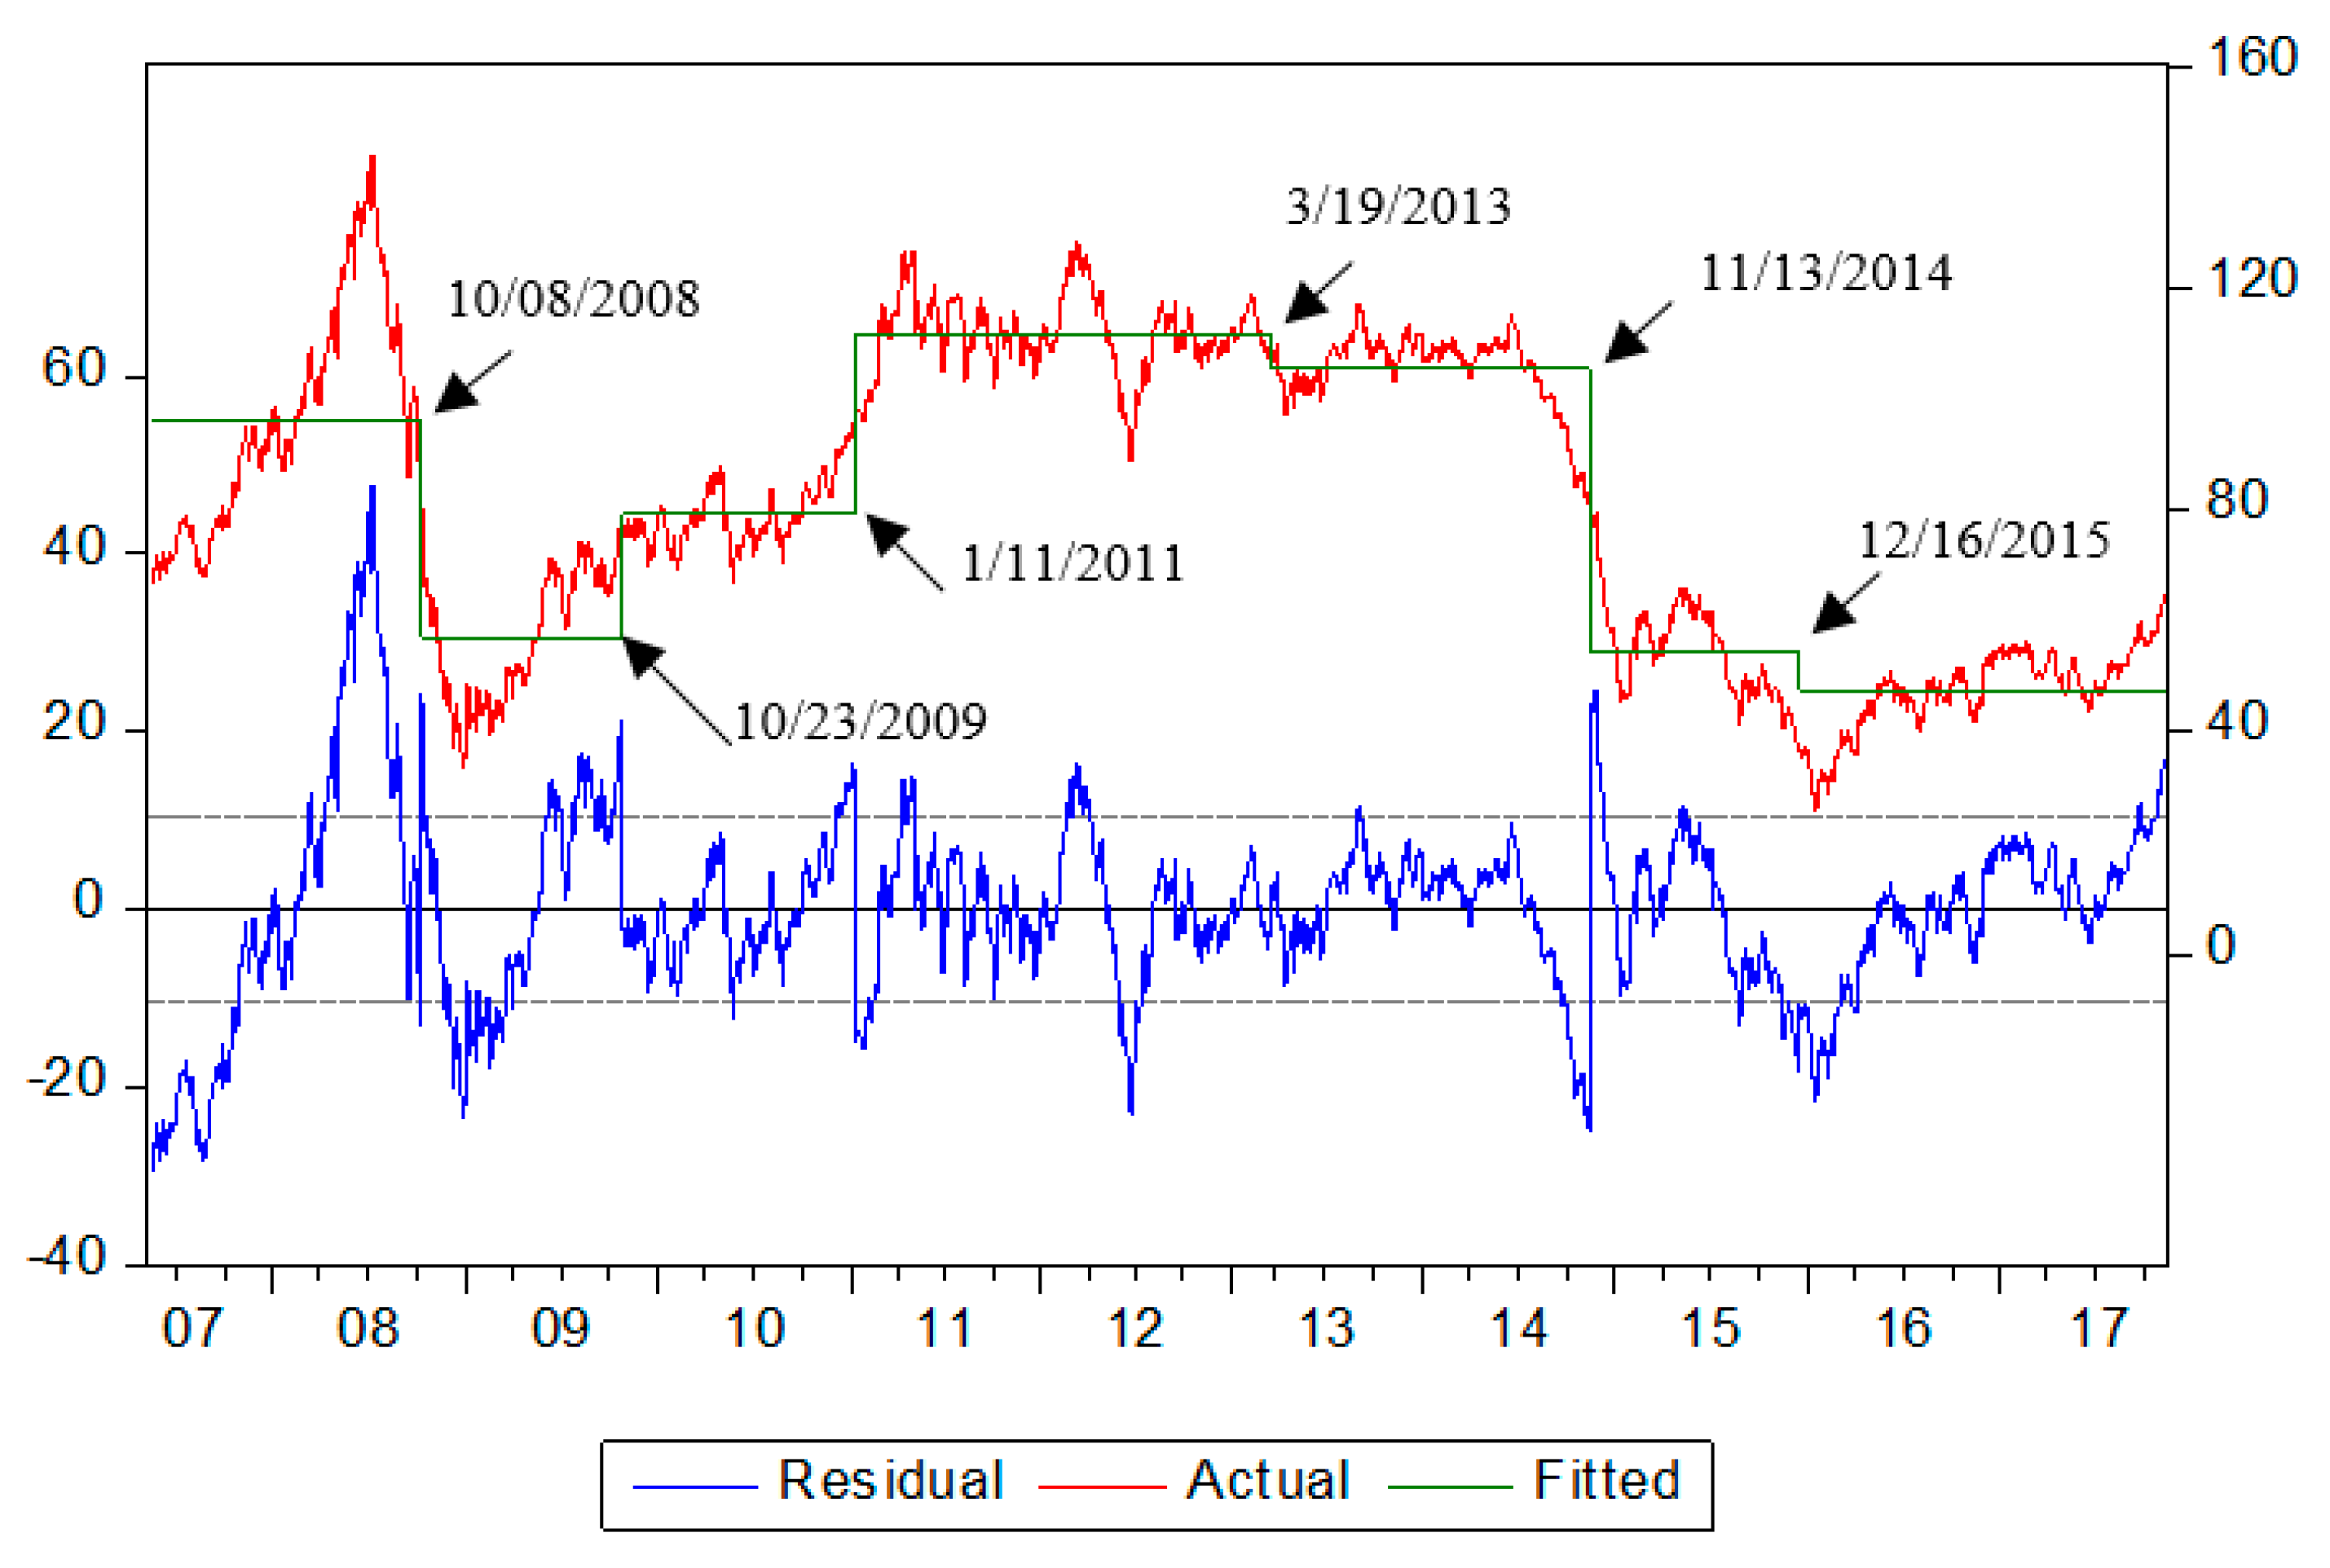
3.2. Analysis of Structural Changes
3.2.1. Number and Date of the Structural Change
3.2.2. ARDL-ECM Cointegration Analysis
3.3. Correlation Analysis
4. Conclusions and Suggestions
Author Contributions
Funding
Acknowledgments
Conflicts of Interest
Appendix A
References
- Radetzki, M. The anatomy of three commodity booms. Resour. Policy 2006, 31, 56–64. [Google Scholar] [CrossRef]
- Fan, Y.; Xu, J.H. What has driven oil prices since 2000? A structural change perspective. Energy Econ. 2011, 33, 1082–1094. [Google Scholar] [CrossRef]
- Klett, T.R.; Gautier, D.L.; Ahlbrandt, T.S. An evaluation of the U.S. Geological Survey World Petroleum Assessment 2000. AAPG Bull. 2005, 89, 1033–1042. [Google Scholar] [CrossRef]
- Aguilera, R.F.; Eggert, R.G.; Lagos, G.; Tilton, J.E. Depletion and the Future Availability of Petroleum Resources. Energy J. 2009, 30, 141–175. [Google Scholar] [CrossRef]
- Cifarelli, G.; Paladino, G. Oil price dynamics and speculation: A multivariate financial approach. Energy Econ. 2010, 32, 363–372. [Google Scholar] [CrossRef]
- Kaufmann, R.K. The role of market fundamentals and speculation in recent price changes for crude oil. Energy Policy 2011, 39, 105–115. [Google Scholar] [CrossRef]
- Liu, M.L.; Ji, Q.; Fan, Y. How does oil market uncertainty interact with other markets? An empirical analysis of implied volatility index. Energy 2013, 55, 860–868. [Google Scholar] [CrossRef]
- Ratti, R.A.; Vespignani, J.L. Why are crude oil prices high when global activity is weak? Econ. Lett. 2013, 121, 133–136. [Google Scholar] [CrossRef] [Green Version]
- Hesary, F.T.; Yoshino, N. Monetary policies and oil price determination: An empirical analysis. OPEC Energy Rev. 2014, 38, 1–20. [Google Scholar] [CrossRef]
- Bhar, R.; Malliaris, A. Oil prices and the impact of the financial crisis of 2007–2009. Energy Econ. 2011, 33, 1049–1054. [Google Scholar] [CrossRef]
- Benhmad, F. Modeling nonlinear Granger causality between the oil price and U.S. dollar: A wavelet based approach. Econ. Model. 2012, 29, 1505–1514. [Google Scholar] [CrossRef]
- Kilian, L.; Murphy, D.P. The role of inventories and speculative trading in the global market for crude oil. J. Appl. Econom. 2014, 29, 454–478. [Google Scholar] [CrossRef]
- Sims, C.A.; Zha, T. Were There Regime Switches in U.S. Monetary Policy? Am. Econ. Rev. 2006, 96, 54–81. [Google Scholar] [CrossRef] [Green Version]
- Davig, T. Regime-switching debt and taxation. J. Monet. Econ. 2004, 51, 837–859. [Google Scholar] [CrossRef]
- Malik, F.; Ewing, B.T. Volatility transmission between oil prices and equity sector returns. Int. Rev. Financ. Anal. 2009, 18, 95–100. [Google Scholar] [CrossRef]
- Ewing, B.T.; Malik, F. Volatility spillovers between oil prices and the stock market under structural breaks. Glob. Financ. J. 2016, 29, 12–23. [Google Scholar] [CrossRef]
- Olofin, S.; Salisu, A.A. Modelling Oil Price-Inflation Nexus: The role of Asymmetries and Structural Breaks. In Centre for Econometric and Allied Research; University of Ibadan: Ibadan, Nigeria, 2017; pp. 1–44. [Google Scholar]
- Gregory, A.W.; Hansen, B.E. Residual-based tests for cointegration in models with regime shifts. J. Econ. 1996, 70, 99–126. [Google Scholar] [CrossRef] [Green Version]
- Perron, P. The Great Crash, the Oil Price Shock, and the Unit Root. Hypothesis Econom. 1989, 57, 1361–1401. [Google Scholar] [CrossRef]
- Zeileis, A.; Kleiber, C.; Krämer, W.; Hornik, K. Testing and dating of structural changes in practice. Comput. Stat. Data Anal. 2003, 44, 109–123. [Google Scholar] [CrossRef] [Green Version]
- Miller, J.I.; Ratti, R.A. Crude oil and stock markets: Stability, instability, and bubbles. Energy Econ. 2009, 31, 559–568. [Google Scholar] [CrossRef] [Green Version]
- Quandt, R.E. The Estimation of the Parameters of a Linear Regression System Obeying Two Separate Regimes. J. Am. Stat. Assoc. 1958, 53, 873–880. [Google Scholar] [CrossRef]
- Chow, G.C. Tests of Equality between Sets of Coefficients in Two Linear Regressions. Econometrica 1960, 28, 591–605. [Google Scholar] [CrossRef]
- Lee, J.; Strazicich, M.C. Minimum Lagrange Multiplier Unit Root Test with Two Structural Breaks. Rev. Econ. Stat. 2003, 85, 1082–1089. [Google Scholar] [CrossRef]
- Bai, J.; Perron, P. Critical values for multiple structural change tests. Econ. J. 2003, 6, 72–78. [Google Scholar] [CrossRef]
- Fernandes, M.; Medeiros, M.C.; Scharth, M. Modeling and predicting the CBOE market volatility index. J. Bank. Financ. 2014, 40, 1–10. [Google Scholar] [CrossRef]
- Robe, M.A.; Wallen, J. Fundamentals, derivatives market information and oil price volatility. J. Futures Mark. 2016, 36, 317–344. [Google Scholar] [CrossRef]
- Kristjanpoller, W.; Minutolo, M.C. Forecasting volatility of oil price using an artificial neural network-GARCH model. Expert Syst. Appl. 2016, 65, 233–241. [Google Scholar] [CrossRef]
- Bouri, E.; Lien, D.; Roubaud, D.; Shahzad, S.J.H. Directional predictability of implied volatility: From crude oil to developed and emerging stock markets. Financ. Res. Lett. 2018, 27, 65–79. [Google Scholar] [CrossRef]
- Zhou, Y. Modeling the joint dynamics of risk-neutral stock index and bond yield volatilities. J. Bank. Financ. 2014, 38, 216–228. [Google Scholar] [CrossRef]
- Kang, S.H.; Cheong, C.; Yoon, S.-M. Structural changes and volatility transmission in crude oil markets. Phys. A Stat. Mech. Appl. 2011, 390, 4317–4324. [Google Scholar] [CrossRef]
- CBOE. Available online: www.cboe.com/OVX (accessed on 10 July 2019).
- Sari, R.; Hammoudeh, S.; Soytaş, U. Dynamics of oil price, precious metal prices, and exchange rate. Energy Econ. 2010, 32, 351–362. [Google Scholar] [CrossRef]
- Hu, J.W.S.; Chang, H.Y. Elucidating the Relationship among Volatility Index, US Dollar Index and Oil Price. In Proceedings of the 7th Annual American Business Research Conference, Flushing, NY, USA, 23–24 July 2015. [Google Scholar]
- Basher, S.A.; Sadorsky, P. Hedging emerging market stock prices with oil, gold, VIX, and bonds: A comparison between DCC, ADCC and GO-GARCH. Energy Econ. 2016, 54, 235–247. [Google Scholar] [CrossRef]
- Dutta, A. Oil and energy sector stock markets: An analysis of implied volatility indexes. J. Multinatl. Financ. Manag. 2017, 44, 61–68. [Google Scholar] [CrossRef]
- Ji, Q.; Fan, Y. Modelling the joint dynamics of oil prices and investor fear gauge. Res. Int. Bus. Financ. 2016, 37, 242–251. [Google Scholar] [CrossRef]
- Aboura, S.; Chevallier, J. Leverage vs. feedback: Which Effect drives the oil market? Financ. Res. Lett. 2013, 10, 131–141. [Google Scholar] [CrossRef] [Green Version]
- Haugom, E.; Langeland, H.; Molnar, P.; Westgaard, S. Forecasting volatility of the U.S. oil market. J. Bank. Financ. 2014, 47, 1–14. [Google Scholar] [CrossRef] [Green Version]
- Chen, Y.; Zou, Y. Examination on the Relationship between OVX and Crude Oil Price with Kalman Filter. Procedia Comput. Sci. 2015, 55, 1359–1365. [Google Scholar] [CrossRef]
- Chen, Y.; He, K.; Yu, L. The Information Content of OVX for Crude Oil Returns Analysis and Risk Measurement: Evidence from the Kalman Filter Model. Ann. Data Sci. 2015, 2, 471–487. [Google Scholar] [CrossRef]
- Maghyereh, A.I.; Awartani, B.; Bouri, E. The directional volatility connectedness between crude oil and equity markets: New evidence from implied volatility indexes. Energy Econ. 2016, 57, 78–93. [Google Scholar] [CrossRef] [Green Version]
- Nikkinen, J.; Rothovius, T.; Dutta, A. Impact of oil price uncertainty on Middle East and African stock markets. Energy 2017, 123, 189–197. [Google Scholar]
- Wahab, F.F.; Masih, M. Discerning Lead-Lag between Fear Index and Realized Volatility; University Library of Munich: Munich, Germany, 2017. [Google Scholar]
- Fflix, J.A.; Fernandez-Perez, A.; Rivero, S.S.; Félix, J.A.; Rivero, S.S. Fear Connectedness Among Asset Classes. SSRN Electron. J. 2017, 50, 4234–4249. [Google Scholar]
- Bai, J.; Perron, P. Estimating and Testing Linear Models with Multiple Structural Changes. Econometrica 1998, 66, 47–78. [Google Scholar] [CrossRef]
- Bai, J.; Perron, P. Computation and analysis of multiple structural change models. J. Appl. Econ. 2003, 18, 1–22. [Google Scholar] [CrossRef]
- Pesaran, M.H.; Shin, Y.; Smith, R.J. Bounds testing approaches to the analysis of level relationships. J. Appl. Econ. 2001, 16, 289–326. [Google Scholar] [CrossRef]
- Zivot, E.; Andrews, D.W.K. Further Evidence on the Great Crash, the Oil-Price Shock, and the Unit-Root Hypothesis. J. Bus. Econ. Stat. 1992, 20, 25–44. [Google Scholar] [CrossRef]
- Andrews, D.W.K. Tests for Parameter Instability and Structural Change with Unknown Change Point. Econometrica 1993, 61, 821–856. [Google Scholar] [CrossRef]
- Perron, P. Further evidence on breaking trend functions in macroeconomic variables. J. Econ. 1997, 80, 355–385. [Google Scholar] [CrossRef] [Green Version]
- Lumsdaine, R.L.; Papell, D.H. Multiple Trend Breaks and the Unit-Root Hypothesis. Rev. Econ. Stat. 1997, 79, 212–218. [Google Scholar] [CrossRef]
- Atkins, F.J.; Coe, P.J. An ARDL bounds test of the long-run Fisher effect in the United States and Canada. J. Macroecon. 2002, 24, 255–266. [Google Scholar] [CrossRef]
- Yao, Y.C. Estimating the number of change-points via Schwarz’ criterion. Stat. Probab. Lett. 1988, 6, 181–189. [Google Scholar] [CrossRef]
- Liu, J.; Wu, S.; Zidek, J.V. On segmented multivariate regression. Stat. Sin. 1997, 7, 497–525. [Google Scholar]
- Pesaran, M.H.; Pesaran, B. Working with Microfit 4.0: Interactive Econometric Analysis; Oxford University Press: Oxford, UK, 1997. [Google Scholar]
- Lin, J.B.; Liang, C.C.; Tsai, W. Nonlinear Relationships between Oil Prices and Implied Volatilities: Providing More Valuable Information. Sustainability 2019, 11, 3906. [Google Scholar] [CrossRef]
- Bakanova, A. The Information Content of Implied Volatility in the Crude Oil Market. University of Lugano and Swiss Finance Institute. Available online: http://citeseerx.ist.psu.edu/viewdoc/download?doi=10.1.1.473.987&rep=rep1&type=pdf (accessed on 2 August 2019).
- Zhang, Y.J.; Yao, T. Interpreting the movement of oil prices: Driven by fundamentals or bubbles? Econ. Model. 2016, 55, 226–240. [Google Scholar] [CrossRef]
- Williams, B. Using the VIX to Time Markets. Futures Magazine, 4 June 2014. [Google Scholar]
- Singleton, K. The 2008 Boom/Bust in Oil Prices. Graduate School of Business, Stanford University. 2010. Available online: http://papers.ssrn.com/sol3/papers.cfm (accessed on 17 July 2019).
- Zhang, H.L.; Liu, C.X.; Zhao, M.Z.; Sun, Y.J.P.S. Economics, fundamentals, technology, finance, speculation and geopolitics of crude oil prices: An econometric analysis and forecast based on data from 1990 to 2017. Pet. Sci. 2018, 15, 432–450. [Google Scholar] [CrossRef]
- Baffes, J.; Kshirsagar, V. Sources of volatility during four oil price crashes. Appl. Econ. Lett. 2016, 23, 402–406. [Google Scholar] [CrossRef]


| Variables | Mean | Standard Deviation | Maximum | Minimum | Skewness | Kurtosis | J-B Value |
|---|---|---|---|---|---|---|---|
| OP | 81.854 | 27.589 | 143.950 | 26.010 | −0.063 | 1.652 | 201.30 *** |
| OVX | 37.002 | 13.856 | 100.420 | 14.500 | 1.389 | 5.791 | 1706.70 *** |
| VIX | 20.204 | 9.747 | 80.860 | 9.140 | 2.313 | 10.10 | 7903.86 *** |
| Specifications | Zt = [1] | q = 0 | p = 1 | M = 8 | h = 10 | |
|---|---|---|---|---|---|---|
| Number of Structural Change | ||||||
| SupFT(i) test | SupFT(l + 1|l) test | BIC | LWZ | |||
| 0 | 6.64 | 6.64 | ||||
| 1 | SupFT(1) | 2955.91 ** | 5.89 | 5.91 | ||
| 2 | SupFT(2) | 3578.87 ** | SupFT(2|1) | 1965.69 ** | 5.34 | 5.36 |
| 3 | SupFT(3) | 3871.36 ** | SupFT(3|2) | 1141.15 ** | 4.97 | 5.01 |
| 4 | SupFT(4) | 3614.75 ** | SupFT(4|3) | 568.04 ** | 4.79 | 4.845 |
| 5 | SupFT(5) | 3027.38 ** | SupFT(5|4) | 98.41 ** | 4.76 | 4.82 |
| 6 | SupFT(6) | 2614.21 ** | SupFT(6|7) | 59.60 ** | 4.73 | 4.81 |
| 7 | SupFT(7) | 2254.76 ** | SupFT(7|6) | 0.67 | 4.73 | 4.82 |
| 8 | SupFT(8) | 1971.24 ** | SupFT(8|7) | 0.00 | 4.74 | 4.84 |
| Estimation of Six Change Points | ||||||
| 96.158 *** | 57.082 *** | 79.279 *** | 111.78 *** | 105.41 *** | 54.77 *** | 47.64 *** |
| (30.01) | (26.85) | (82.61) | (128.09) | (107.86) | (36.14) | (48.46) |
| Structural Change Points and Dates | ||||||
| 8 October 2008 | 23 October 2009 | 11 January 2011 | 19 March 2013 | 13 November 2014 | 16 December 2015 | |
| 10 May 2007~7 October 2008 | 8 October 2008~22 October 2009 | 23 October 2009~10 January 2011 | 11 January 2011~18 March 2013 | 19 March 2013~12 November 2014 | 13 November 2014~15 December 2015 | 16 December 2015~13 November 2017 |
| Adjusted R2 | 0.854 | |||||
| F-statistic | 2585.633 (0.00) | |||||
| Panel A: Entire Sampling Period (10 May 2007~13 November 2017) | |||
| OP and OVX | OP and VIX | ||
| ARDL-ECM | ARDL-ECM | ||
| 10 May 2007~13 November 2017 | - | Model 3 | |
| Period | Panel B: Periods of Structural Change | ||
| 1 | 10 May 2007~7 October 2008 | - | - |
| 2 | 8 October 2008~22 October 2009 | Model 2, 3 | Model 2, 3 |
| 3 | 23 October 2009~10 January 2011 | - | Model 3 |
| 4 | 11 January 2011~18 March 2013 | Model 2 | Model 2 |
| 5 | 19 March 2013~12 November 2014 | - | - |
| 6 | 13 November 2014~15 December 2015 | - | Model 1 |
| 7 | 16 December 2015~13 November 2017 | - | Model 2, 3 |
| Entire Sampling Period | OP and OVX | OP and VIX | |
|---|---|---|---|
| 10 May 2007~13 November 2017 | −0.477 * | −0.116 | |
| Period | Sub-period | ||
| 1 | 10 May 2007~7 October 2008 | 0.79 ** | 0.16 |
| 2 | 8 October 2008~22 October 2009 | −0.75 ** | −0.53 * |
| 3 | 23 October 2009~10 January 2011 | −0.72 ** | −0.63 * |
| 4 | 11 January 2011~18 March 2013 | −0.18 | −0.171 |
| 5 | 19 March 2013~12 November 2014 | −0.56 * | −0.29 |
| 6 | 13 November 2014~15 December 2015 | −0.47 * | −0.51 * |
| 7 | 16 December 2015~13 November 2017 | −0.91 ** | −0.75 ** |
© 2019 by the authors. Licensee MDPI, Basel, Switzerland. This article is an open access article distributed under the terms and conditions of the Creative Commons Attribution (CC BY) license (http://creativecommons.org/licenses/by/4.0/).
Share and Cite
Lin, J.-B.; Tsai, W. The Relations of Oil Price Change with Fear Gauges in Global Political and Economic Environment. Energies 2019, 12, 2982. https://doi.org/10.3390/en12152982
Lin J-B, Tsai W. The Relations of Oil Price Change with Fear Gauges in Global Political and Economic Environment. Energies. 2019; 12(15):2982. https://doi.org/10.3390/en12152982
Chicago/Turabian StyleLin, Jeng-Bau, and Wei Tsai. 2019. "The Relations of Oil Price Change with Fear Gauges in Global Political and Economic Environment" Energies 12, no. 15: 2982. https://doi.org/10.3390/en12152982