Article

Thermal Performance Evaluation of a Data Center Cooling System under Fault Conditions

1
Department of Building and Plant Engineering, Hanbat National University, Daejeon 34158, Korea
2
Energy Division, KCL (Korea Conformity Laboratories), Jincheon 27872, Korea
*
Authors to whom correspondence should be addressed.
Energies 2019, 12(15), 2996; https://doi.org/10.3390/en12152996
Submission received: 12 July 2019 / Revised: 26 July 2019 / Accepted: 31 July 2019 / Published: 3 August 2019
(This article belongs to the Section G: Energy and Buildings)

Abstract

:
If a data center experiences a system outage or fault conditions, it becomes difficult to provide a stable and continuous information technology (IT) service. Therefore, it is critical to design and implement a backup system so that stability can be maintained even in emergency (unforeseen) situations. In this study, an actual 20 MW data center project was analyzed to evaluate the thermal performance of an IT server room during a cooling system outage under six fault conditions. In addition, a method of organizing and systematically managing operational stability and energy efficiency verification was identified for data center construction in accordance with the commissioning process. Up to a chilled water supply temperature of 17 °C and a computer room air handling unit air supply temperature of 24 °C, the temperature of the air flowing into the IT server room fell into the allowable range specified by the American Society of Heating, Refrigerating, and Air-Conditioning Engineers standard (18–27 °C). It was possible to perform allowable operations for approximately 320 s after cooling system outage. Starting at a chilled water supply temperature of 18 °C and an air supply temperature of 25 °C, a rapid temperature increase occurred, which is a serious cause of IT equipment failure. Due to the use of cold aisle containment and designs with relatively high chilled water and air supply temperatures, there is a high possibility that a rapid temperature increase inside an IT server room will occur during a cooling system outage. Thus, the backup system must be activated within 300 s. It is essential to understand the operational characteristics of data centers and design optimal cooling systems to ensure the reliability of high-density data centers. In particular, it is necessary to consider these physical results and to perform an integrated review of the time required for emergency cooling equipment to operate as well as the backup system availability time.

Graphical Abstract

1. Introduction

Over the past decade, data centers have made considerable efforts to ensure energy efficiency and reliability, and the size and stability of their facilities have been upgraded because of the enormous increase in demand [1,2]. Currently, the amount of data to be processed is expanding exponentially due to the growth of the information technology (IT) industry, and data center construction is on the rise to meet this demand. If a data center experiences a system outage or fault conditions, it becomes difficult to a provide stable and continuous IT service, such as internet, banking, telecommunication, broadcast, etc., and if this situation occurs on a large scale, it can even lead to chaos in the finance industry, the stock market, telecommunications, and the Internet. Therefore, it has become critical to design and implement backup and uninterruptible power supply (UPS) systems so that system stability can be maintained even in emergency situations.
As shown in Figure 1, considerable technological infrastructure is required in data centers to meet even the minimum requirements for Tier 1 system availability (96.671% uptime per year), which is the basic level. In specialized colocation data centers for business purposes, enormous system construction costs are required for uninterrupted system operation to ensure Tier 3–4 high availability (95.995–99.982% uptime) [3]. On the other hand, interest in environmental problems such as global warming and the demand for low-energy and high-efficiency buildings is increasing, so the use of excessive facilities in the pursuit of reliability alone must be avoided. Considering these facts, ensuring stable and efficient performance is an important aspect of data center design and implementation. Conventional construction methods are focused on tangible results such as the construction period and financial costs (not quality) necessary to set up the data center infrastructure according to the design plans, which can make it difficult to verify whether non-IT equipment is demonstrating proper performance or the design is operating as intended. Furthermore, it is not immediately apparent when equipment with performance problems is installed, and it can be difficult to detect the problems. Even if the problems are detected, it is difficult to determine clearly who is responsible between the major contractor and vendors; thus, a warranty cannot be requested. Data centers strengthen their stability by having redundant power supply paths, including emergency generators, UPSs, etc. IT servers require uninterruptible supplies of not only power, but also cooling [4,5,6]. For this purpose, central cooling systems are designed to allow for chilled water supply during cooling system outages by including cooling buffer tanks for stable cooling of IT equipment. If the chillers are interrupted, the emergency power and cooling system are activated and then the chilled water is supplied again. Consequently, the mission-critical facility design for the stable operation of data centers leads to huge cost increases, so careful reviews must be performed from the initial planning stage [7,8,9]. Considering that the number of times that such emergency situations occur during the life cycle of a data center building is very small and the tolerance of IT servers to various operational thermal environments has improved vastly compared to that in the past due to the development of IT equipment, there is considerable room for reducing the operating times and capacities of chilled-water storage tanks. In the global data center construction market, there has been a trend of expanding the commissioning process to verify designs through expert knowledge on stability and efficiency. The datacenter is equipped with a UPS and power generator. As the city power goes out, the UPS instantly kick in before starting the emergency power generator and no service is affected. Once a few seconds have passed to allow the generator to warm up, the power transfer switches the source of power from city to emergency generator. Most UPS are installed for IT equipment, not cooling systems. When power outages occur, the cooling system has critical issues for stable IT environments before supplying emergency power. This paper proposes a method of organizing and systematically managing operational stability and energy efficiency verification for data center construction in accordance with the commissioning process. This research aims to apply the IT environmental principle of maximum output from minimum input to emergency back-up system for cooling with UPS for chilled water circulation pump and buffer tank. The available time needed to maintain the IT environment by using the potential cooling energy of chilled water without a mechanical cooling system, was analyzed. In a case study on a currently completed 20 MW data center, we assumed an emergency situation in the cooling system and evaluated the subsequent temperature increases of the chilled water and the indoor temperature changes in the IT server room. For this purpose, we analyzed the thermal environment of the data center by employing a computational fluid dynamics (CFD) model and quantitatively examined the degree to which the environment inside the IT server room was maintained by secondary chilled water circulation when the central cooling plant was interrupted. The goal was to increase the reliability of the system by using the analysis results to set an initial cooling response limit time and determine an appropriate chilled-water storage tank size.

2. Literature Reviews

In recent years, a small number of theoretical studies have been conducted on data center cooling systems under fault conditions, including system thermal and energy performance, system distribution optimization, and simulation study. Kummert et al. [10] studied the impact of the air and water temperatures in the chiller system failure by using the TRNSYS simulation. The cooling plant and air temperature levels of data centers have made it possible to evaluate the design of cooling systems in response to system failures by power outage. Zavřel et al. [11] analyzed a support emergency power planning by using a building performance simulation and considered keeping the server room at an appropriate temperature in the event of a power outage at the data center. A case study was analyzed in detail for the emergency cooling possibility. Lin et al. [12] developed a transient real-time thermal modeling to demonstrate the data center cooling system at the loss of utility power and evaluated the IT environment characteristics of air temperature rise. In order to achieve the necessary temperature control during power outages, the appropriate method is recommend depending on the characteristics of each cooling system. Lin et al. [13] provided a practical strategy to control cooling and proposed the main factors related to the transient temperature rise during power supply failure. Moss [14] investigated how quickly an IT facility might heat up and what risk the data center might be at. Considering the large energy differences associated with running very cold data center temperatures, it is not a recommended strategy to extend ride-through time. Complacency could lead to the belief that the facility has more time than required to get data center running again, but this can be risky. Gao et al. [15] unveiled a new vulnerability of existing data centers with aggressive cooling energy saving policies, conducted thermal experiments, and uncovered effective thermal models at the data center, rack, and server levels. The results demonstrated that thermal attacks can largely increase the temperature of victim servers degrading their performance and reliability, negatively impacting on thermal conditions of neighboring servers causing local hotspots, raising the cooling cost, and even leading to cooling failures. Nada et al. [16] studied, with a physical-scaled data center model, the control of the cold air flow rates along the servers for the possibility of controlling the heterogeneous temperature distributions. Torell et al. [17] conducted data center cost analysis and demonstrated the importance of comprehensively evaluating data centers, including the energy of IT equipment. They also discussed the effects of elevated temperatures on server failure. By selecting equipment with a short restart time, maintaining sufficient back-up cooling capacity, and using heat storage, power outages can be managed in a predictable way. Few technical works have been carried on data center architecture and its IT load for supply air temperatures, power density, air containment, and right-sizing of cooling equipment. However, their thermal performance still needs to be clarified.

3. Major Issues in Data Center Planning

3.1. Root Causes and Scale of Fault Conditions

Data centers must be adequately furnished with various backup systems to prepare for unplanned outages, and operation training for facility managers must also be conducted properly. If adequate preparations are not made in this regard, it becomes impossible to provide stable and continuous IT services, which means that the data center fails to serve its intended purpose.
The results of benchmarking 63 data centers that experienced unplanned outages showed that the damage costs incurred in 2016 were 38% higher than in 2010, and the mean damage cost when an outage occurred at one data center increased from $505,502 in 2010 to $740,357 in 2016 [18]. Figure 2 summarizes the root causes and ratios of system outages in the sample of 63 data centers. The major cause was UPS system failure, which seems to be due to inadequate UPS reliability verification upon initial installation. To resolve this problem, it is necessary to verify equipment and systems thoroughly and to conduct trial runs according to a systematic process from the initial design phase. In addition, cooling system failures accounted for a large portion of the fault conditions. In the case of system outages due to accidents and mistakes, it is important to provide manuals for possible situations and training for facility managers, because even if there is backup equipment for dealing with outages, it is useless if the operational knowledge of the facility manager is poor. Figure 3 shows the damage cost as a function of the duration of the unplanned system outage. As can be seen, when an outage occurs, the damage cost is lower if the outage time is minimized by a quick response. As such, in order to create stable data centers, backup systems that can handle unexpected accidents must be systematically designed, tested, and managed from the initial stage. Even after construction, facility managers must be thoroughly educated and trained to respond immediately to unplanned outages.

3.2. Temperature and IT Reliability

Initially, data centers were designed and operated with a focus on IT equipment stability rather than energy savings. In the past, the temperatures and humidity levels of data centers were managed very strictly and kept at 21.5 °C and 45.5%, respectively, to maintain optimal thermal conditions for IT equipment operation. For years, IT support infrastructure system design had to match the specifications of high-density power components, including the proper cooling and operating condition ranges of the equipment. A considerable amount of energy is inevitably required to maintain a constant temperature and humidity level.
However, due to recent technological advances in the IT field, the heat resistance of such equipment has improved, and as warnings about energy costs and greenhouse gas emissions have become more prominent, the environmental specifications of equipment for air cooling have become somewhat more flexible. As shown in Table 1, an IT server intake temperature of 18–27 °C is recommended, and thus allowable temperature ranges of 15–32 °C (class 1) and 10–35 °C (class 2) with an allowable relative humidity range of 20–80% have been specified [19]. The insufficient amount of clear information about the reliability changes that can occur when IT equipment is operated has been an obstacle to proposing wider temperature and humidity ranges. Intel [20] conducted the first study on this topic, using industry standard IT servers to demonstrate that reliability is not physically affected much by temperature and humidity, which was an unexpected conclusion. Figure 4 presents the internal component temperature changes of a typical x86 server with a variable-speed fan according to changes in the server intake air temperature that were obtained by the American Society of Heating, Refrigerating, and Air-Conditioning Engineers (ASHRAE). To reduce the effects of server inlet temperature increases, the inside of the server is kept at a constant temperature by increasing the server fan speed. Therefore, the reliability of the server components is not directly affected by the inlet air temperature. However, there is a trade-off with the energy used by the fan. In server component and air flow management, changes in the server operating temperature have decisive effects on the stability of the server, but servers are designed to ease the changes into the operating range. Specifically, the increases in the data center operating temperature did not have any effects on the power consumption of the server until the server inlet temperature reached the set range. Figure 5 presents the failure rate changes for various IT servers and vendors, showing the spread of the variability between devices and the mean values at specific temperatures. Each data point shows not the actual number of failures, but rather the relative change in the failure rate in a sample of devices from several vendors. The device failure rate is normalized to 1.0 at 20 °C. Thus, Figure 6 demonstrates that the failure rate during continuous operation at 35 °C is 1.6 times higher than that during continuous operation at 20 °C. For example, if 500 servers are continuously operated in a hypothetical data center and it is assumed that an average of five servers will normally experience errors when operating at 20 °C, it is expected that an average of eight servers will experience errors when operating at 35 °C [21].

4. Case Study: Data Center and Modeling

4.1. Data Center Cooling System

This is a practice-based learning study in a 20 MW data center project (Figure 6). As shown in Figure 7, the cooling system of the case study data center is composed of central chilled water-type computer room air handling (CRAH) units with a district cooling system that supplies chilled water to a nine-story IT server room. In total, 43 CRAH units (to ensure a constant temperature and relative humidity) are installed on each floor, including n + 1 redundant units, and the racks of IT servers are basically installed in a cold aisle containment structure to allow relatively high temperatures for the supply air (SA) from the CRAH units. Therefore, from the primary side of the heat exchanger, the district chilled water undergoes thermal exchange so that relatively high-temperature chilled water is supplied to the secondary side. Furthermore, an emergency chilled water supply is contained within buffer (storage) tanks, for use in case an outage occurs. Table 2 shows the supply conditions of the central cooling system. Due to the nature of the data center business, the IT server room is full at each stage, but this analysis was performed on the top five floors, which were put together first during the initial operation phase. It is normal for the horizontal piping in a dedicated data center cooling system to be installed in a loop-type configuration on each floor with a redundant riser to prepare for emergencies. Chilled-water storage (buffer) tanks were installed to provide stable chilled water before the emergency power begins to be supplied in the event of a cooling system outage. It is important to identify an economical and optimal storage tank size by determining the time range during which the chilled water in the pipes can be recirculated and used without the cooling system without affecting the IT server operating environment. For this purpose, the amount of water in the pipes was calculated first. As shown in Table 3, the riser part calculations were performed by dividing the section by the pipe diameter, and the mechanical plant room and horizontal pipes of a typical floor were calculated to have the same pipe diameter. The total amount of water in the chilled water pipes was calculated to be 234.3 m3.

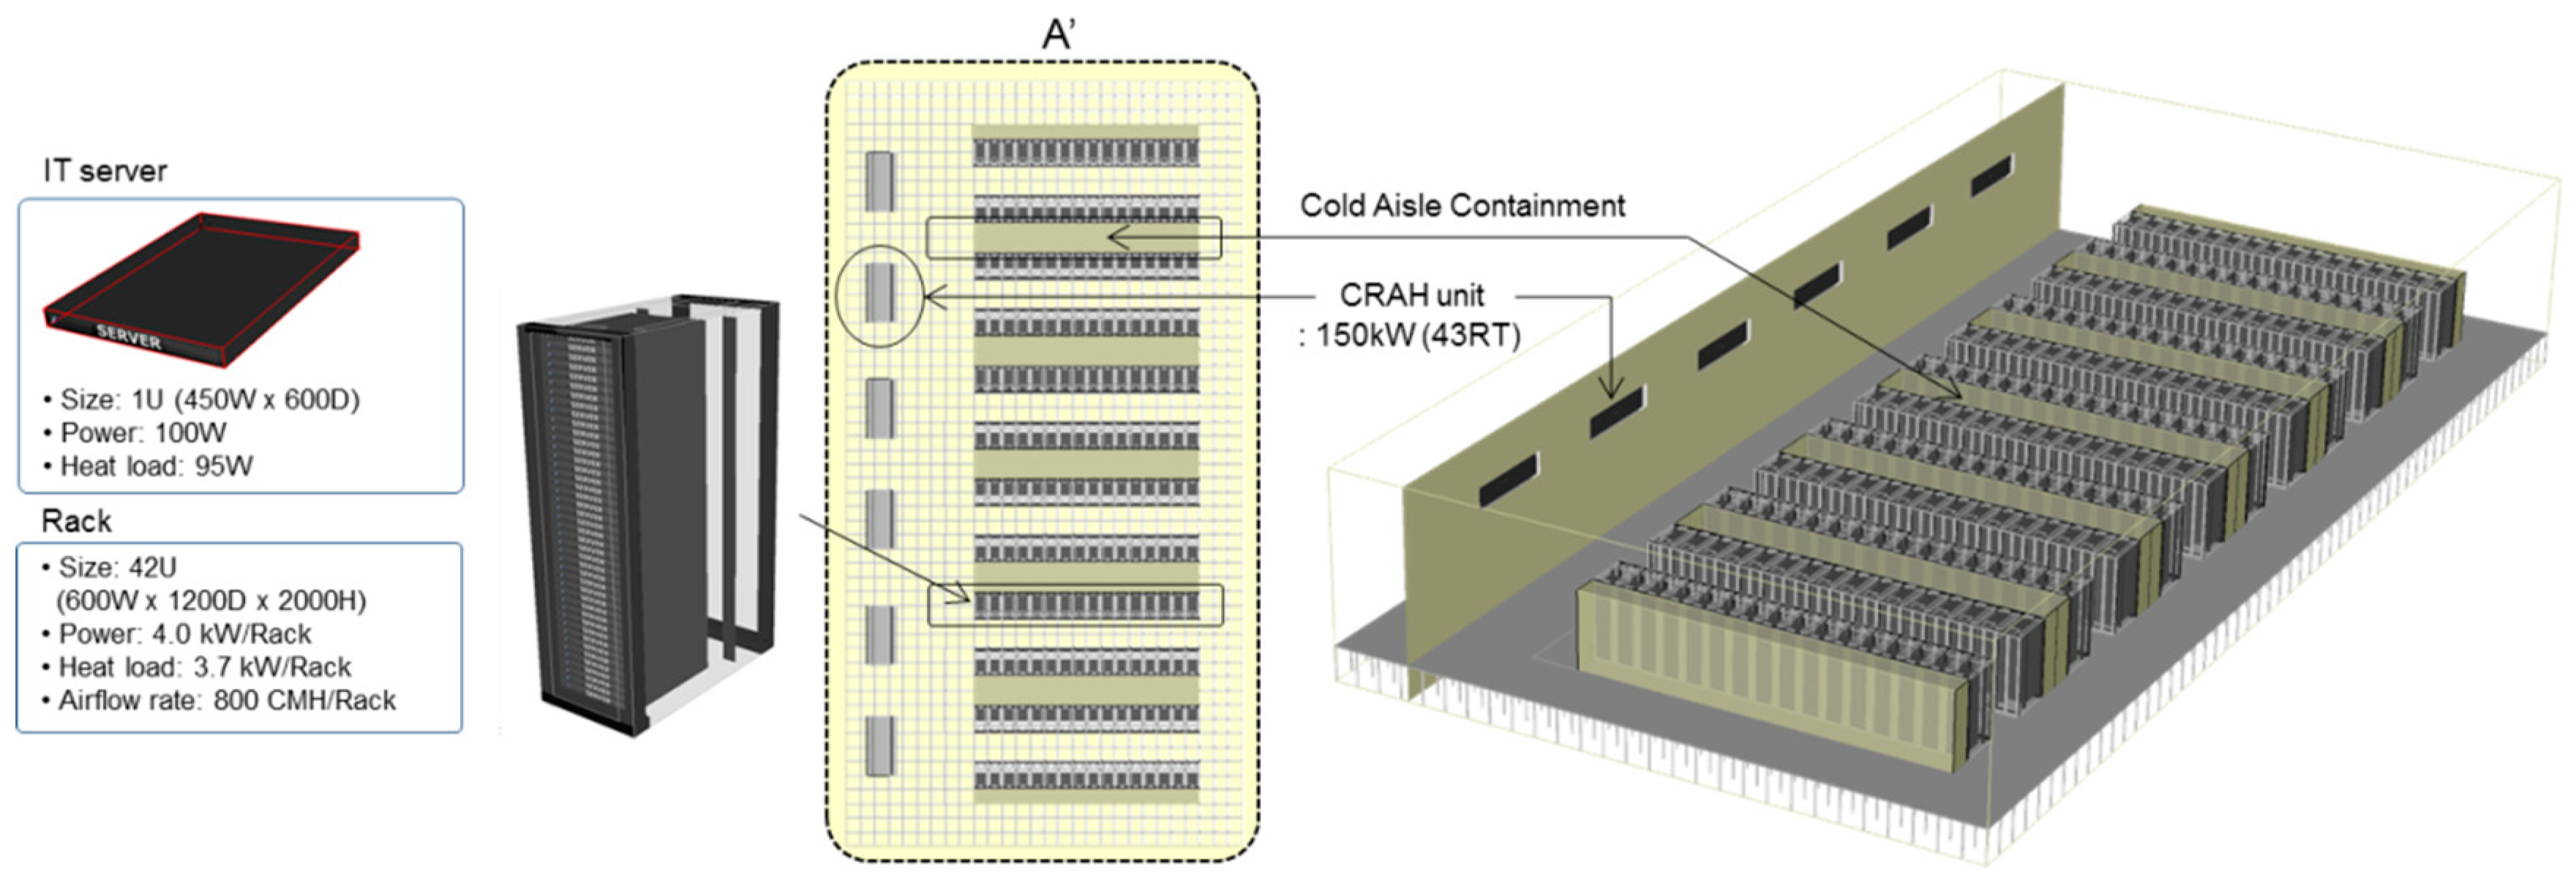
4.2. IT Server Room Thermal Model

By using the IT server room thermal model, the SA temperature of the CRAH units and the inlet air temperature of the IT servers were analyzed.
The inlet air temperature of each IT server was found to fall within the allowable temperature range specified in ASHRAE. In addition, a CFD simulation was performed to find the allowable chilled water supply temperature range by checking the SA temperature range of the CRAH units and calculating the time required for it to reach the allowable chilled water temperature range. To ensure the reliability of the CFD modeling, the characteristics of the IT equipment must be reflected accurately. There are various types of commercial simulation software for performing analysis. In this study, 6 Sigma DC was chosen, as it is specially designed to reflect the characteristics of data centers. This specialized evaluation program is intended for the designers of data center mechanical systems. One of its analysis modules, the 6 Sigma DC Room, is a CFD simulation module that can be used to perform integrated efficiency reviews of IT server rooms. The special feature of this module is that it has various information on and databases for the most important types of IT equipment that are employed in data centers, and it can create accurate IT environments [22]. The basic module was composed of a minimum of seven cold and hot aisles (area A’ in Figure 7), and the room depth was less than 15 m, which is the maximum distance that a CRAH unit can supply air for cooling. As shown in Figure 8, the IT equipment was composed of a rack that could hold a maximum of 42 U servers, and the power density was set at 4.0 kW/rack. In total, 192 IT server racks were arranged according to the standards presented in ASHRAE. The air distribution method was under floor air distribution + side wall air return, which is currently the most universal method. The raised floor height, which affects the air flow distribution, was set at 900 mm, and the ceiling height was set at 3.0 m. The SA temperature of a CRAH unit is an important factor that is closely related to the energy consumption of the cooling system. An increase in the SA temperature can cause the supply chilled water temperature to increase, so it is correlated with the cooling plant system. Table 4 shows the simulation boundary conditions, based on the operation conditions of the IT server. The chilled water temperature was changed to 10–18 °C to respond to CRAH unit SA temperatures of 20–25 °C. The data center environment standard ranges [19] at which IT servers could operate normally were set at 18–27 °C for the IT server inlet temperature and 40–60% as the judgment standards, as these are the recommended values for Classes A1–A4. The division of the operating environment of the IT equipment into four classes was according to the most reasonable standards required when judging the suitability of a CFD model (Table 1). The conditions shown here are those of the air flowing into the IT servers for actual cooling, so they do not have to be equal to the average conditions inside the server room.
In an emergency, it is possible to expand the ranges of allowable conditions, but if the thermal balance is upset, it does not take much time to exceed the allowable range. Thus, in this study, the analysis was performed with the recommended conditions.

4.3. Simulation Results

The cooling coil (heat exchanger) capacity of a CRAH unit is determined based on the minimum inlet chilled water temperature. Hence, if the chilled water supply temperature changes, the cooling coil capacity changes, and the temperature of the air supplied by the CRAH unit to the IT server room changes accordingly. Analysis was performed on the air inlet and outlet (SA/RA) temperature variations with the cold chilled water inlet temperature based on the technical data of the CRAH unit that was used in this study. According to the results, allowable operation conditions are achievable up to a chilled water supply temperature of 14 °C, but if chilled water is supplied at a temperature of 15 °C or higher, the cooling coil capacity of the CRAH unit is reduced, and the temperature of the air supplied to the IT server room will increase, as shown in Figure 9. In the CFD simulation results, the IT server inlet air temperature and server room temperature distribution as functions of the temperature of the air supplied by the CRAH unit and the chilled water supply temperature conditions are shown in Figure 10 and Figure 11. The most important element in the evaluation of the air distribution efficiency of an IT server room is the air temperature distribution within the room, particularly the inlet air temperature of the IT server. Since an increase in the inlet air temperature is a primary factor in server failure, the air distribution efficiency was increased by using cold aisle containment, which involves physical isolation of the air inflow part of the IT server. Although the temperature ranges differ according to the SA temperature, the containment system clearly has a difference between the cold and hot aisle air temperatures because the cold and hot aisles are separated overall. Temperature increases due to the recirculation of outlet air as inlet air of IT servers are a major cause of server failures, and the failures mainly occur at the top of the rack-server. If the server room cooling load (i.e., the heat gain from the servers) is less than 85% of the cooling capacity of the CRAH unit, then acceptable operation conditions are achievable until the SA temperature reaches approximately 24.0 °C, according to the design cooling capacity, and at this time the chilled water temperature is 17 °C. As shown in Figure 12, if the chilled water temperature exceeds 17 °C, the cooling capacity of the CRAH unit decreases to less than 80%, and the indoor temperature increases rapidly. This steady-state result was obtained by analyzing the temperature changes based on the cooling coil capacity of the CRAH unit.

5. Temperature Control Approaches

5.1. Temperature Increase over Time After a Cooling System Outage

After finding the allowable chilled water temperature range by performing CFD analysis, the next step was to calculate the time to reach this temperature. The increase in the chilled water temperature after a cooling system outage was analyzed by performing a system scale-down to conduct the calculations for a typical floor. Consequently, the total amount of water inside the chilled water pipes was around 45 m3/floor based on the typical floor. Table 5 shows the cooling capacity and operating conditions of the CRAH unit of the typical floor. Equations (1)–(3) are the basic functions for calculating the rate of change of the chilled water temperature in the pipes and the delay time after a cooling system outage.
In detail, the total cooling coil capacity of CRAH unit (C) is proportionate to the chilled water flow rate (Q) and temperature differential of chilled water return (TCHR) and supply (TCHS). Therefore, the total chilled water flow rate of CRAH unit is the total cooling coil capacity in inverse proportion to chilled water temperature differential ( Δ T). The one cycle operating time of chilled water return and supply can be the water volume in chilled water pipes (V) divided by the chilled water flow rate. As shown in Equation (4), if the heat gain of the IT server room is constant, a constant amount of cooling should be supplied by the cooling coil of the CRAH unit.
C = Q × ρ × ρ × ( T C H R T C H S ) = Q × ρ × ρ × Δ T ,
Q = C ρ × ρ × Δ T ,
t = V Q = V × ρ × ρ × Δ T C ,
Δ T n = ( T C H R ) n ( T C H S ) n = 5.5     ( f i x e d ) .
If the temperature difference ΔT between the chilled water inlet and outlet temperatures is assumed to be constant 5.5 °C, the functions for the chilled water temperature changes can be expressed as Equation (5). Therefore, the circulation n + 1th chilled water supply temperature is nth chilled water supply temperature +5.5 °C. The delay time is Equation (6). With these functions, the point in time at which the cooling system outage occurred was set to T0 to calculate the range of increase of the chilled water temperature due to cool loss over time. At this point in time, out of the total amount of water (V2 or 45 m3), the amount of chilled water at 10 °C in the chilled water supply (CHS) pipe excluding the amount of chilled water at 15.5 °C in the chilled water return (CHR) pipe passing through the CRAH unit is 22.5 m3 or 50%, and the amount of water at this time is V1. In addition, t1 is the time at which the thermal capacity of V1 is fully exhausted and the temperature of the entire amount of V2 reaches 15.5 °C, which was calculated to be 3.45 min by applying Equation (6). The times t2 and t3 at which all of V2 reaches 21.0 and 26.5 °C are 10.36 and 17.27 min, respectively. The chilled water temperature time function for each specific interval can be expressed as shown in Equation (7).
f ( ( T C H S ) n + 1 ) = ( T C H S ) n + Δ T n = ( T C H R ) n ,
f ( t n ) = V 1 × ρ × ρ × Δ T 1 C + n > 1 V 2 × ρ × ρ × Δ T n C ,
f ( t ) = 6 E 14 x 5 2 E 10 x 4 + 2 E 07 x 3 + 1 E 04 x 2 + 0.0436 x + 10   ( R 2 = 0.99 ) .

5.2. System Response to IT Environment under Fault Conditions

The results of analyzing the amount of cooling supplied by the CRAH units based on the potential cooling capacity showed that a period of approximately 150 s (2 min 30 s) is required for the temperature of the chilled water in a pipe to increase from 10 to 14 °C. The cooling system selection is implemented to enable the CRAH unit to maintain a set temperature up to a chilled water supply temperature of 14 °C for the water-side economizer, and up to this point in time, it is in the safe range. Up to a chilled water temperature of 14 °C, the maintenance of the IT environment is unaffected by changes in the air inlet and outlet temperatures (of the CRAH units) caused by changes in the chilled water inlet and outlet temperatures (of the cooling coils in the CRAH units), based on the technical data provided by the equipment manufacturer. As for the inlet air temperature of the IT server, which was found in the CFD simulation, 24 °C is the maximum allowable temperature of the supply air from the CRAH units that enables the ASHRAE allowable temperature requirements to be met. Furthermore, the maximum chilled water supply temperature at which the air temperature can be maintained is 17 °C. The time required to reach this chilled water temperature is around 320 s (5 min 20 s) after a cooling system outage, during which allowable operation is possible. Figure 13 shows the safe and allowable operation periods according to the chilled water temperature.

6. Conclusions

The temperature conditions and allowable operation times of the chilled water and air sides of a CRAH unit after an unplanned cooling system outage were analyzed for the stable and economical design of and equipment selection for data center cooling systems. CFD analysis of each stage was performed to analyze the temperature of the air supplied to the server to remove the heat gain of the IT server with changes in the supply air temperature and cooling capacity of the CRAH unit, and the results were compared to the ASHRAE standard. The changes in the air supply temperature and cooling capacity of the CRAH unit were predicted according to the changes in the chilled water inlet temperature. Finally, the chilled water temperature increases over time after removal of the IT server room cooling load were calculated based on the amount of water in the chilled water pipe and the thermal capacity in order to determine the safe and allowable operation periods.
(1)
Up to a chilled water supply temperature of 17 °C and a CRAH unit air supply temperature of 24 °C, the temperature of the air flowing into the IT server fell within the required range set forth in the ASHRAE standard (18–27 °C). Using a CRAH unit coil capacity of 85%, it was possible to perform allowable operations for approximately 320 s after cooling system outage.
(2)
Starting at a CRAH unit chilled water supply temperature of 18 °C and an air supply temperature of 25 °C, the coil capacity became smaller than the cooling load, and a rapid temperature increase occurred, which is a serious cause of IT equipment failure.
(3)
Currently, the number of cases in which cold aisle containment and designs with relatively high chilled water and air supply temperatures are used is increasing. During a cooling system outage, there is a high possibility that a rapid temperature increase will occur inside the IT server room. Thus, backup systems must be activated within 300 s. The fixed value is the maximum allowable time until the cooling system re-starts working.
It is essential to understand the operational characteristics of data centers and design optimal cooling systems to ensure the reliability of high-density data centers. In particular, it is necessary to consider these physical results and to perform integrated reviews of the time required for emergency cooling equipment to operate and the availability time of the chilled water storage tanks. In addition, integrated safety evaluations must be performed, and the effects of each design element must be determined in future research.

Author Contributions

Investigation, J.C.; Simulation analysis, J.C.; Formal analysis, B.P. and Y.J.; Literature review, B.P. and Y.J.; Writing-original draft preparation, J.C.; Writing-review and editing, B.P. and Y.J.

Funding

This research was supported by grant of the research fund of the MOTIE (Ministry of Trade, Industry and Energy) in 2019. Project number: 20182010600010.

Conflicts of Interest

The authors declare no conflict of interest.

Nomenclature

Nomenclature
Ccooling coil capacity of CRAH unit (kW)
Qchilled water flow rate (m3/h)
Vwater volume in chilled water pipes (m3)
Tchilled water temperature (°C)
Δ Tchilled water temperature differential (°C)
Cpspecific heat (J/kg°C)
ρdensity (kg/m3)
toperating time (s)
Subscripts and Superscripts
CRAHcomputer room air handling
CHSchilled water supply (in CRAH unit)
CHRchilled water return (in CRAH unit)
nnumber of data

References

  1. Zhang, K.; Zhang, Y.; Liu, J.; Niu, X. Recent advancements on thermal management and evaluation for data centers. Appl. Therm. Eng. 2018, 142, 215–231. [Google Scholar] [CrossRef]
  2. Garday, D.; Housley, J. Thermal Storage System Provides Emergency Data Center Cooling; Doug Garday and Jens Housley, Intel Corporation: Santa Clara, CA, USA, 2007. [Google Scholar]
  3. Tunner, W.P.; Seader, J.H.; Brill, K.G. Tier Classifications Define Site Infrastructure Performance; White Paper; The Uptime Institute, Inc.: NewYork, NK, USA, 2005. [Google Scholar]
  4. Cho, J.; Lim, T.; Kim, B.S. Measurements and predictions of the air distribution systems in high compute density (Internet) data centers. Energy Build. 2009, 41, 1107–1115. [Google Scholar] [CrossRef]
  5. Nadjahi, C.; Louahlia, H.; Lemasson, S. A review of thermal management and innovative cooling strategies for data center. Sustain. Comput. Inf. Syst. 2018, 19, 14–28. [Google Scholar] [CrossRef]
  6. ASHRAE TC 9.9. Design Considerations for Datacom Equipment Centers; American Society of Heating Refrigerating and Air-Conditioning Engineers Inc.: Atlanta, GA, USA, 2005. [Google Scholar]
  7. Hasan, Z. Redundancy for Data Centers. ASHRAE J. 2009, 51, 52–54. [Google Scholar]
  8. Hartmann, B.; Farkas, C. Energy efficient data centre infrastructure—Development of a power loss model. Energy Build. 2016, 127, 692–699. [Google Scholar] [CrossRef]
  9. He, Z.; Ding, T.; Liu, Y.; Li, Z. Analysis of a district heating system using waste heat in a distributed cooling data center. Appl. Therm. Eng. 2018, 141, 1131–1140. [Google Scholar] [CrossRef]
  10. Kummert, M.; Dempster, W.; McLean, K. Thermal analysis of a data centre cooling system under fault conditions. In Proceedings of the 11th IBPSA International Building Performance Simulation Conference, Glasgow, Scotland, 27–30 July 2009. [Google Scholar]
  11. Zavřel, V.; Barták, M.; Hensen, J.L.M. Simulation of data center cooling system in an emergency situation. Future 2014, 1, 2. [Google Scholar]
  12. Lin, M.; Shao, S.; Zhang, X.S.; VanGilder, J.W.; Avelar, V.; Hu, X. Strategies for data center temperature control during a cooling system outage. Energy Build. 2014, 73, 146–152. [Google Scholar] [CrossRef]
  13. Lin, P.; Zhang, S.; VanGilde, J. Data Center Temperature Rise during a Cooling System Outage; Schneider Electric White Paper; Schneider Electric’s Data Center Science Center: Foxboro, MA, USA, 2013. [Google Scholar]
  14. Moss, D.L. Facility Cooling Failure: How Much Time Do You Have; A Dell Technical White Paper, Dell Data Center Infrastructure: Round Rock, TX, USA, 2011. [Google Scholar]
  15. Gao, X.; Xu, Z.; Wang, H.; Li, L.; Wang, X. Reduced cooling redundancy: A new security vulnerability in a hot data center. In Proceedings of the Network and Distributed Systems Security (NDSS) Symposium, San Diego, CA, USA, 18–21 February 2018. [Google Scholar]
  16. Nada, S.A.; Attia, A.M.A.; Elfeky, K.E. Experimental study of solving thermal heterogeneity problem of data center servers. Appl. Therm. Eng. 2016, 109, 466–474. [Google Scholar] [CrossRef]
  17. Torell, W.; Brown, K.; Avelar, V. The Unexpected Impact of Raising Data Center Temperatures; Schneider Electric White Paper; Schneider Electric’s Data Center Science Center: Foxboro, MA, USA, 2016. [Google Scholar]
  18. Ponemon Institute. Cost of Data Center Outages, Data Center Performance Benchmark Series; Emerson Network Power: Columbus, OH, USA, 2016. [Google Scholar]
  19. ASHRAE TC 9.9. Thermal Guideline for Data Processing Environments; American Society of Heating Refrigerating and Air-Conditioning Engineers, Inc.: Atlanta, GA, USA, 2015. [Google Scholar]
  20. Intel. Reducing Data Center Cost with an Air Economizer; IT@Intel Brief, Intel Information Technology: Santa Clara, CA, USA, 2008. [Google Scholar]
  21. Strutt, S.; Kelley, C.; Singh, H.; Smith, V. Data Center Efficiency and IT Equipment Reliability at Wider Operating Temperature and Humidity Ranges; The Green Grid Technical Committee: Oregon, OR, USA, 2012. [Google Scholar]
  22. Cho, J.; Yang, J.; Park, W. Evaluation of air distribution system’s airflow performance for cooling energy savings in high-density data centers. Energy Build. 2014, 68, 270–279. [Google Scholar] [CrossRef]
Figure 1. Data center tier standards for evaluating the quality and reliability of the server hosting ability of a data center [3].
Energies 12 02996 g001
Figure 2. Root causes of unplanned outages [18].
Energies 12 02996 g002
Figure 3. Relationship between cost and duration of unplanned outages [18].
Energies 12 02996 g003
Figure 4. Internal component temperature and fan power versus inlet temperature [20].
Energies 12 02996 g004
Figure 5. Relative failure rate versus temperature for volume servers [21].
Energies 12 02996 g005
Figure 6. Reference data center of the case study.
Energies 12 02996 g006
Figure 7. Data center cooling system: (a) secondary chilled water loop; (b) IT server room on a typical floor.
Energies 12 02996 g007
Figure 8. IT server room thermal model for computational fluid dynamics (CFD) simulation.
Energies 12 02996 g008
Figure 9. Supply air (SA) temperature and cooling capacity of a computer room air handling (CRAH) unit according to chilled water supply temperature.
Energies 12 02996 g009
Figure 10. CFD simulation results for normal conditions and fault conditions 1 and 2.
Energies 12 02996 g010
Figure 11. CFD simulation results for fault conditions 3, 4, and 5.
Energies 12 02996 g011
Figure 12. Maximum IT server inlet air temperature according to the SA and chilled water conditions.
Energies 12 02996 g012
Figure 13. Chilled water temperature as a function of time under fault conditions.
Energies 12 02996 g013
Table 1. Environmental classes for data centers [19].
ClassDry Bulb
(°C)
Relative Humidity
(%)
Dew Point
(°C)
Change Rate
(°C/h)
RecommendedA1 to A418 to 275.5 °C (DP) to 60 (RH)N/AN/A
AllowableA115 to 3220 to 80175/20
A210 to 3520 to 80215/20
A35 to 408 to 85245/20
A45 to 458 to 90245/20
Table 2. Information technology (IT) cooling system operating conditions.
ItemCRAH-1CRAH-2
Typewater-side economizerwith indirect air-side economizer
Cooling capacity (usRT)4315
Air volume (m3/h)31,0008500
Supply air (SA) temperature (°C)20.020.0
Return air (RA) temperature (°C)34.534.5
Chilled water flow rate (LPM)391144
Chilled water supply (CWS) temperature (°C)10–1410
Chilled water return (CWS) temperature (°C)15.5–19.515.5
Number of systems (EA/floor)1231
Table 3. Water content in chilled water pipes.
Size (mm)Length (m)Volume (m3)Water Content (m3)
HorizontalRiserTotal
2001850 (typical floor)-185058.0234.3
250-82824.0
350-82827.8
400-828210.2
450-828213.0
500440 (mechanical room)280720141.3
Table 4. Simulation boundary conditions.
ItemValueItemValue
Room size (m2)544.3Raised floor height (m)0.8
Number of cabinets192 EANumber of CRAH unit6 EA
Air flow rate (m3/h/CRAH)31,000Supply air temperature (°C)20–25
Room height (m)5.1False ceiling height (m)3.0
Rack IT limit (kW/rack)4.0Cooling capacity (kW/CRAC)150 (43 RT)
Cold aisle/hot aisleCold aisle containmentChilled water temperature (°C)10–18
Table 5. IT cooling system for a typical floor.
ItemCRAH-1CRAH-2Total
Cooling capacity (kW)150 × (11 EA)50 × (17 EA)2500
Chilled water flow rate (m3/min)0.391 × (11 EA)0.144 × (17 EA)6.75
Chilled water content in pipes (m3)-45 m3

