Article

Experimental Testing of Hydrophobic Microchannels, with and without Nanofluids, for Solar PV/T Collectors

1
School of Mechanical and Manufacturing Engineering, University of New South Wales (UNSW), Sydney NSW 2052, Australia
2
School of Photovoltaic and Renewable Energy Engineering, University of New South Wales (UNSW), Sydney NSW 2052, Australia
*
Author to whom correspondence should be addressed.
Energies 2019, 12(15), 3036; https://doi.org/10.3390/en12153036
Submission received: 10 June 2019 / Revised: 30 July 2019 / Accepted: 1 August 2019 / Published: 6 August 2019
(This article belongs to the Special Issue Hybrid Solar Photovoltaic / Thermal (PVT) Collectors)

Abstract

:
Solar energy can be converted into useful energy via photovoltaic cells or with a photothermal absorber. While these technologies are well-developed and commercially viable, significant benefits can be realised by pulling these two technologies together in photovoltaic/thermal (PV/T) systems which can provide both heat and electricity from a single collector. Emerging configurations in the PV/T field aim to incorporate micro and/or nanotechnology to boost total solar utilisation even further. One example of this is the nanofluid-based PV/T collector. This type of solar collector utilises nanofluids—suspensions of nanoparticles in traditional heat transfer fluids—as both an optical filter and as a thermal absorber. This concept seeks to harvest the whole solar spectrum at its highest thermodynamic potential through specially engineered nanofluids which transmit the portion of solar spectrum corresponding to the PV response curve while absorbing the rest as heat. Depending on the nanoparticle concentration, employing nanofluids in a flowing system may come with a price—an efficiency penalty in the form of increased pumping power (due to increased viscosity). Similarly, microchannel-based heat exchangers have been shown to increase heat transfer, but they may also pay the price of high pumping power due to additional wall-shear-related pressure drop (i.e., more no-slip boundary area). To develop a novel PV/T configuration which pulls together the advantages of these micro and nanotechnologies with minimal pumping power requirements, the present study experimentally investigated the use of nanofluids in patterned hydrophobic microchannels. It was found that slip with the walls reduced the impact of the increased viscosity of nanofluids by reducing the pressure drop on average 17% relative to a smooth channel. In addition, flowing a selective Ag/SiO2 core–shell nanofluid over a silicon surface (simulating a PV cell underneath the fluid) provided a 20% increase in solar thermal conversion efficiency and ~3% higher stagnation temperature than using pure water. This demonstrates the potential of this proposed system for extracting more useful energy from the same incident flux. Although no electrical energy was extracted from the underlying patterned silicon, this study highlights potential a new development path for micro and nanotechnology to be integrated into next-generation PV/T solar collectors.

1. Introduction

‘Micro’ and ‘nano’ fabrication techniques have rapidly matured in the 21st century, which has led to the development of numerous new materials, components and systems with enhanced performance relative to their ‘macro’ counterparts. Interestingly, ‘micro’ and ‘nano’ scale materials are typically explored independently and are rarely integrated into the same design. The authors posit that there may be potential for synergistic benefits of combining ‘micro’ and ‘nano’ scale enhancement mechanisms to mitigate some of their corresponding drawbacks. To explore this principle, the present study sought to pull together the energy and mass transfer enhancement mechanisms of nanofluids and micropatterned microchannels to create a new class of solar photovoltaic/thermal (PV/T) collectors [1].
Nanofluids—water, oils, gases containing nanoparticles—have been proven to provide heat transfer enhancements [2,3,4] and control over the optical properties [5,6,7] of their base fluid. However, these benefits (e.g., increased convective heat coefficients) are often largely cancelled out by the increased viscosity resulting from the addition of nanoparticles [8]. At high volume fractions, nanofluids may even transition to non-Newtonian fluids and exhibit shear thinning, which limits their applicability to flowing systems (e.g., solar collectors) due to their non-linear flow rate versus pressure drop relationship [9].
A separate line of inquiry into microfluidic heat exchangers has revealed a similar heat transfer versus pumping power trade-off, but with a subtly different cause [10]. Microchannel heat exchangers are capable of significantly enhancing heat transfer relative to larger hydraulic diameter channels due to their high heat transfer area to fluid volume ratio [11]. Unfortunately, due to the dominance of surface forces, this enhancement comes at a steep price in terms of added pressure drop and pumping power [12]. As an example, Qu et al. [13,14] reported that flow friction in microchannels can exceed conventional laminar flow theory, while the Nusselt numbers observed during testing were lower than expected. On the other hand, walls which are engineered to be rough on the microscale can actually reduce drag [15,16]. In fact, a well-designed superhydrophobic surface (operating in the Cassie–Baxter state [17]) has been shown to have up to 40% less drag than a smooth wall. This stems from the fact that a significant portion of the liquid–wall interfacial area can be replaced with a no/low drag liquid–air boundary. Davies et al., in a series of seminal papers from 2006 [18,19,20,21], looked at how liquid flow interacts with superhydrophobic microgrooves of various designs. Their results indicated that ribs that are oriented parallel to the flow direction—particularly those with high cavity fractions (up to the point of wetting)—yield the highest pressure drop reduction. Only a limited amount of analytical and numerical work has been done on how heat transfer is impacted by superhydrophobic microchannels [21,22,23], likely due to the fact that patterned microchannels should increase heat transfer resistance due to the low conductivity of the air interface [24]. Thus, while there are several advantages of incorporating microstructures into microchannels, there has been little impetus to develop this area further, due to an inherent mismatch between heat and mass transfer.
The authors hypothesise that the solution to some of the challenges mentioned above could result from integrating nanofluids and microfluidics. Since little research has been done to explore this idea in the literature, this paper aims to investigate how these ‘nano’ and ‘micro’ effects might be utilised to produce an efficient heat and mass transfer system for harvesting solar energy. PV/T systems represent one of the best ways to harvest maximum solar energy since they are designed to extract both electricity (from the PV cells) and heat (from a thermal collector), which has the added benefit of cooling the PV cells so that they can operate at higher electrical efficiency. In this study, we have proposed a new design which uses both ‘nano’ and ‘micro’ technologies, with a nanofluid in front of patterned silicon (simulating a modern PV cell’s texture) to pre-filter out the unused portions of the solar spectrum. This would allow the nanofluid to operate at a slightly higher temperature than the underlying PV cell. Through this, we aimed to fundamentally understand how nanofluids and microchannels can be utilised together to efficiently harvest radiation—knowledge which can be leveraged to collect solar energy with minimal flow and heat transfer resistance.

2. Methods

This study relied upon experimental testing of liquid flow through superhydrophobic microchannels in which the bottom silicon surface of the channel was patterned with ribs/grooves. This design was compared to a smooth channel, and the design is shown in Figure 1f. As can be seen in Figure 1a, light from a lamp which simulated sunlight was incident upon the design for heating tests. The light passed through a glass cover, whereby it was absorbed either by the working fluid (pure water or a nanofluid) or by the patterned silicon substrate. It should be noted that modern commercial silicon PV cells are textured with similar dimensions, albeit slightly different shapes (e.g., see the passivated emitter and rear cell (PERC) silicon solar cell design [25]). To make the results scalable/comparable to different designs, the results are presented as dimensionless parameters and relative comparisons are used throughout (e.g., comparing against pure water and smooth microchannels).

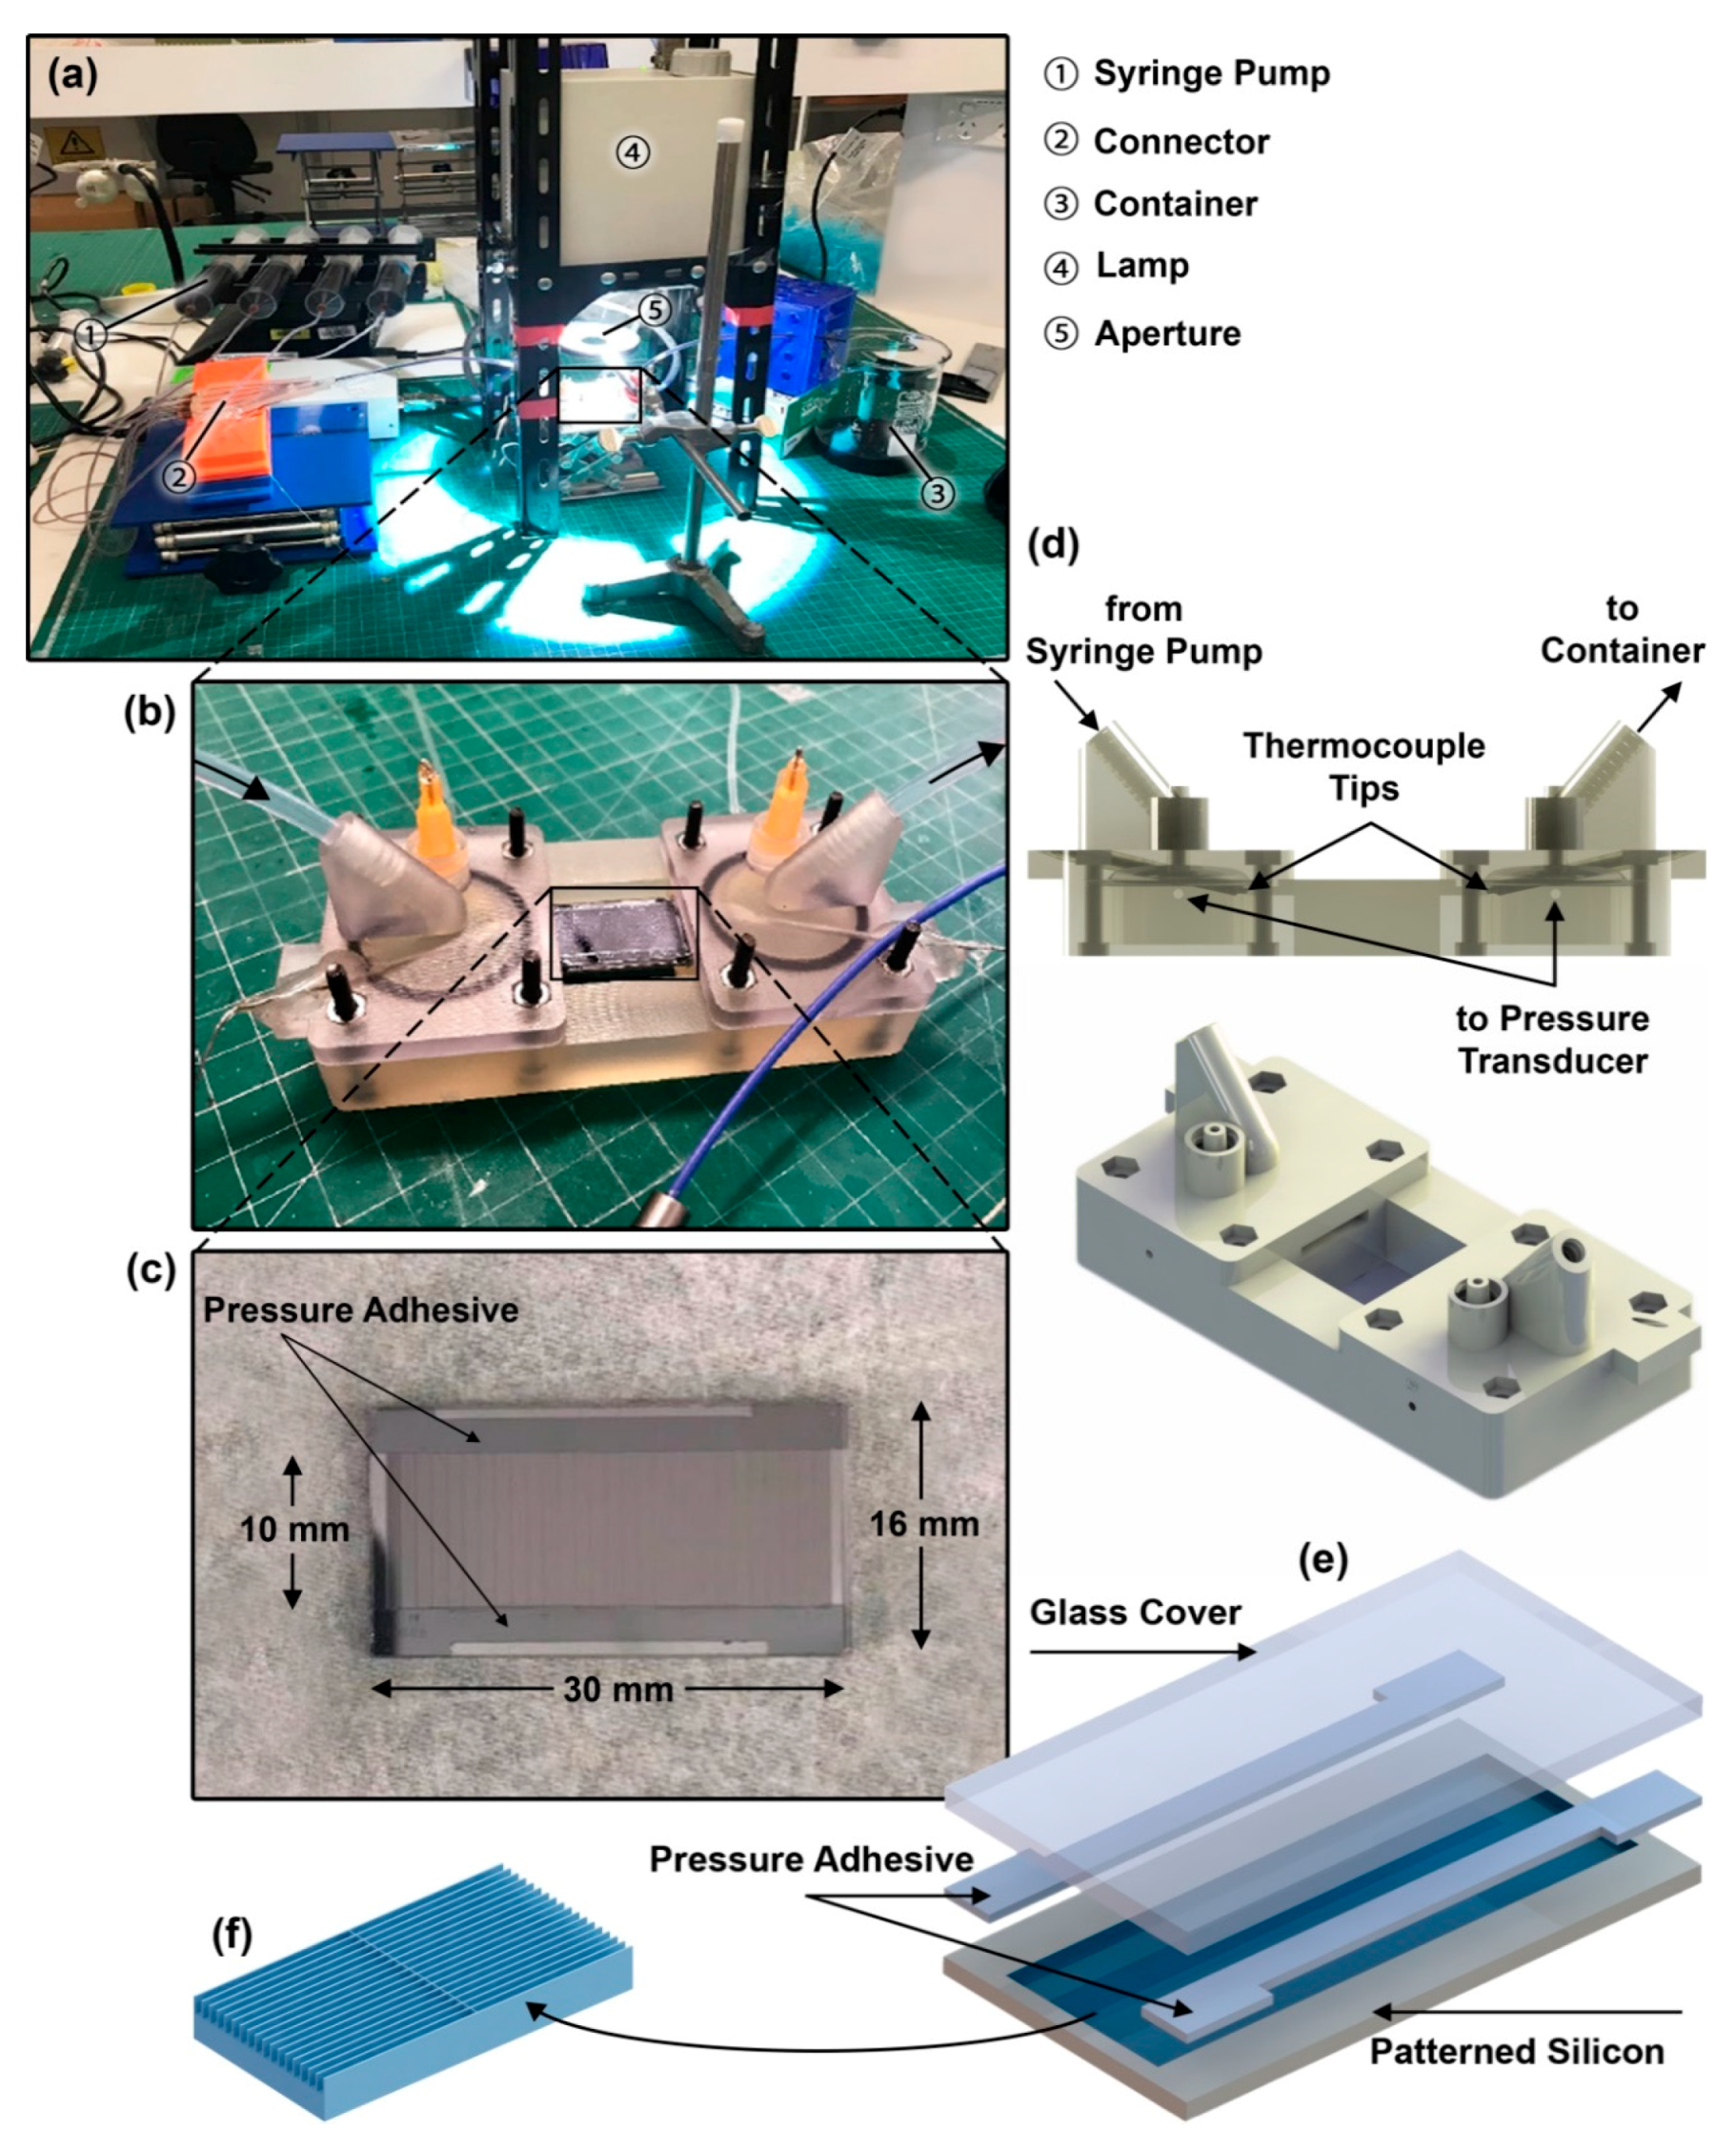
2.1. Superhydrophobic Surface Device Design

While there are many options and potential configurations for achieving hydrophobic and superhydrophobic surfaces, the underlying goal for this project was to reduce the pumping power in a microchannel. This can be achieved by creating as much ‘slip’ as possible with the walls, which occurs when some portion of the solid wall is replaced with a fluid (i.e., a gas, as in the Cassie–Baxter state [17], or a liquid, as in the Wenzel state [26]). In this case, the ‘boundary,’ which was able to move, or slip, along with the main fluid flowing in the channel. In a prior conference paper by the co-authors [27], we investigated several microchannel patterns and geometries with respect to their effects on drag reduction using differently patterned microchannels. This prior study indicated that a longitudinal design (e.g., the design shown in Figure 1f) where the flow is axially aligned with the ribs provides the biggest pressure drop reduction. This result has been confirmed by other researchers as well, such as Woolford et al. [20]. Thus, the superhydrophobic surfaces fabricated for this study consisted of straight ribs-and-grooves where the ribs were 12, 18, or 24 µm in width and the grooves were 48, 42, or 36 µm in width. This was in the context of an overall microchannel width of 10,000 µm and a microchannel height of 130 µm.

2.2. Microchannel and Nanofluid Fabrication

Micropatterned silicon substrates were fabricated via standard photolithography, where a spin-coated layer of photoresist (on a silicon wafer) was exposed to UV through a mask which contained the micropattern. To obtain high aspect ratios, deep reactive-ion (DRIE) etching of this pattern was used. The etched silicon wafer was then diced into small, rectangular test sections using a wafer dicing saw (DAD3240, Disco). The diced substrates were then cleaned with acetone and isopropyl alcohol to remove any residual debris from the dicing process. To increase the hydrophobicity, the diced substrates were silanised with trichloro(1H,1H,2H,2H-perfluorooctyl) silane (Sigma-Aldrich, Darmstadt, Germany, CAS # 78560-45-9) via vapour deposition in a vacuum desiccator for at least 2 h. The top cover was made of a 1.2 mm thick piece of soda lime glass (TED PELLA INC.) which was cut to size using a CO2 laser cutting machine. These two pieces—the micropatterned silicon and the glass cover—were then bonded together with strips of pressure-sensitive adhesive (i.e., one layer of 468 MP from 3 M). The thickness of the pressure-sensitive adhesive, nominally 130 μm thick, defined the interior height of the microchannel.
Nanofluids, consisting of aqueous suspensions of silver nanodiscs coated with a protective silica shell, were synthesised in-house for this study. These nanofluids have been previously reported, and have been extensively tested for stability for solar collector applications, by the co-authors [28]. In fact, the samples were produced over two years ago and had already been used in several tests prior to this study. They were prepared with the ‘one-step’ chemical route, although the process requires several ‘steps,’ including:
(i)
The precipitation of seeds at room temperature from adding aqueous AgNO3 (5 mL, 0.5 mM) was added with a syringe pump at a rate of 2 mL/min to a mixture of vigorously stirred trisodium citrate (5 mL, 2.5 mM), aqueous poly-(sodium 4-styrenesulfonate) (0.25 mL, 500 mg/mL), and sodium borohydride (0.3 mL, 10 mM). The formation of silver seeds was indicated by a colour change, from clear to yellow.
(ii)
The seeds were then converted to triangular nanoplates by adding 0.9 mL of this seed suspension to a mixture of DI water (45 mL) and ascorbic acid (0.675 mL, 10 mM), while stirring. The seeds were grown into triangles by further addition of AgNO3 (27 mL, 0.5 mM) from a syringe pump, at an even slower rate of 1 mL/minute. Growth of the desired triangles was indicated by a colour change from yellow, through orange, red, and purple to blue. A stabilizing agent, aqueous trisodium citrate (5 mL, 25 mM), was added after the colour change.
(iii)
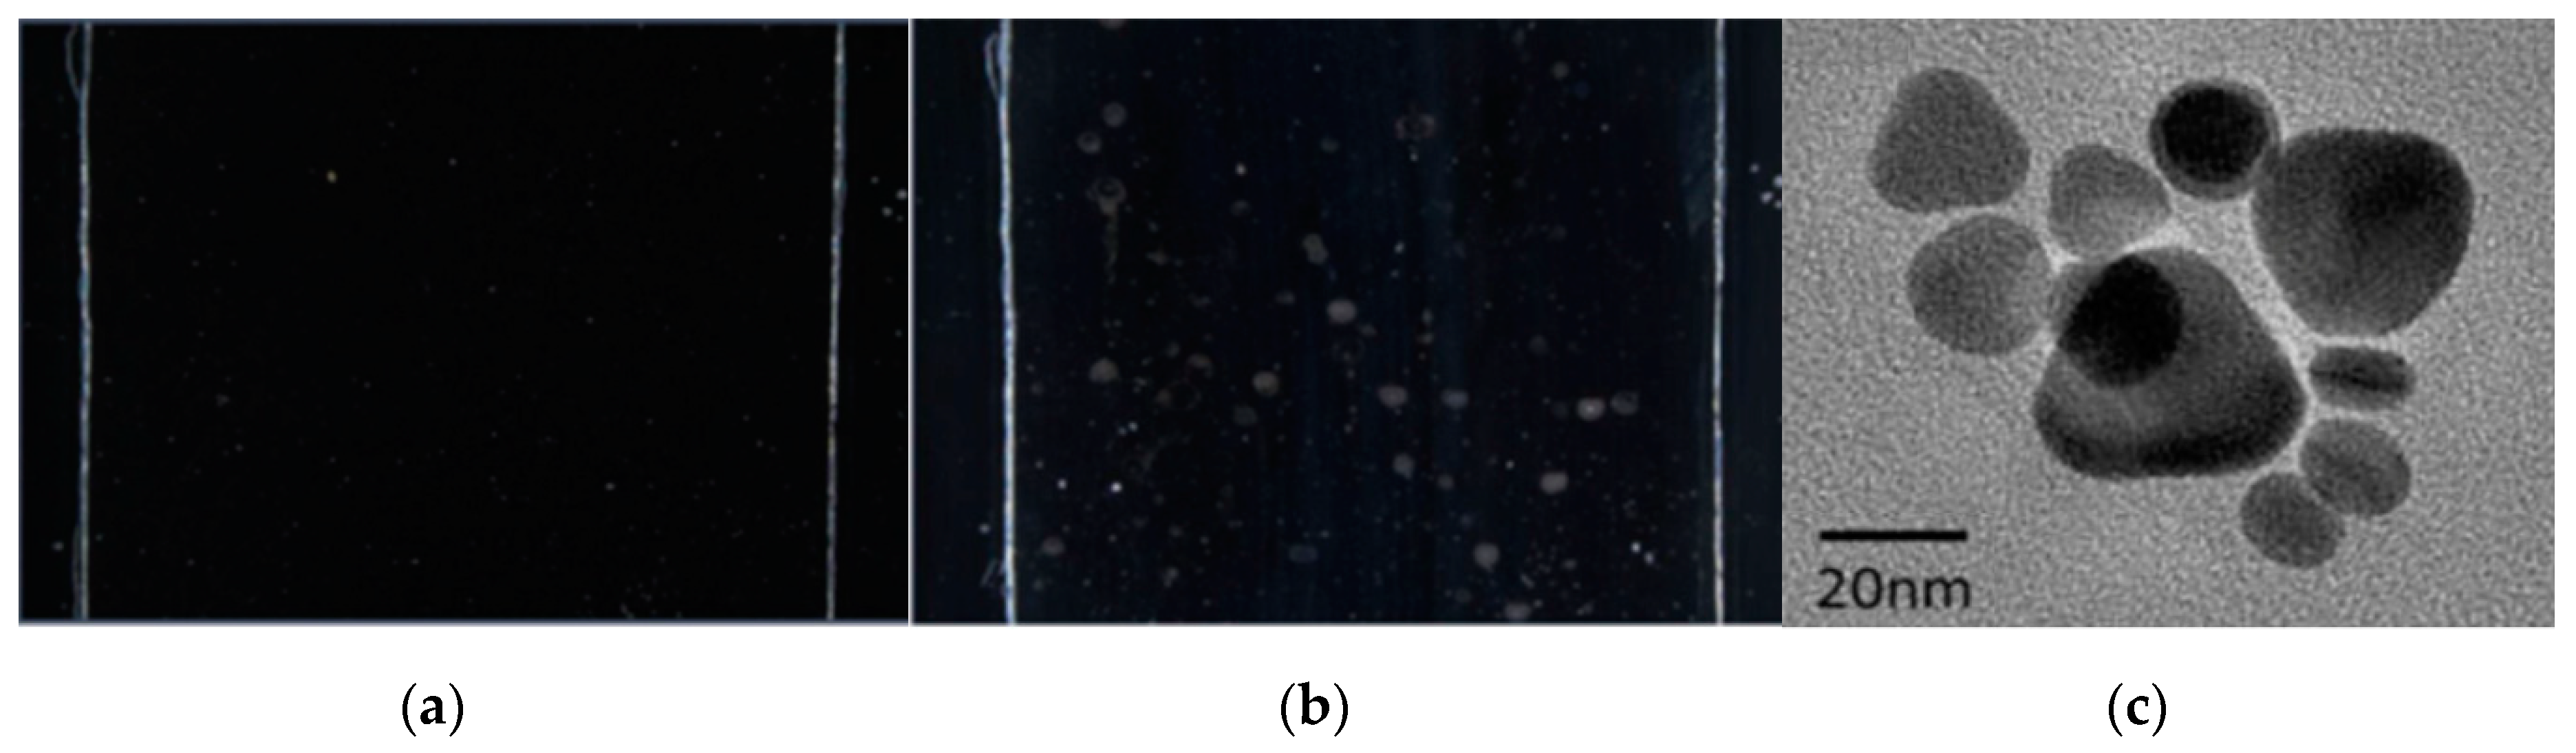
The resulting solution was then rinsed by putting it in a centrifuge for 3 h at 10,000 rpm, and then redispersed into deionized water. This step of the process removes excess reagents and rounds the triangular particles into silver nanodiscs (which have a superior selective transmission for this application). The resulting nanodiscs had a particle diameter of 20–50 nm, as was indicated in Transmission Electron Microscopy (TEM) measurements (as shown in Figure 3c) [29].
(iv)
The final step of the process was to apply a protective silica shell to the disc using the Stöber method for silica precipitation. To do this, 100 mL of ethanol was added to the solution from step (iii). Next, a tetraethyl orthosilicate (TEOS) solution (625 μL, 0.1 M, dispersed in ethanol) and dimethylamine (60 μL) were added and left to slowly precipitate shells on the particles overnight, with constant stirring. The concentration/volume of the silica source, TEOS, was chosen carefully to achieve maximum coverage of the silver nanodiscs with minimal self-precipitation of silica particles (although a small amount of both mechanisms is unavoidable). The silica shell serves to help maintain the silver core’s disc geometry (i.e., silver nanoparticles can melt at low temperature and would eventually become spheres to reduce surface energy [30]). Functional groups on the shell’s surface also keep the nanoparticles suspended and free of agglomeration. The final core–shell nanoparticles were roughly spherical with a diameter of ~100 nm.
(v)
A second step of centrifugation and redispersion, similar to (iii), was done to remove excess reagents.
(vi)
Since the nanofluid was originally designed for larger scale solar collectors (with several centimetres of optical path length for absorption), the final concentration of the nanofluid was 0.026 wt. % [29]. In the proposed microscale collectors, with a 130 µm nominal height, the nanofluid required further concentration. Thus, a final centrifugation process was done to concentrate the fluid by a factor of 10.
For the heat and/or flow experiments, the nanofluid was sonicated (UP200S-hielscher Ultrasound Technology) for 30 min in an ice bath. Finally, it was warmed up in a tap water bath for approximately 15 min prior to testing.

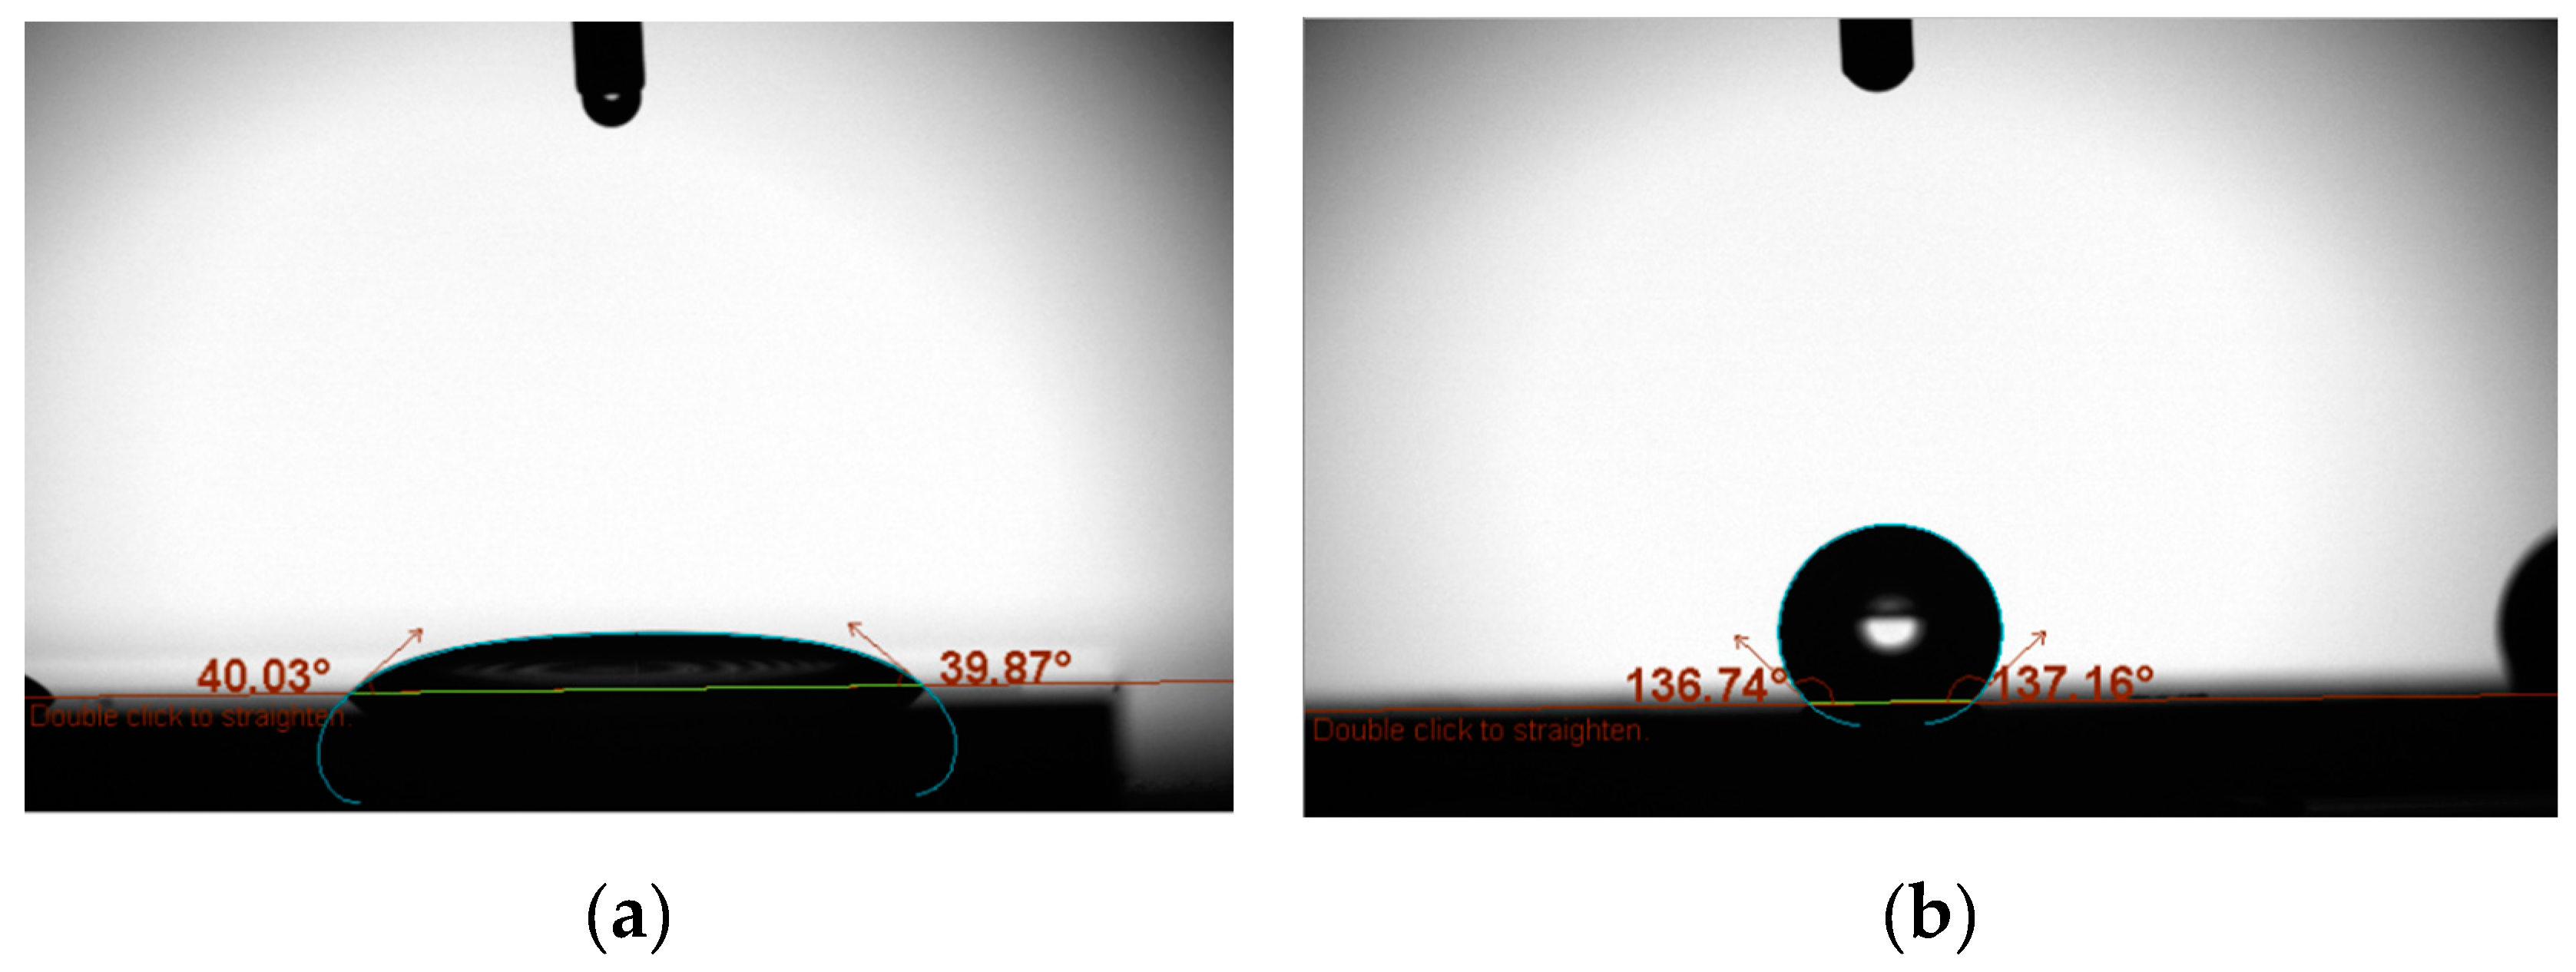
2.2.1. Characterisation of the Microchannels

To measure the hydrophobicity of the fabricated longitudinal patterned microchannel designs with and without nanofluids, contact angle measurements were taken using a contact angle analyser (Theta Flex Auto 1-Biolin Scientific). Three different cavity fractions (i.e., cavity width divided by cavity pitch) were investigated in this study. These ranged from 0.6–0.8 and included a smooth channel as a reference. These designs were tested both before and after silanisation, and the average results are shown in Table 1. Figure 2 shows pictures of selected contact angle measurements for the 0.6 cavity fraction, longitudinal design.
Since the hydraulic diameters have a significant influence on the pressure drop measurements in microchannels, the dimensions need to be carefully characterised. To determine the exact height of the channel, the thickness of the pressure-sensitive adhesive was measured using a confocal laser scanning microscope (VK-X210, Keyence). A total of 10 different locations were measured and the average value was taken. The hydraulic diameter of the microchannel was based on the unloaded adhesive thickness under atmospheric pressure. However, to investigate whether this could change due to increased pressure and the viscoelastic behaviour of the adhesive during the experiment, a finite element analysis (FEA) was done using ANSYS. It was found that no significant change (i.e., only a few nanometres) in channel hydraulic diameter could occur as a result of the pressure applied using the flow tests.
The width of the microchannel was measured using a microscope (a Zeiss digital microscope with an Axio zoom. V16). The width was also measured at 10 different locations (before and after each test) along the microchannel and the average value was used.

2.2.2. Characterisation of the Nanofluids

The stability of the nanofluids was determined with a zeta potential measurement using a Zetasizer Nano ZS (633 nm laser). It was found that this fluid had a zeta potential of 33.2 mV, which is considered stable [31]. In addition, the microchannel was imaged with a microscope before and after test and no noticeable sedimentation occurred, shown in Figure 3. Thus, we assumed that the hydraulic diameter of the channel was not changing during the tests.
Since they impact the calculated quantities, the specific heat capacity (CP), the viscosity (µ) and the density (ρ) were calculated using approximations from the literature (for more information, please see Section 1 in Supplementary Information). It should be noted that although many equations exist for calculating these effective properties, the simple relationships used have been found to provide good approximations at low volume fractions [32,33,34].

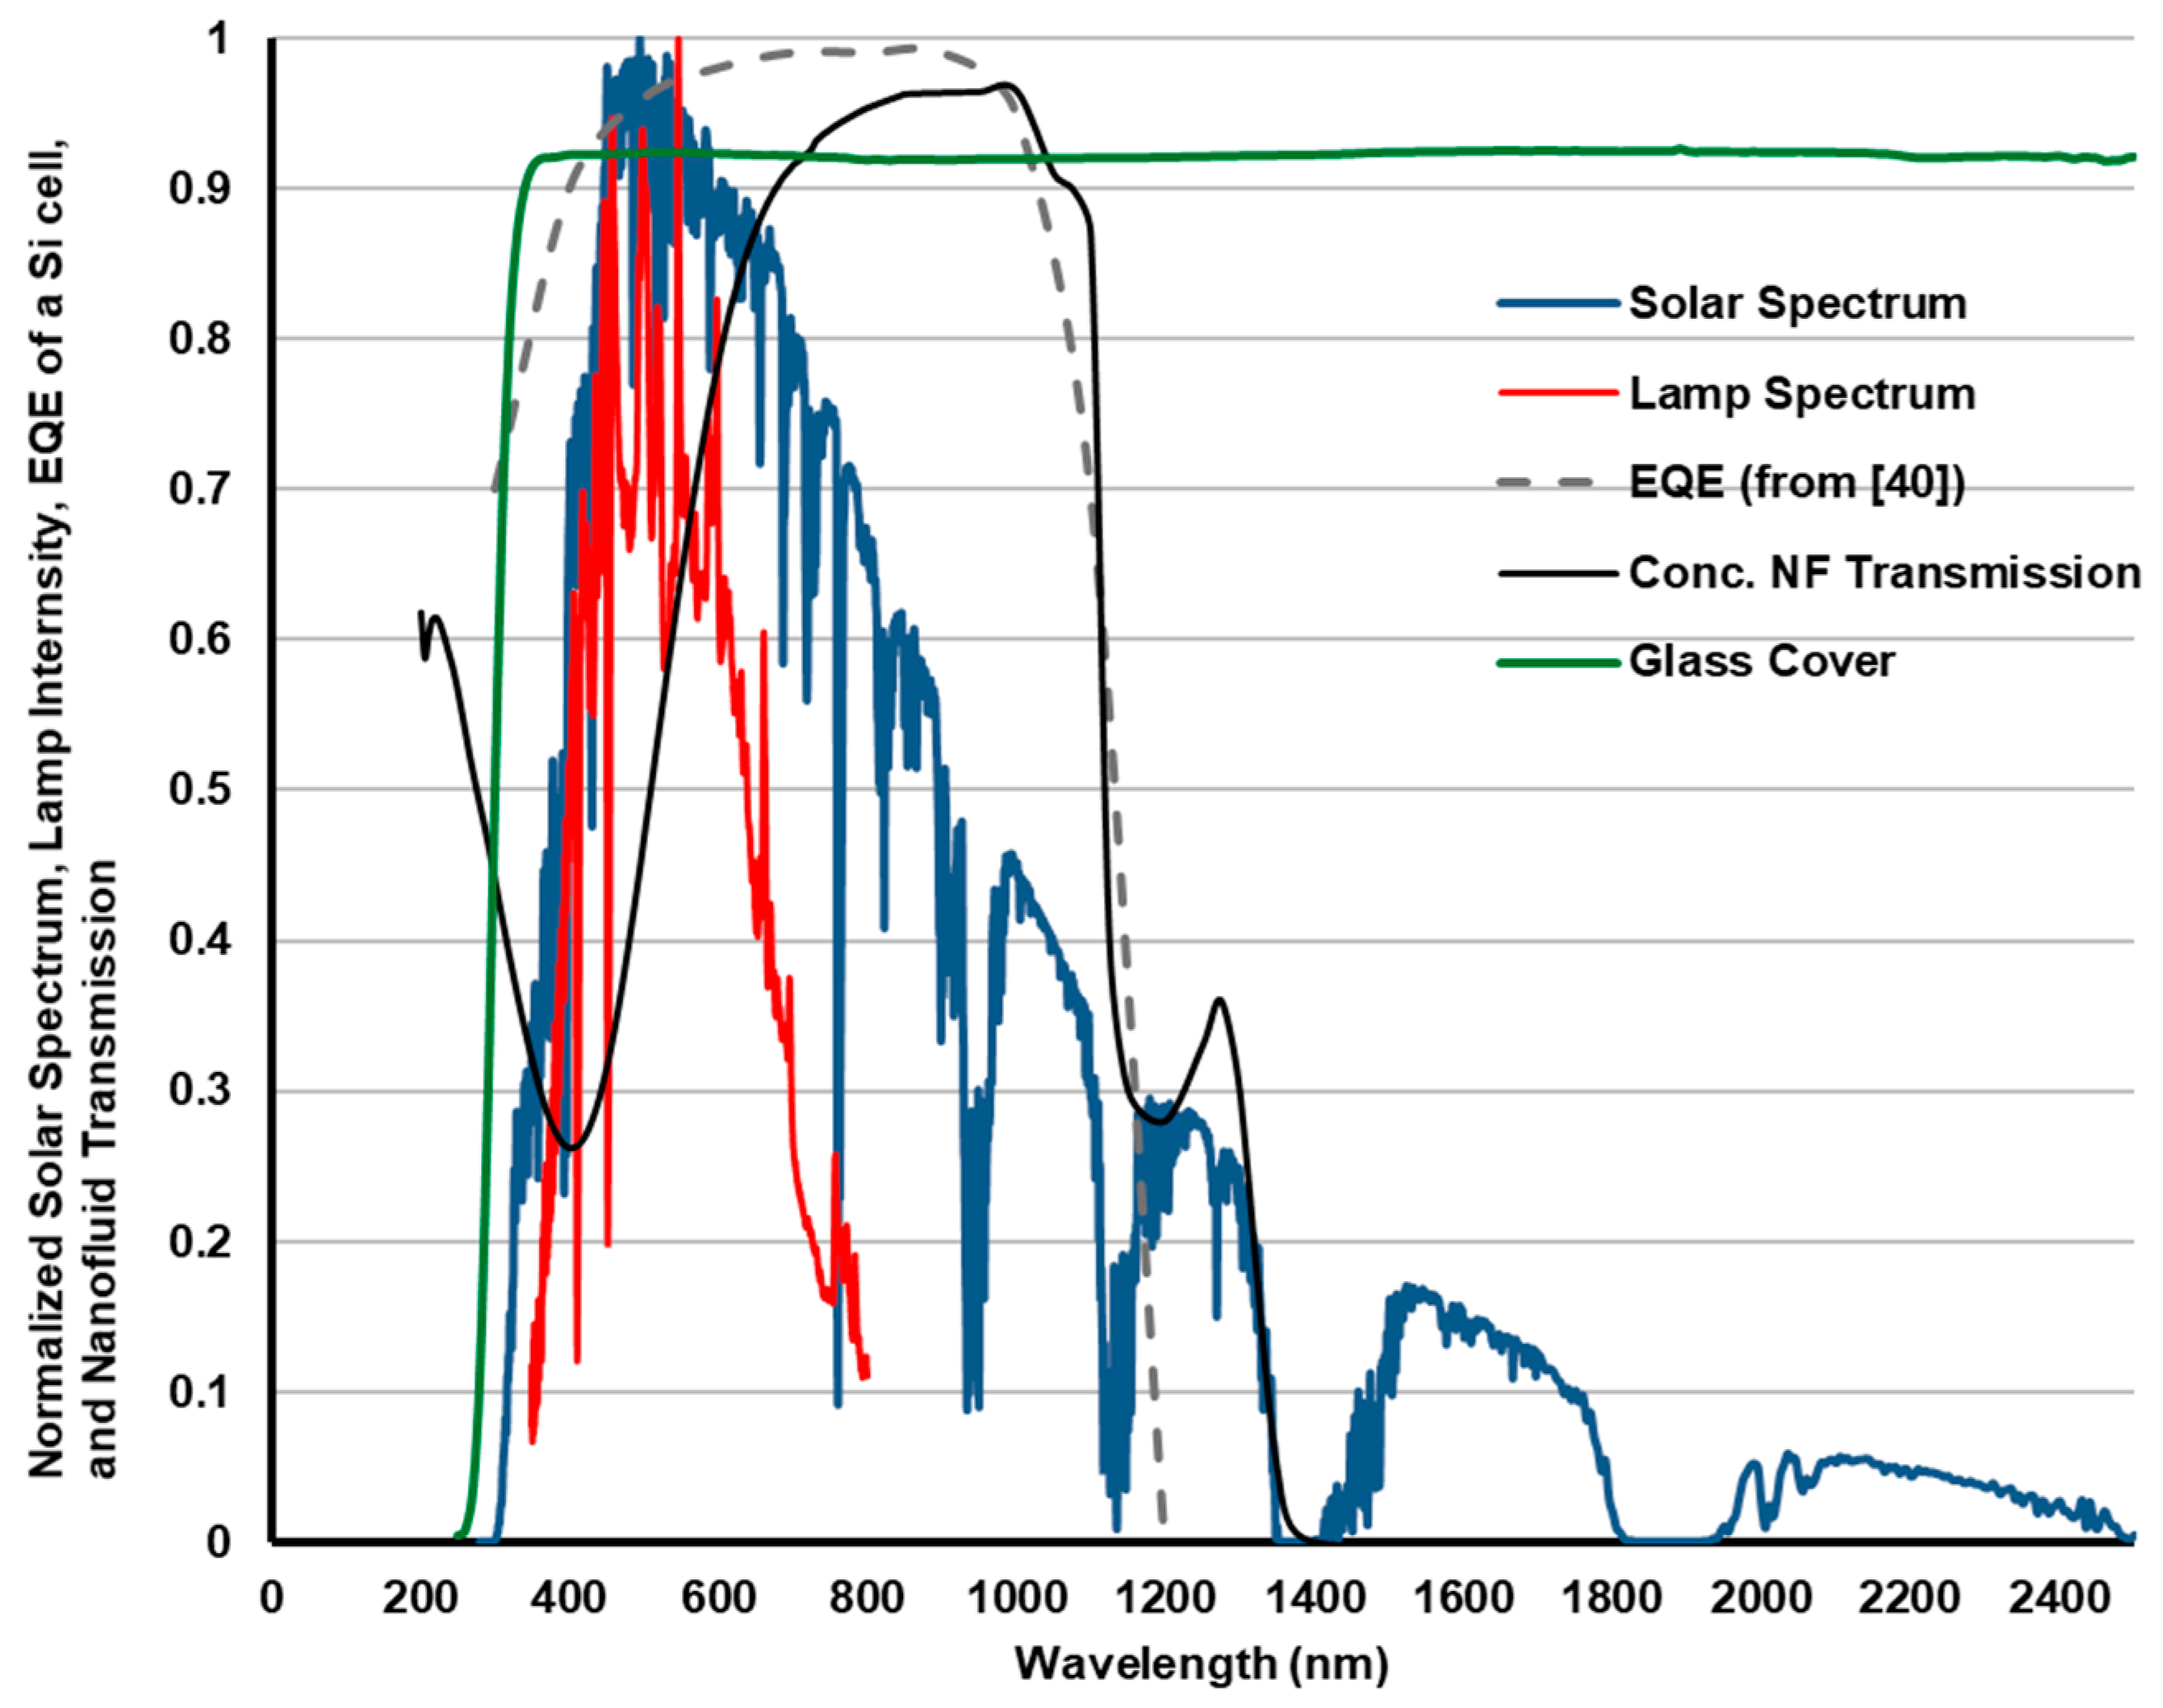
2.2.3. Optical Characterisation

The optical properties of all the components of this system were also characterised in detail. The nanofluid transmission was measured using a 1 mm cuvette placed in a UV-Vis-IR spectrophotometer (Perkin Elmer Lambda 1050). Spectral properties for the lamp, the solar spectrum (from Reference [35]), the glass cover and the spectral response of a silicon solar cell were also obtained. Figure 4 shows the optical properties of all these components for comparison. Once these properties were known, lamp-weighted transmittance and absorption of the system could be calculated. This was done using an in-house MATLAB code [36] which integrates the spectral transmission with the spectral intensity.
It is important to note that employing a nanofluid for its optical properties may also incur an optical loss from scattering. Thus, an important design metric to minimize for this application was the ratio of the scattering cross-section relative to the absorption cross-section. Considering this metric explains why silver nanodiscs were chosen for this study; at 532 nm, according to Mie theory, this ratio would be less than 8%. For nanospheres, on the other hand, the ratio could be as large as 40%. Another important factor is the scattering phase function, which can help determine the directionality of scattering. For particles smaller than the wavelength of light, scattering can occur in a range of directions, but most is forward scattered within ± 60 degrees from the propagation direction, as was discussed in Tan et al. [37]. Thus, most of the 8% for the proposed nanodisc-based nanofluid would not be ‘lost,’ but would be scattered in directions that would still reach the silicon. In fact, plasmonic solar cells are intentionally designed with highly scattering nanoparticles embedded (or deposited) in (or on) their layers to increase the path length of light as it propagates through the cell [38]. See Wiley et al. for more in on how the optical coefficients change according to particle morphology [39].

2.3. Experimental Setup

The experiments were carried out by collecting pressure and temperature data for the microchannel designs across several flow rates and fluids. These data were then used to investigate how design and operation parameters impacted the overall hydrodynamic and thermodynamic performance, both of which are necessary for optimising a PV/T solar collector with the proposed configuration.

2.3.1. Pressure Drop Experiments

The experimental setup for the pressure drop measurements is illustrated in Figure 1a,d. A syringe pump (a Harvard 2000 PHD) was used to pump the fluid through the test devices at constant flow rates. One of the challenges of this study was designing a suitable holder to accommodate the microchannel while considering all the experiment’s constraints (keeping the dead volume to a minimum while also minimising fluctuations in the pressure readings). After numerous 3D-printed holder designs were tested, a design with circular reservoirs, Leur lock inlet/outlets, two valves to remove air bubbles, and other optimised geometry was chosen. The parts, shown in Figure 1b,d, were designed in SolidWorks and 3D-printed (with ProJet 3500 HDMax) using a VisiJet M3 Crystal plastic material. The 3D printer had a minimum layer thickness of 16 μm and an X–Y resolution of 0.025 to 0.05 mm. Using these holders, the microchannel was mounted into slots in the holder to connect the inlet and outlet reservoirs. The contact areas between the holder tops and the holder were sealed with a pair of O-rings. The contact area between the holder and the microchannel were sealed with an epoxy adhesive (from Araldite).
Pressure taps were located on the reservoir walls in approximately the same plane as the microchannel, as illustrated in Figure 1d. The pressure taps were used to measure the pressure difference between the inlet and the outlet reservoirs via a differential pressure transducer (PXM409-070HDWUUSBH, OMEGA). Small diameter tubing (ID ~0.50 mm) was used for pressure measurements. To ensure bubbles did not block the tubing, especially during the filling process, air bubble traps were placed between the testing device and the pressure transducer to remove air bubbles from the loop. To measure temperature, two (T-type) thermocouples were placed in the inlet and the outlet through mounting holes in the assembled microchannel. A thermocouple module (NI 9213) and a USB data acquisition chassis (NI cDAQ 9174) were used to collect data from the sensors. The average of the measured temperatures was used to determine the physical and thermophysical properties of the nanofluid. All tubing and thermocouples were sealed using an epoxy adhesive.

2.3.2. Thermal Performance Experiments

The thermal performance testing used a solar simulator lamp (High Power UV Lamp, HPLS Series) to generate 1000 W/m2 (e.g., a typical solar flux in the middle of a clear, sunny day) on the glass cover. The irradiance was controlled by changing the distance from the lamp using a jack, and the exposure area was controlled by closing an aperture (see Figure 1a). The incident energy heated the flowing liquid to produce useful heat. Dividing the useful heat output energy by the input energy indicates the thermal efficiency of the collector (see Equation (1)). By gathering at least four steady-state points for various operating conditions, it was possible to plot a solar thermal collector efficiency curve (similar to the ISO 9806 Standard Test [41]). As such, a series of controlled tests were done to compare the solar thermal efficiency of the nanofluid to pure water (taking into account their temperature-dependent thermophysical properties using Equation S1–3 in Supplementary Information).
η = Q o u t Q i n = m ˙ C p Δ T A G
where m ˙ , CP, Δ T , A, and G are mass flow rate (kg/s), specific heat capacity (J/kg °K), the temperature difference of the outlet and the inlet, the aperture area (m2) exposed to the light (m2), and irradiation (J/sm2), respectively.

3. Results and Discussion

In addition to the pressure drop in the microchannel test section, this study also investigated the minor pressure drop in the reservoirs and in the inlet/outlet section. The simulation results using ANSYS (not shown) indicated that the total minor pressure drops in the reservoirs, inlet, and outlet, and any expansion and contraction were negligible (≤2.2 Pa) as compared to the microchannel. Therefore, in this test, the pressure readings from the transducer were considered to be equivalent to the pressure drop along the microchannel itself.
Finally, propagation of uncertainty analysis was also done using the equipment and sensor uncertainty in this study [42,43]. Error bars are given on the following results based on these results (see more information in Section 3 of Supplementary Information).

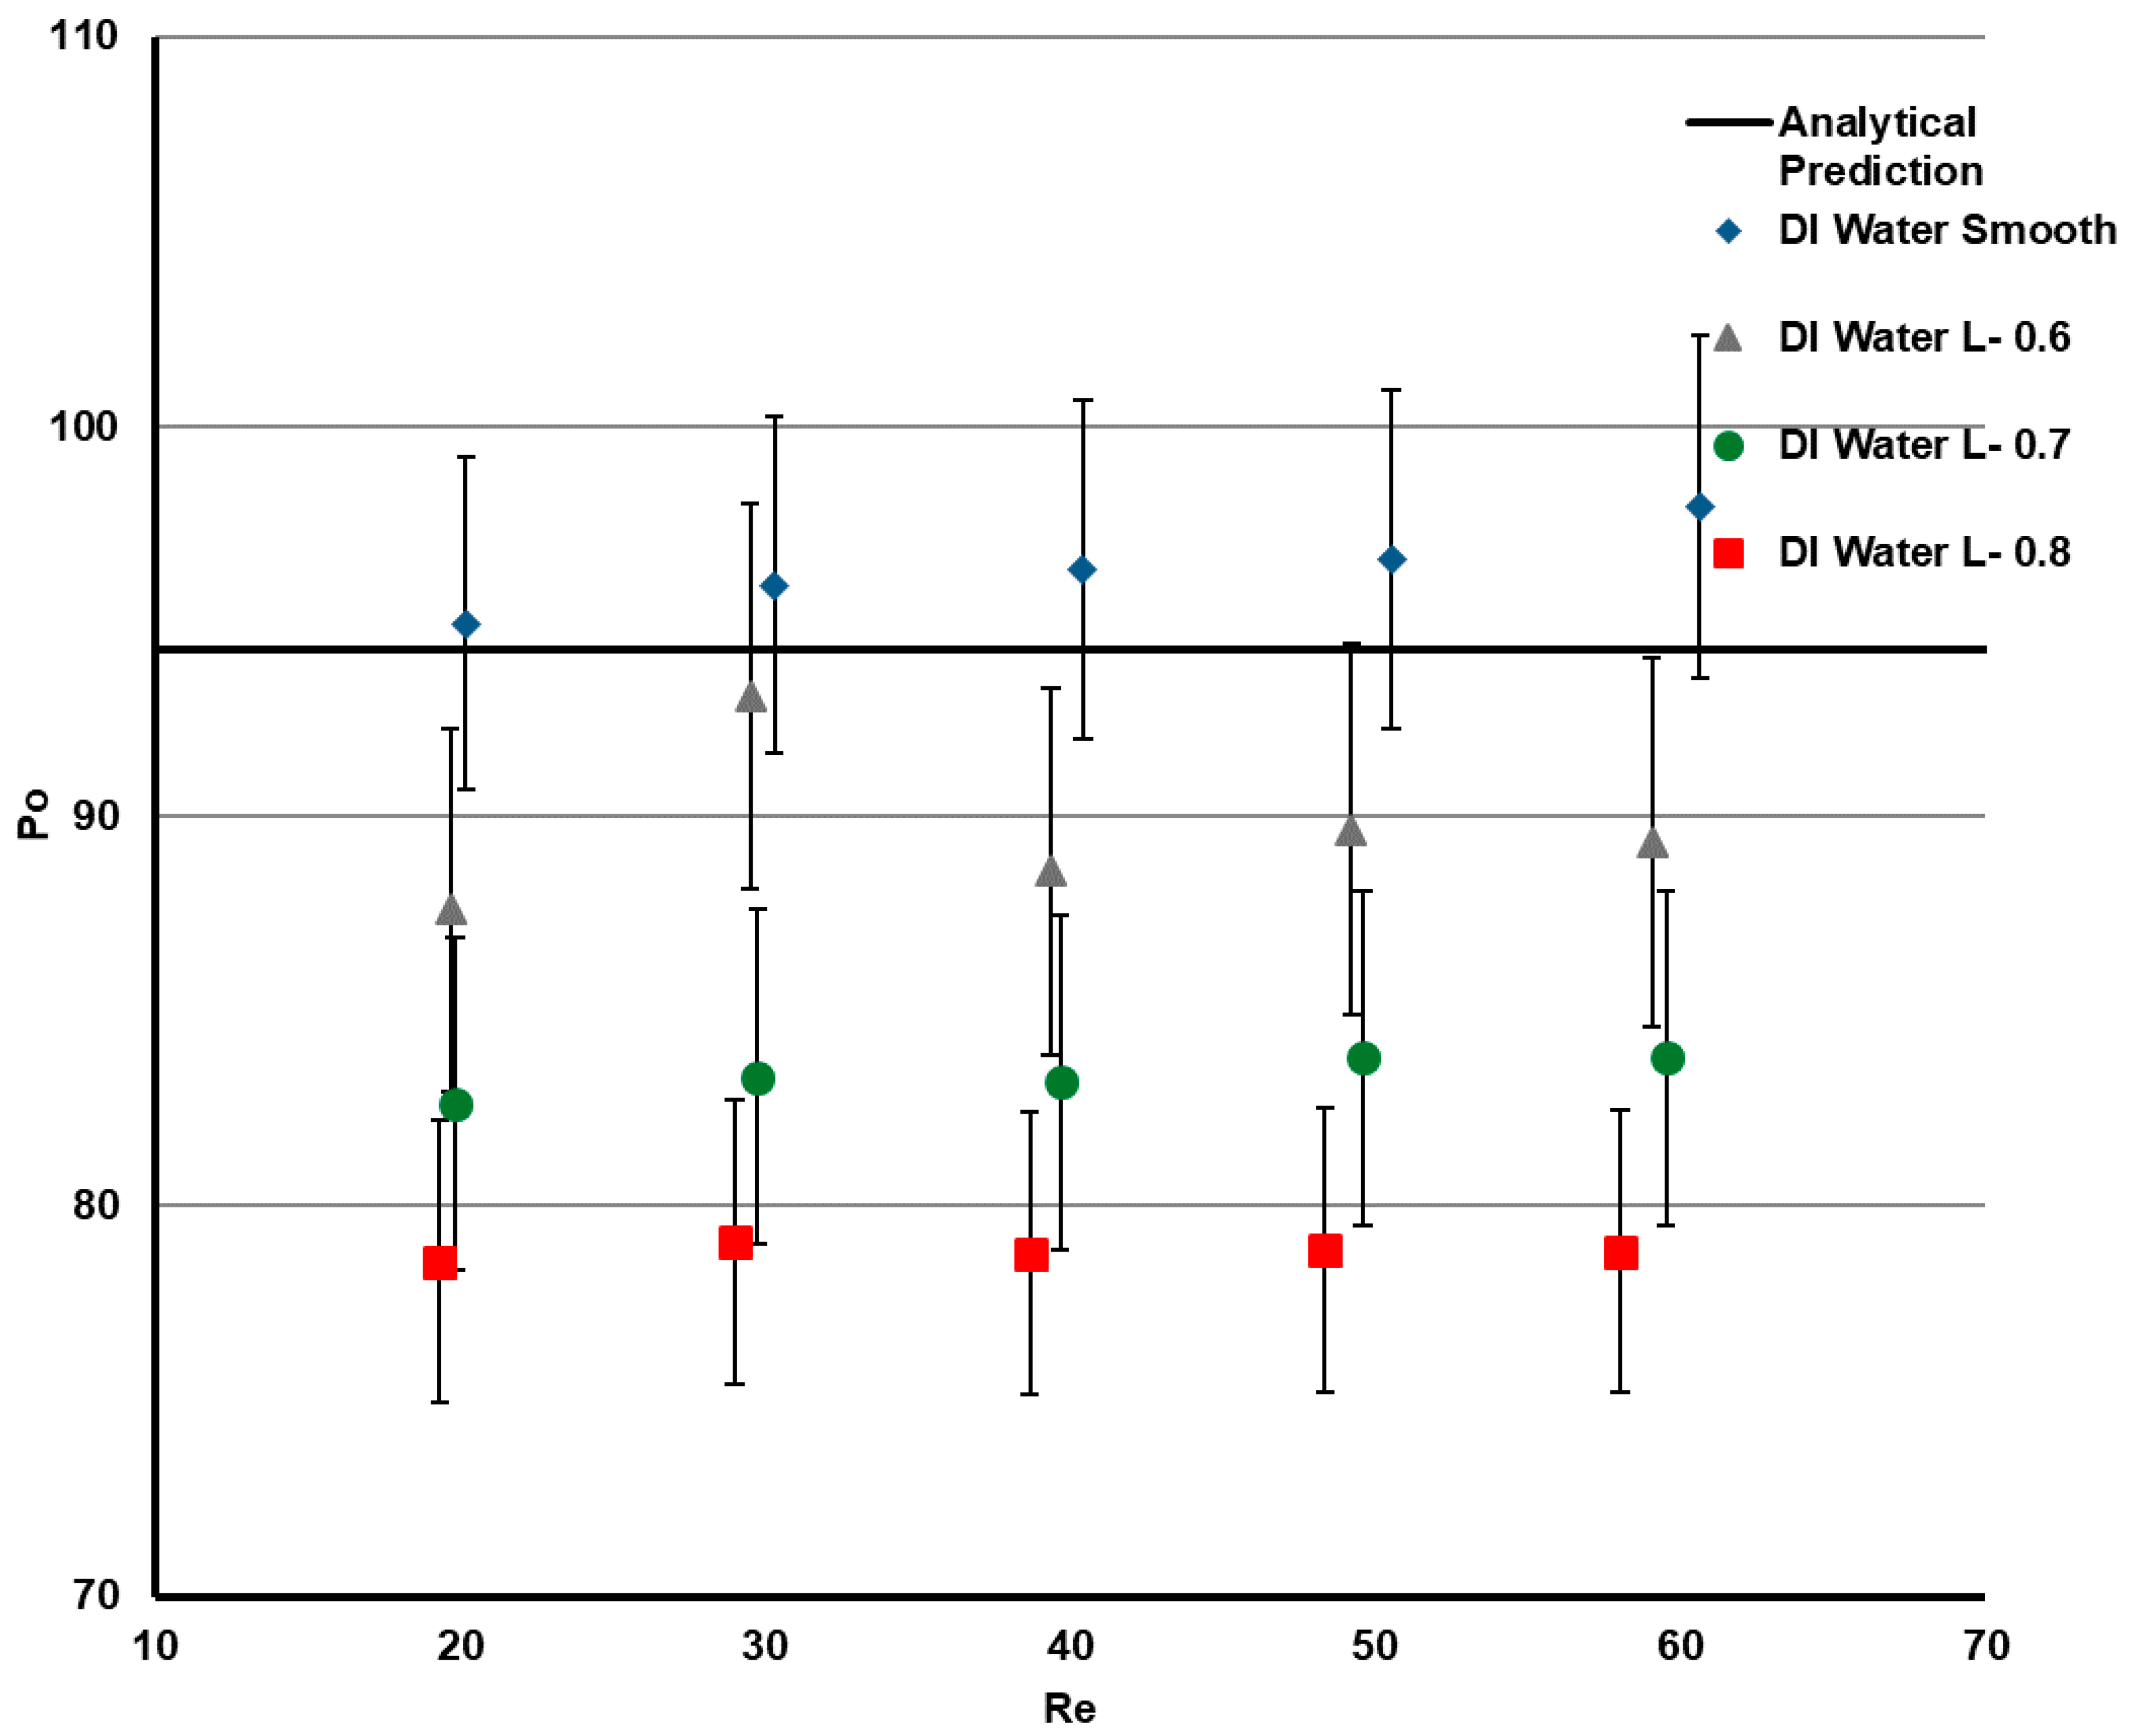
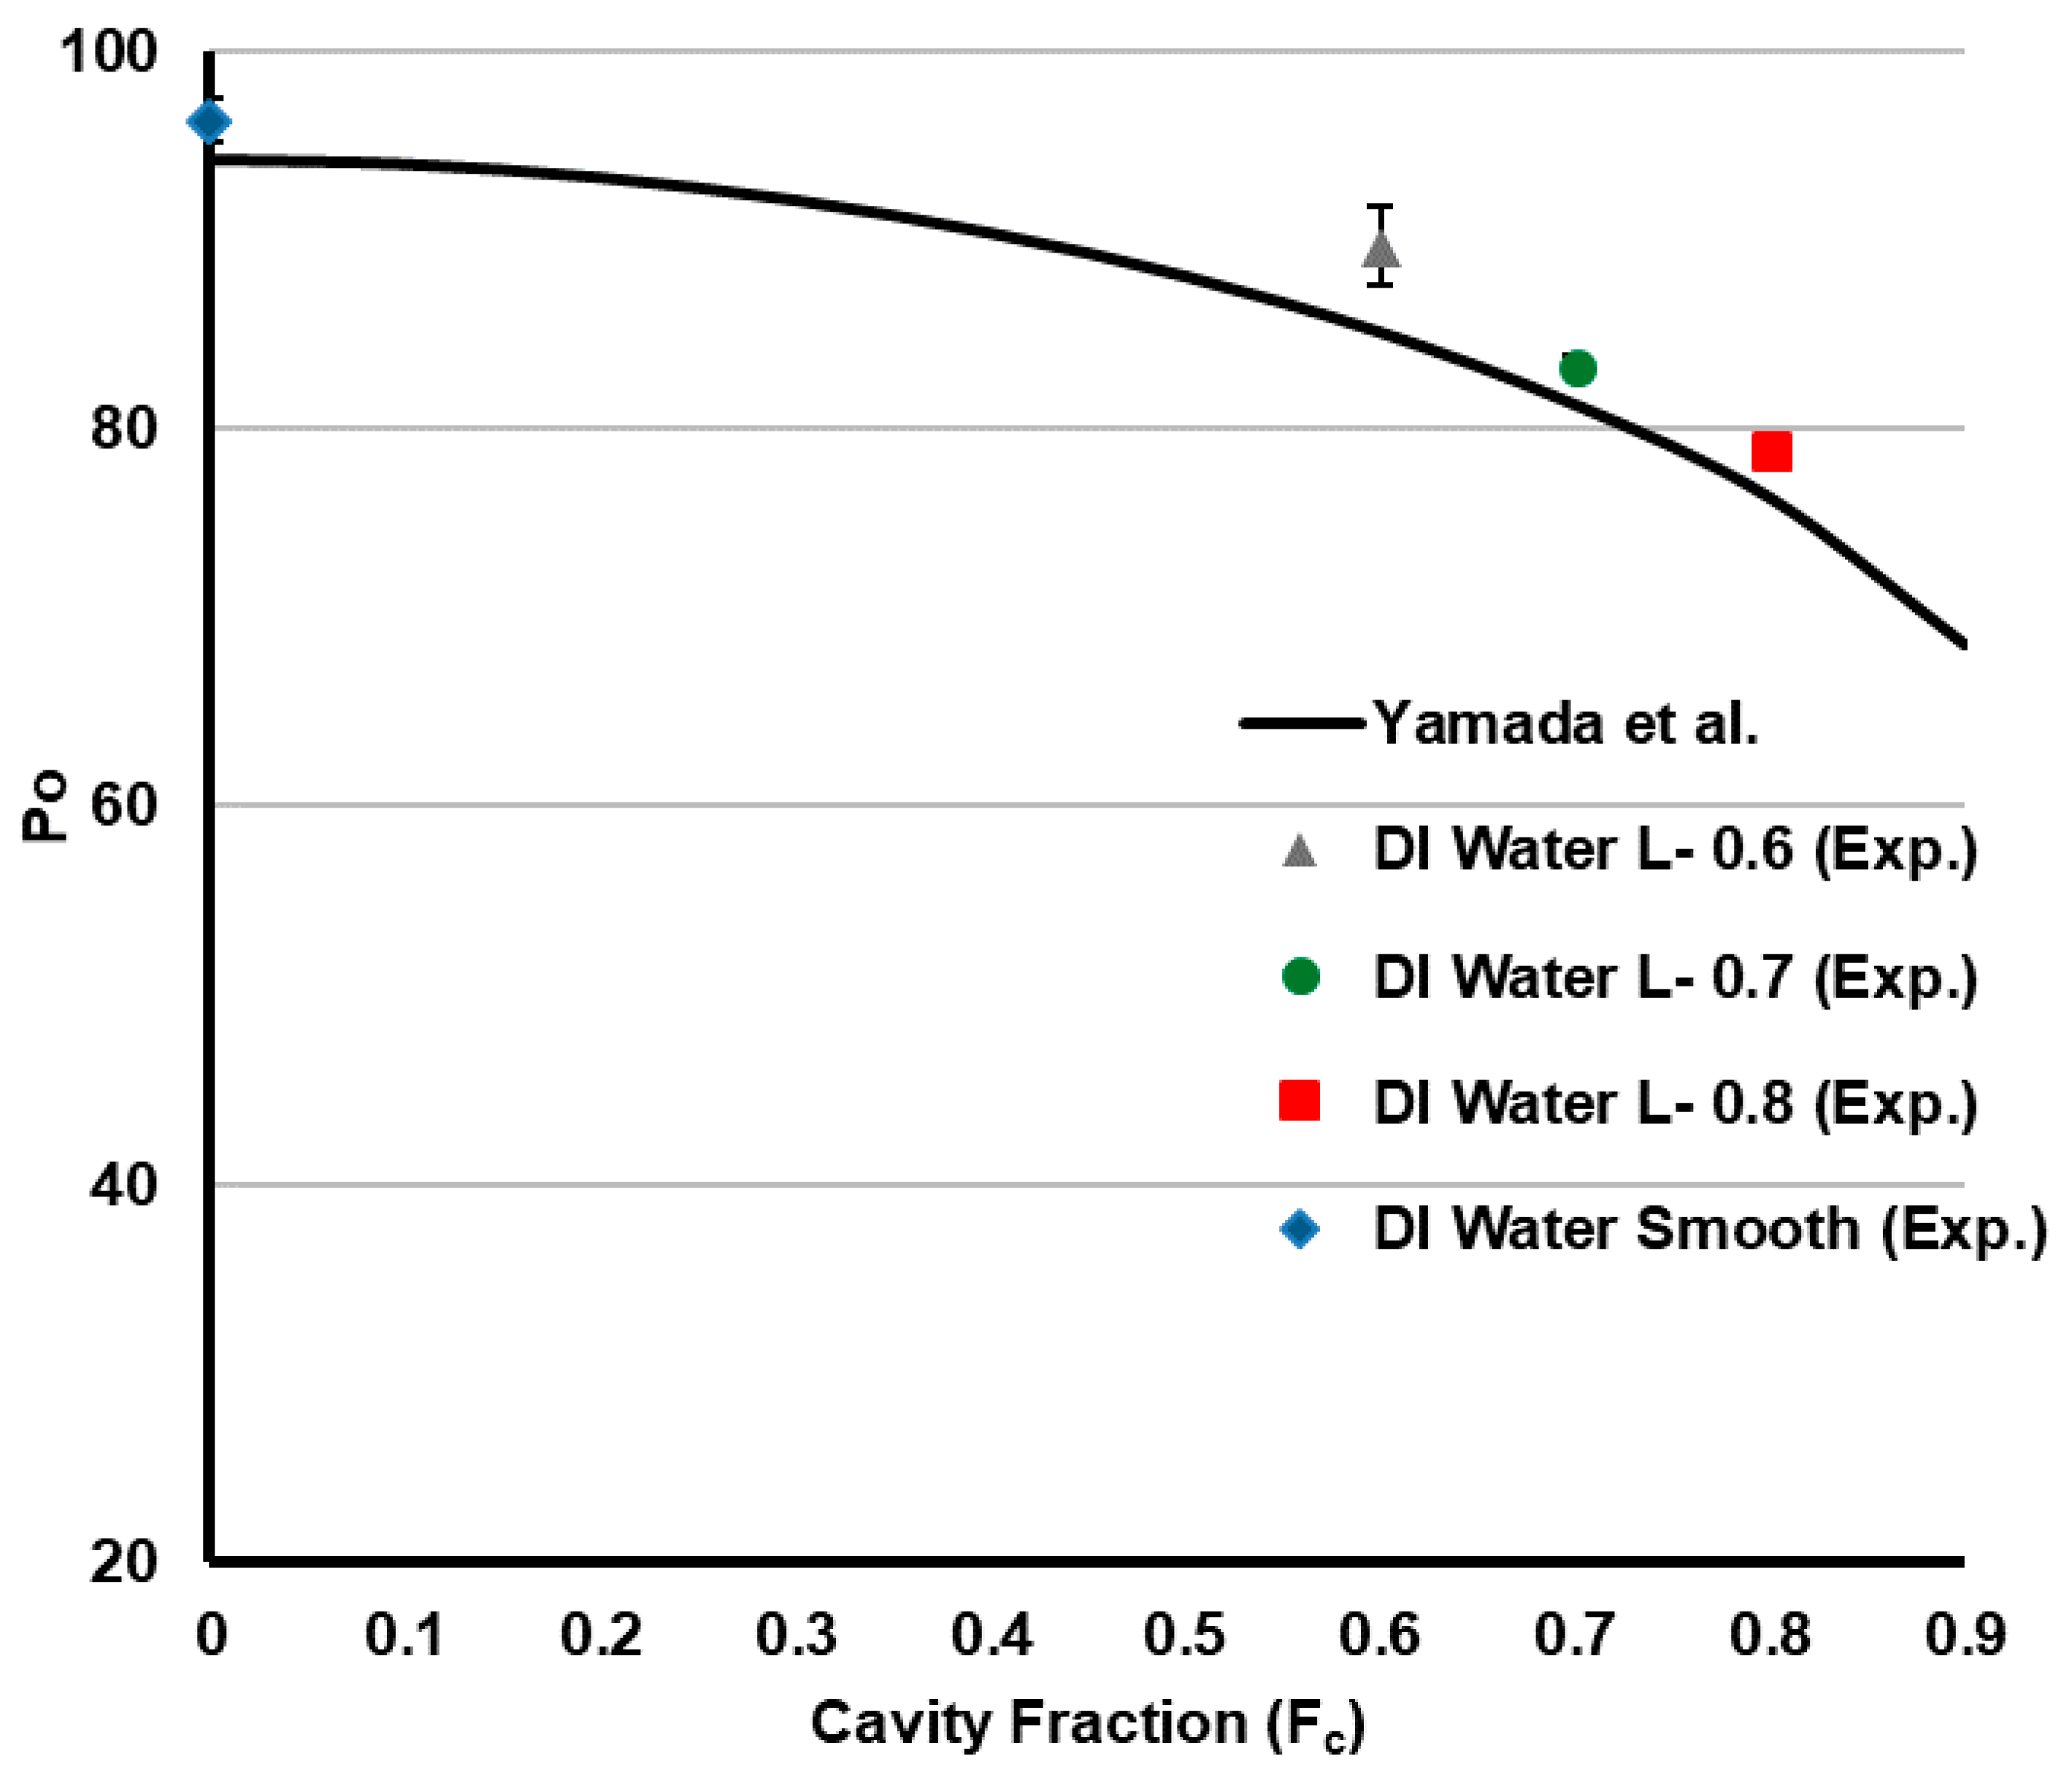
3.1. Pressure Drop Test Results

The experimental Poiseuille number versus Reynolds number results for pure water for the three longitudinal microchannels as well as the smooth channel are plotted in Figure 5. It can be observed that although the error bars are relatively large, the results for the smooth microchannel show good agreement with the analytical prediction. It should be noted that while, in theory, the Poiseuille number should not change with Reynolds number in these designs, some variation was observed; this may be due to the fact that the analytical solution was developed based on the liquid flow in the parallel plate channel [44]. Further, according to Figure 5, a significant trend can be seen in which higher cavity fraction designs provided a better drag reduction outcome. As the best case, the design with a 0.8 cavity fraction provided a pressure drop reduction of 19% on average, as compared to a smooth channel.
To see how these results compare with the predicted results, Figure 6 plots the average Poiseuille number (over the Reynolds number range) against the analytical predictions (from Yamada et al. [44]) for single-wall superhydrophobic microchannels. Again, the experimental results for pure water show good agreement with the analytical expression of Yamada et al. [44]. In the worst case, the L 0.6 design had a 5% deviation from the analytical prediction.
Our experimental apparatus demonstrated satisfactory agreement with the theory for pure water (as shown in Figure 5 and Figure 6). Thus, at this point, we were able to safely move on to conducting the same tests with the nanofluids, prepared as described in Section 2.2. For the nanofluid experiments, the experimental setup and flow conditions were identical to the experiments with water. However, only the best longitudinal design (with cavity fraction = 0.8) was used, along with the smooth microchannel as a baseline comparison. Water results were also added to see how the change in the fluid could affect the results. The results are shown in Figure 7.
As the volume fraction of the nanofluid was quite low (please see Section 1 in Supplementary Information) the physical properties of the nanofluid were calculated to be approximately the same as water. This means the pressure drop results for the nanofluid should be (ideally) comparable to that of the water. This can be seen in Figure 7, in spite of the temperature dependant discrepancies, which were attributed to the fact that the nanofluid was placed in an ice bath for sonication prior to the test. This shifted the viscosity, which is a highly temperature-dependant parameter, in terms of the resultant Po number. The results in Figure 7 indicate that on average, a 17% pressure drop improvement is possible with the proposed configuration. Compared to the patterned microchannel with pure water, the L 0.8 design had a minimum Po number of 78.6, whereas the nanofluid recorded a minimum Po number of approximately 81. Since the nanofluid was expected to have much better optical properties and slightly better thermal properties, this is indeed a promising result.

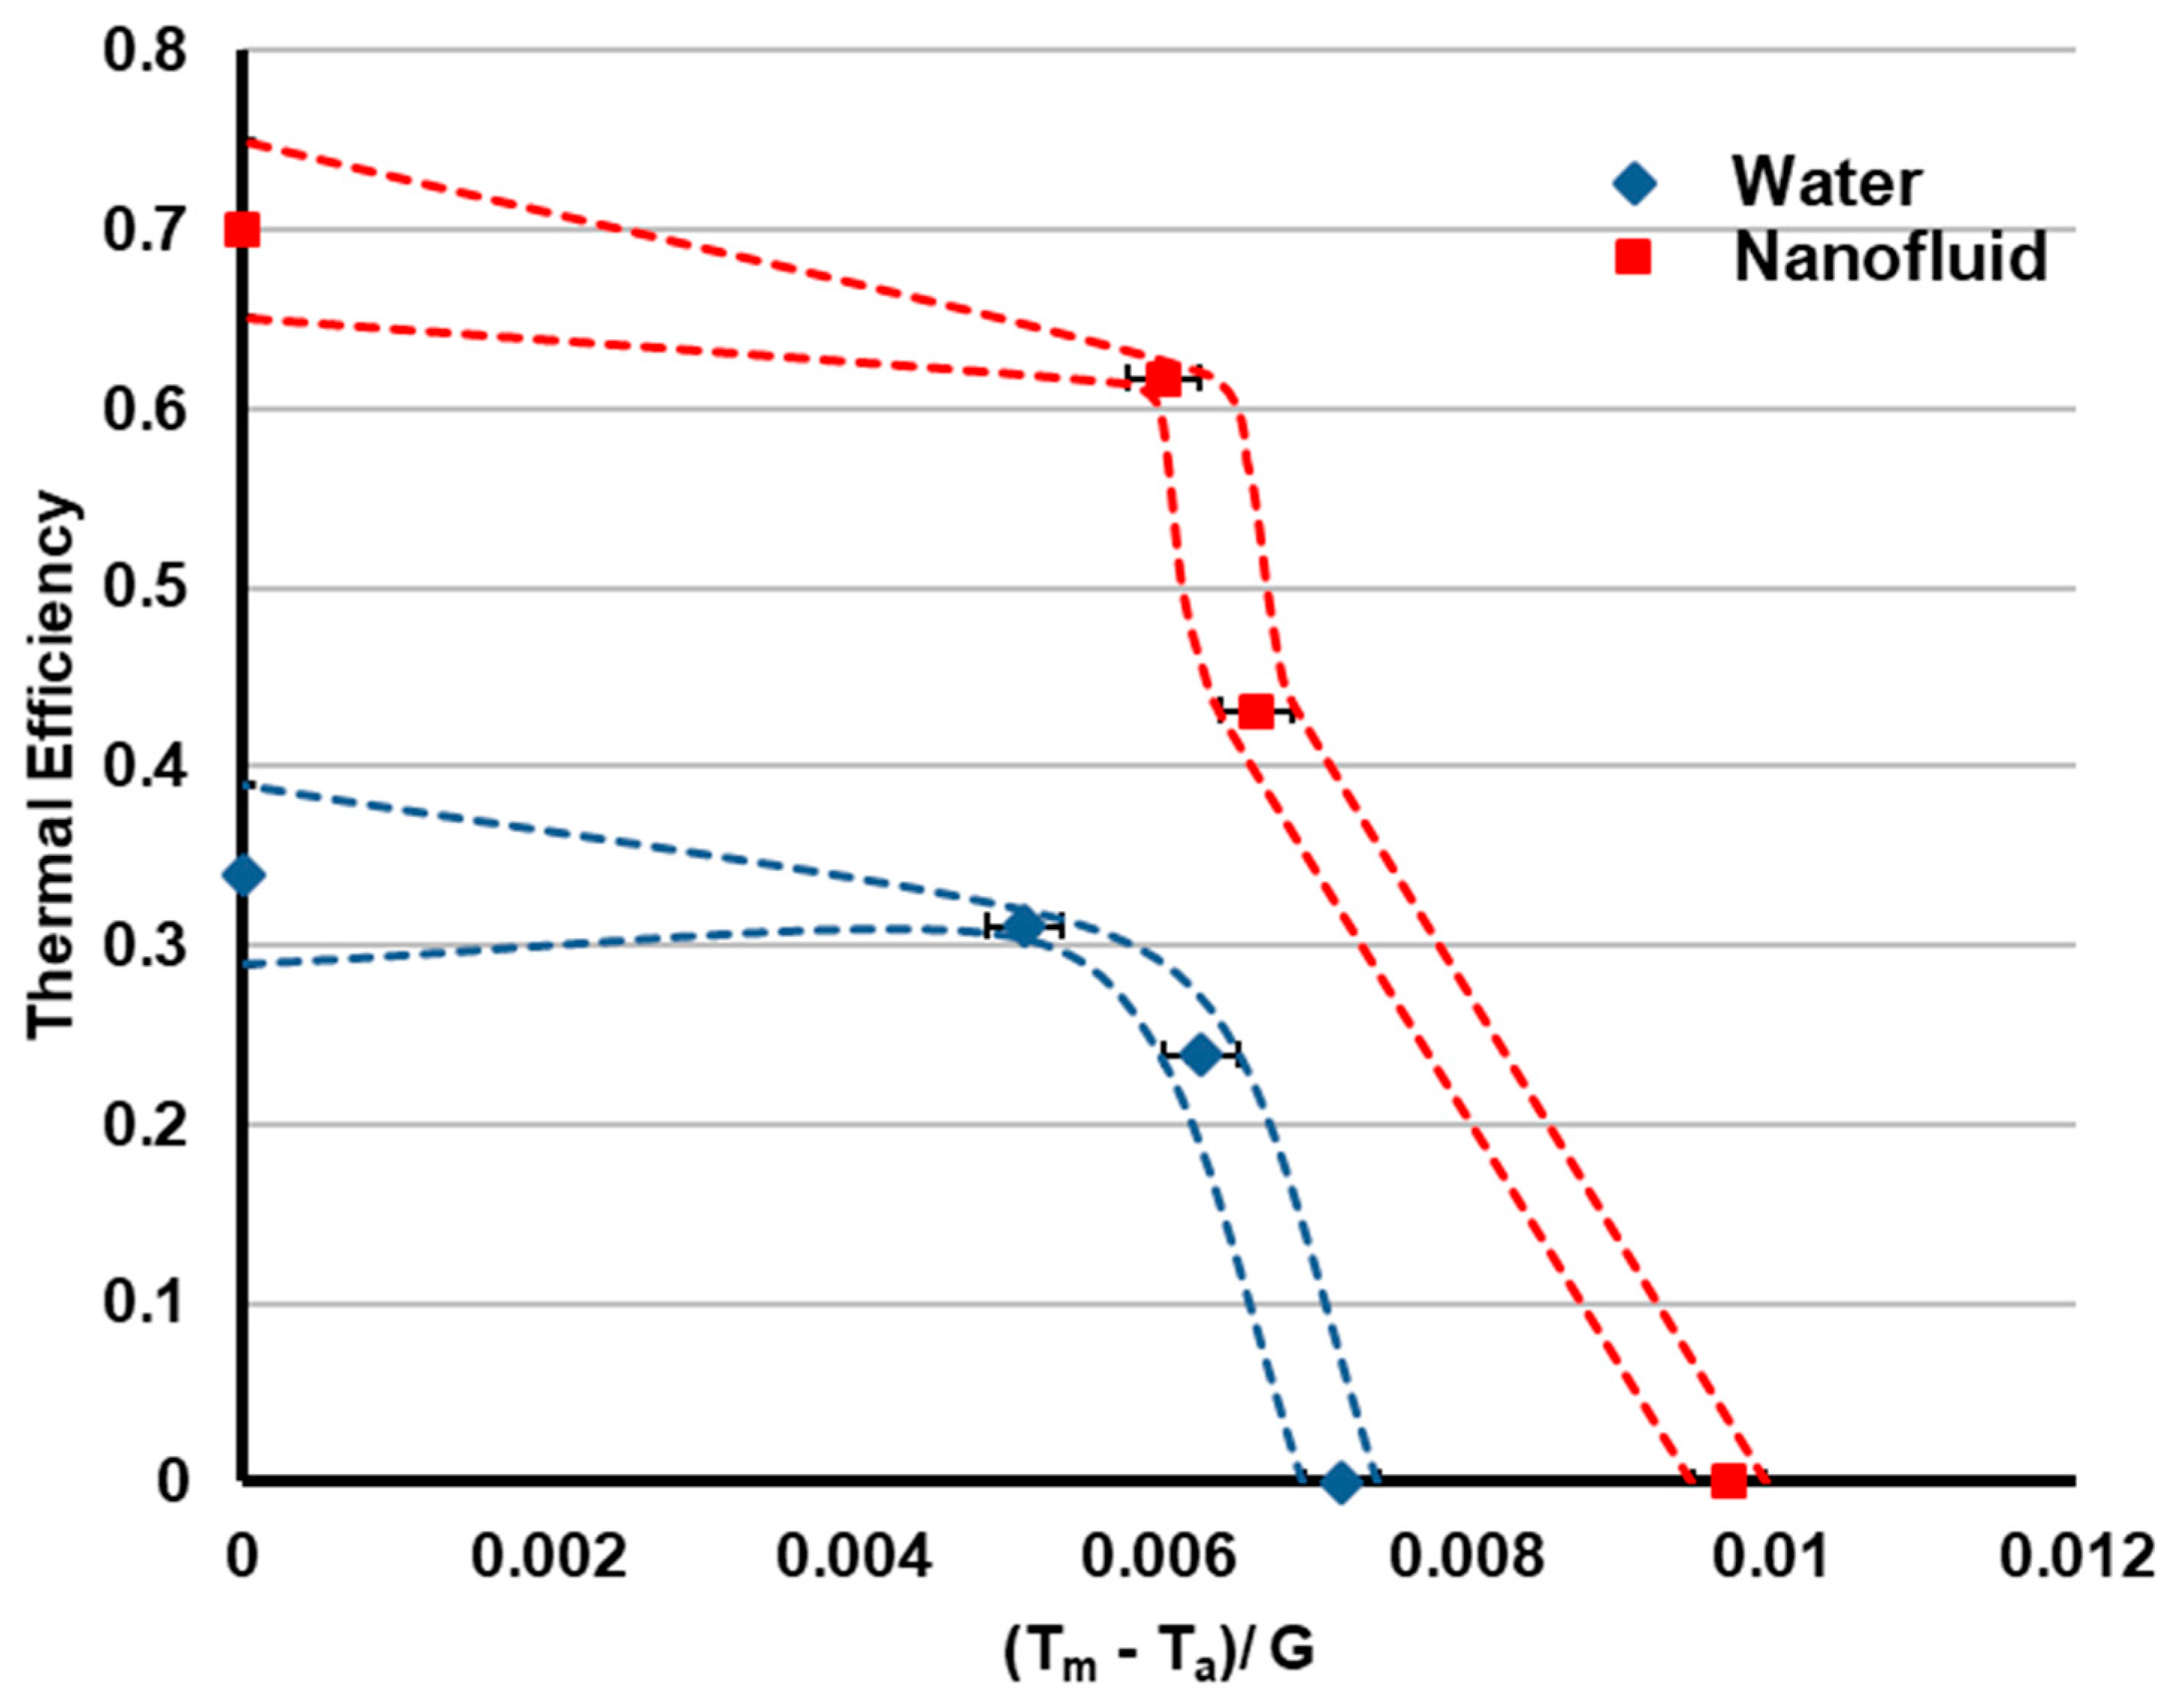
3.2. Thermal Performance Results

The thermal performance test was also conducted using the best microchannel design (L 0.8). For the nanofluid, it was essential to estimate Cp using equation S1. The X-axis of Figure 8, as per the ISO 9806 standard, provides a grouping of terms which includes the mean temperature Tm, the ambient temperature, Ta, and the lamp’s irradiance, G (i.e., 1000 W/m2). The Y-axis of Figure 8 provides thermal efficiency, which is the useful heat out divided by the solar input.
It can be seen that the Y-intercept of the nanofluid system is much higher than the water-based system due to the fact that the nanofluid absorbed a significant portion of the visible spectrum of the lamp. In particular, the lamp spectral-weighted absorbance of the nanofluid was 0.01, while the lamp spectral-weighted absorbance of water was only 7.7 × 10⁻⁸. Both fluids had a similar heat loss at higher temperatures, but since the nanofluid absorbed so much more of the incoming light, it reached a significantly higher temperature stagnation point. That is, the X-intercept of the nanofluid was 0.009, whereas for water the X-intercept was 0.007, which corresponds to just over 3% improvement in the absolute stagnation temperature (because the design was so small, there was a large surface area to volume ratio for heat loss for both, so, the absolute stagnation temperature was low). Based on this test, it is clear that a PV/T system with a nanofluid flowing above a silicon cell is superior to one with pure water.

3.3. Towards Superhydrophobic Microchannel-based PV/T Collectors

In general, PV/T systems are designed to cool the PV cell by removing heat in the working fluid. According to Kurnik et al. [45], PV cells (without cooling) can operate at 20–25 °C higher than the ambient temperature. A PV/T system might operate at only 5–15 °C above ambient to extract excess heat. The advantage of putting the fluid in front of the PV cells (i.e., as proposed here) is that it is possible to pre-filter out the unused portions of the solar spectrum. This would allow the nanofluid to operate at a slightly higher temperature than the underlying PV cell. In the case where a fluid flows behind the PV cell (i.e., conventional PV/T collectors), the fluid would be at a lower temperature than the PV cells. For a detailed comparison of PV/T configuration options, please see the simulation study by Hassani et al. [46].
Moreover, while the pressure drop tests and the thermal performance tests indicated that nanofluids might be used with minimal pressure drop in microchannel-based PV/T collectors, several issues are left for future work. First, the stability of the nanofluid was very important to conducting the experiments in this study, as a non-stable nanofluid can gradually change the microchannel hydraulic diameter, leading to higher pressure drops over time. Second, the greater the height, the smaller the drag reduction will be [47], which can be a constraint for scaling up. Lastly, although the nanofluid used in this study was estimated to be inexpensive, the micropatterning of silicon, especially at a large scale, can still limit the incorporation of this combination into real applications.

4. Conclusions

This study investigated the feasibility of using nanofluids and superhydrophobic surfaces in PV/T systems. The motivation for this was to achieve maximum solar collection with minimal fluid flow and heat transfer resistance. Since the micropattern etched into the silicon substrates of this study had similar features and scale to commercial, textured silicon photovoltaic cells, this study could easily be extended to using real PV cells. In terms of the evaluated fluid flow resistance of this design, our tests indicated that patterned superhydrophobic surfaces (with the largest cavity fraction) can provide a 19% pressure drop reduction for pure water and a 17% pressure drop for the selected nanofluid, both relative to a smooth surface. For the heat transfer performance, the proposed device was investigated for its solar thermal collector efficiency, using a test similar to the ISO 9806 Standard for pure water and for the nanofluid. These results indicated that using an optically selective nanofluid in such a device can increase a collector’s efficiency by 20–30% over pure water for the range of temperatures tested.
From a design perspective, these results represent a step forward, since much of the previous work on integrating nanofluids into PV/T systems has employed the nanofluid behind PV cell. That is, the enhanced thermal properties (e.g., convective heat transfer) of the nanofluid were utilized to obtain higher levels of heat extraction than pure water. However, the current study took a different approach and experimentally investigated the advantage of putting the fluid in front of the PV cell as a liquid optical filter (to pre-filter out unused parts of the solar spectrum). This approach enabled excess heat to be removed by the nanofluid before it had a chance to heat the PV cells, rather than attempting to remove the excess heat from the PV cells after thermalization.
Another contribution of this work is that it represents the first study to investigate using superhydrophobic surfaces in PV/T systems. Prior to carrying out this study, superhydrophobic surfaces were not used in solar thermal systems, since they have less heat transfer contact area with the walls (e.g., poor conduction/convection). However, a subtle benefit of the proposed design is that since the nanofluid uses radiation-based heat absorption (to allow the heat in), reduced heat exchange with the walls is actually a desirable PV/T aspect (to keep the heat in the fluid). From a commercial perspective, the cost of the non-concentrated fluid used in this study was estimated to be approximately 0.5 USD/L, so the proposed design can be considered low cost relative to other beam splitting PV/T options (e.g., optical filters [48]).
Taken together, this study indicates that nanofluids and superhydrophobic microchannels provide complementary, practical benefits that can potentially be harnessed in next-generation PV/T collectors.

Supplementary Materials

The following are available online at https://www.mdpi.com/1996-1073/12/15/3036/s1, Table S1: Comparison of the thermophysical properties of water and the nanofluid

Author Contributions

Conceptualization, R.T.; Methodology, C.C.; Software, C.C., M.R. and M.M.; Validation, R.T., C.C., M.R.; Formal Analysis, C.C. and M.M.; Investigation, N.H., M.M., F.J. and H.Q.; Resources, R.T. and N.H.; Writing—Original Draft Preparation, R.T., C.C. and M.M.; Writing—Review & Editing, R.T., C.C., M.M.; Visualization, C.C., M.M. and M.R.; Supervision, R.T.; Project Administration, R.T.; Funding Acquisition, R.T.

Funding

This work was supported by the Australian Research Council (Grant No. ARC DE160100131).

Acknowledgments

This work was performed, in part, at the South Australian node of the Australian National Fabrication Facility under the National Collaborative Research Infrastructure Strategy. The authors would like to thank Simon Doe, Donghoon Chang, Majid Warkiani, and David O’Connor for help with the photomask and silicon chips fabrication. Felipe Crisostomo and Samuel Garrard are also acknowledged for their help with solar simulator set-up. Yun Ye and Xinyi Song are thanked for their help with contact angle measurements. Wei Jiang helped with zeta potential measurements and Abhishek Singh and Aravind Krishnakumar helped with FEA modelling and with the minor pressure loss calculations and modelling of the holder (outside the microchannel). Nuzhat Ali Rampurawala is thanked for his efforts in pressure drop simulation of the patterned microchannels. Ehsan Ebrahimnia Bajestan is acknowledged for sharing his experience in working with nanofluids and in conducting pressure drop measurements. Thanks also to Kamran Huseynov for sharing his hands-on experience in microfluidic experiments and Sara Mesgari Hagh for providing training for nanofluid preparation.

Conflicts of Interest

The authors declare no conflict of interest.

References

  1. Chemisana, D.; Fernandez, E.; Riverola, A.; Moreno, A. Fluid-based spectrally selective filters for direct immersed PVT solar systems in building applications. Renew. Energy 2018, 123, 263–272. [Google Scholar] [CrossRef] [Green Version]
  2. Pak, B.C.; Cho, Y.I. Hydrodynamic and heat transfer study of dispersed fluids with submicron metallic oxide particles. Exp. Heat Transf. Int. J. 1998, 11, 151–170. [Google Scholar] [CrossRef]
  3. Ding, Y.; Alias, H.; Wen, D.; Williams, R.A. Heat transfer of aqueous suspensions of carbon nanotubes (CNT nanofluids). Int. J. Heat Mass Transf. 2006, 49, 240–250. [Google Scholar] [CrossRef]
  4. Rea, U.; McKrell, T.; Hu, L.W.; Buongiorno, J. Laminar convective heat transfer and viscous pressure loss of alumina water and zirconia water nanofluids. Int. J. Heat Mass Transf. 2009, 52, 2042–2048. [Google Scholar] [CrossRef]
  5. Taylor, R.A.; Otanicar, T.P.; Herukerrupu, Y.; Bremond, F.; Rosengarten, G.; Hawkes, E.R.; Jiang, X.; Coulombe, S. Feasibility of nanofluid-based optical filters. Appl. Opt. 2013, 52, 1413–1422. [Google Scholar] [CrossRef] [PubMed]
  6. Taylor, R.A.; Hewakuruppu, Y.; DeJarnette, D.; Otanicar, T.P. Comparison of selective transmitters for solar thermal applications. Appl. Opt. 2016, 55, 3829–3839. [Google Scholar] [CrossRef] [PubMed]
  7. Hjerrild, N.E.; Taylor, R.A. Boosting solar energy conversion with nanofluids. Phys. Today 2017, 70, 40–45. [Google Scholar] [CrossRef] [Green Version]
  8. Corcione, M. Empirical correlating equations for predicting the effective thermal conductivity and dynamic viscosity of nanofluids. Energy Convers. Manag. 2011, 52, 789–793. [Google Scholar] [CrossRef]
  9. Prasher, R.; Song, D.; Wang, J.; Phelan, P. Measurements of nanofluid viscosity and its implications for thermal applications. Appl. Phys. Lett. 2006, 89, 133108. [Google Scholar] [CrossRef]
  10. Wu, H.; Cheng, P. An experimental study of convective heat transfer in silicon microchannels with different surface conditions. Int. J. Heat Mass Transf. 2003, 46, 2547–2556. [Google Scholar] [CrossRef]
  11. Ahlatli, S.; Mare, T.; Estelle, P.; Doner, N. Thermal performance of carbon nanotube nanofluids in solar microchannel collectors: An experimental study. Int. J. Technol. 2016, 7, 219–226. [Google Scholar] [CrossRef]
  12. Kandlikar, S.G.; Grande, W.J. Evaluation of single phase flow in microchannels for high heat flux chip cooling—Thermohydraulic performance enhancement and fabrication technology. Heat Transf. Eng. 2004, 25, 5–16. [Google Scholar] [CrossRef]
  13. Qu, W.; Mala, G.M.; Li, D. Heat transfer for water flow in trapezoidal silicon microchannels. Int. J. Heat Mass Transf. 2000, 43, 3925–3936. [Google Scholar] [CrossRef]
  14. Weilin, Q.; Mala, G.M.; Dongqing, L. Pressure-driven water flows in trapezoidal silicon microchannels. Int. J. Heat Mass Transf. 2000, 43, 353–364. [Google Scholar] [CrossRef]
  15. Ou, J.; Perot, B.; Rothstein, J.P. Laminar drag reduction in microchannels using ultrahydrophobic surfaces. Phys. Fluids 2004, 16, 4635–4643. [Google Scholar] [CrossRef] [Green Version]
  16. Kim, J.H.; Rothstein, J.P. Role of interface shape on the laminar flow through an array of superhydrophobic pillars. Microfluid. Nanofluid. 2017, 21, 78. [Google Scholar] [CrossRef]
  17. Cassie, A.; Baxter, S. Wettability of porous surfaces. Trans. Faraday Soc. 1944, 40, 546–551. [Google Scholar] [CrossRef]
  18. Davies, J.; Maynes, D.; Webb, B.; Woolford, B. Laminar flow in a microchannel with superhydrophobic walls exhibiting transverse ribs. Phys. Fluids 2006, 18, 087110. [Google Scholar] [CrossRef]
  19. Maynes, D.; Webb, B.; Davies, J. Thermal transport in a microchannel exhibiting ultrahydrophobic microribs maintained at constant temperature. J. Heat Transf. 2008, 130, 022402. [Google Scholar] [CrossRef]
  20. Woolford, B.; Maynes, D.; Webb, B. Liquid flow through microchannels with grooved walls under wetting and superhydrophobic conditions. Microfluid. Nanofluid. 2009, 7, 121–135. [Google Scholar] [CrossRef]
  21. Maynes, D.; Webb, B.; Crockett, J.; Solovjov, V. Analysis of laminar slip-flow thermal transport in microchannels with transverse rib and cavity structured superhydrophobic walls at constant heat flux. J. Heat Transf. 2013, 135, 021701. [Google Scholar] [CrossRef]
  22. Enright, R.; Eason, C.; Dalton, T.; Hodes, M.; Salamon, T.; Kolodner, P.; Krupenkin, T. Friction factors and Nusselt numbers in microchannels with superhydrophobic walls. In Proceedings of the ASME 4th International Conference on Nanochannels, Microchannels, and Minichannels, Limerick, Ireland, 19–21 June 2006; pp. 599–609. [Google Scholar]
  23. Cheng, Y.; Xu, J.; Sui, Y. Numerical study on drag reduction and heat transfer enhancement in microchannels with superhydrophobic surfaces for electronic cooling. Appl. Therm. Eng. 2015, 88, 71–81. [Google Scholar] [CrossRef]
  24. Rosengarten, G.; Stanley, C.; Kwok, F. Superinsulating heat transfer surfaces for microfluidic channels. Int. J. Transp. Phenom. 2008, 10, 293–306. [Google Scholar]
  25. Green, M.A. The passivated emitter and rear cell (PERC): From conception to mass production. Sol. Energy Mater. Sol. Cells 2015, 143, 190–197. [Google Scholar] [CrossRef]
  26. Wenzel, R.N. Resistance of solid surfaces to wetting by water. Ind. Eng. Chem. 1936, 28, 988–994. [Google Scholar] [CrossRef]
  27. Chung, C.Y.; Warkiani, M.E.; Mesgari, S.; Rosengarten, G.; Taylor, R. Thermoset polyester-based superhydrophobic microchannels for nanofluid heat transfer applications. In Proceedings of the Micro Nano Materials, Devices, and Systems, Melbourne, Australia, 9–11 December 2013. [Google Scholar]
  28. Taylor, R.A.; Hjerrild, N.; Duhaini, N.; Pickford, M.; Mesgari, S. Stability testing of silver nanodisc suspensions for solar applications. Appl. Surf. Sci. 2018, 455, 465–475. [Google Scholar] [CrossRef]
  29. Hjerrild, N.E.; Mesgari, S.; Crisostomo, F.; Scott, J.A.; Amal, R.; Taylor, R.A. Hybrid PV/T enhancement using selectively absorbing Ag–SiO2/carbon nanofluids. Sol. Energy Mater. Sol. Cells 2016, 147, 281–287. [Google Scholar] [CrossRef]
  30. Lee, S.; Phelan, P.E.; Taylor, R.A.; Prasher, R.; Dai, L. Low-temperature melting of silver nanoparticles in subcooled and saturated water. J. Heat Transf. 2016, 138, 052301. [Google Scholar] [CrossRef]
  31. Yu, F.; Chen, Y.; Liang, X.; Xu, J.; Lee, C.; Liang, Q.; Tao, P.; Deng, T. Dispersion stability of thermal nanofluids. Prog. Nat. Sci. Mater. Int. 2017, 27, 531–542. [Google Scholar] [CrossRef]
  32. Angayarkanni, S.A.; Philip, J. Review on thermal properties of nanofluids: Recent developments. Adv. Colloid Interface Sci. 2015, 225, 146–176. [Google Scholar] [CrossRef] [PubMed]
  33. Bashirnezhad, K.; Bazri, S.; Safaei, M.R.; Goodarzi, M.; Dahari, M.; Mahian, O.; Dalkılıça, A.S.; Wongwises, S. Viscosity of nanofluids: A review of recent experimental studies. Int. Commun. Heat Mass Transf. 2016, 73, 114–123. [Google Scholar] [CrossRef]
  34. Riazi, H.; Murphy, T.; Webber, G.B.; Atkin, R.; Tehrani, S.S.M.; Taylor, R.A. Specific heat control of nanofluids: A critical review. Int. J. Therm. Sci. 2016, 107, 25–38. [Google Scholar] [CrossRef]
  35. Reference Air Mass 1.5 Spectra. Available online: https://www.nrel.gov/grid/solar-resource/spectra-am1.5.html (accessed on 27 July 2019).
  36. Motamedi, M.; Crisostomo, F.; Yao, Y.; Mofarah, S.S.; Chen, W.-F.; Koshy, P.; Taylor, R.A. Single-layer, anti-reflective thin films of porous MgF 2 for solar thermal applications. J. Phys. D Appl. Phys. 2019, 52, 315501. [Google Scholar] [CrossRef]
  37. Tan, J.; Xie, Y.; Wang, F.; Jing, L.; Ma, L. Investigation of optical properties and radiative transfer of TiO2 nanofluids with the consideration of scattering effects. Int. J. Heat Mass Transf. 2017, 115, 1103–1112. [Google Scholar] [CrossRef]
  38. Mandal, P.; Sharma, S. Progress in plasmonic solar cell efficiency improvement: A status review. Renew. Sustain. Energy Rev. 2016, 65, 537–552. [Google Scholar] [CrossRef]
  39. Wiley, B.J.; Im, S.H.; Li, Z.Y.; McLellan, J.; Siekkinen, A.; Xia, Y. Maneuvering the surface plasmon resonance of silver nanostructures through shape-controlled synthesis. J. Phys. Chem. B 2006, 110, 15666–15675. [Google Scholar] [CrossRef] [PubMed]
  40. Green, M.A.; Hishikawa, Y.; Dunlop, E.D.; Levi, D.H.; Hohl-Ebinger, J.; Ho-Baillie, A.W. Solar cell efficiency tables (version 51). Res. Appl. 2018, 26, 3–12. [Google Scholar] [CrossRef]
  41. ISO 9806: 2013 (Solar Energy—Solar thermal Collectors—Test Methods). Available online: https://www.iso.org/standard/59879.html (accessed on 8 June 2019).
  42. Abernethy, R.B.; Benedict, R.P.; Dowdell, R.B. ASME Measurement Uncertainty. J. Fluids Eng. 1985, 107, 161–164. [Google Scholar] [CrossRef] [Green Version]
  43. Liu, D.; Garimella, S.V. Investigation of liquid flow in microchannels. J. Thermophys. Heat Transf. 2004, 18, 65–72. [Google Scholar] [CrossRef]
  44. Yamada, T.; Hong, C.; Gregory, O.J.; Faghri, M. Experimental investigations of liquid flow in rib-patterned microchannels with different surface wettability. Microfluid. Nanofluid. 2011, 11, 45–55. [Google Scholar] [CrossRef]
  45. Kurnik, J.; Jankovec, M.; Brecl, K.; Topic, M. Outdoor testing of PV module temperature and performance under different mounting and operational conditions. Sol. Energy Mater. Sol. Cells 2011, 95, 373–376. [Google Scholar] [CrossRef]
  46. Hassani, S.; Saidur, R.; Mekhilef, S.; Taylor, R.A. Environmental and exergy benefit of nanofluid-based hybrid PV/T systems. Energy Convers. Manag. 2016, 123, 431–444. [Google Scholar] [CrossRef]
  47. Cheng, Y.; Teo, C.; Khoo, B. Microchannel flows with superhydrophobic surfaces: Effects of Reynolds number and pattern width to channel height ratio. Phys. Fluids 2009, 21, 122004. [Google Scholar] [CrossRef]
  48. Hjerrild, N.E.; Crisostomo, F.; Chin, R.L.; Scott, J.A.; Amal, R.; Taylor, R.A. Experimental Results for Tailored Spectrum Splitting Metallic Nanofluids for c-Si, GaAs, and Ge Solar Cells. IEEE J. Photovolt. 2019, 9, 385–390. [Google Scholar] [CrossRef]
Figure 1. (a) The experimental set-up; (b) the assembled microchannel mounted on its 3D-printed holder; (c) a close-up view of the assembled microchannel (with dimensions); (d) schematic diagrams of the holder and the locations of thermocouples and pressure reading ports; (e) schematic diagram of the microchannel assembly; and (f) schematic diagram of the longitudinal microstructural configuration.
Energies 12 03036 g001
Figure 2. Water static contact angle measurement images of the longitudinal (0.6) microchannels (a) before silanisation and (b) after silanisation.
Energies 12 03036 g002
Figure 3. (a) Microscopic image of the smooth microchannel prior to the nanofluid test, (b) microscopic image after the nanofluid test and (c) TEM image of suspended nanoparticles in Ag-SiO2 nanodisc solution (reproduced with permission from Hjerrild et. al. [29] Copyright 2016, Elsevier).
Energies 12 03036 g003
Figure 4. Optical characterisation of the solar spectrum as compared to the lamp and the nanofluid transmission as compared to the external quantum efficiency (EQE) of a silicon PV cell (taken from [40]). The transmission of the glass cover is also shown.
Energies 12 03036 g004
Figure 5. Experimental Poiseuille number (Po) as a function of Reynolds number (Re) for the three longitudinal microchannels as well as the smooth microchannel (compared with theory).
Energies 12 03036 g005
Figure 6. Results of Po for four different microchannels plotted as a function of cavity fraction (Fc) against the analytical results for comparison.
Energies 12 03036 g006
Figure 7. Comparison of the Poiseuille numbers of the smooth and superhydrophobic microchannels for water and the nanofluid. Note that pure water and the nanofluid were at ~20 °C and ~19 °C, respectively, which shifted the nanofluid results to higher Po numbers due to the temperature dependence of viscosity).
Energies 12 03036 g007
Figure 8. Experimental thermal efficiency curves of the proposed receiver, comparing water (blue diamonds) and a nanofluid (red squares). The dashed lines connect the bounds of experimental uncertainty for water (blue) and the nanofluid (red). Note that the ambient temperature (Ta) was approximately 20 °C during the test.
Energies 12 03036 g008
Table 1. Average of three contact angle measurements of longitudinal channels. *
Fluid Type
DI WaterConcentrated Nanofluid
Channel ConfigurationSmoothL-0.6L-0.7L-0.8SmoothL-0.6L-0.7L-0.8
Uncoated12.05 *37.9238.3740.45
Coated112.69134.77135.78134.00104.88126.16125.71143.33
*: All the reported angles are in degrees.

