Article

Cost and Profitability Analysis of a Prospective Pennycress to Sustainable Aviation Fuel Supply Chain in Southern USA

Agricultural & Resource Economics Department, University of Tennessee, Knoxville, TN 37996, USA
*
Author to whom correspondence should be addressed.
Energies 2019, 12(16), 3055; https://doi.org/10.3390/en12163055
Submission received: 23 June 2019 / Revised: 31 July 2019 / Accepted: 5 August 2019 / Published: 8 August 2019
(This article belongs to the Special Issue Research Advances in Liquid Biofuels)

Abstract

:
This study evaluates biorefinery bio-oil feedstock costs at the plant gate for a prospective field pennycress (Thlaspi arvense L.) to sustainable aviation fuel (SAF) supply chain. The biorefinery would supply SAF to the Nashville, Tennessee international airport. Supply chain activities include pennycress production, transporting oilseed to a crushing facility, processing of oilseed into bio-oil, and transporting bio-oil to the biorefinery. The analysis shows profit potential for economic agents in the prospective supply chain. Estimated breakeven cost (profit = 0) of growing, harvesting, and transporting oilseed to a crushing facility is 17.7 ¢ kg−1. A crushing facility can pay up to 23.8 ¢ kg−1 for pennycress oilseed during the first year of production and provide investors 12.5% annual rate of return. Therefore, a profit margin of up to 6.1 ¢ kg−1 is available for the crushing facility to induce prospective pennycress producers to supply oilseed for SAF production. However, the estimated profit margin was sensitive mainly to uncertain oilseed yields, changes in field production costs, and pennycress meal and bio-oil prices. A spatial biorefineries sitting model, the Biofuels Facility Location Analysis Modeling Endeavor, estimated that the least-cost supply chain configuration is to establish three crushing facilities located in Union City, Huntington, and Clarksville, TN, to supply bio-oil to the biorefinery, with the biorefinery sited in an industrial park about 24.14 km from the Nashville international airport aviation fuel storage. Estimated total costs of bio-oil at the biorefinery plant gate are between 83 and 109 ¢ kg−1 if crushing facility oilseed procurement costs are between 17.7 and 23.8 ¢ kg−1 for oilseed.

Graphical Abstract

1. Introduction

There is growing interest by the global aviation industry to consume significant amounts of sustainable aviation fuels (SAF). Commercial and military aircraft test flights have successfully demonstrated the feasibility of SAF as a substitute for petroleum-based jet fuel [1,2]. Several commercial airlines have also signed a memorandum of understanding from potential SAF suppliers [1,2]. A driving force for aviation industry interest in SAF is the United Nations International Civil Aviation Organization’s Carbon Offsetting and Reduction Scheme for International Aviation (CORSIA) adopted in 2016 [3]. CORSIA is a market-based mechanism designed to offset growth in greenhouse gas emissions from aviation starting in 2020.
In the US, interest in SAF by the commercial aviation industry is mainly driven by petroleum-based jet fuel price instability, energy security, environmental performance, and the impending implementation of CORSIA for international flights [4]. Currently, at least two biorefineries are commercializing SAF in the US. AltAir Paramount, acquired in March 2018 by World Energy LLC, entered an agreement in 2016 to sell up to 56.78 million liters SAF to United Airlines by converting tallow, Brassica carinata, and other oilseeds into SAF [5]. Gevo, Inc., also produces, at lower quantities compared to AltAir’s, SAF that has been used to fuel approximately 195 domestic and international flights departing from Brisbane, Australia [6]. Overall, production of SAF in the US is still limited.
The potential for growth of SAF consumption in the US depends upon several factors including feedstock availability, oil conversion technology, aviation industry demand, and overall supply chain profitability. Lewis et al. [4] modeled SAF production capacity in the US and concluded that significant production and distribution of SAF are possible by 2030 if appropriate incentives, such as higher guarantee rates or higher renewable identification number (RIN) prices along with high oil prices and investment deployment are in place. Without substantial changes in current incentives, the authors conclude that between 0.76 and 10.22 billion liters of SAF could be produced and distributed by 2030, with simulations showing that 1 billion gallons could be produced by 2030 with a 38% probability. A better understanding of feedstock supply chains, which is the goal of this study, should improve the likelihood of increased production and consumption of SAF.
One of the main challenges for the production of renewable fuels, in general, is the relatively high cost of production, particularly for biofuels produced using field crops such as corn. Dedicated energy crops are then expected to play an increasing role in meeting the demand for SAF [2]. Field pennycress (Thlaspi arvense L.), hereafter referred to as pennycress, is a non-food crop that has been documented to have high potential as feedstock for SAF production [1,7].
Pennycress may have economic advantages over other dedicated energy crops produced in place of food crops because it can be grown as a winter cover cash crop within an existing field cropping system. An example is the incorporation of pennycress into a two-year corn (first year)–soybean (second year) rotation that is widely adopted in US agriculture [8]. For a corn–pennycress–soybean rotation, pennycress seed is aerial broadcast onto the field before the harvest of corn. Pennycress grows as a winter cover crop and is harvested using a combine in the spring of the second year of the rotation. Soybeans are planted after the pennycress harvest to complete the rotation. This production system provides three cash crops to a farmer instead of two over the two-year sequence. In addition, oilseeds such as pennycress that are planted as a winter cover within existing crop rotations may provide ecological and environmental benefits, e.g., reduced pest pressure, erosion control, and immobilization of excess nutrient levels in soils normally left bare over the winter [9].
Another advantage of pennycress is the relatively high content of seed oil, about twice the content in soybeans and comparable to camelina’s [1], that can be subsequently converted into SAF at a high level of efficiency [10]. Most importantly, the properties of pennycress oil meets feedstock requirements for biodiesel production under the United States American Society for Testing and Materials (ASTM) D6751 regulation [11,12]. Therefore, biofuel derived from pennycress oil is expected to meet all the specifications for its use in SAF blends up to 50% [1]. Studies have also shown that the pennycress cake or meal left after oil extraction has potential uses such as biofumigant [13], secondary energy source [1], industrial adhesive [14], and livestock feed [1].
Tao et al. [15] estimate that the cost of pennycress bio-oil feedstock to produce SAF is 68% of minimum SAF selling price. Therefore, the cost of bio-oil feedstock has a substantial impact on expected cost and profit profiles of a biorefinery and other enterprises within the prospective biofuel supply chain [15,16,17]. However, little is known about supply chain cost structures for second-generation energy crops such as pennycress [18]. This study contributes to the literature in this regard.
In a pennycress supply chain, a crushing facility would purchase and convert pennycress oilseed into the bio-oil that is subsequently transformed into SAF by a biorefinery [1,15]. 
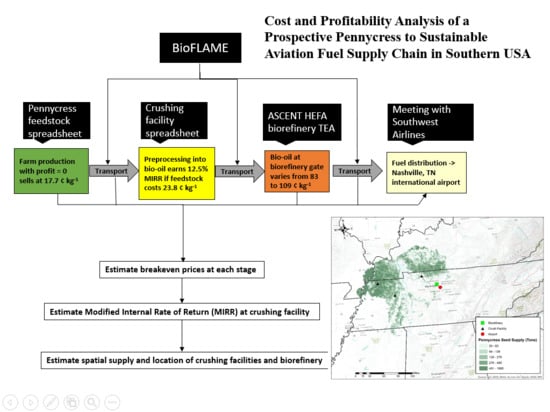
Figure 1 shows the three major enterprises of a stylized pennycress SAF supply chain. Researchers have evaluated the farm-level costs—enterprise (1) in Figure 1—of producing field pennycress and potential output prices required to induce farmers to produce pennycress oilseed for conversion to SAF [8]. However, there is still substantial uncertainty about pennycress oilseed yields, cost structures, and prices required to induce oilseed production that are significant barriers to the development of a feedstock supply chain for SAF [8]. For example, the impact of potential bio-oil and coproduct costs and prices from crushing pennycress oilseed on the expected profitability and breakeven prices paid for feedstock by a crushing facility—enterprise (2) in Figure 1—has not been quantified. We determine profit profile and breakeven pennycress oilseed prices at the plant-gate from investment in an oilseed crushing facility located in Southeastern US. The crushing facility would supply bio-oil to biorefineries—enterprise (3) in Figure 1—producing SAF for the Nashville, Tennessee international airport, and other co-products. Using a spatial biorefineries sitting model, we also estimate the number and locations of potential crushing facilities and biorefineries in the supply chain. Finally, the cost structure of the pennycress oil supply chain up the biorefinery gate is discussed.

2. Methods

The steps used to accomplish the objective of the study are as follows. First, breakeven pennycress oilseed prices (profit = 0) required to induce farm-level production of oilseed are evaluated using partial budgeting and one-way sensitivity analysis of the costs of alternative pennycress production practices [19]. Second, a crushing facility discounted cash flow model and one-way sensitivity analysis are used to evaluate breakeven prices for pennycress oilseed given an expected rate of return. Third, the biofuels facility location analysis modeling endeavor (BioFLAME), a spatial biorefineries sitting model, is used to determine the number and locations of potential crushing facilities and biorefineries to supply SAF to the Nashville international airport [20].

2.1. Farm-Level Pennycress Oilseed Breakeven Prices

The plant-gate cost of feedstock is the largest component of total operating costs for an oilseed crushing facility [21]. Given that pennycress production is not commercially harvested, there is considerable uncertainty about oilseed yields, the inputs used in production, and the costs of production [14]. Budget-based costs of production vary widely depending on assumptions about oilseed yields, seeding rates at planting, fertilization rates, herbicide practices, harvest practices, and feedstock transport distances from the field to the crushing facility [1,7,8,22].
Effects of uncertain budget inputs on feedstock costs at the crushing facility plant gate are evaluated using breakeven and one-way sensitivity analysis [19]. The resulting breakeven pennycress oilseed price (¢ kg−1) is the minimum price (profit = 0) that covers the cost of production and transportation to the crushing facility for a given oilseed yield. The base scenario is the production practices and input quantities specified in a field pennycress budget by Markel et al. [8] (details provided in the notes of Table 1). In addition, the base one-way travel distance of 80.47 km to transport pennycress oilseed from the field to the crushing facility is from Fan et al. [1]. The one-way sensitivity analysis is accomplished by changing one partial budget model variable (oilseed yield and each input practice) at a time from the base value while holding the other variables at their base values. A tornado diagram presents the one-way sensitivity analysis effects of each variable on minimum potential plant-gate cost of pennycress oilseed [19]. Yields, production practices reported in the literature, and costs for the lower and upper bound values are also presented in Table 1.

2.2. Crushing Facility Pennycress Oilseed Breakeven Prices

A discounted cash flow model is used to evaluate the maximum (breakeven) price that a crushing facility can pay for pennycress oilseed, including transportation cost, to obtain a specified hurdle rate of return expected by investors. The main financial metrics estimated are net present value (NPV) and the modified internal rate of return (MIRR). NPV provides an estimate, in present value terms, of the amount of money that replicates the forecast cash flows of the project after deducting the opportunity cost of capital. Thus, NPV is a reference showing the total amount exceeding or falling short of investors’ expected return, where expected return is measured by the opportunity cost of capital. The maximum buying price is estimated so that NPV equals zero; or equivalently, so that the crushing facility can obtain a 12.5% MIRR. The crushing facility maximum (breakeven) oilseed price is compared with the minimum (breakeven) pennycress oil prices required to induce farm production.
To evaluate price ranges instead of a point estimate, similarly to the analysis performed for pennycress farm level costs, we evaluate the effects of uncertain pennycress to oil conversion rate, pennycress output—oil and meal—prices, weighted average cost of capital, income tax rate, and assumed number of days inventory for the facility to hold. Table 2 provides data and assumptions for this breakeven analysis. Other key financial metrics for the crushing facility are also reported.
The cost structure, plant design, and feedstock capacity for the pennycress oilseed crushing facility are adapted from oilseed processing models developed by Shumaker et al. [37] and English et al. [38]. Both studies have distinctive characteristics found suitable as references for this pennycress oilseed crushing facility feasibility study. First, those studies were the result of a concerted effort by researchers, farmers, and industry consulting, (research faculty involved in the studies were from The Center for Agribusiness and Economic Development at University of Georgia [1] and The Agri-Modelling and Analysis Group at University of Tennessee Knoxville [2]. A farmer association involved was The South Dakota Soybean Processors [1], a farmer owned soybean crushing operation. Frazier, Barnes & Associates, LLC., a consulting firm specialized in agricultural and renewable fuel products collaborated in both studies [1,2].) arguably resulting in balanced analyses in terms of applicability and rigor. Second, the studies concur on their assessment that a cost-efficient facility size in the region, capturing much of the available economies of scale, would be one processing between 725.75 and 816.47 Mg of feedstock per day. This study assumes the crushing oilseed facility processes 725.75 Mg of pennycress oilseed per day, equivalent to 238,771 Mg per year working 24 hours a day at 90% plant capacity or about 329 days annually.
To provide context, one crushing facility would supply about one-third of the refined bio-oil demand of the bio-refinery. (This assessment is based on communications by the authors with researchers currently involved in conceptualized biorefinery projects by the Aviation Sustainability Center (ASCENT). The pennycress oilseed facility in this study can provide, according to the baseline estimation, about 78,541 Mg of pennycress oil, which represents around 30% of the 260,706 Mg of bio-oil that a typical ASCENT conversion facility would demand. Thus, the preprocessing facility in this study assumes approximately a three-to-one crushing-to-biorefinery ratio. For the biorefinery to operate at 90%, an additional 25,000 Mg of bio-oil would need to be purchased in the market place.) The biorefinery assumed in this analysis is a hydroprocessed esters and fatty acids (HEFA) facility conceptualized by ASCENT and further developed in a technical economic analysis. Finally, the cost structure and plant design in English et al. [38] and Shumaker et al. [37] envisioned flexible facilities, with the potential to handle multiple oilseed crops and preserve the identity of oils and coproducts. This multi-crop flexibility could be a risk reduction mechanism in case of short supply of pennycress oilseed, which is a possibility particularly during the early stage of the life cycle of a newly adopted crop.
The discounted cash flow model to value the crushing facility, assumptions, and data are described next.

2.3. Discounted Cash Flow (DCF) Model

DCF is used to analyze profitability, risk, and breakeven pennycress prices at the plant-gate for the crushing facility. NPV is calculated by discounting the forecasted free cash flows (FCF) during the life of the project:
NPV   =   t   =   0 T FCF t ( 1   +   τ ) t   .
FCF is the incremental cash flow per year attributable to the pennycress crushing facility accruing to equity and debt holders and is computed as
FCF   =   NOPAT   +   DEP   CAPEX     Δ NOWC
where NOPAT is net operating income after taxes, computed as revenues minus cost of goods sold and operating expenses—including depreciation—minus income taxes; DEP is depreciation expenses; CAPEX is capital expenditures, defined as investments in fixed asset; and Δ NOWC is year to year change in net operating working capital, defined as the firm’s investment in net operating current assets. CAPEX ,   Δ NOWC , and depreciation methods are defined in more detail in the “Capital budgeting for the crushing facility” section. Assumed income tax rate is assumed 40% for the baseline.
τ , in Equation (1), is a nominal risk-adjusted discount rate. According to surveys, most firms in the US use the weighted average cost of capital (WACC) as a discount rate [39], which is a weighted average of the annual cost of debt and cost of equity. For this study, WACC = 12.5% is used following ASCENT’s assumptions for biorefinery feasibility studies in the US [36].
Regarding the forecast period (T, in Equation (1)), the DCF model in this study forecasts two and a half years of establishment or construction plus 10 years of productive life for the crushing facility. At the 10th year of productive life, a residual value—the book value of total assets—is added to the operating FCF of that year. Ten years of productive life is a common assumption used when valuing bioenergy facilities [17,38].
In addition to NPV, we also estimate the modified internal rate of return (MIRR), which is the rate of return that makes the NPV equals zero; providing an annual rate of return that would satisfy both debt holders and shareholders. The MIRR has been used in agricultural enterprise valuations and has been argued to be a superior metric relative to the traditional internal rate of return [40,41].

2.4. Capital Budgeting for the Crushing Facility

2.4.1. Investments

Capital expendituresTable 3 provides a breakdown of CAPEX required to establish the crushing/refining oilseed pennycress facility. Establishment CAPEX estimations in Shumaker et al. [37] were re-expressed as of 2017 USD by using IMPLAN inflators by economic sectors. About $75.45 million CAPEX is estimated to build such a facility. The model assumes that the facility is completed within two and a half years, with cash outflows spent evenly in 2017 and 2018, and operations starting in spring 2019 following field pennycress harvest. No subsequent CAPEX is forecasted other than regular maintenance expenses.
Net operating working capital investment—beginning operations, in year 3, investment in current assets is needed to build up inventories and support credit sales. Net operating working capital investment (NOWC), defined as
NOWC   =   ( DI   +   DAR DAP )   ×   COGS .
provides an estimate for the amount of firm’s net operating current assets (i.e., operating current assets minus operating current liabilities) or, equivalently, an estimate of capital invested in short-term assets. DI is days inventory, assumed to be 60 or two months; DAR is days accounts receivable, assumed one month; and DAP is days accounts payable, assumed one month. COGS is cost of goods sold per day, including depreciation. The year-to-year change in NOWC, ΔNOWC, represents the annual marginal capital investment in short-term assets.
The relevant assumption in this working capital estimation is the number of days inventories to hold in the facility. The plant will have the needed infrastructure to store pennycress oilseed mainly and pennycress oil and meal (item (a) in Table 3). The startup capital needed to hold, on average, two months of inventory is equivalent to approximately $14.0 million.
Under contract production, the crushing facility would receive up to 238,771 Mg of pennycress oilseed, the total planned annual plant processing capacity, during a relative short window of two to three months during the late spring or early summer. Table 4 provides the monthly value of inventories for a stylized typical year, assuming pennycress seed cost of 23.8 ¢ kg−1 (the breakeven cost as will be explained in the results section), three months seed buying window, and uniform production and sales. Table 4 shows that funding for working capital needs is seasonal, with funding required during the buying window (the last line in Table 4) almost doubling the yearly average working capital investment.

2.4.2. Operating Costs

Operating costs categories, in order of magnitudes, include: (1) Feedstock cost, (2) depreciation, and (3) other costs. Each category is described next.
Feedstock cost—since an established market for pennycress does not exist yet, in this study we estimate the maximum price that the crushing firm could pay for pennycress and still make the enterprise profitable.
Depreciation—depreciable assets are expended during 10 years according to a modified accelerated cost recovery system (MACRS) schedule. Depreciation rates are estimated using a double declining balance (DDB) method as prescribed by MACRS [43].
Other costs—the budget includes labor, energy, sewer and water, processing materials, water treatment, fixed costs, and other costs related to both the crushing and refinery stages of the oil extraction process. Costs in Shumaker [37] were re-expressed as of 2017 USD by using IMPLAN inflators. Table 5 provides breakdown of operating costs, other than depreciation and feedstock cost, as a percentage of total revenues in the baseline scenario.

2.4.3. Output Prices

Refined pennycress oil is the main product of the oil extraction facility, which will be sold to a SAF refinery firm. Pennycress oilseed meal is a co-product to be sold as an ingredient of a livestock feed ration.
Pennycress oil price—pennycress oil is assumed to be sold at prices equivalent to soybean oil due to its perceived similarity in quality [1]. Soybean oil (nominal) price projections by the USDA are used for the 10-year forecast period in this study [32]. Available soybean oil price projections (6 years) by FAPRI [33] is also used, as in previous biofuel studies [44], along with soybean oil future prices available for two years from the Chicago Mercantile Exchange (CME) [34]. Using these price series, a simple average is calculated and used as pennycress oil price in the model. Forecast prices by FAPRI and prices at CME are more conservative than USDA’s forecast prices because they were updated after the trade war with China started in the summer 2018. Thus, the forecast prices in this model already consider the potential negative effect of tariffs on US soybean oil prices particularly for the first years of the forecast period.
Pennycress meal price—prices of distillers’ dried grain with solubles (DDGS) are used to proxy pennycress meal prices. Pennycress meal would be part of a feed ration for livestock, providing mainly protein content of around 30% [1], which is similar to the protein content of DDGS [45].
DDGS low and high monthly prices delivered in St. Louis, MO, from 2000 to 2018, were obtained from the Agricultural Marketing Service website [35], and re-expressed as of the end of 2018 using consumer price index. The simple average of the median of low and high price series was used as the price for pennycress meal for the first year of production. Prices for subsequent years were updated according to the assumed inflation rates.

2.4.4. Inflation Rates

Forecast inflation rates vary around 2% to 2.4% during the 10-year period, according to the USDA [32].

2.5. Pennycress Supply Chain Site Location Analysis

BioFLAME—a GIS-based bioenergy facility-siting model maintained by the Department of Agricultural and Resource Economics, The University of Tennessee, Knoxville [20]—is used to determine the least-cost pennycress supply chain configuration to provide SAF to the Nashville international airport. The airport consumes about 340.69 million liters of aviation fuel annually. BioFLAME has been used to estimate the economic effects of preprocessing facilities to supply switchgrass for a potential commercial-size biorefinery in Tennessee [46] and to evaluate the impacts on regional employment of the optimal siting of biorefineries in the southeastern United States [47].
The BioFLAME GIS database includes geo-spatial data layers for crop area, crop yields including field pennycress, county-level costs of crop production budgets, crop prices, transportation costs, available industrial parks for siting crushing and biorefinery facilities, the real road network, and other geo-spatial layers. A two-step process is used within BioFLAME. The initial step locates the crushing facilities, given current land use patterns, by minimizing the cost of feedstock using the annual cost of procuring and transporting feedstock based on farm and crushing facility costs described earlier in this paper. The second step determines the location of the biorefinery based on existing infrastructure, feedstock supply potential in the region, and the location of the demand center (airport) for SAF.
To project potential supply of field pennycress, it is assumed that pennycress can grow where a corn/soybean rotation is utilized. The NASS crop data layer is used to identify locations where corn and soybeans are grown using a grid of 13 km2 hexagons. These serve as the potential supply regions and potential pennycress supply is estimated by multiplying pennycress yield times the minimum of corn or soybean hectares. No reduction in soybean yield is assumed as result of the potential delay in planting due to pennycress harvest activities.
The algorithm in BioFLAME uses GIS functions and database management operations to determine the facility locations minimizing the plant-gate cost of pennycress bio-oil. County-level budgets, crop area, and prices are used to calculate a breakeven pennycress bio-oil price above which farmers would convert from a corn–soybean rotation to a corn–pennycress–soybean rotation. Total bio-oil demand is set by the biorefinery and is based on ASCENT’s HEFA techno-economic analysis [48].
The shortest path to each potential feedstock supply unit defined as 13 km2 hexagons in the model along the real road transportation network is determined and used to generate a least-cost transportation layer. The model evaluates the costs of siting crushing and biorefinery facilities in the set of all candidate sites in a region. Crush candidate sites are defined by several criteria including that the location must occur in an industrial park with electricity, natural gas, access to major state highway or interstate, and more than 4.05 ha available for development. Transportation and farm-gate costs are minimized at a preferred site. The model is rerun assuming that the preferred crushing candidate sites are suppliers of bio-oil to the biorefinery using minimized feedstock cost plus transportation costs of SAF to the airport as the location determinant.
Model output in this study includes the cost minimizing crushing and biorefinery facility locations and pennycress feedstock-draw areas corresponding with each facility location. In addition, the costs of producing and transporting the feedstock to the crushing facility as well as the costs of transporting the bio-oil to the biorefinery and the aviation fuel to the airport are outputs from BioFLAME. The costs of transporting the coproducts (meal at the crushing facilities and diesel, gasoline, naphtha, and LPG at the biorefinery) are not incorporated into the analysis since their destination is unknown.
Biorefinery requirements are taken from the ASCENT HEFA biorefinery techno economic assessment (AHTEA) [48]. The biorefinery requires 260,706 Mg per year of bio-oil, which can be purchased on the market or produced from three crushing facilities. In this analysis, the feedstock is converted from oilseed to bio-oil through the establishment of three crushing facilities. The AHTEA assumes that bio-oil can be delivered to the biorefinery for a cost of $1.03 kg−1. The AHTEA assumes production levels of 162 million liters of jet fuel, 24.17 million liters of Naphtha, 71.46 million liters of diesel, 31.6 million liters of LPG, and 22.12 million liters of propane, and sells that production for $1.24, $1.19, $1.30, $0.54, and $0.54 per liter−1, respectively. In addition to selling the production of the biorefinery, RINs would be produced for each gallon of SAF and renewable diesel. Since the price of these RINs fluctuate, they are not incorporated into the analysis.

3. Results and Discussion

3.1. Farm-Level Pennycress Oilseed Breakeven Prices

Figure 2 illustrates the estimated minimum (breakeven profit = 0) oilseed price for farmers to produce and transport pennycress to the crushing facility. The base scenario assumes that 5.60 kg of seed ha−1 was aerial broadcast in September to establish the pennycress stand, 56.04 kg ha−1 of nitrogen fertilizer was applied to the stand in March, 1793 kg of oilseed ha−1 was harvested in May, and the harvested feedstock was transported 80.47 km one-way to the crushing facility. The estimated breakeven price was 17.7 ¢ kg−1 at the crushing-facility plant gate. Harvested oilseed yields had the largest impact on breakeven prices, ranging from 35.45 ¢ kg−1 with an oilseed yield of 897 kg ha−1 to 12.89 ¢ kg−1 with an oilseed yield of 2466 kg ha−1. Fertilizer, soybean revenue losses from delayed harvest of pennycress and planting of soybeans, and transportation of oilseed in descending order of costs had the next largest impacts on delivered cost to the crushing facility. Breakeven price was 13.52 ¢ kg−1 when no fertilizer was applied to pennycress [22] but was 22.92 ¢ kg−1 when 56.04, 22.42, and 22.42 kg ha−1 of nitrogen, phosphorous, and potassium, respectively, were applied to the crop [7]. Breakeven prices based upon feedstock transportation distance varied from 15.88 ¢ kg−1 when transported 40.23 km one-way to 21.99 ¢ kg−1 when transported 160.93 km one-way between the field and the crushing facility. The variables that had the least influence on the breakeven price were seed, herbicide, harvest, and stand establishment costs. Figure 2 also shows the crushing facility breakeven oilseed price, which is discussed next.

3.2. Crushing Facility Pennycress Oilseed Breakeven Prices

The cost of pennycress oilseed is a critical component for the establishment of a profitable crushing facility; yet, currently neither a market from which prices can be observed exists nor a similar energy cover crop—to serve as proxy for pennycress seed cost—is commercialized. Thus, unlike all other inputs in the model, no assumption for pennycress feedstock cost is made. Instead, a maximum price that a potential crushing facility can pay for feedstock at the facility gate is calculated.
The maximum pennycress oilseed buying price is 23.8 ¢ kg−1 during the first year of oil and meal production in 2019. This feedstock cost represents 65.8% of the forecast weighted average selling price of pennycress oil and pennycress meal the first year of production. This 65.8% feedstock cost to weighted average selling price ratio is kept constant through the life of the project so that annual feedstock costs are assumed to vary in tandem with forecast selling prices and inflation rates. Thus, buying pennycress seed at 23.8 ¢ kg−1 during the first year of production and buying it at prices equivalent to 65.8% of the weighted average selling price from years 3 to 12 yields an NPV equal to zero for the crushing facility.
Figure 3 illustrates this estimated maximum (breakeven) buying price and the one-way sensitivity analysis showing lower and upper bound maximum buying prices the first year of production according to assumptions in Table 2. As expected, variation in both oil and meal output prices have a relevant impact on the maximum price the crushing facility can pay farmers and achieve its target profitability rate. As an example, if oil prices forecasted by the USDA (i.e., baseline) were decreased by 5% every year (i.e., lower bound) the maximum buying price for the crushing facility to breakeven also decreases, from 23.8 to 22.8 ¢ kg−1 (Figure 3). In contrast, if forecasted oil prices were to increase rather than decrease by 5% every year, the crushing facility would be able to pay farmers up to 25.0 ¢ kg−1. Similarly, if debt holders and equity holders require 15% WACC (i.e., lower bound, given WACC is a cost), the crushing facility would be willing to pay farmers up to 22.7 ¢ kg−1 for field pennycress. The crushing facility enterprise is most sensitive to pennycress meal price, the weighted average cost of capital, and pennycress oil price and less sensitive to pennycress seed to oil conversion rate, income tax rate, and days inventory.
Breakeven oilseed prices for the farm level and crushing facility base scenarios indicate a potential profit margin of 6.1 ¢ kg−1 above the 17.7 ¢ kg−1 cost for producers to grow and deliver pennycress oilseed to the crushing facility plant gate. However, the estimated profit margin was sensitive to uncertain oilseed yields. At a 23.8 ¢ kg−1 bid price, pennycress production incurs a negative profit for pennycress producers if oilseed yields were less than 1335 kg ha−1 given base production costs (Figure 2). The estimated profit margin was also substantially impacted by changes in production costs. For example, the profit margin for a pennycress producer was negligible (0.2 ¢ kg−1) if phosphorus and potassium fertilizers were also required in addition to nitrogen to achieve the expected 1793 kg ha−1 oilseed yield (Table 1; Figure 2). Nevertheless, base scenario results do indicate that oil and meal from pennycress oilseed that is priced similar to soybean oil and DDGS have the potential to provide positive profits to both pennycress producers and oilseed crushers in a potential SAF supply chain.
Table 6 provides forecasted free cash flows per year using the baseline maximum (breakeven) buying price, 23.8 ¢ kg−1. Pennycress oil revenues and pennycress meal revenues represented 66% and 34% of total revenues respectively (i.e., simple average over the ten productive years forecast). Operating margin, defined as operating income divided by revenues, is also shown in Table 6, averaging 14.3% over the forecast period. With the exception of the first three years of productive life, operating margins for the crushing facility are above 14%, with the first years distinctively low due to lower forecast prices and higher depreciation expenses under the MACRS method of depreciation.

3.3. Pennycress Supply Chain Site Location Analysis

The two-step process was conducted assuming that both biorefineries and crushing facilities are located in Tennessee, but feedstock can come from other states surrounding Tennessee.
The ASCENT HEFA biorefinery required 260,706 Mg per year of bio-oil to produce 162 million liters of SAF, 71.46 million liters of diesel, 24.17 million liters of naphtha, 31.6 million liters of LPG, and 22.12 million liters of propane [48]. The minimum feedstock cost location for the biorefinery given the hypothetical locations of the crushing facilities was in an industrial park about 24.14 km from the Nashville international airport aviation fuel storage farm (Figure 4). The feedstock draw area encompassed 396,932 ha of pennycress in middle and western Tennessee, western Kentucky, the boot heal of Missouri, and northern Mississippi. Each crushing facility required 238,771 Mg of pennycress seed supplying 78,541 Mg of bio-oil annually. The three oilseed crushing facilities were located nearest the greatest concentrations of potential pennycress production in western Tennessee and western Kentucky. The average one-way travel distance for moving oilseed from the field to the three crushing facilities was 70.8 km but varied from 35.4 km on average to 101.4 km on average depending on the location of the crushing facility. The crushing facilities located at Union City, Huntington, and Clarksville, TN are between 64.4 and 236.6 km from the biorefinery.
Since there is a gap between the delivered farm to crushing facility breakeven price (17.7 ¢ kg−1) and the price the crushing facility might pay assuming a MIRR of 12.5% (23.8 ¢ kg−1), the cost estimate for the supply chain uses both of these price points. Assuming minimum feedstock cost and no land use change criteria, BioFLAME estimated that Tennessee could support up to five 90,718 Mg (100,000 ton) year−1 crushing facilities (Figure 5). Assuming that these potential sites are the locations that the biorefinery is selecting from, Union City, Huntington, and Clarksville are selected in the final analysis to supply bio-oil to the biorefinery. The cost of growing and harvesting pennycress is estimated to range from 55% to 66% of the cost of the final product; $119.4 to $186.4 million dollars depending on the price of the pennycress bio-oil. The cost of transporting oilseed to the crushing facility is estimated at $7.9 million, the bio-oil to the refinery is estimated at $8.6 million. Adding to these costs, the cost of crushing ($80.3 million) gives $216.2 to $283.2 million depending on pennycress feedstock cost (Table 7). This results in a per unit cost per kg of pennycress oil at the biorefinery gate between 83 to 109 ¢ for the initial feedstock prices of 17.7 to 23.8 ¢ kg−1, respectively.

4. Conclusions

Based on the estimates presented in the paper, it appears that there are areas of profitability for players in a prospective pennycress supply chain to supply SAF to the Nashville International Airport in Tennessee. Breakeven cost (profit = 0) estimate of growing, harvesting, and transporting pennycress seed to a crushing facility is equal to 17.7 ¢ kg−1. A crushing facility can pay up to 23.8 ¢ kg−1 for pennycress seed during the first year of production and provide investors 12.5% annual rate of return. The crushing facility could use the up to 6.1 ¢ kg−1 profit margin to induce pennycress producers to supply oilseed for processing into bio-oil and SAF. This base scenario result indicates that oil and meal from pennycress oilseed that are priced similar to soybean oil and DDGS have the potential to provide positive profits to both pennycress producers and oilseed crushers in a potential SAF supply chain. However, the estimated profit margin was sensitive mainly to uncertain oilseed yields, changes in field production costs, and pennycress meal and oil prices.
The total cost of the feedstock over the supply chain at the biorefinery gate, including crushing and transportation to biorefinery, is estimated between 83 cents kg−1 and 109 ¢ kg−1 if pennycress oilseed is purchased at 17.7 and 23.8 ¢ kg−1, respectively. The upper bound of this cost is only slightly above ASCENT’s HEFA technoeconomic analysis estimated cost at 103 ¢ kg−1. In order to breakeven (NPV = 0 for the crushing facility), assuming the crushing facility is the only entity in the supply chain adjusting its profit structure, the crushing facility will need one or a combination of the following actions: Produce more bio-oil by increasing its daily operating capacity, reduce the overall oilseed cost, or more specifically, pay farmers a price below 23.8 ¢ kg−1.
BioFLAME output suggests that three crushing facilities are located in Union City, Huntington, and Clarksville, TN, to supply bio-oil to the biorefinery, with the biorefinery sited in an industrial park about 24.14 km from the Nashville international airport aviation fuel storage. Overall, results in this paper suggests profitability opportunities but also uncertainties. The pennycress yield assumption needs future investigation. Analysis of planting pennycress best management practices and their impacts on yield is needed to reduce producer resistance and risk.

Author Contributions

Conceptualization, C.O.T.-P., J.A.L., B.C.E. and T.E.Y.; methodology, C.O.T.-P., J.A.L., B.C.E. and T.E.Y.; software, C.O.T.-P., J.A.L. and B.C.E.; validation, C.O.T.-P., J.A.L. and B.C.E.; formal analysis, C.O.T.-P., J.A.L. and B.C.E.; writing—original draft preparation, C.O.T.-P. and J.A.L.; writing—review and editing, C.O.T.-P., J.A.L. and B.C.E.; funding acquisition, B.C.E., J.A.L., T.E.Y. and C.O.T.-P.

Funding

This work was funded in part by the US Federal Aviation Administration (FAA) Office of Environment and Energy as a part of ASCENT Project 1 under FAA Award Number: 13-C-AJFEUTENN-Amd 5. Funding also was partially supported by the USDA National Institute of Food and Agriculture, Hatch Multi-State project 1012420. Any opinions, findings, and conclusions or recommendations expressed in this material are those of the authors and do not necessarily reflect the views of the FAA or other ASCENT sponsor organizations.

Acknowledgments

The authors acknowledge the help of Robert Jamey Menard (University of Tennessee) and Brad Wilson (University of Tennessee). The authors also acknowledge the comments to a draft of this manuscript by Nathan Brown (Alternative Jets Fuel Project Manager, Federal Aviation Administration, Washington, D.C.) and Kristin C. Lewis (Energy Analysis and Sustainability Division, Volpe National Transportation Systems Center, Cambridge, MA, USA), that helped to improve this article.

Conflicts of Interest

The authors declare no conflict of interest.

References

  1. Fan, J.; Shonnard, D.R.; Kalnes, T.N.; Johnsen, P.B. A life cycle assessment of pennycress (Thlaspi arvense L.)-derived jet fuel and diesel. Biomass Bioenergy 2013, 55, 87–100. [Google Scholar] [CrossRef]
  2. Mupondwa, E.; Li, X.; Tabil, L.; Falk, K.; Gugel, R. Technoeconomic analysis of camelina oil extraction as feedstock for biojet fuel in the Canadian Prairies. Biomass Bioenergy 2016, 95, 221–234. [Google Scholar] [CrossRef]
  3. What is Carbon Offsetting and Reduction Scheme for International Aviation? Available online: https://www.iata.org/about/worldwide/asia_pacific/Pages/What-is-CORSIA.aspx (accessed on 16 January 2019).
  4. Lewis, K.C.; Newes, E.K.; Peterson, S.O.; Peralson, M.N.; Lawless, E.A.; Brandt, K.; Camenzind, D.; Wolcott, M.P.; English, B.C.; Latta, G.S.; et al. US alternative jet fuel deployment scenario analyses identifying key drivers and geospatial patterns for the first billion gallons. Biofuels Prod. Biorefining 2018. [Google Scholar] [CrossRef]
  5. California Energy Commission. Driving to Cleaner Transportation: AltAir Fuels Biofuel Production Facility. Available online: https://www.energy.ca.gov/transportation/tour_additional/altair/index.html (accessed on 14 January 2019).
  6. Gevo, Inc. 10Q for the Quarterly Period Ended September 30, 2018; Quarterly Report for Securities and Exchange Commission: New York, NY, USA, September 2018. [Google Scholar]
  7. Agricultural Marketing Service USDA. Pennycress. October 2018. Available online: https://www.agmrc.org/commodities-products/grains-oilseeds/pennycress (accessed on 2 February 2019).
  8. Markel, E.; English, B.C.; Hellwinckel, C.; Menard, R.J. Potential for Pennycress to Support a Renewable Jet Fuel Industry. Ecol. Pollut. Environ. Sci. 2018, 1, 95–102. [Google Scholar]
  9. Archer, D.W. Oilseeds for use in biodiesel and drop-in renewable jet fuel. In U.S. Department of Energy. 2016 Billion-Ton Report: Advancing Domestic Resources for a Thriving Bioeconomy; Oak Ridge National Laboratory: Oak Ridge, TN, USA, 2016. [Google Scholar]
  10. Miller, P.; Sultana, A.; Kumar, A. Optimum scale of feedstock processing for renewable diesel production. Biofuels Prod. Biorefining 2012, 6, 188–204. [Google Scholar] [CrossRef]
  11. Alhotan, R.A.; Wang, R.L.; Holser, R.A.; Pesti, G.M. Nutritive value and the maximum inclusion level of pennycress meal for broiler chickens. Poult. Sci. 2017, 96, 2281–2293. [Google Scholar] [CrossRef] [PubMed]
  12. Moser, B.R.; Knothe, G.; Vaughn, S.F.; Isbell, T.A. Production and Evaluation of Biodiesel from Field Pennycress (Thlaspi arvense L.) oil. Energy Fuels 2009, 23, 4149–4155. [Google Scholar] [CrossRef]
  13. Reifschneider, L.; Tisserat, B.; O’kuru, H.R. Mechanical properties of high density polyethylene—Pennycress press cake composites. In Proceedings of the 71st Annual Technical Conference of the Society of Plastics Engineers, Cincinnati, OH, USA, 22–24 April 2013; pp. 679–683. [Google Scholar]
  14. Tisserat, B.; Eller, F.; Harry-O’kuru, R. Various Extraction Methods Influence the Adhesive Properties of Dried Distiller’s Grains and Solubles, and Press Cakes of Pennycress (Thlaspi arvense L.) and Lesquerella [Lesquerella fendleri (A. Gary) S. Watson], in the Fabrication of Lignocellulosic Composites. Fibers 2018, 6, 1–16. [Google Scholar]
  15. Tao, L.; Milbrandt, A.; Zhang, Y.; Wang, W.-C. Techno-economic and resource analysis of hydroprocessed renewable jet fuel. Biotechnol. Biofuels 2017, 10, 261. [Google Scholar] [CrossRef] [PubMed]
  16. Rincón, L.E.; Jaramillo, J.J.; Cardona, C.A. Comparison of feedstocks and technologies for biodiesel production: An environmental and techno-economic evaluation. Renew. Energy 2014, 69, 479–487. [Google Scholar] [CrossRef]
  17. Yeboah, A.K.; Naanwaab, C.B.; Yeboah, O.-A.; Owens, J.P.; Bynum, J.S. Economic Feasibility of Sustainable High Oilseed-Based Biofuel Production: The Case for Biodiesel in North Carolina. Int. Food Agribus. Manag. Rev. 2013, 16, 41–66. [Google Scholar]
  18. Carriquiry, M.A.; Du, X.; Timilsina, G.R. Production Costs of Biofuels. In The Impacts of Biofuels on the Economy, Environment, and Poverty. A Global Perspective; Springer: New York, NY, USA, 2014; pp. 33–46. [Google Scholar]
  19. Clemen, R.T.; Reilly, T. Making hard decisions with DecisionTools, 2nd ed.; Cengage Learning: Boston, MA, USA, 2001. [Google Scholar]
  20. Wilson, B. Modeling Cellulosic Ethanol Plant Location Using GIS. Master’s Thesis, University of Tennessee, Knoxville, TN, USA, August 2009. [Google Scholar]
  21. US Soybean Export Council. How the Global Oilseed and Grain Trade Works; Technical Report for US Soybean Export Council: Chesterfield, MO, USA, October 2015. [Google Scholar]
  22. Metro Ag Energy. Planting Pennycress as a Cover Crop Benefits Farmers. Available online: https://www.metroagenergy.com/farmers-planting-field-pennycress (accessed on 9 January 2019).
  23. Zanetti, F.; Isbell, T.A.; Alexopoulou, E.; Evangelista, R.; Gesch, R.W.; Moser, B.; Monti, A. Pennycress (Thlaspi arvense L.) A New Non-Food Crop for Oil-Based Biofuel Production in Europe and USA. In Proceedings of the 26th European Biomass Conference and Exhibition, Copenhagen, Denmark, 14–18 May 2018. [Google Scholar]
  24. Fertilizer Use and Price. Available online: https://www.ers.usda.gov/data-products/fertilizer-use-and-price.aspx (accessed on 6 June 2019).
  25. U.S. Bureau of Economic Analysis. Gross Domestic Product: Implicit Price Deflator. Available online: https://fred.stlouisfed.org/series/GDPDEF (accessed on 6 June 2019).
  26. Bishop, L. Field Pennycress Management in Upstate Missouri. Master’s Thesis, University of Missouri, Columbia, MO, USA, December 2017. [Google Scholar]
  27. University of Tennessee Extension. Field Crop Budgets, 2019; Technical Report for University of Tennessee Extension: Knoxville, TN, USA, January 2019. [Google Scholar]
  28. Turhollow, A.; Epplin, F. Estimating Region Specific Costs to Produce and Deliver Switchgrass. In Switchgrass; Springer: London, UK, 2012; pp. 187–203. [Google Scholar]
  29. Boyer, C.N.; Stefanini, M.; Larson, J.A.; Smith, S.A.; Mengistu, A.; Bellaloui, N. Profitability and Risk Analysis of Soybean Planting Date by Maturity Group. Agron. J. 2015. [Google Scholar] [CrossRef]
  30. FAPRI. Available online: https://www.fapri.missouri.edu/publications/excel-tables/ (accessed on 1 June 2019).
  31. Altendorf, K.; Isbell, T.; Wyse, D.L.; Anderson, J.A. Significant variation for seed oil content, fatty acid profile, and seed weight in natural populations of field pennycress (Thlaspi arvense L.). Ind. Crops Prod. 2019, 129, 261–268. [Google Scholar] [CrossRef]
  32. USDA. USDA Agricultural Projections to 2027; Long-Term Projections Report for the Interagency Agricultural Projections Committee: Washington, DC, USA, February 2018. [Google Scholar]
  33. FAPRI. Baseline Update for U.S. Agricultural Markets; Technical Report for Food and Agricultural Policy Research Institute (FAPRI): Columbia, MO, USA, August 2018. [Google Scholar]
  34. Future Soybean Oil Contracts. Available online: https://www.cmegroup.com/trading/agricultural/grain-and-oilseed/soybean-oil.html (accessed on 6 January 2019).
  35. AMS USDA. Feedstuff Corn Distillers Dried Grain Prices. Available online: https://www.marketnews.usda.gov/mnp/ls-report-config?category=Feedstuff (accessed on 2 January 2019).
  36. Tyner, W.; Brandt, K. Techno-Economic Analysis in ASCENT Projects; Annual Report for the Aviation Sustainability Center: Pullman, WA, USA, April 2019. [Google Scholar]
  37. Shumaker, G.A.; McKissick, J.C.; Woodruf, J.; Doherty, B.A. Georgia oilseed initiative: Report on the feasibility of an oilseed processing facility in Georgia. Cent. Agribus. Econ. Dev. 2000, 10, 20. [Google Scholar]
  38. English, B.; Jensen, K.; Menard, J. Economic Feasibility of Producing Biodiesel in Tennessee; Technical Report for Agri-Industry Modeling & Analysis Group; Department of Agricultural Economics, The University of Tennessee: Knoxville, TN, USA, 2002. [Google Scholar]
  39. Graham, J.R.; Campbell, H. The theory and practice of corporate finance: Evidence from the field. J. Financ. Econ. 2001, 60, 187–243. [Google Scholar] [CrossRef]
  40. Kierulff, H. MIRR: A Better Measure. Bus. Horiz. 2008, 51, 321–329. [Google Scholar] [CrossRef]
  41. Trejo-Pech, C.J.O.; Spreen, T.H.; Zansler, M.L. Is Growing Oranges in Florida a Good Investment? Am. J. Agric. Econ. 2018, 2, 625–639. [Google Scholar] [CrossRef]
  42. Peters, M.S.; Timmerhaus, K.D.; West, R.E. Plant. In Design and Economics for Chemical Engineers, 5th ed; McGraw-Hill: New York, NY, USA, 2003. [Google Scholar]
  43. Brigham, E.; Houston, J. Fundamentals of Financial Management, 9th ed.; Cengage Learning: Boston, MA, USA, 2017. [Google Scholar]
  44. Wang, M.Q. Greenhouse Gases, Regulated Emissions, and Energy Use in Transportation (GREET)—Transportation Fuel-Cycle Model. Volume 1: Methodology, Development, Use, and Results; Technical Report for Center for Transportation Research, Energy Systems Division, Argonne National Laboratory: Lemont, IL, USA, August 1999. [Google Scholar]
  45. Heuzé, V.; Tran, G.; Sauvant, D.; Noblet, J.; Renaudeau, D.; Bastianelli, D.; Lessire, M.; Lebas, F. Corn Distillers Grain. Available online: http://www.feedipedia.org/node/71 (accessed on 2 January 2019).
  46. Yu, T.; Larson, J.A.; English, B.C.; Gao, Y. Evaluating the optimal logistics system of biomass feedstocks for a biorefinery with alternative harvest, storage and preprocessing options: A case study of East Tennessee. Am. Soc. Agric. Biol. Eng. 2011, 5, 3733–3740. [Google Scholar]
  47. Lambert, D.M.; Wilson, B.; Menard, R.J.; Jensen, K.L.; English, B.C. Optimal Location of Cellulosic Biofuel Facilities and their Impact on Employment in the Southeast Region. In Proceedings of the Joint Annual Meeting of the Association for the Advancement of Industrial Crops and the USDA National Institute of Food and Agriculture, Washington, DC, USA, 12–16 October 2013. [Google Scholar]
  48. Tanzil, A.; Brandt, K.; Zhang, X.; Wolcott, M.; Garcia-Perez, M. A Review of Alternative Jet Fuel Technologies: Comparison of Technoeconomic and Environmental Performance with Standardized Criteria. Unpublished work. 2019. [Google Scholar]
Figure 1. Major enterprises in pennycress sustainable aviation fuels (SAF) production.
Energies 12 03055 g001
Figure 2. Breakeven and one-way sensitivity analysis of minimum pennycress prices (profit = 0) for farmers to produce and transport oilseed feedstock from the field to the crushing facility. Notes: Input assumptions for the base, lower bound, and upper bound scenarios are presented in Table 1.
Energies 12 03055 g002
Figure 3. Breakeven and one-way sensitivity analysis of maximum pennycress purchase prices for the crushing facility to obtain NPV = 0. Notes: Input assumptions for the base, lower bound, and upper bound scenarios are presented in Table 2.
Energies 12 03055 g003
Figure 4. Field pennycress supply, oilseed crushing facility, and biorefinery locations for a sustainable jet fuel supply chain to serve the Nashville, Tennessee USA international airport.
Energies 12 03055 g004
Figure 5. Location of potential crushing facilities in Tennessee estimated by BioFLAME assuming minimum feedstock cost and a maximum one-way driving distance of 112.65 km.
Energies 12 03055 g005
Table 1. Data and assumptions for the breakeven and one-way sensitivity analysis of pennycress oilseed farm-level costs of production and transportation costs from the field to the crushing facility.
ItemBaseLower BoundUpper Bound
Seed ($ ha−1) a30.8912.3661.78
Establishment ($ ha−1) b24.7124.7154.48
Fertilizer ($ ha−1) c96.940.00164.15
Herbicide ($ ha−1) d0.00−48.510.00
Harvest ($ ha−1) e116.8761.78116.87
Transportation ($ ha−1) f44.3811.29120.99
Oilseed yield (kg ha−1) g1793.00897.002466.00
Soybean revenue loss ($ ha−1) h0.000.00102.60
a Base seeding rate is 5.60 kg ha−1 [8]. Lower bound seeding rate is 2.24 kg ha−1 [23]. Upper bound seeding rate is 11.21 kg ha−1 [7,23]. A projected seed price of $5.51 kg−1 is used to calculate seed costs [7]. b Pennycress is assumed to be established in September. Base is aerial seeding pennycress into the corn stand before harvest using the aerial application cost reported by Markel et al. [8]. Upper bound is author budgeted costs for seed planted after corn harvest in September using a tractor pulling a 6.10 m no-tillage drill. c Base is 56.04 kg of nitrogen (N) ha−1 applied in March. Lower bound is no additional fertilizer is applied [22]. Upper bound is 56.04 kg of N ha−1 applied in March and an additional 22.42 kg ha−1 each of phosphorous (P) and potassium (K) are applied with the corn crop to account for added off-take of nutrients with pennycress production. Equipment and labor costs for application of urea-ammonium nitrate (UAN) in March was budgeted by the authors. Fertilizer prices were $1.41 kg−1 N as UAN, $1.72 kg−1 P, and $1.28 kg−1 K. Fertilizer costs were calculated using average fertilizer prices for 2008–2016 [24] expressed in 2019 dollars using the Implicit GDP Price Deflator [25]. d Base is a burn-down herbicide and desiccant applied before harvest to provide a residual herbicide in the subsequent soybean crop, prevent shattering of the oilseed during harvest, and facilitate drying of oilseed and plant material to provide timely harvest of pennycress and planting of soybeans [22,26]. A burn-down application is a common practice in no-tillage and therefore no additional herbicide cost is allocated to the pennycress enterprise. Lower bound is the cost savings of eliminating a burn-down herbicide application before planting no-tillage soybeans with the addition of pennycress in a no-tillage corn-soybean rotation. Materials cost savings are from a University of Tennessee Extension no-tillage soybean budget [27]. Chemical applicator cost savings were budgeted by the authors. e Pennycress is assumed to be harvested in May. The base is author budgeted costs for a combine with a 9.14 m cutter grain head, tractor, and grain cart assumed by Markel et al. [8]. Lower bound cost is combine harvest from a budget produced by Metro Ag Energy [22]. f Base distance is 160.93 km round trip from farm to the crushing facility [1]. Lower bound distance is 80.47 km round trip from farm to crushing facility. Upper bound distance is 321.87 km round trip from farm to crushing facility. Average semi-truck and trailer speed is 56 km h−1 [28]. Author budgeted cost for the semi-truck, trailer (18,144 kg load−1), and driver is $154.42 hour−1. g Base pennycress oilseed yield is from Markel et al. (2018). Lower and upper bound values are from an author review of literature of the range of pennycress oilseed yields. h Base and lower bound assumes no soybean revenue loss due to delayed soybean planting because of pennycress harvest. Upper bound assumes a 28-day soybean planting delay from mid-May to Mid-June with an expected yield reduction of 8 percent or 269 kg ha−1 [29]. The yield loss is treated as an opportunity cost to the pennycress enterprise and is valued using a soybean price of $0.3814 kg−1, the average for 2002/03–2016/17 with the high and low values dropped and expressed in 2019 dollars using the Implicit GDP Price Deflator [25,30].
Table 2. Data and assumptions for the breakeven and one-way sensitivity analysis of maximum pennycress purchase prices for the crushing facility to obtain net present value (NPV) = 0.
ItemBaseLower BoundUpper Bound
Seed to oil conversion rate (%) a32.931.534.0
Pennycress oil price (% deviation relative to baseline) b0.0−5.05.0
Pennycress meal price (% deviation relative to baseline) c0.0−5.05.0
Income tax rate (%) d40.040.016.9
Days inventory (days) e609030
WACC (%) f12.515.010.0
a Seed to oil conversion rate: Base is the average of five conversion rates reported in the literature. Lower bound is the minimum value of the five rates [31]. Upper bound is the maximum rate [1]. b Pennycress oil price: Base assumes zero deviation from the forecast prices in the baseline model [32,33,34]. Lower bound is author budgeted assuming negative 5% deviation from the forecast prices in the baseline model. Upper bound is author budgeted assuming positive 5% deviation from the forecast prices in the baseline model. c Pennycress meal price: Base assumes zero deviation from the forecast prices in the baseline model [35]. Lower bound is author budgeted assuming negative 5% deviation from the forecast prices in the baseline model. Upper bound is author budgeted assuming positive 5% deviation from the forecast prices in the baseline model. d Income tax rate: Base is author budgeted based on financial income tax rate paid by publicly traded firms across different industries in the US. This value is also used for the upper bound scenario. Lower bound is an assumption based on the Aviation Sustainability Center’s (ASCENT) assumptions for techno-economic analysis [36]. e Days inventory: Base, lower, and upper bound are author budgeted. f Weighted average cost of capital (WACC): Bound values based on ASCENT guidelines [36].
Table 3. Capital expenditures (CAPEX) for a pennycress crushing/refining facility.
Investment Item2017 $
(a) Receiving, storage, conditioning and load-out22.472
(b) Crushing plant24.335
(c) Refinery17.739
(d) Plant infrastructure4.833
(f) Engineering/construction management4.956
(g) Land1.115
Grand total CAPEX75.451
Notes: Figures expressed in USD millions as of the end of 2017. Estimations as of 2000 of capital investment other than land in [37] were re-expressed by authors as of 2017 USD by using IMPLAN inflators. Since estimations in Shumaker et al. [37] are broken down by type of investment (e.g., investments for crushing plant includes preparation equipment, preparation conveying, installation, etc.) we were able to re-express figures using inflators by economic sectors. In particular, the following economic sector inflators were used (codes in parentheses): Construction of new manufacturing structures (53); metal tank (heavy gauge) manufacturing (244); conveyor and conveying equipment manufacturing (291); air conditioning, refrigeration, and warm air heating equipment manufacturing (277); power boiler and heat exchanger manufacturing (243); and architectural, engineering, and related services (499). The value of land is 1.5% of total capital investments, following Peters et al. [42].
Table 4. Inventory projections during a typical year for the crushing facility in USD millions.
Item\MonthMayJuneJulyAugSeptOctNovDecJanFebMarApr
Feedstock received19.0219.0219.02
Production and sales3.173.173.173.173.173.173.173.173.173.173.173.17
Inv. (working capital)15.8531.6928.5225.3522.1919.0215.8512.689.516.343.170.00
Notes: Feedstock cost is projected according to a plant total annual capacity of 238,771 Mg, and a cost of 23.8 ¢ kg−1. Inv. stands for inventory.
Table 5. Summary of operating costs other than depreciation and feedstock cost for the first year of production, in million dollars and as a percentage of total revenues.
Expense Item$ Crushing% of Revenues$ Refining% of Revenues
Manpower0.9141.070.6630.78
Energy2.3802.790.5450.64
Sewer and water0.0650.080.0380.04
Process materials0.1500.181.3811.62
Water treatment0.0450.050.0250.03
Other: professional, communication, other0.0530.060.0510.06
Fixed costs, various0.5340.630.1850.22
Total crushing4.1404.852.8883.38
Notes: Estimations in [37] were re-expressed by authors as of 2017 USD by using IMPLAN inflators as explained in the footnote of Table 3.
Table 6. Forecast free cash flows and selected financial metrics yielding NPV = 0 and modified internal rate of return (MIRR) = 12.5% with feedstock buying price = 23.8 ¢ kg−1.
Item/Year123456789101112
Revenues 85.3388.6690.8592.2093.0494.0699.91101.57103.08104.95
Feedstock cost 57.0559.2860.7461.6462.2062.8866.7967.9068.9170.16
Depreciation 14.8711.899.517.616.094.874.874.874.874.87
Other costs 9.489.649.799.9310.0710.2410.5510.7510.9511.17
Operating income 3.947.8510.8113.0214.6816.0617.7018.0518.3418.75
Operating margin 4.6%8.9%11.9%14.1%15.8%17.1%17.7%17.8%17.8%17.9%
NOPAT 2.364.716.497.818.819.6410.6210.8311.0111.25
CAPEX37.7337.730.000.000.000.000.000.000.000.000.000.00
ΔNOWC 14.39−0.11−0.14−0.16−0.15−0.070.750.240.220.26
Residual value 16.35
FCF−37.73−37.732.8416.7116.1415.5815.0414.5714.7415.4615.6632.21
Investment37.7375.4574.9762.9753.3145.5539.3134.3730.2525.6120.9616.35
Notes: Figures in USD millions, except percentages. NPV is net present value; MIRR is modified internal rate of return; Operating margin is operating income divided by revenues; NOPAT is net operating profits after taxes; CAPEX is capital expenditures; ΔNOWC is year-to-year change in net operating working capital; FCF is free cash flow defined in Equation (2), Investment is operating working capital plus the book value of fixed assets (including both depreciable assets and land); and residual value is book value of investment the last year.
Table 7. Estimated supply chain costs from field to biorefinery.
Supply Chain ActivitiesIf Pennycress Price = 17.7 ¢ kg−1If Pennycress Price = 23.8 ¢ kg−1
Growing and harvesting ($)119,352,050186,372,983
Transport to crushing ($)7,894,4217,894,421
Crushing ($)80,322,25780,322,257
Transport to biorefinery ($)8,594,0108,594,010
Total cost ($)216,162,738283,183,671
Volume delivered to biorefinery (Mg/year)260,706260,706
Delivered cost (¢ kg−1)83109
Difference between our calculation and ASCENT HEFA TEA of 103 ¢ kg−120−6

