Abstract
Fuelled by energy security problems and urban air pollution challenges, several countries worldwide have set the objective to gradually eliminate petrol and diesel cars. The increasing support from government and demands for environmental friendly means of transportation are accelerating the use of battery electric vehicles. However, it is indispensable to have accurate and complete information about their behaviour in different traffic situations and road conditions. For the experimental analysis carried out in this study, three different electric vehicles from the Edinburgh College leasing program were equipped and tracked to obtain over 50 GPS and energy consumption data for short distance journeys in the Edinburgh area and long-range tests between Edinburgh and Bristol (UK). The results showed that the vehicles’ energy intensities were significantly affected by the driving cycle pattern, with a noticeable diminution due to low temperatures. It was found that the real available range of the electric vehicle in some situations could be 17% lower than the predicted mileage shown in the dashboard of the vehicle. The difference from the New European Driving Cycle (NEDC) values was even higher. The study has also provided a discussion on the effect of the electricity mix on carbon emission reduction.
1. Introduction
Sustainable development is believed to be the solution to excessive dependence on fossil fuels, which is responsible for climate change with hazardous environmental impacts, and the potential dearth of these resources. The transportation sector, which can be categorised into subsectors including road, aviation, railway, waterways and international marine transportation, is heavily dependent on fossil fuels. The World Oil Outlook 2017 claimed that in the year 2017, this sector accounted for the 54.6% of world oil consumption [1]. According to this report, by 2040, the transport sector will consume 64.9% of the world’s oil consumption, expecting an increase of 10.3% from 2017–2040.
To improve this situation, actions should focus on a modal shift to more sustainable means of transport, and on the use of more efficient and less polluting transportation through awareness raising and training.
Passenger flow forecasting is the basis for improving transport services, providing early warning for sporadic urban traffic events and making cities smarter and safer. Related to this, Liu and Chen [2] proposed a new passenger flow prediction model that uses deep learning methods to predict passenger flow per hour for Xiamen’s BRT (Bus Rapid Transit) stations. Their article offered a review of passenger flow prediction models that have been developed by other authors.
Global port activity and cargo-handling operations increased rapidly in 2017, after two years of mediocre performance. According to the United Nations Conference on Trade and Development (UNCTAD), the world’s container ports handled about 752.2 million- twenty-foot-equivalent-unit (TEUs) in 2017. Such a significant increase in international container trade volumes has required the marine container terminal (MCT) operators to improve terminal productivity and efficiency to meet the growing demand [3]. Dulebenets [4] proposed in 2017 a memetic algorithm with a deterministic parameter control to facilitate the programming of moorings in the MCTs, and to minimise the total cost of the ship’s service. In 2018, a multi-objective mathematical model and a solution algorithm were developed that can facilitate the design of profitable vessel schedules and assist liner shipping companies with the analysis of important trade-offs between conflicting objectives.
Regarding the international maritime sector’s commitment to reducing greenhouse gas emissions, the International Maritime Organisation (IMO) adopted an initial strategy to reduce annual greenhouse gas emissions from ships by at least 50% by 2050 compared to 2008 levels. For air pollution, the global limit of 0.5% for the sulphur content of fuel oil used on board ships will take effect on 1 January 2020. In order to ensure uniform application of the global sulphur limit, it is important that ship owners consider and adopt various strategies, such as the installation of flue gas scrubbers and the transition to liquefied natural gas and other low sulphur fuels [5].
In the case of air transport, during the last decade, CO2 emissions in this industry have increased by more than 6%, with the most important source of these emissions being the fuel consumed by aircraft. Several methods have been proposed to reduce CO2 emissions in the airline industry. Cruise control is one of the newest tools offered for this purpose, allowing aircraft speed to be adjusted [6]. Jalalian, Gholami, and Ramezanian [7] developed a non-linear multi-target mixed integer scheduling model to integrate flight scheduling, aircraft trajectory assignment and gateway assignment, with the goal of reducing CO2 emissions and increasing the level of passenger service. These authors provided a review of previous research related to reducing fuel consumption and CO2 emissions.
In the case of rail transport, interruptions disrupt passenger transport on a daily basis. An interruption disables the timetable, the circulation of rolling stock and the crew’s timetable. Wagenaar, Kroon, and Fragkos [8], presented the concept of dead-heading travel and adjusted passenger demand in the rolling stock rescheduling problem (RSRP). The results showed that dead-heading trips is useful in reducing the number of cancelled trips.
On the other hand, the development of rail transport would help drastically reduce environmental pollution, requiring less energy consumption and less dependence on oil, thus reducing greenhouse gas emissions and reducing the use of cars and trucks. While 8% of world transport is done by rail, the volume of GHG that it generates is 3.6%.
Statistics demonstrate that the highest share of oil in the world is consumed by the road sector. According to the International Energy Agency (IEA), by 2030, oil will represent around 43% of all energy used in road transportation [9]. Consequently, road traffic greatly contributes to greenhouse gases (GHG) emissions, various health-damaging pollutants, such as nitrogen dioxide, toxicity to humans, acidification and noise nuisance [10].
It is predicted that global car sales will more than double by 2050 [11]. The annual energy demand in the European Environment Agency (EEA) member countries grew by 38% between 1990 and 2007. The energy consumption decreased 3% between 2007 and 2016. However, there was a net growth of 34% between 1990 and 2016 [12]. Energy consumption in the transportation sector has increased among all countries that are not part of the Organisation for Economic Co-operation and Development (OECD), where 80% of the global population lives. In these regions, the standard of living, and therefore the purchasing power for personal transport, rises together with the economic growth. In consequence, an average annual increase rate of 2.5% is expected in the energy consumption of the transport sector by 2040 [13].
The energetic, environmental and economic impact concerns caused by increasing global transport make it essential to work towards a more sustainable transportation system. A possible solution adopted by many national governments is the introduction of battery electric vehicles (BEV) [14]. These vehicles, powered by renewably-generated electricity stored in batteries are a low carbon alternative to internal combustion engine vehicles (ICEVs) [15]. Even though the emissions from manufacturing BEVs are still greater, they can significantly reduce emissions per kilometre travelled as compared with conventional vehicles [11]. Therefore, they could have a significant impact in the reduction of urban air contamination and in transportation energy security [16].
The mileage range for most electric vehicles is around 96–145 km, and the batteries up to this range, are handy in size, compact and not too heavy. The mentioned vehicles are already technologically developed and have affordable prices. However, there is public distrust in the implementation of electric vehicles, mainly due to the longer mileage, faster refuelling and higher performance of conventional combustion engines. This opinion does not take into consideration that small electric vehicles have the capacity to more adequately and economically meet the mobility habits of a vast part of the population.
Complete information about road situations and traffic condition and accurate data on routes and driving cycles are of vital importance to determine the effectiveness of control strategies and to determine the advantages (if there are) of driving BEVs under real driving conditions.
The contributions of this study are the following: (1) the energy consumption of three different EVs was measured for different driving routes to analyse the effect of the road on the energy demand and to compare the results with the manufacturers’ theoretical data. (2) The real energy consumption values were compared to the values obtained from the simulation software developed by Muneer et al. [14], with more accurate results than the ones shown in the dashboards of the vehicles. (3) The effect of the electricity generation mix, and thus policies related to the sustainability of different countries, on CO2 was shown.
2. Literature Review
2.1. Decarbonisation of the Transport Sector
The problems related to the urban air pollution and energy security are accelerating the replacement of gasoline and diesel cars by battery electric vehicles. The 60% greenhouse gas emission reduction target established in the Transport White Paper 2011 [17] is one of the priorities of the European Commission [18], and many countries are establishing goals and bans related to the use and purchase of vehicles. Subsidies for BEV users, legislation and changing government policies and investments in charging infrastructures are some of the actions that different countries are taking towards this goal.
France, for example, with the objective of meeting their ambitious targets under the Paris climate accord, wants to stop the sale of diesel and petrol vehicles by 2040 [19]. Germany needs to reduce its greenhouse gas emissions by 40% of the emissions level in 1990 by 2020 to meet the German agenda for sustainable development and pollution control [20]. With this purpose, many cities and towns have introduced diesel bans [21]. As the purchasing power of the middle class increases, the number of vehicles in India is expected to increase notoriously in the near future, which will directly affect the pollution of many Indian cities, which are already some of the most contaminated in the world. Due to this fact, the Indian government wants to promote the purchase of electric vehicles and to ban the sale of vehicles that are not powered by electricity by 2030 [21]. In China, due to the increasing issues related to energy security and air pollution, the progress of electric vehicles (EV) is considered as national development strategy. Public acceptance and market insertion has increased considerably with the government’s support. The electric vehicle industry in China became the largest EV market in the world in 2015, and it is growing and progressing greatly with the establishment of new policies [16].
Sweden has also set the objective of a fossil-fuel-free vehicle fleet by 2030 [22]. In Norway, the objective is to ban the sale of non-zero-emission vehicles by 2025, and because of generous policies supporting the increased use of electric vehicles, about the 40% of the cars sold in the country in 2016 were electric or hybrid vehicles [21]. There were only a few hundred BEVs in Norway in 2005, while in 2014, there were around 25,000 electric vehicles [10].
Britain is following a similar initiative. The UK Committee on Climate Change (CCC) claims that by 2020, 16% of the sales of new cars should be electric vehicles [14]. As part of the government’s clean air plan, due to the rising levels of nitrogen oxide causing a major risk to public health, they plan to forbid new petrol and diesel cars and vans from 2040 [23]. The aim of the Scottish government is to achieve 100% non-fossil-fuel electricity by 2020 [24], and the disappearance of all non-electric vehicles from the road by 2050 [25]. For decarbonisation of the road, establishment of rapid charge points every at least 80 km has been approved, and, furthermore, the installation of home charging points has 100% funding [14].
The Scotland transport literature suggests that 94% of journeys in Scotland are less than 40 km, with an average distance of 12.1 km [26]. Therefore, most of the drives that take place in Scotland can be realised with an electric vehicle.
The objective of this research was to promote sustainable mobility and to offer a control strategy in Scotland. For this purpose, more than 50 electric vehicles’ real-world operational data were monitored for a period of 4 years. The aim of reading and investigating this information was to analyse real working parameters and energy consumption, considering key operational features such as road types, speeds, distances and weather conditions, among others. The tests with the EVs were performed along the principal roads of Edinburgh, to simulate different road types, for different times of the day and weather conditions. The research also analysed the CO2 emissions of different driving cycles and the effect of the energy generation mix in the emissions.
According to Morrissey, Weldon, and O’Mahony [27], the location of and confidence in the charging infrastructure affects the charging behaviour of BEVs; therefore, real and more accurate EV data will enhance the confidence of the users in these vehicles. A solid justification of this study is the necessity to increase the effectiveness of any control strategy which depends on accurate real-world data to support a real decrease of the environmental impact of the transportation sector.
2.2. Driving Cycle
There has been a notorious increase in interest in matters related to route planning, electric vehicle mileage range and speed optimisation and composition of vehicle fleets [28,29]. In this vein, battery electric vehicles are becoming more and more important, as they reinforce the introduction of sustainable delivery practices [30,31,32]. The previously mentioned growing government support, together with population increase and rising demand for zero-emission vehicles, will promote the improvement of BEVs in the future. The insertion of electric vehicles will not be smooth, since there are fears concerning their mileage [14]. Even though the energy and maintenance costs are much lower, EVs typically have less autonomy and payload limitations. The lithium-ion batteries used in these vehicles have a limited lifecycle and a specific charging and discharging pattern [30].
The actual energy demand of BEVs when they are operating on the streets is usually different from the manufacturer’s specifications of the efficiency [33]. Legal measures are commonly based on defined and laboratory-controlled driving cycles, which are available just as summarised values. However, these values do not represent the local driving conditions and different driving cycles [34]. In day-to-day use, there are several factors, such as acceleration, deceleration, speed, driving duration and cruise times, among others, that determine the energy demand of electric vehicles for driving a certain route. It is not the same to drive in a city, where stopping is more frequent, than in a rural zone, and the person driving the vehicle also influences the previously mentioned parameters [20]. The driving cycle has a great effect on the energy demand [35].
On 1 September 2018, the new Worldwide Harmonised Light Vehicle Test Procedure (WLTP) approval cycle, more severe and realistic than the New European Driving Cycle (NEDC) used previously, became effective in Europe. The differences between the different approval cycles (NEDC, EPA (Environmental Protection Agency) and WLTP) make it increasingly evident that the real autonomy of electric cars is not going to be the one announced by the manufacturer.
The “Mind the Gap” report by Transport and Environment describes the growing difference between official fuel consumption declared by manufacturers and the real consumption (and CO2 emissions) of new cars, estimating that the difference between them is 25% [36].
Therefore, laboratory-controlled driving cycles are not sufficient for battery duration estimations, EV powertrain design or management of the batteries; transient and real driving cycles are vital to providing accurate information to electric vehicle users. The correlation between the energy demand and driving cycle of EVs has been reviewed in detail by Braun and Rid [20] and André [37]. The analysis and development of driving cycles for specific routes such as rural and urban areas would be of significant help in the design and optimisation of electric vehicles. Furthermore, this information would also contribute to increasing confidence in the economic, electricity grid and lifecycle studies conducted by governments and EV users.
3. Methodology
The objective of this research was to analyse real working parameters and energy consumption considering road types, speeds, distances and weather conditions. The research also analysed the CO2 emissions of different driving cycles and the effect of the energy generation mix on the emissions. Figure 1 shows the main steps of the methodology.
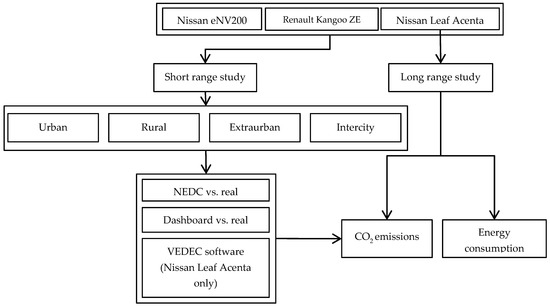
Figure 1.
Flowchart illustrating the main steps of the adopted methodology.
3.1. Data Acquisition
The Edinburgh College established a green vehicle-leasing program in the 2012, with the objective of providing a more sustainable and low cost service to the staff. There are 10 electric cars in total, including the following manufacturers: Nissan, Renault, Mitsubishi and BMW electric cars, 4 Nissan vans and an Allied electric minibus in the college fleet available to rent. The most used cars and the Nissan van were selected for this study.
- Nissan Leaf Acenta.
- Renault Kangoo ZE.
- Nissan eNV200 combi comfort.
These vehicles were equipped and tracked to obtain more than 50 GPS and energy consumption data for 4 years. The table below (see Table 1) shows the technical information of each of the selected means of transportation.

Table 1.
Technical information of the electric vehicles [38,39,40].
The development of driving cycles involves [37]:
- Recording driving conditions using one or several instrumented vehicles driven for their normal purposes.
- Analysing these data in order to describe or characterise these conditions.
- Developing one or more representative cycles for the recorded conditions.
The drive cycle data were collected live for the experiment using the vehicles’ own electronic control unit (ECU) memory and the CANbus diagnostic port, using a LUFII ELM327 V1.5 mini-wireless OBD2 diagnostic scan tool that was retrofitted.
3.2. Experimental Analysis
For the experimental analysis of this research work, rural, urban and intercity routes in the Edinburgh area were selected to monitor and record the energy consumption and speed of the EVs at various times of the day to obtain economic, environmental and energy performance parameters.
Each route type had specific characteristics. Urban routes are normally roads entering cities and towns, such as the artery into Edinburgh from the south. It is common to stop and start the car several times due to the traffic flow and speed restrictions. Extra-urban routes usually have larger cruise periods, since these roads are partially rural. The traffic flow determines the speed of the vehicle. The rural route in this test started in the Sighthill campus and ended in the Midlothian campus. Although a rural route, there were some urban areas with slower speed sections.
The tests were conducted using the car chasing technique; according to Chaari and Ballot [41] and confirmed by Andre [42], this method:
- Decreases the possibility of manipulation of the driver’s performance.
- Assures the usual driver uses the vehicle.
The drivers of the vehicles were staff of the Edinburgh College of different genders and areas for a close representation of the drivers in the region, and in all cases the drivers respected legal limitations on the road.
The only way of knowing the remaining power, and therefore the available distance an electric vehicle has is the display of the dashboard. Thus, the accuracy of this information is of vital importance for journey planning.
In order to compare the information that the displays showed with real values, data loggers were installed in the car with the objective of reading and storing the parameters from the vehicles control area network (CAN) where the sensors were located. CAN bus information was recorded every second, while the GPS position was logged every 5 s.
This research contemplated four different studies, which are detailed in the following section and summarised in Table 2. The experimental trials were carried out in summer and winter climate situations to obtain greater accuracy in the results and to allow data study on both air conditioning and heater usage and the auxiliary energy consumption used for heating the seats or defrosting before driving, among other features, that the driver would use in a normal situation [43].
Table 2.
Characteristics and objectives of the test.
(a) 80 kilometre route for 3 BEVs
This study compared the energy consumption of the previously mentioned three electric vehicles covering the same distance on the same route segment. For this purpose, the remaining distance shown in the dashboard was compared with the New European Drive Cycle (NEDC) values (these values are given by the car manufacturer to control the accuracy of the vehicle’s electronic control), and with the real value provided by the data loggers.
The route selected for these tests was 80 km long, it included both urban and rural zones, and the topography of the road included diverse driving styles to ensure real driving conditions. As the trials were conducted at various times of the day, they represented realistic traffic conditions [44]. The figure below shows the route used in the first study (see Figure 2).
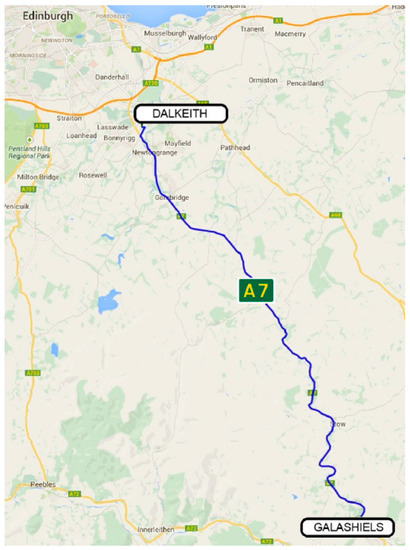
Figure 2.
Experimental commute route (Google Maps, 2018).
The trials were conducted in both winter and summer, when the external temperature was between −2 and 2 °C and between 16 and 20 °C, respectively. The internal temperature in the car was set to 20 °C for the driver’s comfort during the driving tests. According to Alahmer et al. [45], the temperature in the interior of the car affects the driver’s behaviour, thus, in order to reduce the user’s stress and fatigue and ensure comfort, the internal temperature was set to 20 °C.
(b) Urban, rural, mixed combined and intercity cycles
This test objective was to compare the dashboard values, NEDC information and real driving data for the same car in urban, rural, extra-urban and intercity routes, in order to analyse the effects of the driving mode and different weather conditions on the energy consumption.
The vehicle used for the analysis of different driving patterns was the Nissan Leaf model [46,47]. In this case, the only information given to the driver was that the vehicle needed to get from one location to another one, without a planned route. This way, it was possible to consider all driving conditions without a specific pattern. In all the tests, legal limitations and traffic conditions were followed.
The trials were conducted both in summer time, when the external temperature was between 16 and 20 °C, and in winter time, when the external temperature was between −2 and 2 °C, to analyse the effect of temperature on the vehicle’s behaviour and ensure a higher accuracy in the results. The interior temperature in the car was 20 °C throughout the entire test, using the heater in winter and cooling ventilation in the summer time.
Auxiliary equipment such as radio, seat heater or interior lighting was used when necessary depending on the journey, since this would be closer to real world conditions and it is senseless to conserve auxiliary energy [43].
(c) VEDEC simulation software
For the proper development of electric vehicles, proper simulation of the driving cycle is becoming more important. Muneer et al. [14], based on the study of Rubin and Davidson [48], developed a simulation software called Vehicle Dynamics and Energy Consumption (VEDEC). This software is written in VBA from Microsoft Excel Software and uses dynamic equations for the calculations. It can estimate the energy and power needs for any vehicle when driving, and it also calculates the available energy that a car can gain from regenerative braking, compared to the same vehicle without that system. The software evaluates the differences in energy consumption in different driving modes, such as acceleration, cruise and gradient-climbing, logging topography maps to the on-board altimeter. Note that VEDEC software was developed by the present team and was one of the constituent elements of Milligan’s doctoral research program [49]. The software has been extensively validated using the measured energy consumption of test vehicles, which included a Renault Kangoo ZE and a Nissan Leaf.
The lack of confidence in the theoretical autonomy of EVs has led to the development of various software and/or models to estimate the available mileage range of these vehicles, such as the analytical model developed by Wu et al. [50]. In their study, they first presented a system which can collect in-use EV data and vehicle driving data. Approximately 5 months of EV data were collected, and these data were used to analyse both EV performance and driver behaviour. Fiori et al. [51] developed the Virginia Tech Comprehensive Power-based EV Energy consumption Model (VT-CPEM) to estimate the driving parameters of EVs, and Hayes et al. [52] presented a simplified EV model to quantify the impact of battery degradation with time and vehicle auxiliary loads for heating, ventilation, and air conditioning (HVAC) on the total vehicle energy consumption.
The third part of this study compared the real driving parameters obtained from the data loggers with the estimations of this software tool. For these estimations, the program used current experimental inputs to determine real parameters for a specific location. The simulations in this research were conducted with a 95% efficiency for the motor and 60% for the regeneration.
For the driving test, a Nissan Leaf model was used; thus, the tools to measure and read the data were logged in the car. The recorded parameters were the acceleration and deceleration rates, altitude to estimate the inclination difference, speed, distance and duration of the trip. With these parameters, the driving cycles were determined for comparison with the estimated values from the software.
The test route this time included urban, extra-urban and rural areas, with the aim of identifying factors determined by acceleration and speed that were unique for a specific route type. For this purpose, the car was charged to 100% energy level and driven to the destination, recording the energy consumption. Once arrived at the destination, the car was recharged. Distance, journey duration and charge duration were also recorded. Figure 3 shows the mobility activity (%) of the test vehicle on each type of road, showing the percentages of time the vehicle was accelerating, decelerating, at a constant speed (cruise) or stationary. The results were different depending on the road type. In the extra-urban route for example, due to the dual-carriageway nature of the road, higher and more constant speeds were reached, and therefore the cruise section was larger. The amount of time spent in each mobility activity directly affected the energy consumption.
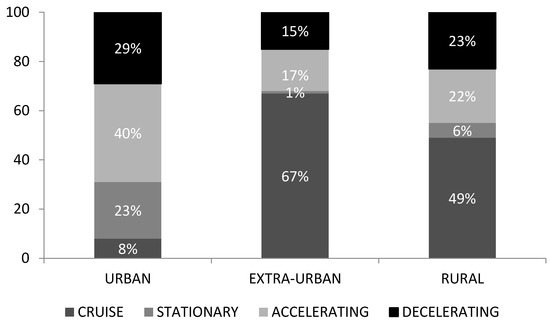
Figure 3.
Mobility activity in different routes.
(d) Long-range driving test
In the previous tests, all the journeys were within the driveable range of an EV. However, the limited autonomy and poor charging infrastructure are the main drawbacks of the electric vehicles. Therefore, the aim of the last test of this study was to analyse the performance, energy consumption and CO2 emissions of these vehicles over long distances. These data will help in the improvement of the batteries and in the development of the rapid charger infrastructure.
The Nissan Leaf Acenta electric vehicle was selected to record the long-range test using the data recording equipment.
The journey was conducted over several days through the A701-M74-M6-M5 main route from Edinburgh to Bristol, which includes a rapid chargers network known as the “Ecotricity electric highway” [53]. The trip was divided into different sectors, so the effect and dependence of the elevation and road conditions could also be studied, and the energy consumption on different terrains could be compared with internal combustion engine (ICE) vehicles. Figure 4 shows the distance of the test.
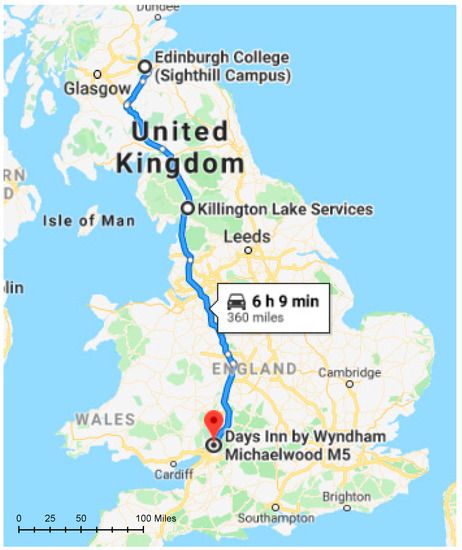
Figure 4.
Long-range route (Google Maps, 2018).
3.3. CO2 Emissions Calculation
Electric vehicles’ GHG emissions are nil when driving, however, there are emissions related to the generation of the electricity that drives the battery that need to be considered. The quantity of the emissions depends on the energy source used in the electricity generation. The dependence on fossil fuels is being reduced with the help of legislation and new government policies.
In Scotland, with the aim of achieving a complete decarbonisation of the roads by the 2050, the Scottish government has invested not only in a sustainable fleet of electric vehicles, but also in the renewable energy sector. The equivalent grid carbon intensity in Scotland in 2014 was 196 gCO2/kWh, and it was reduced to 151 gCO2/kWh by 2015 [54]. As indicated in Table 3, 42.4% of the power in Scotland is generated using renewable energy sources. In the UK, the dependence on fossil fuel is higher and only the 24.5% of the electricity comes from renewable energy sources; thus, the equivalent carbon emission is 458 gCO2/kWh [55]. Note that taking into account the energy losses between the source of electricity and the charging station, the efficiency of the charging station and the efficiency of the batteries, a total loss of 22% has been considered [14,56].
Table 3.
Electricity generation by fuel type (Gov. UK, 2016).
4. Results
4.1. 80 Kilometre Route for Three BEVs
The elevation of the route is shown in Figure 5, and the driving cycle of the tests can be seen in Figure 6.
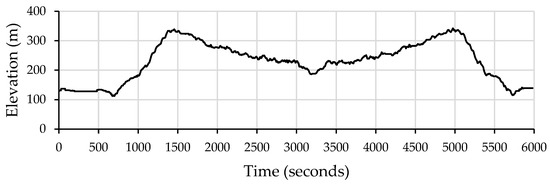
Figure 5.
80 km monitoring cycle—elevation—from Midlothian to Galashiels.
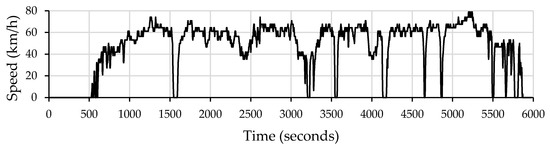
Figure 6.
80 km monitoring cycle—speed—from Midlothian to Galashiels.
Table 4 compares the NEDC values of each vehicle, provided by the manufacturers, with the estimation of the available distance shown in the dashboard and the real values obtained from the 80 km driving test performed with each electric vehicle. In the four cases, the dashboard showed a lower autonomy and the real driveable range was even lower. This fact only enhances the distrust of users of EVs, due to concerns about the possibility of not reaching their destinations.
Table 4.
Range comparison between NEDC values, dashboard estimations and real values.
The vehicles’ estimations visible in the dashboard were around 30% lower than the theoretical values of the vehicles. In the case of the Nissan Leaf, the difference between both parameters was larger in the winter period, so the vehicle is sensitive to the external temperature and auxiliary energy consumption. When comparing the dashboard values with the real autonomy of the Nissan Leaf, the results showed that the driveable distance in winter was higher than the autonomy shown in the dashboard, which confirms the effect of the external weather conditions on the vehicle’s sensors. In the case of the Renault Kangoo ZE, the difference between the NEDC and dashboard values was the same during winter and summer; thus, the vehicle’s electronics are not sensitive to weather conditions. However, the real autonomy of the car was highly affected by the external temperature. The difference between the dashboard and real values was 2.43% in summer and 15.29% in winter.
The energy efficiency represents the distance travelled using a given amount of energy. The higher the efficiency, the lower the energy consumption, and thus the lower the CO2 emissions. The results in Table 4 show that the Nissan Leaf vehicle had the lowest CO2 emissions among all the cars in the research. However, the weather conditions had an effect on the emissions.
Figure 7 illustrates the comparative values of the NEDC, predicted range and real driving cycle for the Nissan Leaf during the winter period. Due to the lower external temperature when operating in winter, the results did reflect a decreased range capability.
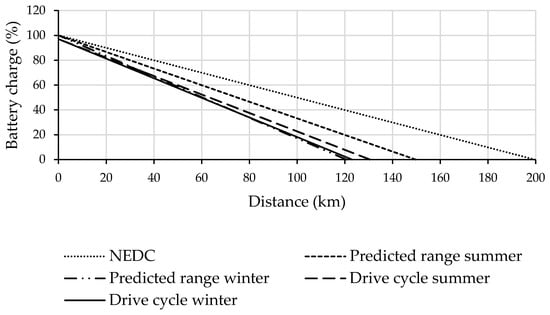
Figure 7.
Nissan leaf range comparison.
Figure 8 shows the consumption of the auxiliary energy for heating the Nissan Leaf vehicle during the winter trials to defrost the car prior to the driving test. The initial energy demand reached a peak of 4.25 kW and an additional 3.75 kW for about 6 min. These affected the mileage range achievable during winter compared to the summer period. Fiori et al. [51] also found similar results regarding the effect of auxiliary systems.
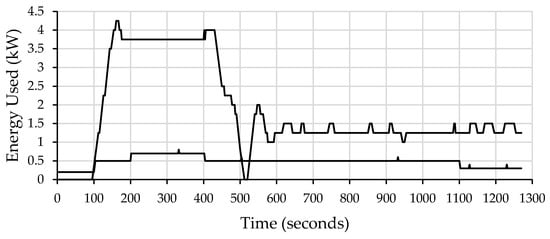
Figure 8.
Auxiliary energy demand during the first 21 min.
The driveable length of the vehicles is an indicator of the energy efficiency and it is directly related to the CO2 emissions of the vehicles. Therefore, as exposed in Table 4, the CO2 emissions were higher when the efficiency decreases. Consequently, the emanation of hazardous gases was higher during winter periods.
At this point, it is important to mention that the maximum availability of the battery when it was fully charged and the display in the dashboard indicated 100% was not real. Before the start of each trip, the vehicle was completely charged, indicated as 100% in the display of the dashboard, and checking that the charging post showed that further charge was not possible. These data was verified using the vehicle’s electronic control (ECU) unit and CANbus through the diagnostic port with a hardware plugin. The results showed that the ECU was recording a lower value of 97% for the state of charge (SOC) when fully charged, instead of 100% as expected. The experiment was repeated in many Nissan Leaf cars, and the values mentioned were continuously repeated. The maximum value that could be achieved was 22 kWh, instead of 24 kWh as stated by the manufacturers, giving a 2 kWh margin for safe battery control and eliminating the risk of overcharging, irrespective of the charging source that the car is plugged into.
The variation between the maximum capacity and the energy availability can be caused by different facts. According to Lam [57], it is related to the temperature and it will be affected throughout the battery’s life. However, when the battery is being used with higher currents, the available capacity can also be lower.
There is a need for a further research in the modelling battery recharging and discharging processes in a tractable way [30]. According to Sauer [58], the battery’s available energy should be measured as an electrical charge rather than as energy. Bergveld [59] reinforced this fact, claiming that the SOC should be the ratio between the electrical charge in the battery and the maximum charge it can have. The fraction between the electric current of the battery and the maximum capacity can define the instantaneous variation of the SOC [60]. The battery’s terminal voltage and current can vary depending on the power pattern of each drive cycle [61]. The battery’s power output depends on the terminal voltage and current [62].
4.2. Urban, Rural, Mixed Combined and Intercity Cycles
The figures below show the elevation and drive cycle of the extra-urban route. Figure 9 illustrates the elevation and duration of the extra-urban route test. Figure 10 shows the return drive cycle, in which the speed was approximately 50–65 km/h on the urban roads and 80–96 km/h on the dual-carriage roads for the same road type, where the energy recovery was applicable in the start and stop of the test and will therefore be insignificant.
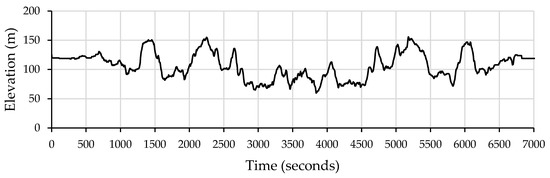
Figure 9.
Elevation of the extra-urban route (m).
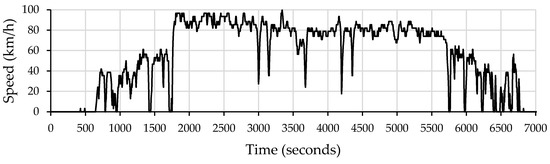
Figure 10.
Speed of the vehicle during the extra-urban route.
The second test of the study analysed the difference between the real driving cycle and the estimated range shown in the dashboard display and NEDC data from the manufacturers for urban, rural, intercity and extra-urban routes.
These tests were conducted in both summer and winter with a Nissan Leaf vehicle, the external temperature being between −2 and 2 °C in winter and between 16 and 20 °C in summer. The results indicate that the real energy efficiency of the vehicle was considerably lower than the estimations, especially during the winter (see Table 5).
Table 5.
Nissan Leaf range comparison for different routes.
The values in the dashboard were significantly lower than the theoretical NEDC values provided by the manufacturer. The difference was higher in winter. However, the real driveable range of the Nissan Leaf in different routes was even lower than the estimation of the vehicle. Figure 11 shows the variance between the NEDC, estimated and real driving discharge periods for the extra-urban route. The reduction in the distance available in the real driving was significant compared to the NEDC values.
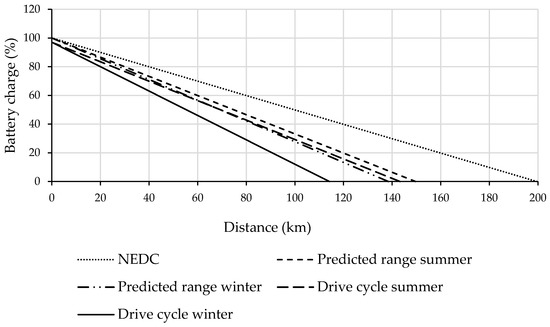
Figure 11.
Discharge comparison for extra-urban route.
During summer, the autonomy of the vehicle was 143.2 km, but in winter, the available energy was only enough for 114.2 km. This means a reduction of 20.25% in range. The route was the same in both seasons, and the same driver drove the vehicle in equal conditions. The only variables in the tests were the weather and climatic conditions such as temperature, rain and wind. This fact could have a negative impact on the driver and vehicle reaching their journey’s end. The difference in the driving patterns for each route, and the effect of the drive cycle in the battery range, confirmed the research led by Neubauer, Brooker, and Wood [63].
Regarding the energy efficiency and CO2 emissions of the vehicle on different types of road, the results coincided with many other studies in the fact that the efficiency of the EVs was higher in urban areas compared to rural, intercity and extra-urban areas [50,51]. Again, the temperature had a negative effect in the results. It is also worth mentioning that on roads where the speed was maintained constantly during a period, as, for example, on extra-urban and intercity routes, the energy recovery will be negligible, since there will not be regeneration. In urban roads, by contrast, the start–stop process of the car was more frequent and therefore the CO2 emissions were lower.
4.3. VEDEC Simulation Software
The third test of the study compared the real drive cycles with simulations conducted using the VEDEC software in order to verify the accuracy of the simulation tool on different route types. For this test, a Nissan Leaf vehicle was driven through urban, rural and extra-urban roads.
A critical parameter when simulating the energy consumption and speed is the rolling friction of the vehicle. The greater the friction, the lower the distance travelled will be, since the energy demand to rotate the wheels will be higher. The right hand side of Equation (1a) has components of energy that include, from left to right, tyre friction, ill climbing, wind drag and change in kinetic energy [14]. Assuming travel on a level road (Equation (1b)) and making µ the subject in Equation (1b), Equation (1c) [64] was used to estimate the friction coefficient for the vehicles in this test, with a value of 0.0269; thus, the coefficient utilised for the simulation was between 0.025 and 0.03 depending on the surface material of the road and the tyre pressure [43]. Note that the authors used the cars mentioned in Figure 1. The cars were produced in the years 2011 (Nissan) and 2012 (Renault). The value of the coefficient of friction quoted was based on information obtained from the manufacturers. Those values were found to be in agreement with our experimental results.
Cd: coefficient of drag; A: frontal area; ρ: air density; m: mass; g: acceleration gravity; vf: final velocity; vi: initial velocity; E: energy; Δd: distance.
Vehicle manufacturers will recommend the lowest friction coefficient for the tyres, since it will affect in the mileage range of the vehicles.
Table 6 shows the energy consumption and speed estimated values of the software compared to the real drive cycles for urban, extra-urban and rural routes. In the case of the urban route, the energy demand estimation was 7.30% higher than the real energy demand and the speed was 2.12% lower than the real value. The energy meter norm for APT control units was: Active (kWh) = BS EN 50470-3 (Class B ± 1%). Thus, the estimated results of the simulation software are reliable.
Table 6.
Energy, distance and speed—overview.
The accuracy of the estimation values obtained with the simulation software in the case of the extra-urban and rural routes was much higher. The energy demand estimation was 4.74% and 2.56% lower for the extra-urban and rural roads, respectively, while the speed was 3.61% and 2.86% higher in each case. Both routes had longer cruise periods than the urban route, especially in the case of the extra-urban route which had a dual-carriageway nature. This fact resulted in long high-speed periods which increased the energy demand even though the journey time was 25% lower than in the rural route. Both routes showed similar periods of acceleration and deceleration. The rural route had the highest accuracy in the estimated values.
Fiori et al. [51] developed an energy consumption estimation model which produces an average error of 5.9% relative to empirical data. Wu et al. [50] proposed an analytical EV power estimation model with a mean absolute error (MAE) of 15.6%.
Table 7 illustrates the comparison between the route distances shown on the vehicle’s dashboard with the estimated values of simulation software and the distances taken from proprietary GBmapometer and Google maps sources. The objective of this comparison was to verify the accuracy of the vehicle’s parameters and to ensure the UK legislative purposes for any speedometer were fulfilled [14].
Table 7.
Travelled distance comparison and error.
The distance read by the vehicle was very similar to the GBmapometer and Google maps distances, with less than 2% variation. The accuracy of the measurements of these tools was dependent on the terrestrial reference system (TRS). The distance values estimated using the simulation software were within 1% of the distances taken by GBmapometer and Google maps. Therefore, the software’s results are reliable.
4.4. Long-Range Driving Test
The long-range driving test was carried out using the Nissan Leaf vehicle from Edinburgh to Bristol. Table 8 shows the distance travelled and energy consumption between each charging point (sector). The CO2 emissions of each sector were estimated using both Scottish and UK grid carbon intensity figures and compared to the emissions of an equivalent internal combustion engine (ICE) vehicle.
Table 8.
Travelled distance, energy consumption and CO2 emissions.
The weather and road conditions (see Table 9) had an effect on the efficiency of the electric vehicle. It was noticed that the energy consumption rate was greater at higher driving speeds.
Table 9.
Road conditions.
Table 10 shows the consumption and emission values of the Nissan Leaf vehicle and an equivalent internal combustion engine (ICE) vehicle for the same route. The similar-sized passenger vehicle used for the comparison was the Ford Focus 1.6.
Table 10.
Electric vehicle vs. internal combustion engine.
The emissions of an electric vehicle depend on the grid mix used to generate the electricity that powers the battery. The grid mix values used for these estimations were mentioned in the Section 3.3, 0.151 kg/kWh in Scotland and 0.458 kg/kWh in the UK. The CO2 emissions at tailpipe are nil. According to Lane [65], the tailpipe emissions of the equivalent ICE vehicle are 0.136 kg/km, therefore, in this route, the total CO2 emissions would ascend to 77.5 kg. However, for a proper comparison of both vehicles, it is essential to consider the CO2 emissions of the production of the fuel used to power the car. Both the Scotland and UK values have been used for this estimation.
The results prove that the switch from internal combustion engines to electric vehicles is essential to achieve a more sustainable transport. Nevertheless, electric vehicles are not free from emissions, and the numbers shown in Figure 12 show their dependency on the grid. Scotland is very focused on the achievement of 100% non-fossil-fuel electricity by 2020. Currently, when an electric vehicle is charged in Scotland, it emits 5.7 times less CO2 than an ICE vehicle. In England, the dependency on fossil fuels is much larger, and it reduces 2.3 times the emissions of a conventional vehicle.
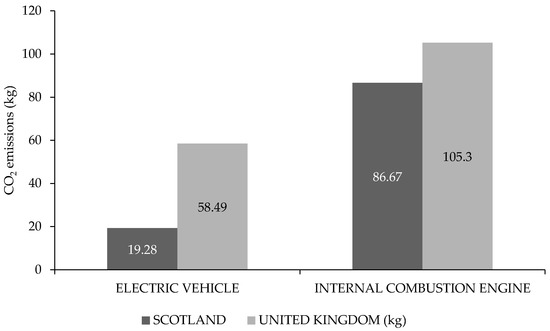
Figure 12.
Scotland vs. UK CO2 emissions.
5. Conclusions
Even though the mileage range of the electric vehicles in this study was around 160 km, four times lower than the range of a conventional fuel vehicle, it has been proven that the 94% of the journeys that take place in Scotland are less than 40 km. The acceptance and confidence of users in electric vehicles is still low. One of the main reasons for this is the lack of reliable information about the achievable range and performance of an electric vehicle.
The results of this study indicate that the data provided by the manufacturers (NEDC) and the values shown in the vehicle’s dashboard are inaccurate, and far from being accurate. The values shown in the dashboards of the vehicles were, in most cases, 30% lower than the theoretical values according to the manufacturers (NEDC). The difference between the dashboard values and real mileage range was as high as 13% in some cases. The gap between the estimated values and the real range of the vehicle was larger during the winter, with differences up to 17% in some cases. The Nissan Leaf vehicle had 20% less autonomy during winter for the same extra-urban route. This explains the fact that there is a decrease in use of the electric vehicles in winter.
The results of the simulation software were much more accurate than the vehicle’s information on the display; thus, it is possible to have more accurate information. The difference between real and estimated values ranged between +7.9% and −4.5%. This reduces the risk of battery depletion and proves that it is possible to have a real prediction of the vehicles’ mileage range using data from real driving patterns. The dashboard information of the vehicles needs to be modified and adapted to real values to gain accuracy in the distance and energy availability, and thereby increase the confidence of electric vehicle users.
Therefore, it is necessary to update the performance measurement systems of the different vehicles, since the car manufacturers are cheating the policy makers, manipulating the tests and producing vehicles that only reach their regulatory objectives during tests and not on the road, where the fuel is burned and emissions occur. Regulatory pressure to reduce CO2 emissions from new cars, significant tax exemptions for cars with low CO2 test figures and high oil prices have increased the incentive for car manufacturers to manipulate test results. This manipulation will continue unless policy makers act to change things.
Regarding the CO2 emissions of electric vehicles, the results showed that these were lower than the emissions of internal combustion engines. However, even though the emissions in the tailpipe are nil, there is a clear dependency on the electricity grid. Many countries, with the aim of achieving the 60% GHG emission reduction target, are establishing policies and bans to reduce the use of diesel and petrol vehicles. There are subsidies to promote the use of electric vehicles. However, as the results of this study show, the emissions of EVs depend on the electricity generation mix; thus, it is essential to focus on the electricity generation mix and to reinforce green energy sources in order to achieve a sustainable transport system. Scotland’s electric infrastructure has augmented the contribution of renewable energy sources from 32% in 2013 to 42.9% in 2015. Therefore, currently, an electric vehicle in Scotland emits three times less than a vehicle charged in another location in the UK for the same route.
Electric vehicles are more sustainable and less hazardous than internal combustion vehicles. However, it is vital to focus on the power generation sources in order to find a solution to urban air pollution and energy-security-related problems.
Further work will be needed to strengthen the present work by collecting more data on all types of routes—urban, rural and mixed, combined and intercity. The present study was not truly exhaustive, so further data will bring into play a combination of varying speeds, road altitudes and driver behaviour.
Author Contributions
Conceptualization, R.M. and T.M.; methodology, R.M. and T.M.; software, R.M. and T.M., validation, R.M. and T.M.; writing-original draft preparation, S.E. and E.J.G.; writing-review & editing, E.J.G.
Funding
This research received no external funding.
Conflicts of Interest
The authors declare no conflict of interest.
References
- World Oil Outlook 2017. Available online: https://www.opec.org/opec_web/flipbook/WOO2017/WOO2017/assets/common/downloads/WOO%202017.pdf (accessed on 14 May 2019).
- Liu, L.; Chen, R.-C. A novel passenger flow prediction model using deep learning methods. Transp. Res. Part C Emerg. Technol. 2017, 84, 74–91. [Google Scholar] [CrossRef]
- Dulebenets, M.A. A novel memetic algorithm with a deterministic parameter control for efficient berth scheduling at marine container terminals. Marit. Bus. Rev. 2017, 2, 302–330. [Google Scholar] [CrossRef]
- Dulebenets, M.A. A comprehensive multi-objective optimization model for the vessel scheduling problem in liner shipping. Int. J. Prod. Econ. 2018, 196, 293–318. [Google Scholar] [CrossRef]
- UNCTAD. Review of Maritime Transport 2018; United Nations Publications: New York, NY, USA, 2018. [Google Scholar]
- Akturk, M.S.; Atamtürk, A.; Gurel, S. Aircraft rescheduling with cruise speed control. Oper. Res. 2014, 62, 829–845. [Google Scholar] [CrossRef]
- Jalalian, M.; Gholami, S.; Ramezanian, R. Analyzing the trade-off between CO2 emissions and passenger service level in the airline industry: Mathematical modeling and constructive heuristic. J. Clean. Prod. 2019, 206, 251–266. [Google Scholar] [CrossRef]
- Wagenaar, J.; Kroon, L.; Fragkos, I. Rolling stock rescheduling in passenger railway transportation using dead-heading trips and adjusted passenger demand. Transp. Res. Part B Methodol. 2017, 101, 140–161. [Google Scholar] [CrossRef]
- European Petroleum Refiners Association AISBL. Available online: https://www.fuelseurope.eu/knowledge/refining-in-europe/fuelling-the-eu/transport/road-transport/ (accessed on 15 July 2019).
- Holtsmark, B.; Skonhoft, A. The Norwegian support and subsidy policy of electric cars. Should it be adopted by other countries? Environ. Sci. Policy 2014, 42, 160–168. [Google Scholar] [CrossRef]
- Bauer, G. The impact of battery electric vehicles on vehicle purchase and driving behavior in Norway. Transp. Res. Part D Transp. Environ. 2018, 58, 239–258. [Google Scholar] [CrossRef]
- European Environment Agency. Energy Efficiency and Energy Consumption in the Transport Sector. 2017. Available online: https://www.eea.europa.eu/data-and-maps/indicators/energy-efficiency-and-energy-consumption/assessment-1 (accessed on 11 April 2019).
- International Energy Outlook 2016 (IEO2016). 2016. Available online: https://www.eia.gov/outlooks/ieo/pdf/transportation.pdf (accessed on 28 April 2019).
- Muneer, T.; Milligan, R.; Smith, I.; Doyle, A.; Pozuelo, M.; Knez, M. Energetic, environmental and economic performance of electric vehicles: Experimental evaluation. Transp. Res. Part D Transp. Environ. 2015, 35, 40–61. [Google Scholar] [CrossRef]
- Akhavan-Rezay, E.; El-Saadany, E.F. Managing demand for plug-in electric vehicles in unbalanced LV systems with photovoltaics. IEEE Trans. Ind. Inform. 2017, 13, 1057–1067. [Google Scholar] [CrossRef]
- Du, J.; Ouyang, D. Progress of Chinese electric vehicles industrialization in 2015: A review. Appl. Energy 2017, 188, 529–546. [Google Scholar] [CrossRef]
- European Commission. White Paper 2011. 2018. Available online: https://ec.europa.eu/transport/themes/strategies/2011_white_paper_en (accessed on 20 May 2019).
- Burchart-Korol, D.; Jursova, S.; Folęga, P.; Korol, J.; Pustejovska, P.; Blaut, A. Environmental life cycle assessment of electric vehicles in Poland and the Czech Republic. J. Clean. Prod. 2018, 202, 476–487. [Google Scholar] [CrossRef]
- Chrisafis, A.; Vaughan, A. France to Ban Sales of Petrol and Diesel Cars by 2040. The Guardian. 2017. Available online: www.theguardian.com/business/2017/jul/06/france-ban-petrol-diesel-cars-2040-emmanuel-macron-volvo (accessed on 6 April 2019).
- Braun, A.; Rid, W. Assessing driving pattern factors for the specific energy use of electric vehicles: A factor analysis approach from case study data of the Mitsubishi i–MiEV minicar. Transp. Res. Part D Transp. Environ. 2018, 58, 225–238. [Google Scholar] [CrossRef]
- Petroff, A. These Countries Want to Ban Gas and Diesel Cars. CNN Money. 2017. Available online: http://money.cnn.com/2017/07/26/autos/countries-that-are-banning-gas-cars-for-electric/index.html (accessed on 18 March 2019).
- Borén, S.; Nurhadi, L.; Ny, H.; Robèrt, K.; Broman, G.; Trygg, L. A strategic approach to sustainable transport system development—Part 2: The case of a vision for electric vehicle systems in southeast Sweden. J. Clean. Prod. 2017, 140, 62–71. [Google Scholar] [CrossRef]
- Asthana, A.; Taylor, M. Britain to Ban Sale of all Diesel and Petrol Cars and Vans from 2040. The Guardian. 2017. Available online: http://www.theguardian.com/politics/2017/jul/25/britain-to-ban-sale-of-all-diesel-and-petrol-cars-and-vans-from-2040 (accessed on 6 April 2019).
- Committee on Climate Change. Reducing Emissions in Scotland: 2015 Progress Report 2015. Available online: https://www.theccc.org.uk/wp-content/uploads/2015/01/Scotland-report-v6-WEB.pdf (accessed on 6 April 2019).
- Scotland, A. Reducing Scottish Greenhouse Gas Emissions; Audit Scotland: Edinburgh, UK, 2011.
- Transport Scotland. Scottish Household Survey. Travel Diary Results. 2016. Available online: https://www.transport.gov.scot/media/39692/sct09170037961.pdf (accessed on 14 May 2019).
- Morrissey, P.; Weldon, P.; O’Mahony, M. Future standard and fast charging infrastructure planning: An analysis of electric vehicle charging behaviour. Energy Policy 2016, 89, 257–270. [Google Scholar] [CrossRef]
- Koç, Ç.; Bektaş, T.; Jabali, O.; Laporte, G. The impact of depot location, fleet composition and routing on emissions in city logistics. Transp. Res. Part B Methodol. 2016, 84, 81–102. [Google Scholar] [CrossRef]
- Goeke, D.; Schneider, M. Routing a mixed fleet of electric and conventional vehicles. Eur. J. Oper. Res. 2015, 245, 81–99. [Google Scholar] [CrossRef]
- Pelletier, S.; Jabali, O.; Laporte, G.; Veneroni, M. Battery degradation and behaviour for electric vehicles: Review and numerical analyses of several models. Transp. Res. Part B Methodol. 2017, 103, 158–187. [Google Scholar] [CrossRef]
- Pelletier, S.; Jabali, O.; Laporte, G. 50th Anniversary invited article—Goods distribution with electric vehicles: Review and research perspectives. Transp. Sci. 2016, 50, 3–22. [Google Scholar] [CrossRef]
- Schiffer, M.; Walther, G. The electric location routing problem with time windows and partial recharging. Eur. J. Oper. Res. 2017, 260, 995–1013. [Google Scholar] [CrossRef]
- Cubito, C.; Millo, F.; Boccardo, G.; Di Pierro, G.; Ciuffo, B.; Fontaras, G.; Serra, S.; Garcia, M.O.; Trentadue, G. Impact of different driving cycles and operating conditions on CO2 emissions and energy management strategies of a euro-6 hybrid electric vehicle. Energies 2017, 10, 1590. [Google Scholar] [CrossRef]
- Huertas, J.I.; Giraldo, M.; Quirama, L.F.; Díaz, J. Driving cycles based on fuel consumption. Energies 2018, 11, 3064. [Google Scholar] [CrossRef]
- Zhang, Q.; Deng, W. An adaptive energy management system for electric vehicles based on driving cycle identification and wavelet transform. Energies 2016, 9, 341. [Google Scholar] [CrossRef]
- Transport and Environment (T&E). Mind the Gap! Why Official Car Fuel Economy Figures Don’t Match up to Reality; Dings, J., Ed.; Transport and Environment: Brussels, Belgium, 2013. [Google Scholar]
- André, M. The ARTEMIS European driving cycles for measuring car pollutant emissions. Sci. Total. Environ. 2004, 334, 73–84. [Google Scholar] [CrossRef] [PubMed]
- Nissan Leaf. 2018. Available online: https://www.electrocoches.eu/marcas/nissan/leaf/#nissan-leaf-24-kwh-acenta (accessed on 30 May 2019).
- Renault Kangoo ZE. 2018. Available online: https://www.electrocoches.eu/marcas/renault/kangoo-ze/#renault-kangoo-z-e-kangoo-z-e (accessed on 30 May 2019).
- Nissan e-NV200. 2018. Available online: https://www.electrocoches.eu/marcas/nissan/e-nv200/#nissan-e-nv200-combi-comfort-5-24-kwh (accessed on 30 May 2019).
- Chaari, H.; Ballot, E. Fuel consumption assessment in delivery tours to develop eco driving behaviour. In Proceedings of the European Transport Conference 2012, Glasgow, Scotland, UK, 8–10 October 2012. [Google Scholar]
- Andre, M. Driving Cycle Development: Characterization of the Methods; No. 961112; SAE Technical Paper: Warrendale, PA, USA, 1996. [Google Scholar]
- Milligan, R. 13—Drive cycles for battery electric vehicles and their fleet management. In Electric Vehicles: Prospects and Challenges; Elsevier: Amsterdam, The Netherlands, 2017; pp. 489–555. [Google Scholar]
- Esteves-Booth, A.; Muneer, T.; Kirby, H.; Kubie, J.; Hunter, J. The measurement of vehicular driving cycle within the city of Edinburgh. Transp. Res. Part D Transp. Environ. 2001, 6, 209–220. [Google Scholar] [CrossRef]
- Alahmer, A.; Mayyas, A.; Mayyas, A.A.; Omar, M.; Shan, D. Vehicular thermal comfort models; A comprehensive review. Appl. Therm. Eng. 2011, 31, 995–1002. [Google Scholar] [CrossRef]
- Nissan LEAF Owner’s Manual. Available online: https://www.nissan.ca/content/dam/nissan/ca/owners/manuals/LEAF/2015-Nissan-LEAF.pdf (accessed on 30 May 2019).
- Nissan UK. Nissan LEAF. 2016. Available online: https://www.nissan.co.uk/?&cid-psmM9WSXFpD_dc/D (accessed on 30 May 2019).
- Rubin, E.; Davidson, C. Introduction to Engineering and the Environment; McGraw-Hill: New York, NY, USA, 2001. [Google Scholar]
- Milligan, R. Critical Evaluation of the Battery Electric Vehicle for Sustainable Mobility. Ph.D. Thesis, Edinburgh Napier University, Edinburgh, Scotland, UK, 2016. [Google Scholar]
- Wu, X.; Freese, D.; Cabrera, A.; Kitch, W.A. Electric vehicles’ energy consumption measurement and estimation. Transp. Res. Part D Transp. Environ. 2015, 34, 52–67. [Google Scholar] [CrossRef]
- Fiori, C.; Ahn, K.; Rakha, H.A. Power-based electric vehicle energy consumption model: Model development and validation. Appl. Energy 2016, 168, 257–268. [Google Scholar] [CrossRef]
- Hayes, J.G.; Davis, K. Simplified electric vehicle powertrain model for range and energyconsumption based on EPA coastdown-parameters and test validation by Argonne National Lab data on the Nissan Leaf. In Proceedings of the IEEE Transportation Electrification Conference and Expo (ITEC), Dearborn, MI, USA, 15–18 June 2014; pp. 1–6. [Google Scholar] [CrossRef]
- Ecotricity. Britain’s Green Energy. 2016. Available online: https://www.ecotricity.co. uk/for-the-road/our-electric-highway (accessed on 15 May 2019).
- Scottish Government. Scottish Greenhouse Gas Emissions Annual Target Report: 2015. 2016. Available online: https://beta.gov.scot/publications/scottish-greenhouse-gas-emissions-annual-target-report-2015/pages/6/ (accessed on 28 March 2019).
- Gov. UK. Greenhouse Gas Reporting—Conversion Factors 2015. 2016. Available online: https://www.gov.uk/government/publications/greenhouse-gas-reporting-conversion-factors-2015 (accessed on 28 March 2019).
- Electricity Distribution Losses—A Consultation Document. Available online: https://www.ofgem.gov.uk/ofgem-publications/44682/1362-03distlossespdf (accessed on 15 July 2019).
- Lam, L.; Bauer, P.; Kelder, E. A practical circuit-based model for Li-ion battery cells in electric vehicle applications. In Proceedings of the IEEE 33rd International Telecommunications Energy Conference (INTELEC), Amsterdam, The Netherlands, 9–13 October 2011; pp. 1–9. [Google Scholar] [CrossRef]
- Sauer, D.U. Batteries—Chargedischarge Curves. In Encyclopedia of Electro-Chemical Power Sources; Garche, J., Dyer, C., Moseley, P., Ogumi, Z., Rand, D., Scrosati, B., Eds.; Elsevier: Amsterdam, The Netherlands, 2009; pp. 443–451. [Google Scholar]
- Bergveld, H.J.; Kruijt, W.S.; Notten, P.H.L. Battery management systems. Battery Manag. Syst. 2002, 1, 9–30. [Google Scholar]
- Moura, S.J.; Fathy, H.K.; Callaway, D.S.; Stein, J.L. A stochastic optimal control approach for power management in plug-in hybrid electric vehicles. IEEE Trans. Control Syst. Technol. 2011, 19, 545–555. [Google Scholar] [CrossRef]
- Campbell, R. Battery Characterization and Optimization for Use in Plug-In Hybrid Electric Vehicles: Hardware-in-the-Loop Duty Cycle Testing. Master’s Thesis, Queen’s University, Kingston, ON, Canada, 2011. Available online: https://pdfs.semanticscholar.org/b29c/65f2cdd44532022127466a291b0666f0870c.pdf?_ga=2.73880017.2138972187.1560500948-1227402376.1560500948 (accessed on 23 May 2019).
- Khajepour, A.; Fallah, S.; Goodarzi, A. Electric and Hybrid Vehicles—Technologies, Modeling, and Control: A Mechatronic Approach; John Wiley & Sons: Hoboken, NJ, USA, 2014. [Google Scholar]
- Neubauer, J.; Brooker, A.; Wood, E. Sensitivity of battery electric vehicle economics to drive patterns, vehicle range, and charge strategies. J. Power Sources 2012, 209, 269–277. [Google Scholar] [CrossRef]
- Muneer, T.; Clarke, P.; Cullinane, K. The electric scooter as a means of green transport. In Proceedings of the IMechE conference on low carbon vehicles, London, UK, 20–21 May 2009. [Google Scholar]
- Lane, B. Ford Focus Emissions. Next Green Car. 2016. Available online: http://www.nextgreencar.com/ view-car/53716/ford-focus-1.6-style-105ps-s6-petrol-manual-5-speed (accessed on 30 May 2019).
© 2019 by the authors. Licensee MDPI, Basel, Switzerland. This article is an open access article distributed under the terms and conditions of the Creative Commons Attribution (CC BY) license (http://creativecommons.org/licenses/by/4.0/).