Article

Heat Pipe Thermal Management Based on High-Rate Discharge and Pulse Cycle Tests for Lithium-Ion Batteries

1
School of Energy and Power Engineering, Chongqing University, Chongqing 400044, China
2
School of Automotive Engineering, Chongqing University, Chongqing 400044, China
3
Chongqing Chang’an New Energy Vehicle Technology Co, Ltd., Chongqing 401120, China
*
Author to whom correspondence should be addressed.
Energies 2019, 12(16), 3143; https://doi.org/10.3390/en12163143
Submission received: 3 July 2019 / Revised: 9 August 2019 / Accepted: 12 August 2019 / Published: 15 August 2019

Abstract

:
A battery thermal management system (BTMS) ensures that batteries operate efficiently within a suitable temperature range and maintains the temperature uniformity across the battery. A strict requirement of the BTMS is that increases in the battery discharge rate necessitate an increased battery heat dissipation. The advantages of heat pipes (HPs) include a high thermal conductivity, flexibility, and small size, which can be utilized in BTMSs. This paper experimentally examines a BTMS using HPs in combination with an aluminum plate to increase the uniformity in the surface temperature of the battery. The examined system with high discharge rates of 50, 75, and 100 A is used to determine its effects on the system temperature. The results are compared with those for HPs without fins and in ambient conditions. At a 100 A discharge current, the increase in battery temperature using the heat pipe with fins (HPWF) method is 4.8 °C lower than for natural convection, and the maximum temperature difference between the battery surfaces is 1.7 °C and 6.0 °C. The pulse circulation experiment was designed considering that the battery operates with a pulse discharge and temperature hysteresis. The depth of discharge is also considered, and the states-of-charge (SOC) values were 0.2, 0.5, and 0.8. The results of the two heat dissipation methods are compared, and the optimal heat dissipation structure is obtained by analyzing the experimental results. The results show that when the ambient temperature is 37 °C, differences in the SOC do not affect the battery temperature. In addition, the HPWF, HP, and natural convection methods reached stable temperatures of 40.8, 44.3, and the 48.1 °C, respectively the high temperature exceeded the battery operating temperature range.

1. Introduction

Rising energy demands have led to a series of problems, such as increased fossil fuel consumption, depletion of non-renewable resources, environmental pollution problems, and political impacts [1,2,3]. Many scholars have studied clean energy, including wind [4,5], solar [6,7,8], geothermal [9,10], and tidal [11]. The use of batteries in electric vehicles (EVs) [12,13] to replace traditional fossil fuels can effectively reduce the global use of fossil fuels as automotive batteries provided good conversion and storage capabilities. However, high efficiency, safety, and longevity are especially important for EVs during high-speed operation. Consequently, improving the performance of automotive batteries is critical to replacing conventional fuel vehicles with EVs.
The characteristics of a battery include its energy density, voltage, operating conditions, discharge rate, charging time, and safety [14]. Lithium batteries have an important market as automotive batteries because of their high energy density, long cycle life, and good safety performance [15]. However, there are several problems in their operation. In particular, the poor thermal conductivity of lithium batteries, especially for high discharge rates, causes the battery to release a large amount of heat during charging and discharging. If the heat cannot be dissipated in an efficient manner, the lifetime of the battery is reduced, the internal resistance is increased, and the charge and discharge cycles are adversely affected. Excessive temperatures have been shown to have the following effects: Lithium melting, capacity decay, power attenuation, self-discharge, and thermal runaway [14]. In addition, the battery electrolyte dissolves and may leak. In general, when the battery temperature is too high, the stability, safety, and service lifetime are all affected [16]. Based on an Arrhenius’s relationship, the reaction rate increases exponentially as the battery temperature increases. As the temperature increases, the aging rate also increases [17,18,19]. For example, when the temperature increases from 20 to 45 °C, the total efficiency of the battery decreases from 77.14%to 76.36% [20]. In addition, when the lithium battery is at an ambient temperature of 45 °C, the battery is attenuated by 21% for 1707 cycles; when the battery is at an ambient temperature of 60°C, the battery is attenuated by 20% for 754 cycles [21]. To ensure a satisfactory battery lifetime, performance, and safety, the battery system needs to be managed by the battery to ensure that the battery is in the proper operating temperature range of 25-40 °C and that the temperature uniformity of the battery is within 5 °C [14,22].
There are currently five types of heat dissipation methods for automotive batteries: air cooling, liquid heat dissipation, phase change material (PCM) cooling, heat pipes (HPs) cooling, and a coupling of several heat dissipation methods. However, air cooling, liquid heat dissipation, and PCM cooling methods have been shown to be inadequate. For example, the thermal conductivity and the specific heat capacity of air are relatively low, so air cooling cannot have the expected effect in some cases and can even result in a higher temperature gradient over the battery pack [23]. Consequently, air cooling cannot meet the demands required by the high charge and discharge rates [24,25]. If liquid heat dissipation is used, there is the possibility of leakage. With PCM cooling, the battery cells or modules must be directly immersed in the PCM to absorb or release heat, which also has the possibility of leaking. The use of HP cooling for electric vehicle battery systems has begun to attract attention as battery heat problems have become increasingly prominent. The HP performance is superior to other heat exchange modes because it uses evaporation and condensation as the medium for heat exchange. Research on the structures and media for HP has improved its conversion efficiency [26,27,28,29], which has provided a basis for heat dissipation in a variety of devices [30]. For example, HP cooling is already utilized in car batteries [31,32], light-emitting diodes [33,34], hard disk drives [35], and other electronic products [36,37,38]. Heat dissipation using HPs can largely compensate for the problems encountered from other cooling methods [39].
There are many studies on heat dissipation methods that use HPs [40,41,42]. Rao et al. [43] used an electrically-heated copper plate to simulate battery heat dissipation within the condensation section of a HP using water as the coolant. When the heating rate was 50 W, the battery temperature was maintained below 50 °C. When the heating power was lower than 30 W, the temperature was maintained to be within the effective range for battery operation. Wang et al. [44] replaced the heat source by heating the core battery and used an L-type sintered copper powder HP for heat dissipation while considering the heat dissipated from natural convection, forced ventilation, and a constant temperature water flow. When the heating was 40 W/ h, the surface temperature of the battery was always below 40 °C. Zhang et al. [16] examined a battery pack of 30 cylindrical lithium batteries as an example to analyze the performance of combining a PCM paraffin with HPs. With a discharge rate of 3 C, the maximum temperature of the battery pack was below 50 °C, and the temperature difference between any two batteries was less than 3 °C. Sun et al. [17] took five rectangular lithium-ion batteries as an example and sandwiched three sintered copper powder type HPs between each battery, which were fit with fins in the condensation section. For discharge rates of 1, 2, and 3 C, experiments and CFD simulations were used to analyze the different condensation sections (natural convection, forced ventilation, combination of natural convection with HPs, and combination of forced ventilation with HPs). Increasing the HPs reduced the maximum temperature of the battery by 7.1 °C so the maximum battery temperature remained below 40 °C. Shah, K. [31] used a cartridge heater to simulate a heat generation model for a 26,650 battery and designed different heat generation models by changing the power and inserting a HP inside the battery to analyze different heat dissipation conditions (natural convection, forced convection, and HP cooling). When the heating power was 2.07 W, the internal temperature of the HP battery was controlled to be below 45 °C, but the battery temperature under other heat dissipation conditions exceeded 55 °C. Zhao Rui [42] used 3 and 8 Ah lithium batteries with grooved aluminum HPs (air-cooled, water bath, and air-cooled and spray water mist combination), to compare the temperature conditions under different discharge rates. In the experiments, the heat dissipation performance of the HPs combined with spray water mist and air cooling was shown to be the most ideal.
Current research for the use of HPs with batteries has the following primary problems. First, a flat HP includes the battery, is expensive, and does not have a compact structure. Second, other HP arrangements do not obtain sufficient temperature uniformity. Third, a general problem is that the direct connection of the battery pack is an inefficient use of space. Last, the battery cannot be operated with a high discharge rate or energy recuperation conditions.
This paper described the utilization of an L-type HP mounted on an aluminum plate as a bracket combination method. The heat from the battery was transferred to the aluminum plate through conduction and then from the aluminum plate to the HP, which increased the temperature uniformity across the battery. The L-shaped HP was designed to effectively connect the battery packs to reduce the required space. A high discharge current was considered to meet the performance requirements of EVs. In addition, the temperature hysteresis and energy recovery device were considered.
The first section of this paper describes the cooling process for EV batteries with an L-shaped HP combined with an aluminum plate. The second section analyzes the cooling effect of the lithium battery pack combined with the L-type HP and aluminum plate under natural convection, forced ventilation of the HP, and the HP with fins. The last section describes the conclusions.

2. Introduction of the Experimental Methods

2.1. The A123-8Ah Battery

A 48-V lithium-ion battery from A123′s is a cost-effective and compact solution to considerably enhance the fuel economy for micro-hybrid vehicle applications [45]. The 48-V battery pack is comprised of 14 A123 8 Ah batteries. The parameters for the battery pack are shown in Table 1, the battery cell is shown in Figure 1a, and the 48-V battery pack is shown in Figure 1b. The battery is lightweight and has a large discharge rate.

2.2. Cooling System

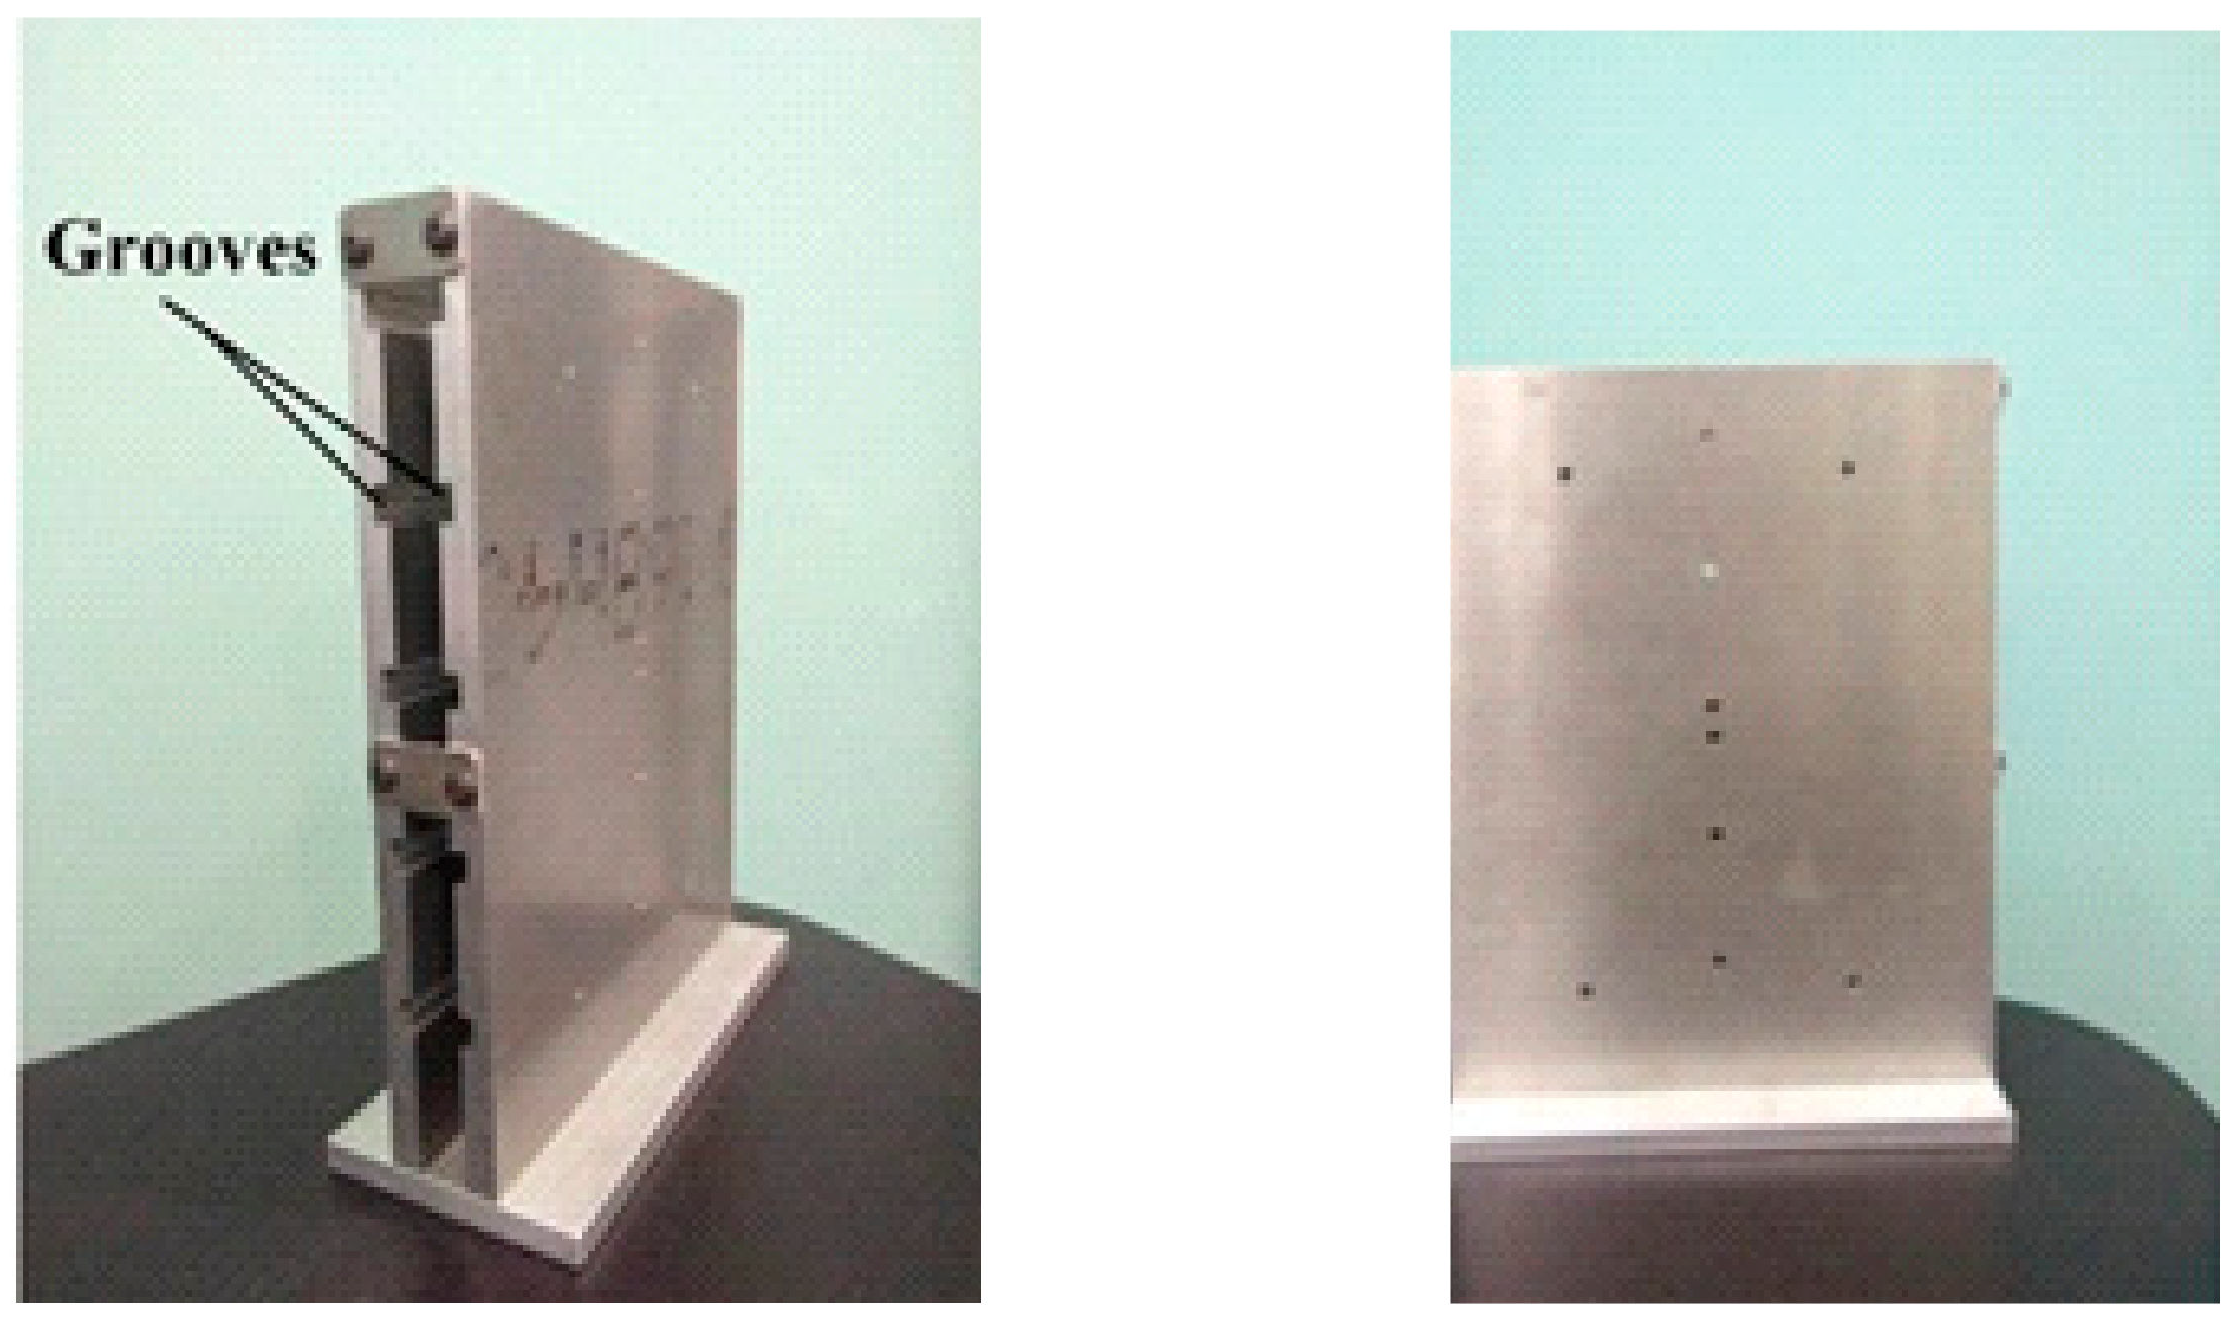
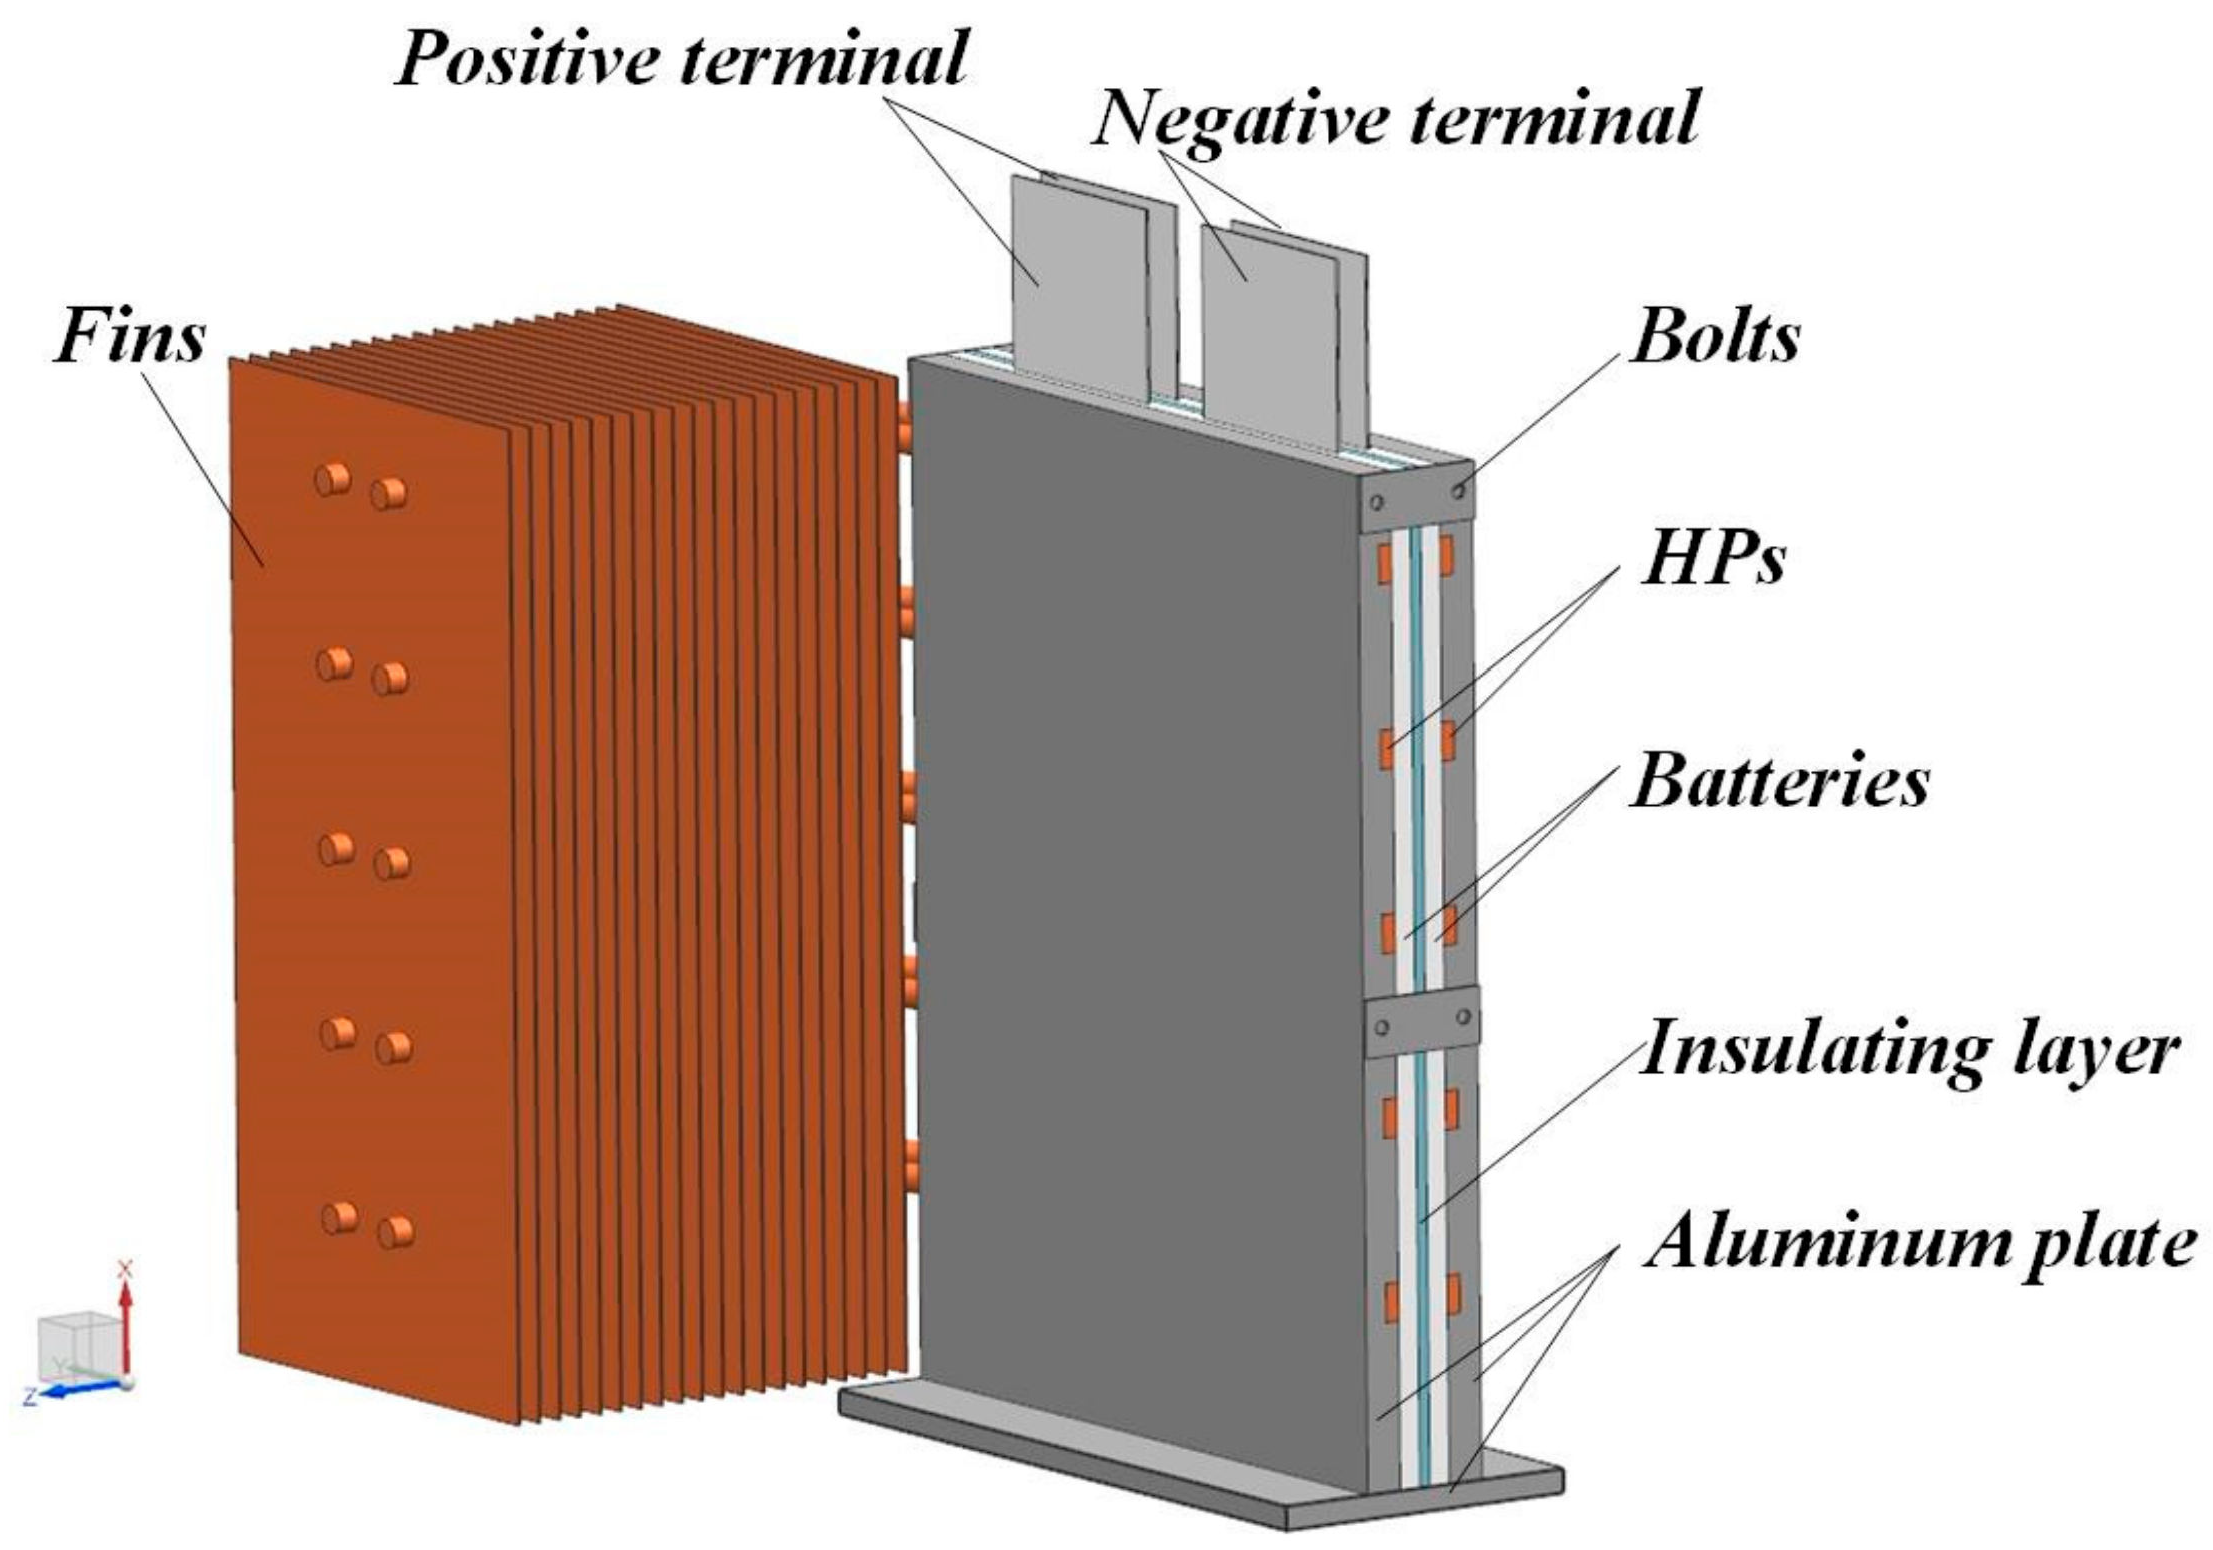
The proposed system couples the HPs and the aluminum plates to remove heat from the soft-pack-type lithium-ion batteries. The aluminum plate was of the 1060-type with a thermal conductivity of 155   W / m . K and hardness of 95HB. A groove was opened along the thickness direction of the aluminum plate to embed the HP in the plate, as shown in Figure 2. The HP was evenly coated with thermal silica (FN8220, thermal conductivity 2.0   W / m . K ) to reduce the thermal resistance from the air, which can impact the test results. In addition, fins were added to the condensation section of the HP to enhance its heat dissipation capability. The fins were made of copper with a thermal conductivity of 400   W / m . K ). The thermal conductivity ( k e = 57,129.8   W / m . K   k c = 30,343.21   W / m . k ) of the HP was obtained by calculating the thermal resistance [17,46]. The dimensions of the aluminum plates, fins, and HP are shown in Table 2, and the entire cooling system diagram is shown in Figure 3.

2.3. The Equipment of the Experiments

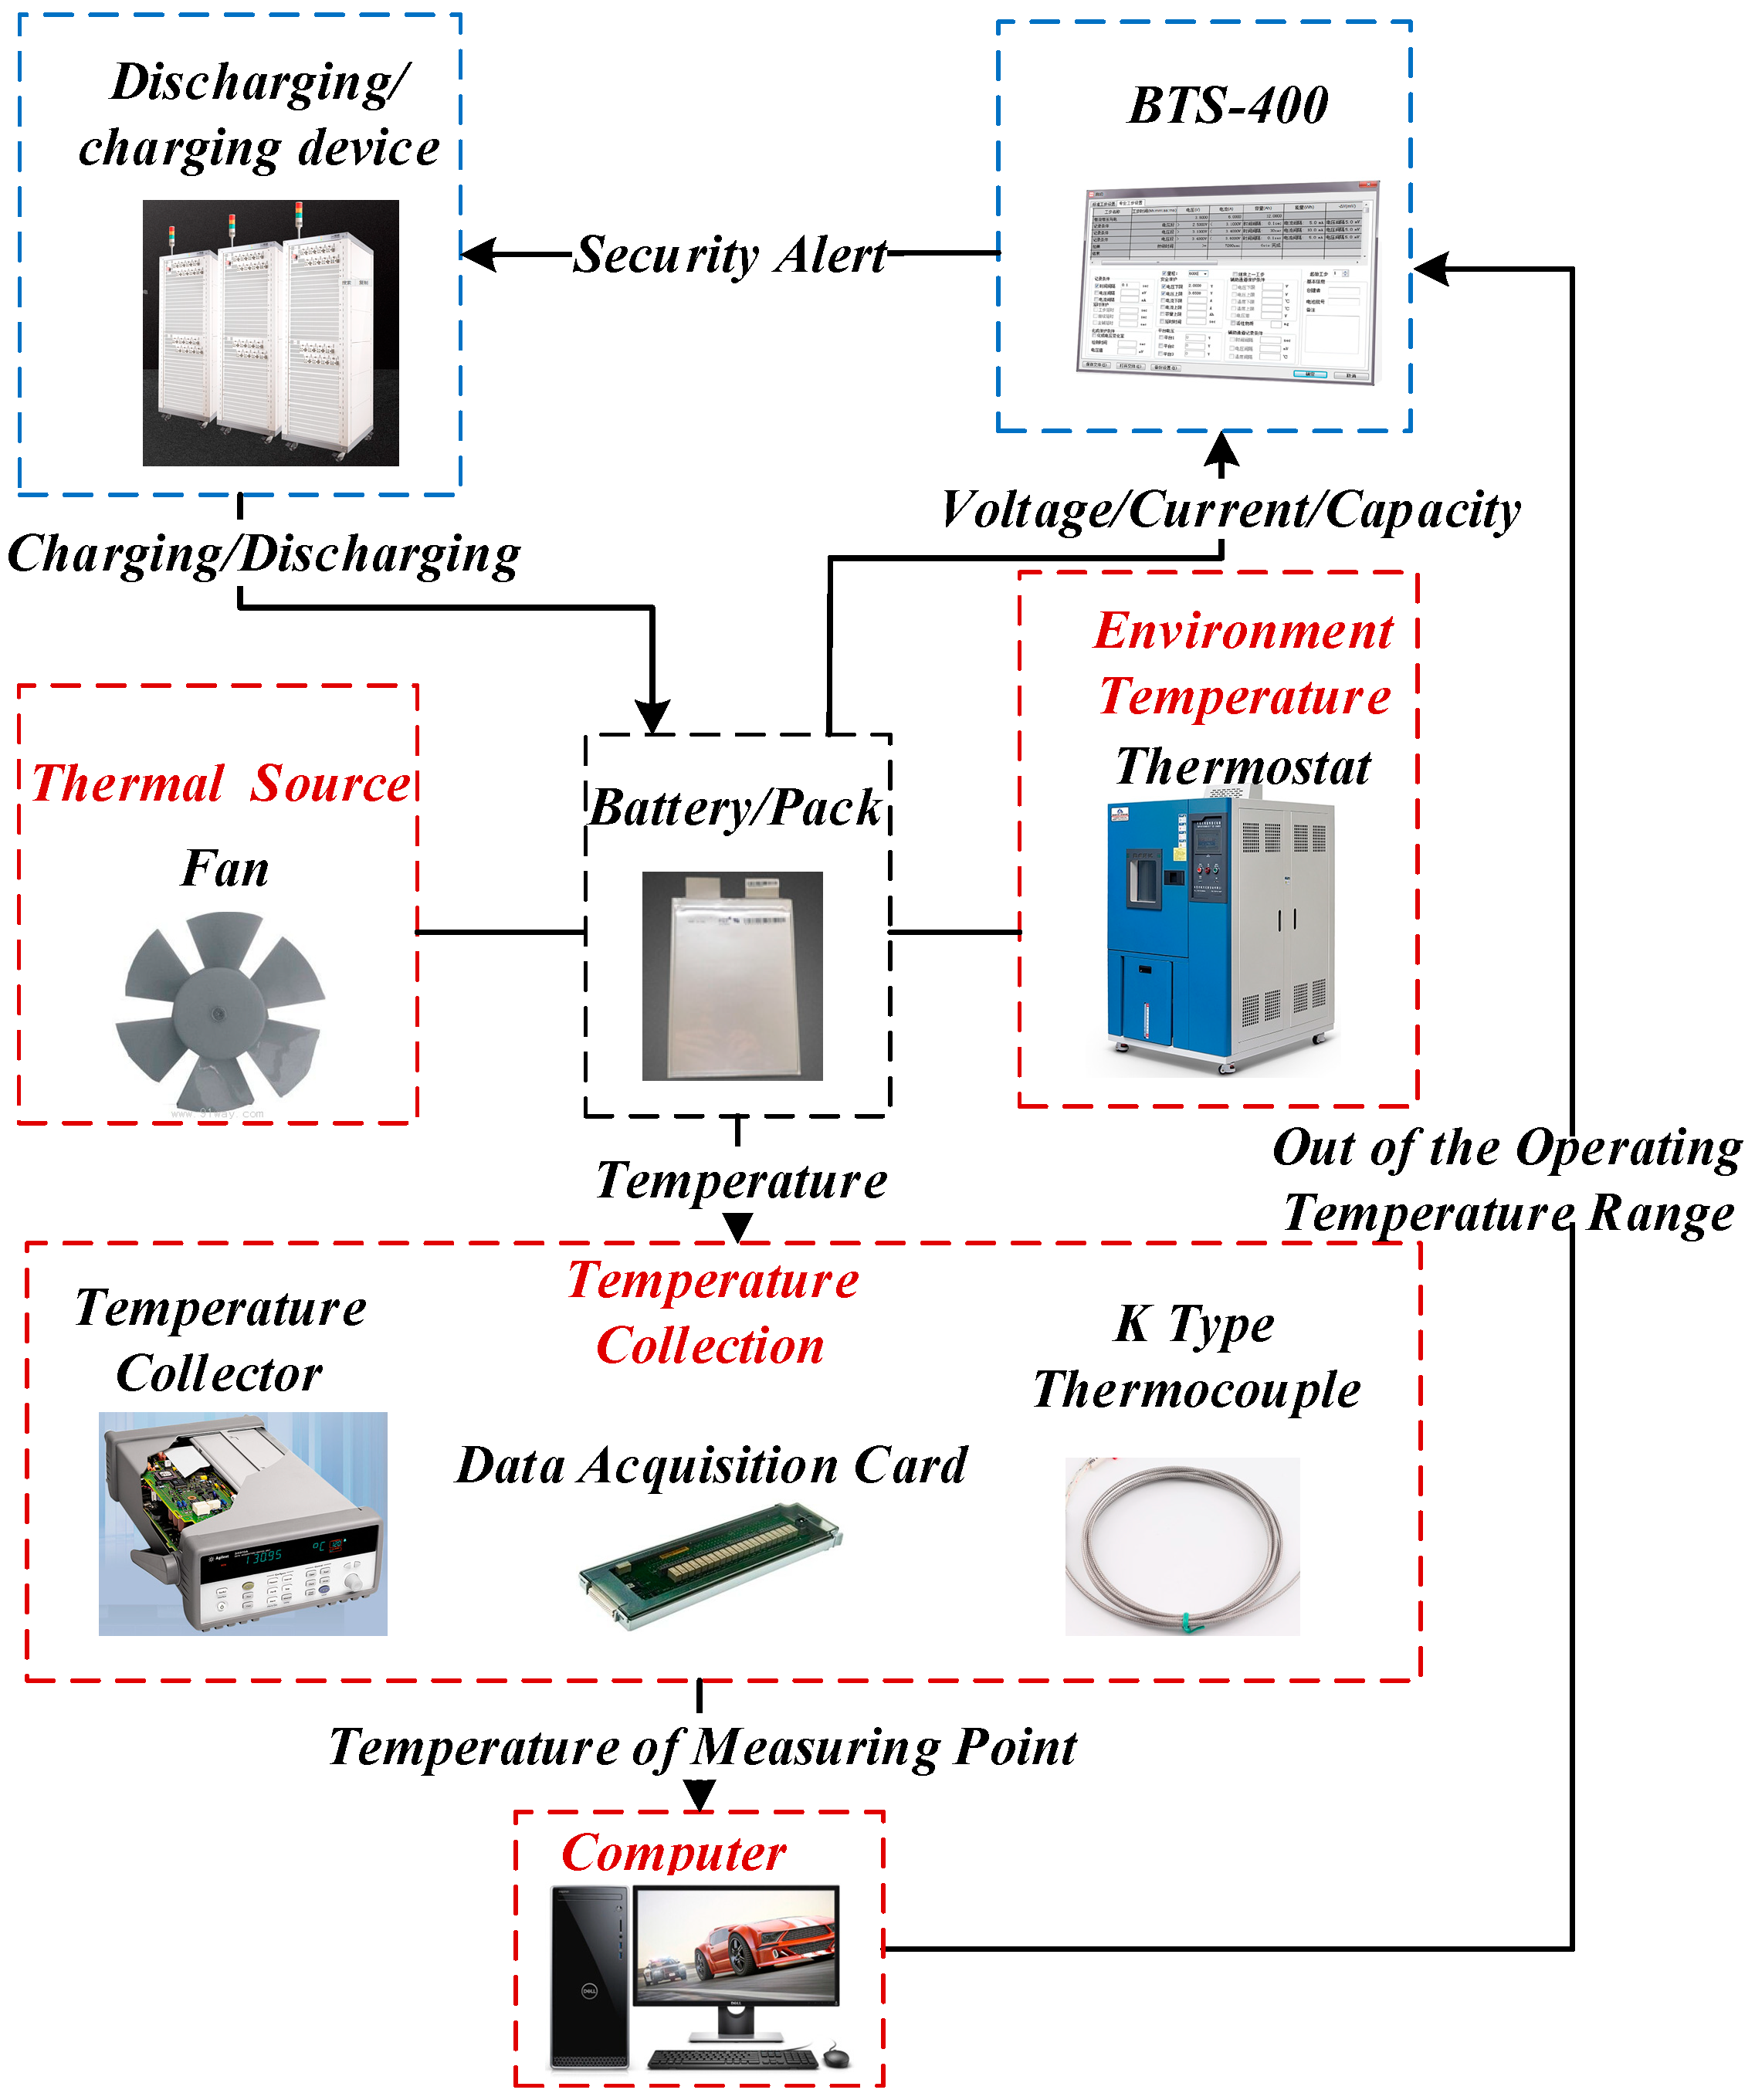
The BTMS was placed in a thermostatic test chamber (CK-150 g ± 0.5 °C) to control the battery temperature. The battery detection system (BTS-400) had an independent constant current source and constant voltage source for the battery charge and discharge experiments. The temperature of the battery was measured using an Agilent Model 34,972 Temperature Collector (±0.004%), 34,908 Data Acquisition Card, and K-type Thermocouples (±0.75%   ×   T ). The accuracies of the devices are shown in Table 3. Based on the Kline-McClintock analysis [47], the uncertainty in the temperature of the battery surface measured in this experiment is 0.75 % .
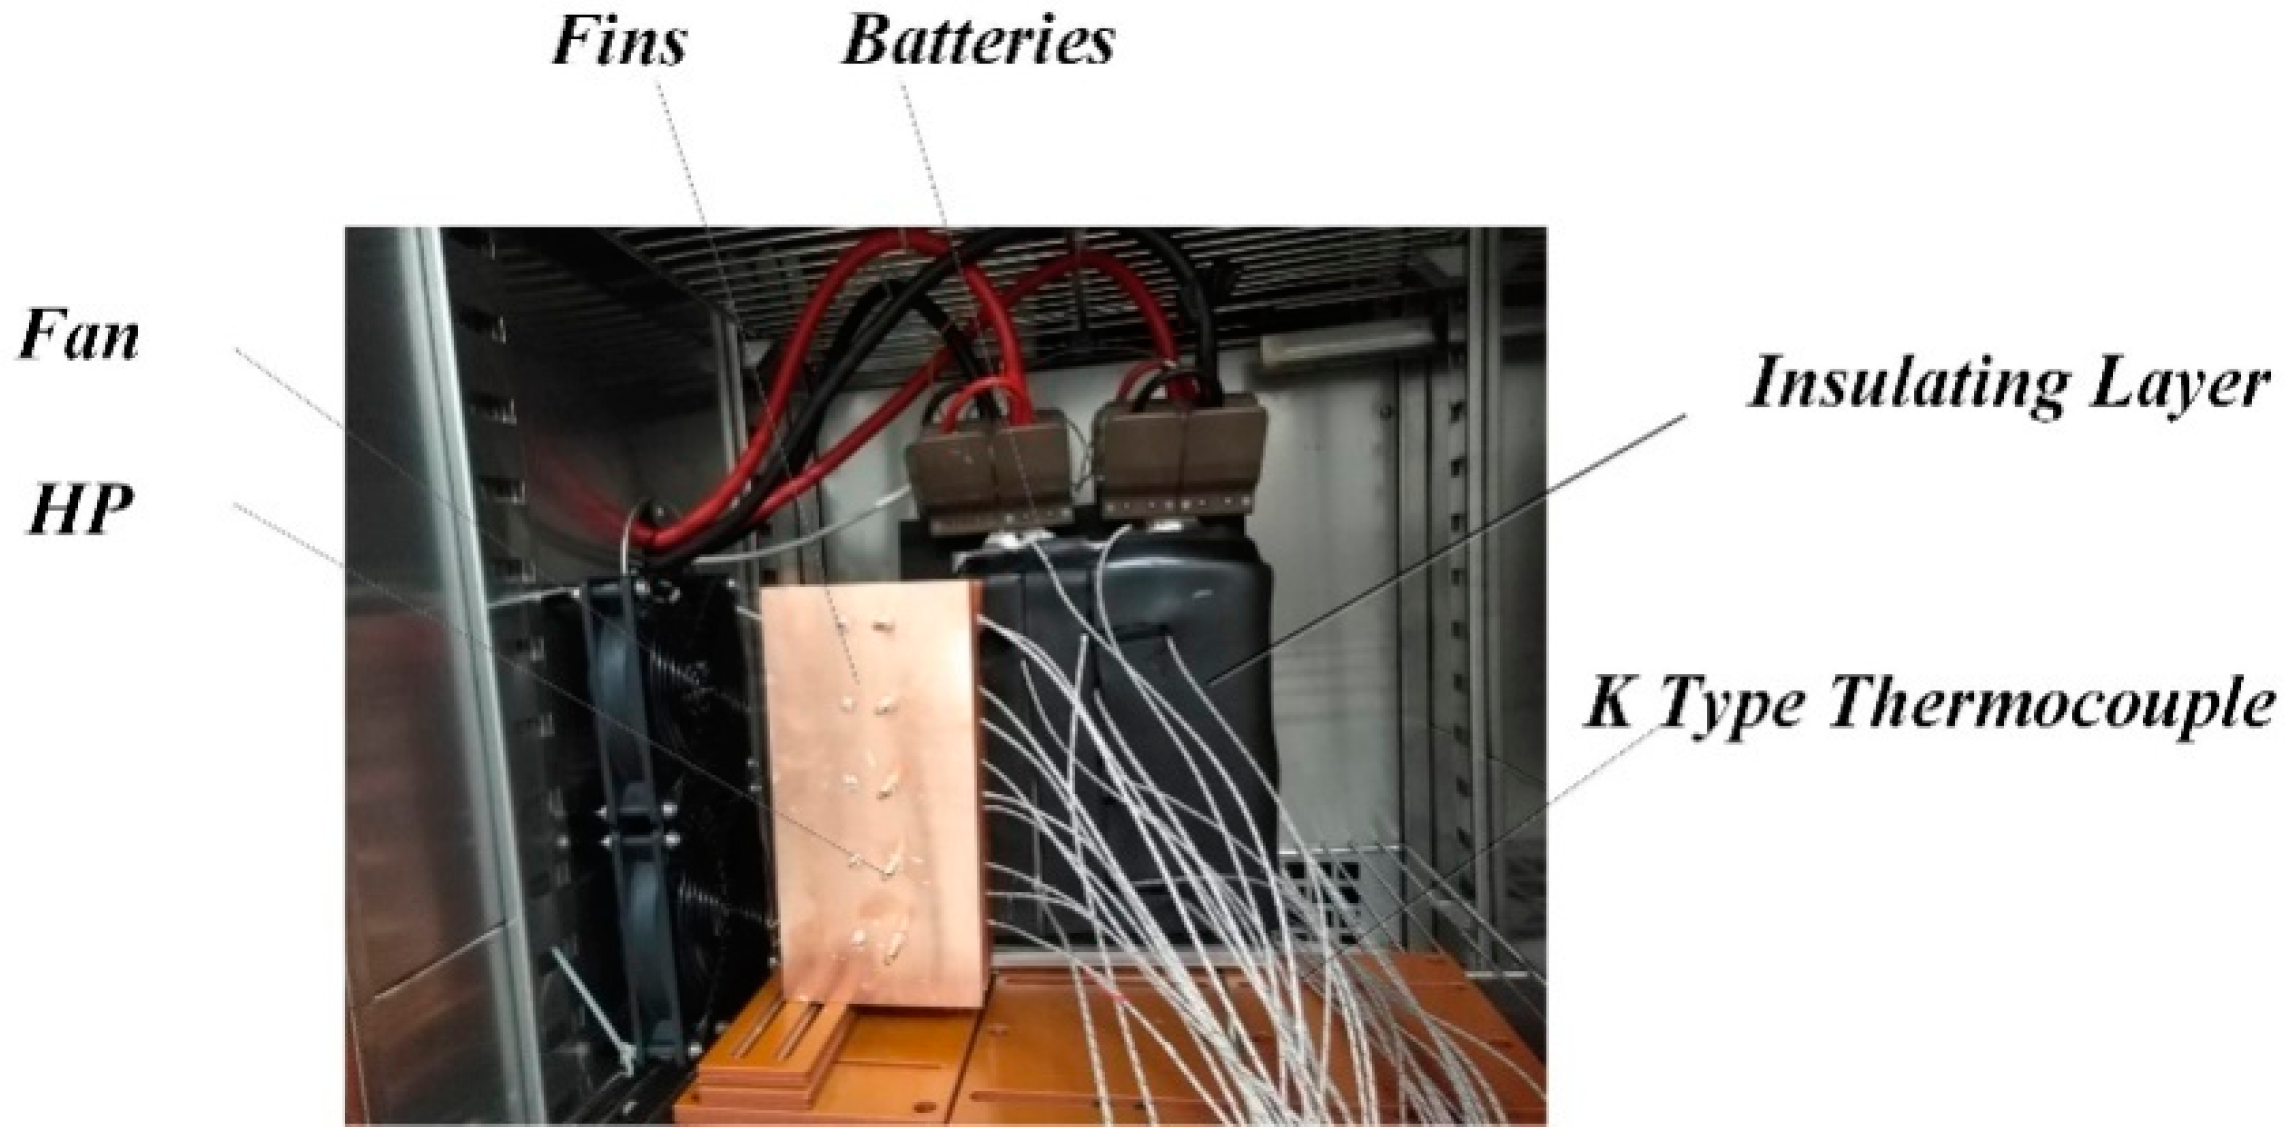
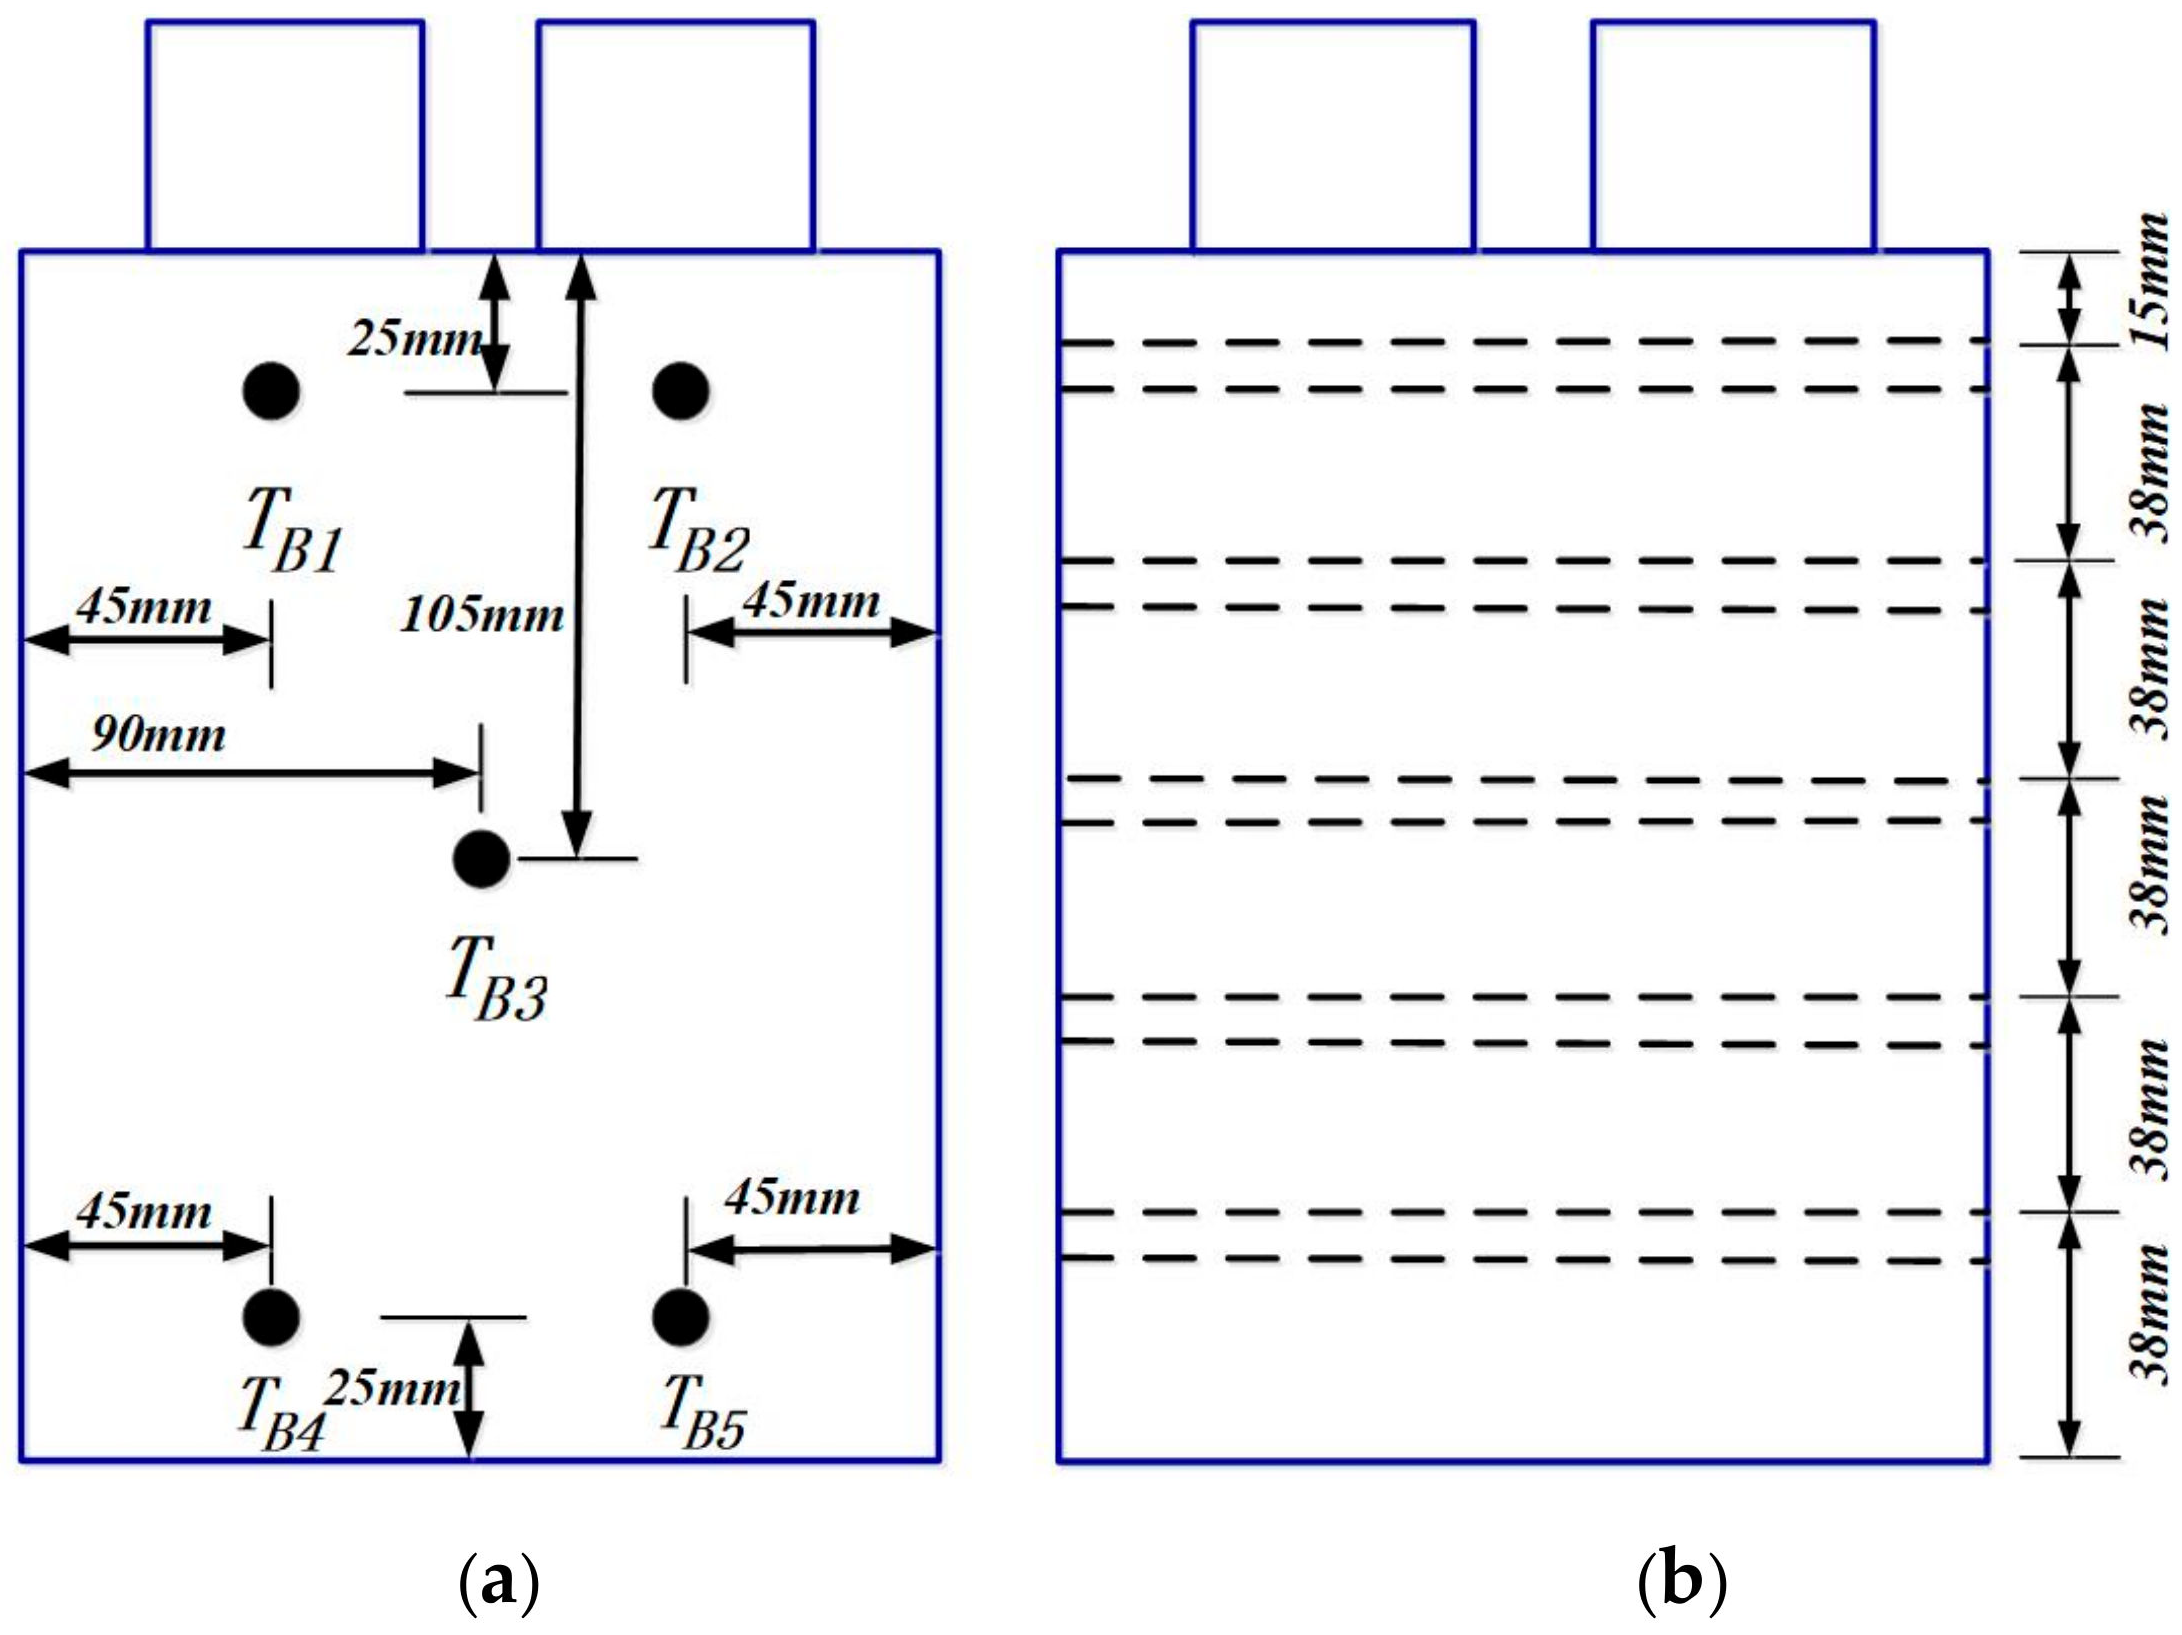
A schematic diagram of the experimental setup is shown in Figure 4. The red dotted boxes represent the temperature control system, and the blue dotted boxes represent the charging and discharging system. The specific experiments are shown in Figure 5, the measurement points for the battery surface temperature are shown in Figure 6a, and a schematic diagram of the HP is shown in Figure 6b.

2.4. Content of the Experiment

The effects of the ambient temperature on the surface temperature and temperature uniformity for a constant current discharge at 17, 27, and 37 °C with discharge currents of 50, 75, and 100 A were considered. In addition, the effects of the temperature hysteresis and internal resistance on the battery temperature were considered by designing a pulse cycle test with discharge depths for the state-of-charge (SOC) of 0.2, 0.5, and 0.8.

3. Analysis of Results

3.1. Analysis of Discharge Experiment

3.1.1. Effects of Discharge Rate on the Experiment

In the HPWF, the discharge currents were 50, 75, 100 A, and the temperature at the battery center ( T B 3 ) is shown in Figure 7. The results indicate that the surface temperature of the battery increases with the discharge current. At larger currents, more heat is released per unit time, the slope of the temperature curve increases, and the final temperature is larger while the battery discharges. At 37 °C, the final temperature of the battery with 50, 75, and 100 A was 38.1, 38.6, and 39.0 °C, respectively. Larger battery surface temperatures deteriorate the uniformity of the temperature. The battery is maintained at the optimal operating temperature range. At ambient temperatures of 27 and 17 °C, the temperature at the center of the battery under the different current rates increased by 2.2, 3.0, and 3.4 °C, and 2.7, 3.7, and 4.4 °C, respectively. The high-temperature environment of the HP decreases the flow resistance of the internal fluid, indicating the heat conductivity of the HP is better at higher temperatures. Therefore, when the ambient temperature is low, there is a greater increase in the temperature of the battery surface compared with high ambient temperatures.
Another parameter that determines the heat dissipation performance of a battery is its temperature uniformity Δ T max .
Δ T max = max ( T Bi ) min ( T Bj ) i = 1 , 2 , 3 , 4 , 5 . j = 1 , 2 , 3 , 4 , 5 .
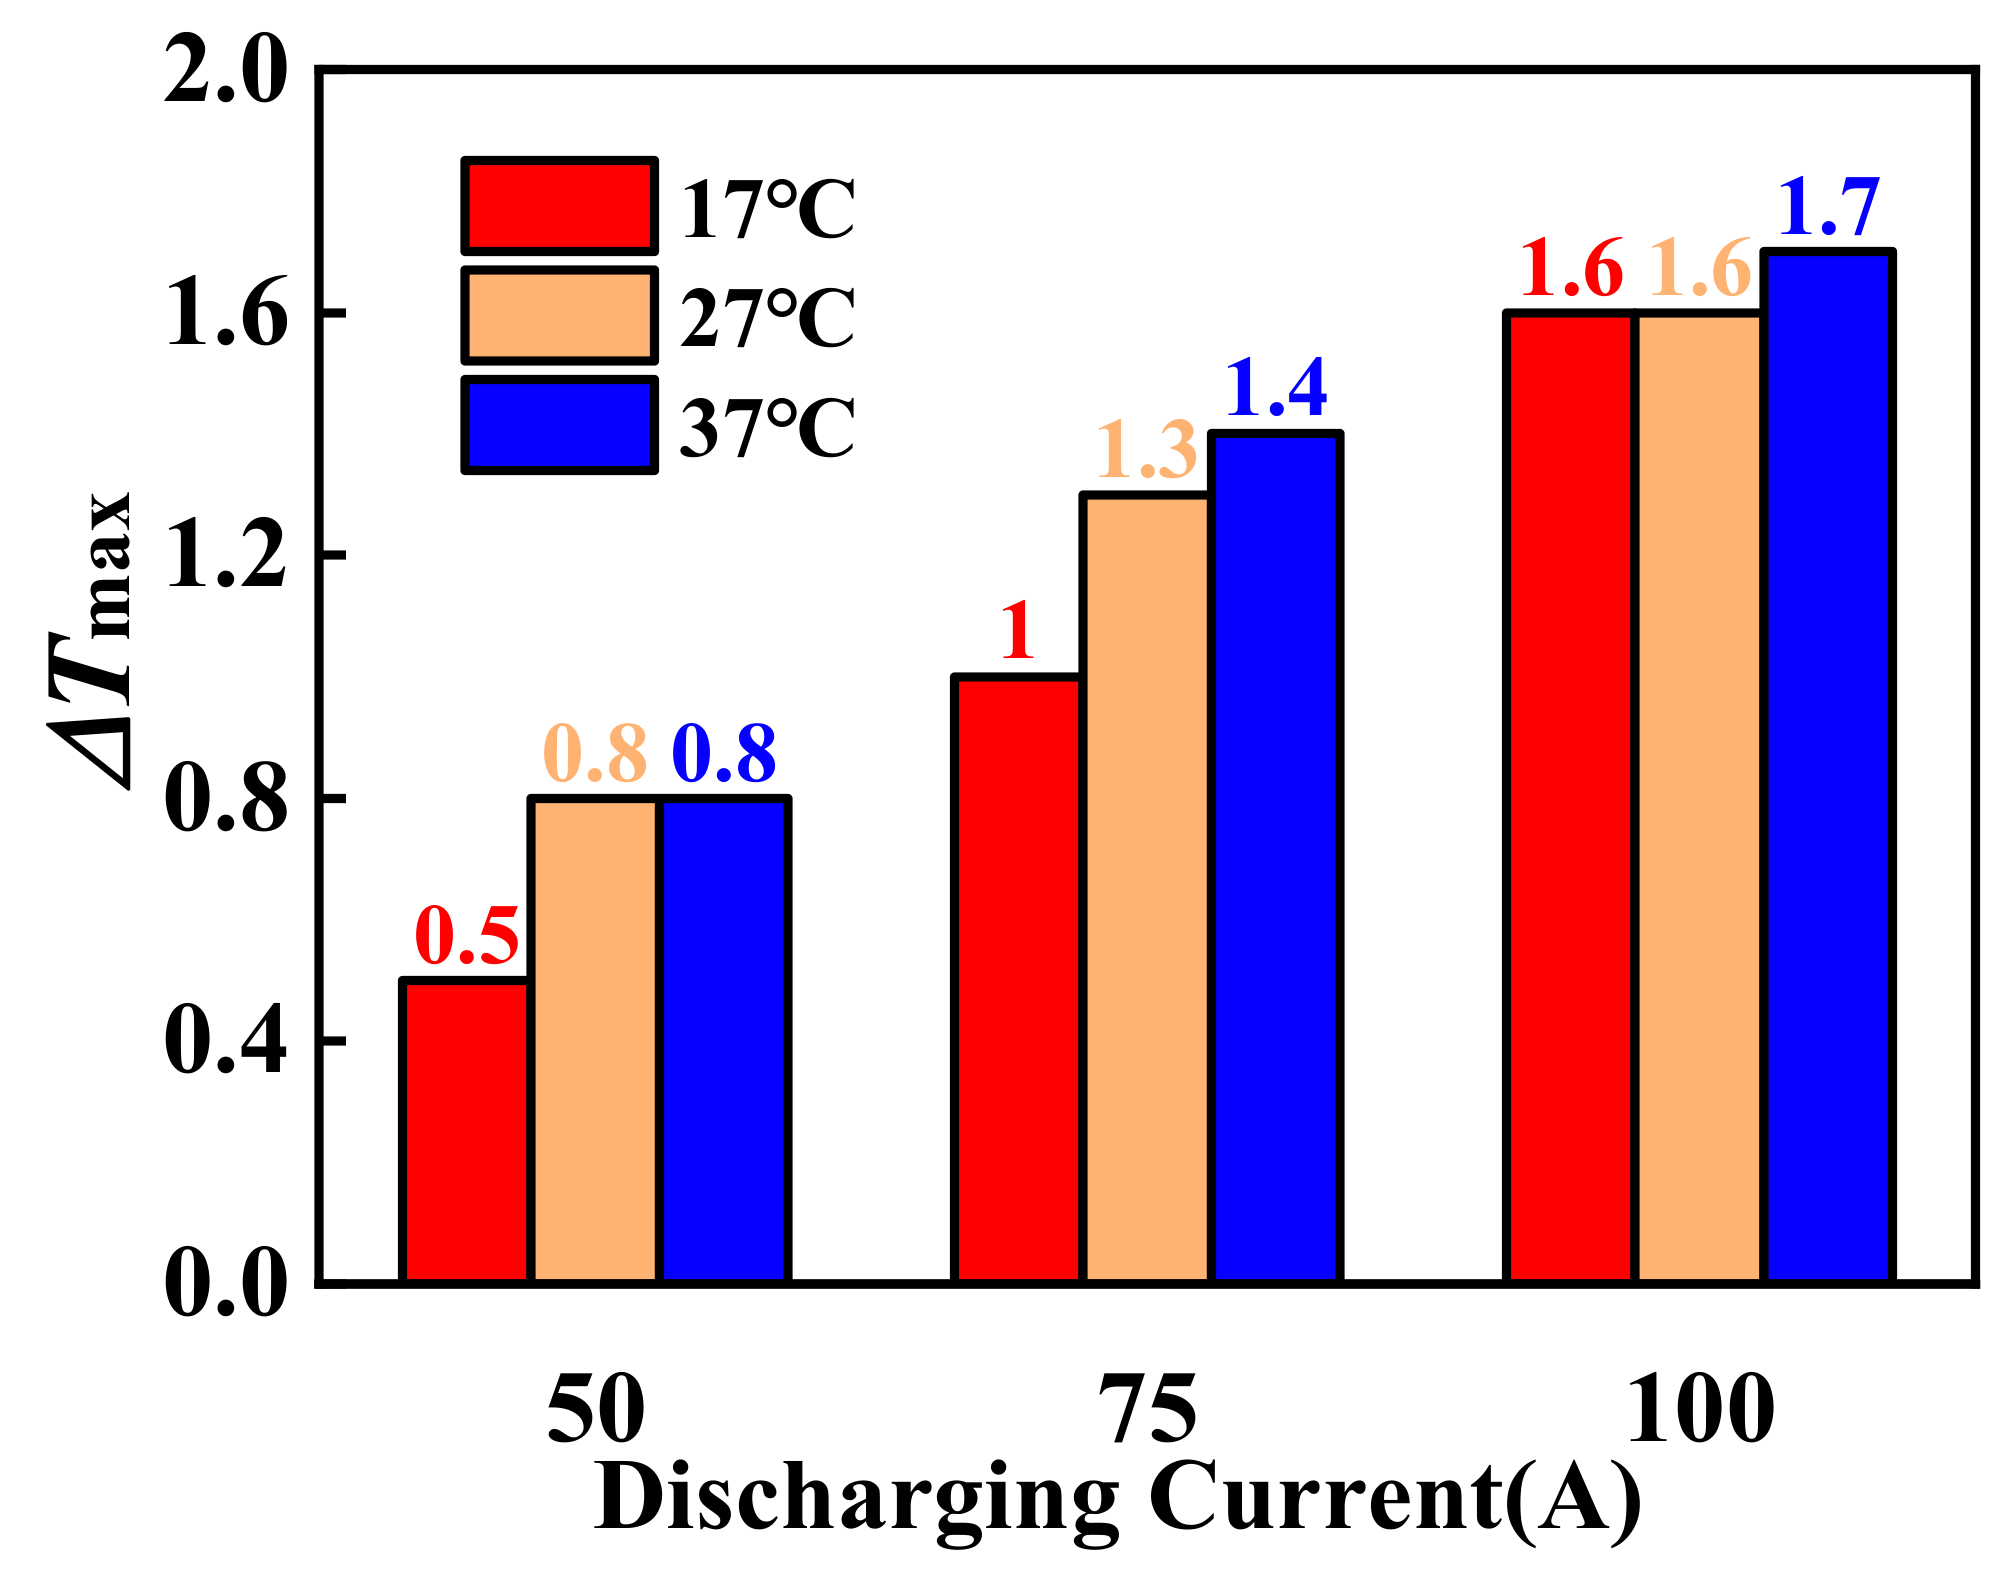
The average temperature of the battery during the discharge process is shown in Figure 8. When the current is discharged at 50, 75, and 100 A, the battery Δ T max increases with the current. When the ambient temperature is 37 °C, the maximum temperature differences on the surface of the battery were 0.8, 1.4, and 1.7 °C, respectively. At an ambient temperature of 17 °C, the maximum temperature differences on the surface of the battery were 0.5, 1.0, and 1.6 °C, respectively. When the discharge current was 100 A, the battery Δ T max were 1.6, 1.6, and 1.7 °C at ambient temperatures of 17, 27, and 37 °C, respectively. In addition, as the discharge current increases, the effect of the environmental temperature on the battery Δ T max is reduced.

3.1.2. Effects of Heat Dissipation on the Experiment

In the experiments, the HP and HPWF were used to dissipate heat, and the batteries were tested separately under natural convection. In this case, one side of the battery was measured while the other side had 3-mm thick insulation. The thermal materials were the same as the spacer layer in the two batteries for the thermal management with HPs, as shown in Figure 9a. Differing from the pack experiment, the heat exchange between the batteries was measured using a FLUKE-TiS55 ( T × 2 % ) thermal imaging camera during the discharge process. The results are shown in Figure 9b. Except for the electrodes, the temperature differences on the surface of the battery are less than 0.5 °C, suggesting that the insulation layer has good insulating properties. There was no effect on the battery temperature with the battery packs.
Table 4 shows the experimental conditions for different heat dissipation methods. During constant current discharging, the heat was dissipated using HP and HPWF methods. The temperature with the HPs increased more than the HPWF by 0.2 °C. In the case of natural convection, when the battery is discharged at 50, 75, and 100 A, the surface temperatures of the battery were 41.0, 42.7, and 43.8 °C, while the optimal temperature range of the battery is 25–40 °C. Therefore, the battery temperature was always greater than its optimal operating temperature range. For HP heat dissipation, at the end of the 100 A discharge, the surface temperature of the battery was below 40 °C.
As the discharge current increased, the temperature uniformity of the surface of the battery deteriorated. For example, At 100 A, the surface uniformities of the batteries for the HP and HPWF methods were a Δ T max of 1.8 and 1.7 °C, respectively. For natural convection, the battery Δ T max was 6.0 °C, which is higher than the surface temperature difference of the battery by 5 °C.

3.2. Experimental Analysis of Pulse Cycling Process

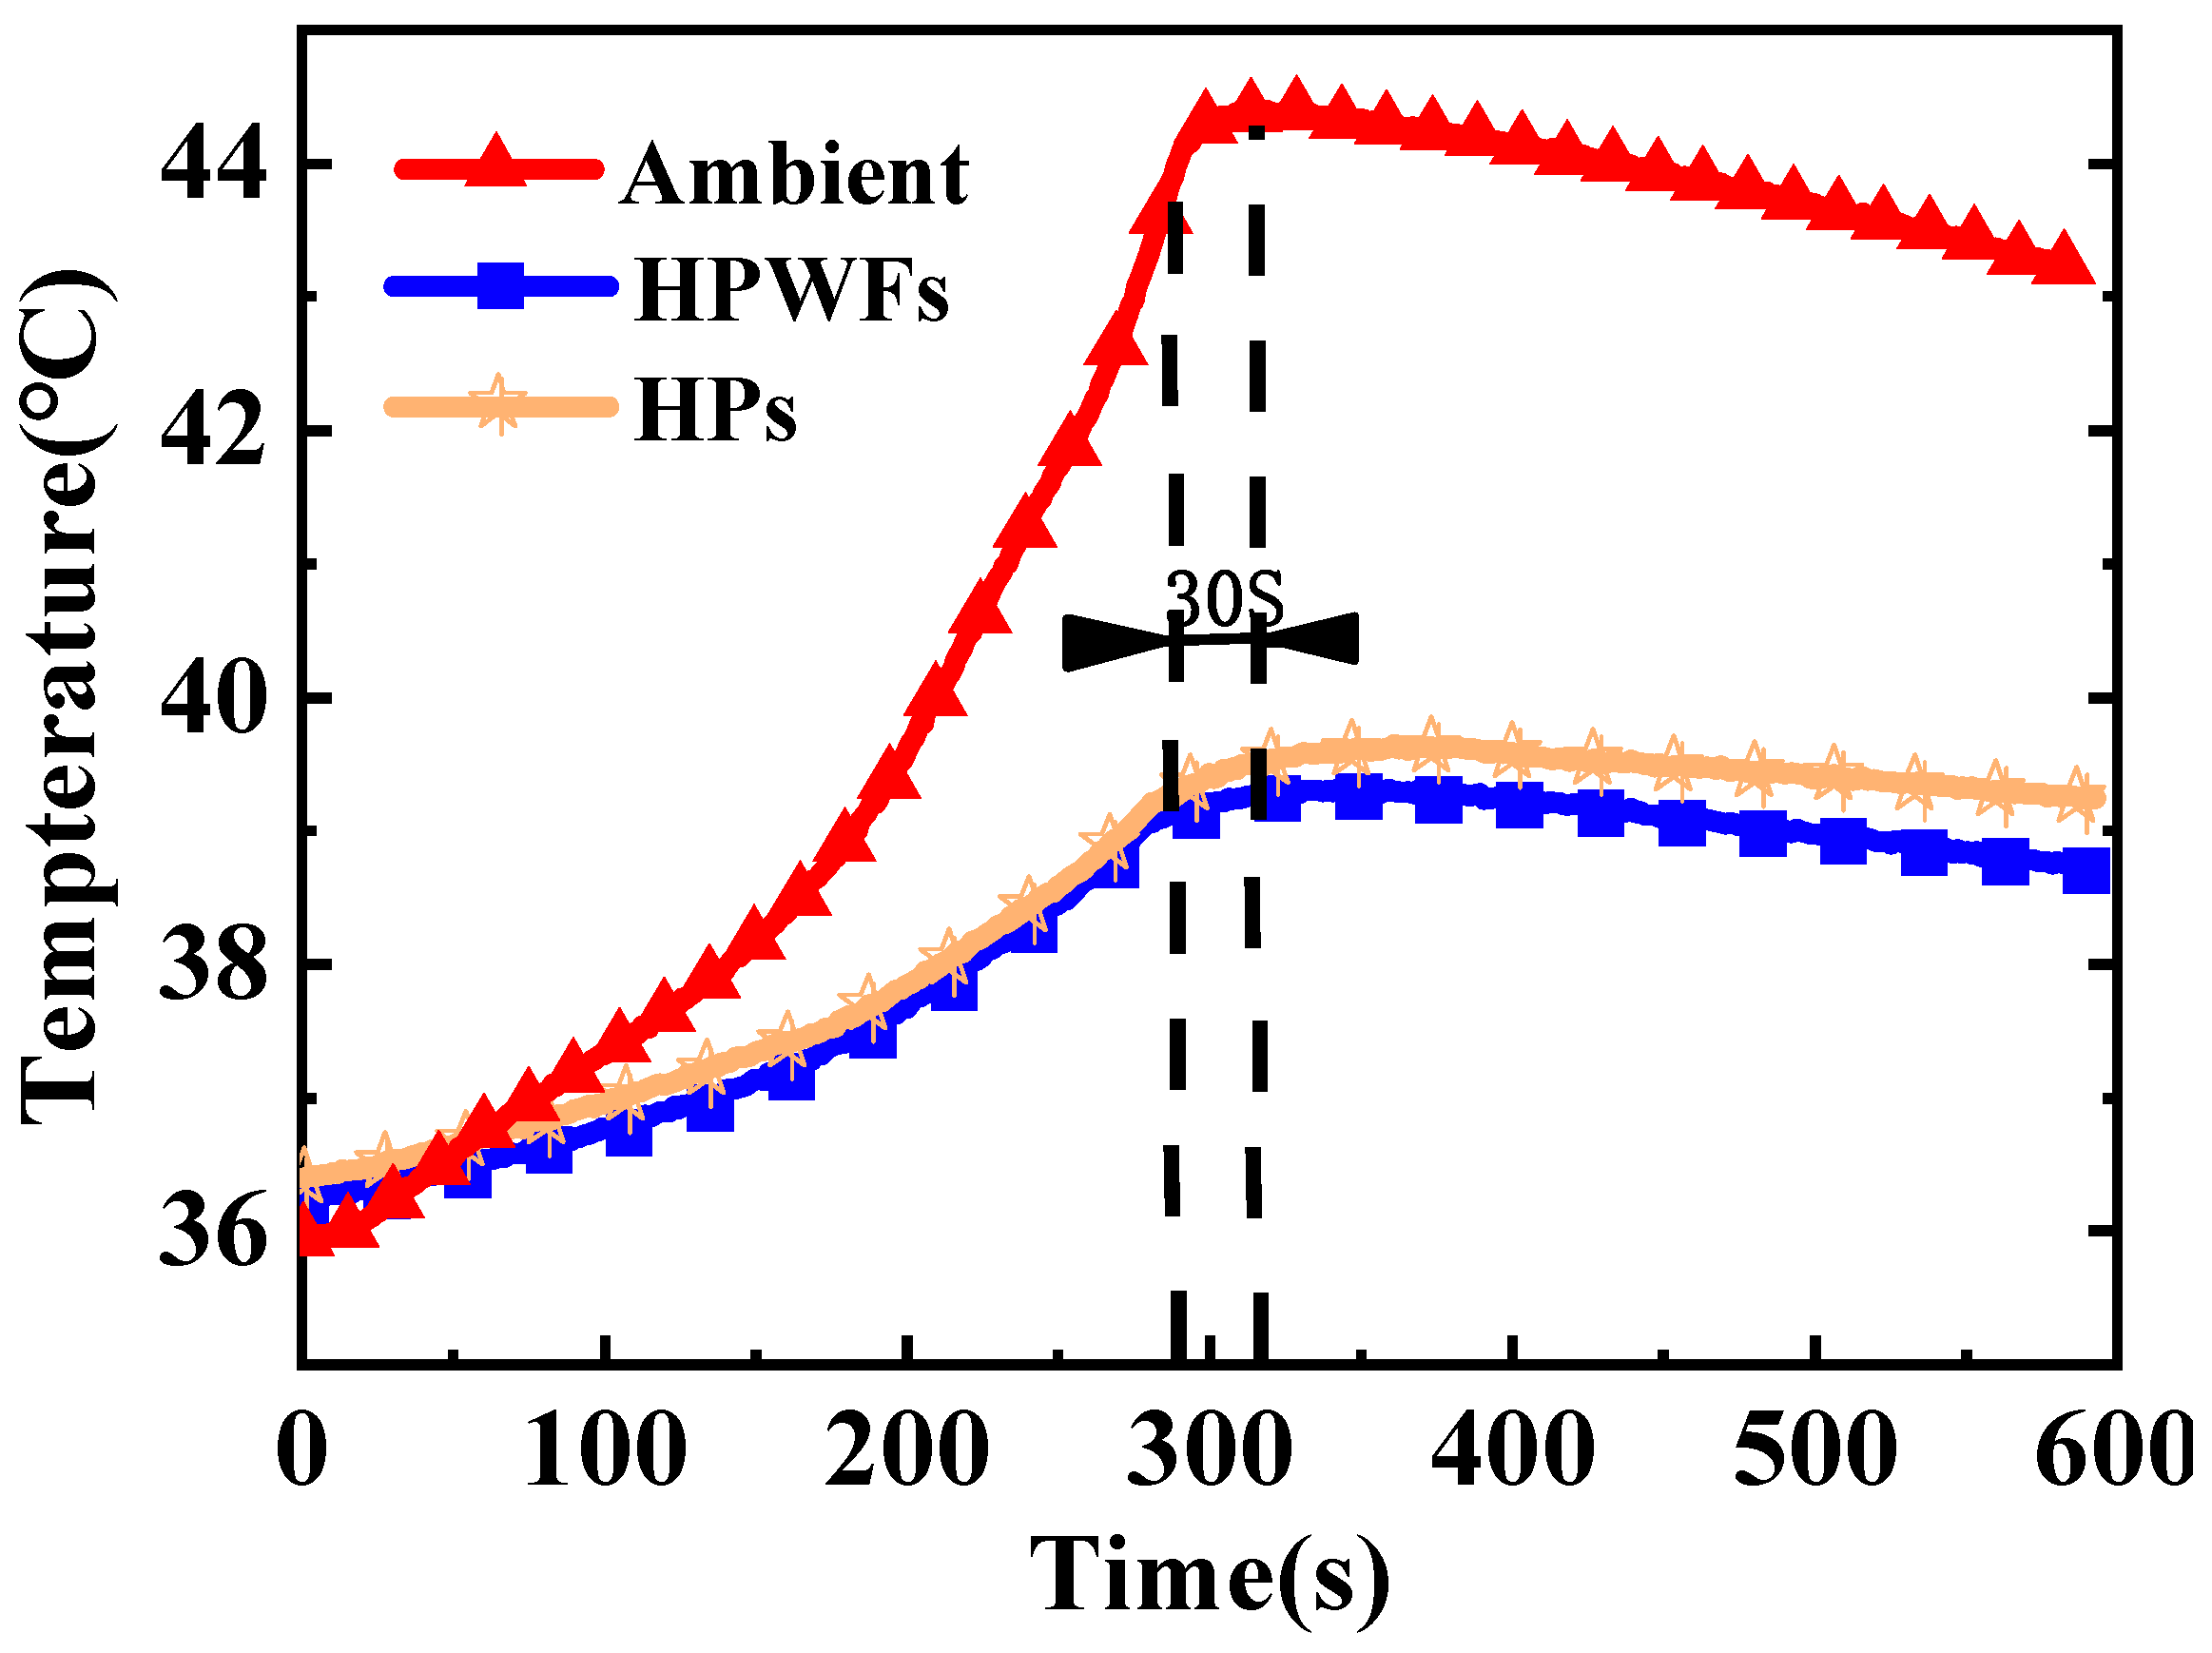
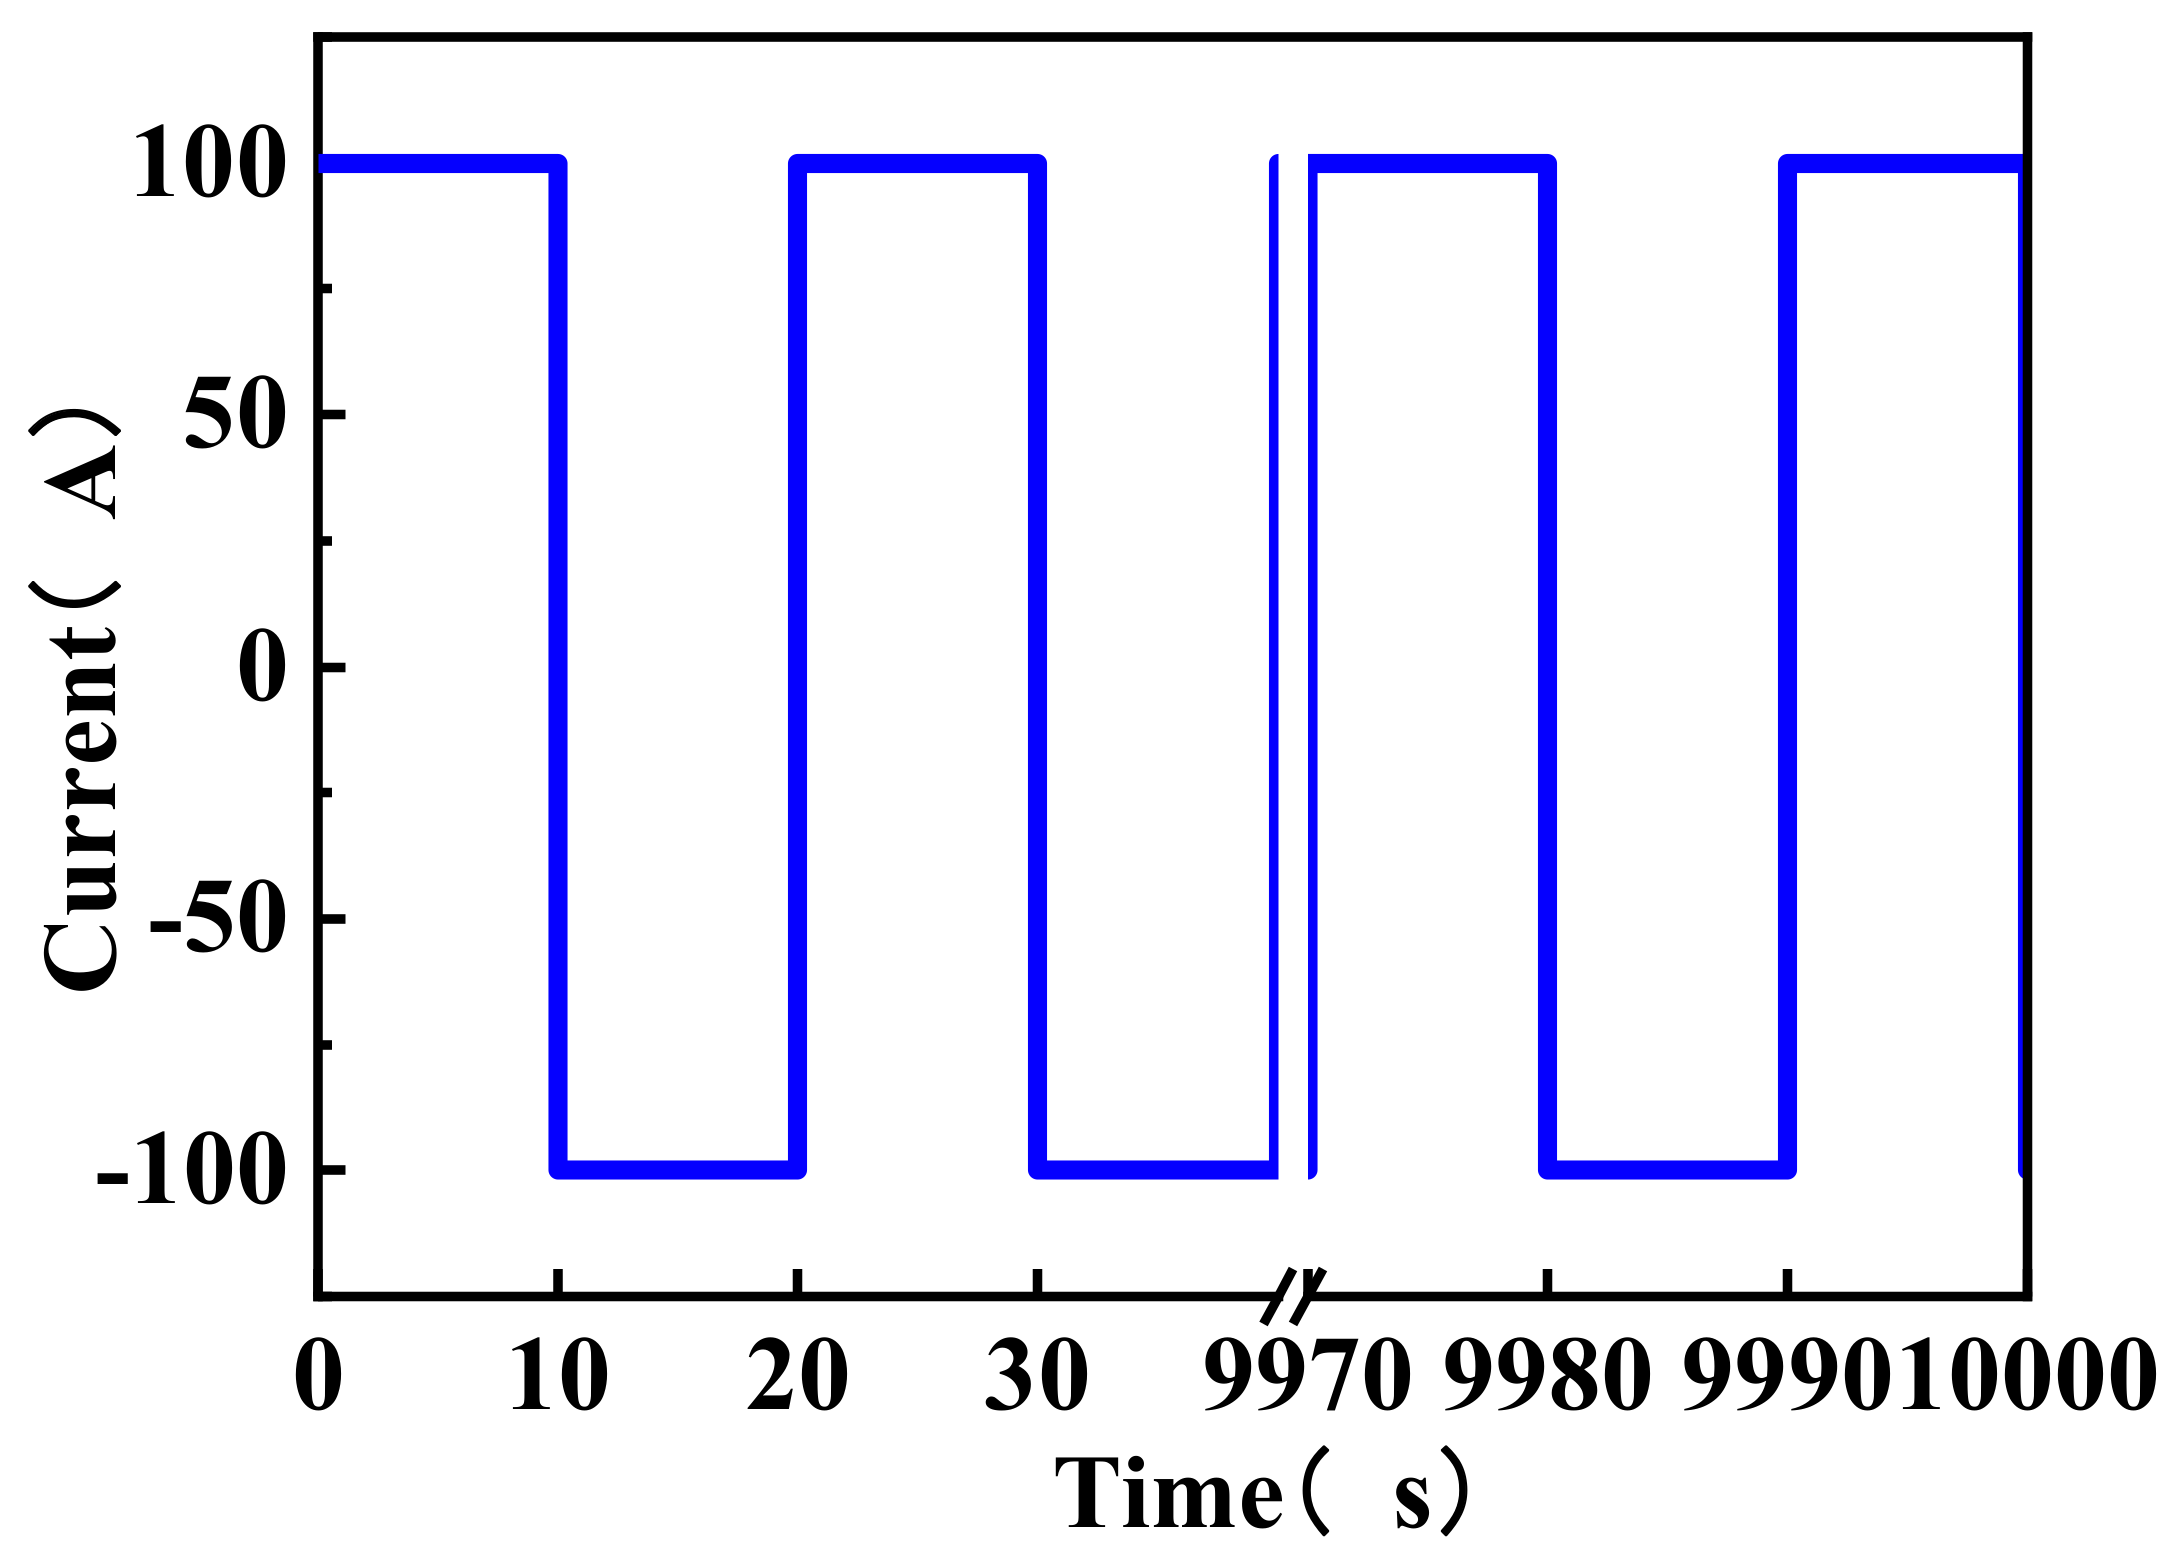
The operation of an electric vehicle includes an energy recovery device, which causes the battery to have a non-uniform discharge. The heat released from the battery during actual operations is also much greater than the heat of the constant current discharge. In addition, because the battery has a heat storage capacity, the temperature of the battery is maximized after the discharge. As shown in Figure 10, the case of natural convection showed that the temperature of the battery after discharging completely for the 30 S battery reached a maximum of 44.4 °C, which is 0.6 °C higher than the end temperature of the battery. In addition, the surface temperature of the batteries for the HP and HPWF methods increased by 0.5 and 0.3 °C, respectively. In this paper, the pulse cycle experiment was designed to have alternating charging and discharging cycles to better simulate the heat dissipation of a car battery. In addition, the battery can dissipate heat for a long time, which reduces the effect of its heat storage. The specific pulse cycle experiment is shown in Figure 11. The pulse cycle of the battery discharges it to a fixed SOC with a constant current of 8 A. The battery is then discharged with a constant current of 100 A for 10 s before charging at a current of 100 A for 10 s. The total time of this experiment is 10,000 s.

3.2.1. Effects of Heat Dissipation on Pulse Circulation

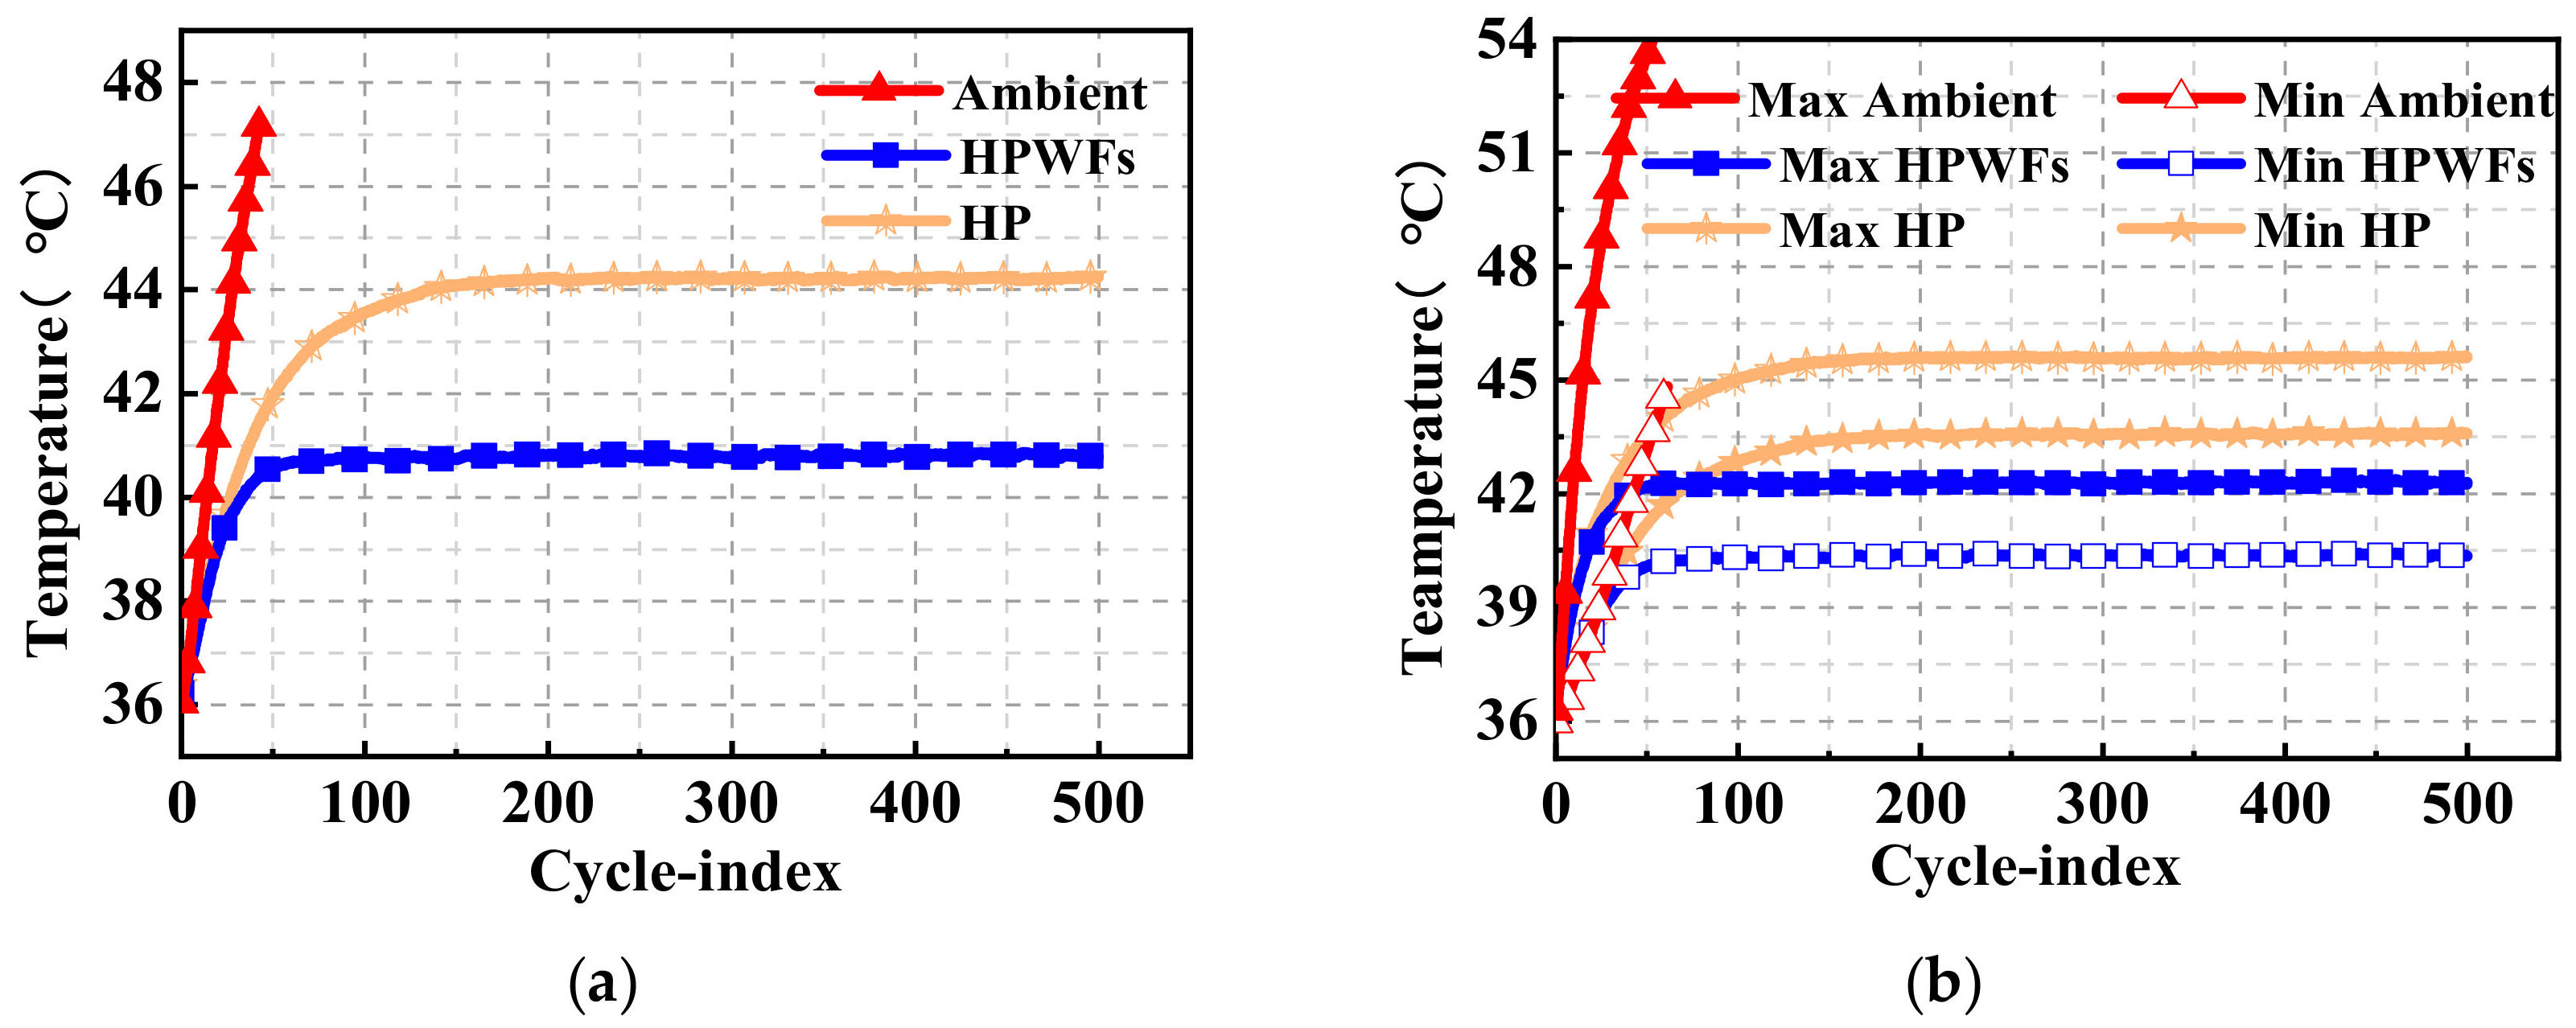
Figure 12 shows the effects of different heat dissipation methods with an SOC of 0.5 for the pulse cycle experiment at an ambient temperature of 37 °C. For the HP heat dissipation, the battery reached a steady temperature state after running for 131 cycles. Under the HPWF condition, the temperature of the battery reached a steady state after 44 cycles, and the center temperature of the battery finally stabilized to 40.8 °C. For the HP heat dissipation, the surface temperature rise of the battery was 7.9 °C, which exceeds the optimal operating temperature by 4.3 °C. However, for natural convention, the temperature reached 48.1 °C, and the maximum surface temperature of the battery was higher than the battery working temperature limit of 55 °C after 39 cycles. Figure 12b shows that in the ambient, HP, and HPWF conditions, gave Δ T max values of 10.5, 2.6, and 2.5 °C, respectively. The fins helped to stabilize the battery more quickly and at a lower temperature. For the temperature uniformity condition, compared with ambient and HP conditions, the HPWF had a Δ T max that was lower than 0.1 °C and higher than 8.0 °C. Therefore, the fins provide a better temperature uniformity, making these an important component to improve the heat dissipation of the condensation as the battery temperature increases.

3.2.2. Effects of the Discharge Depth on Pulse Circulation

The heat generation model for a general-purpose battery is based on Equation (1). As the discharge current increases under normal conditions, the heat generation capacity of the battery increases with the current, and the temperature of the battery increases exponentially. The Ohmic and polarization resistances are key contributors to the heat generation model, which change with discharge depth.
Q t o t a l = I I R j + R p + T d E o c d T
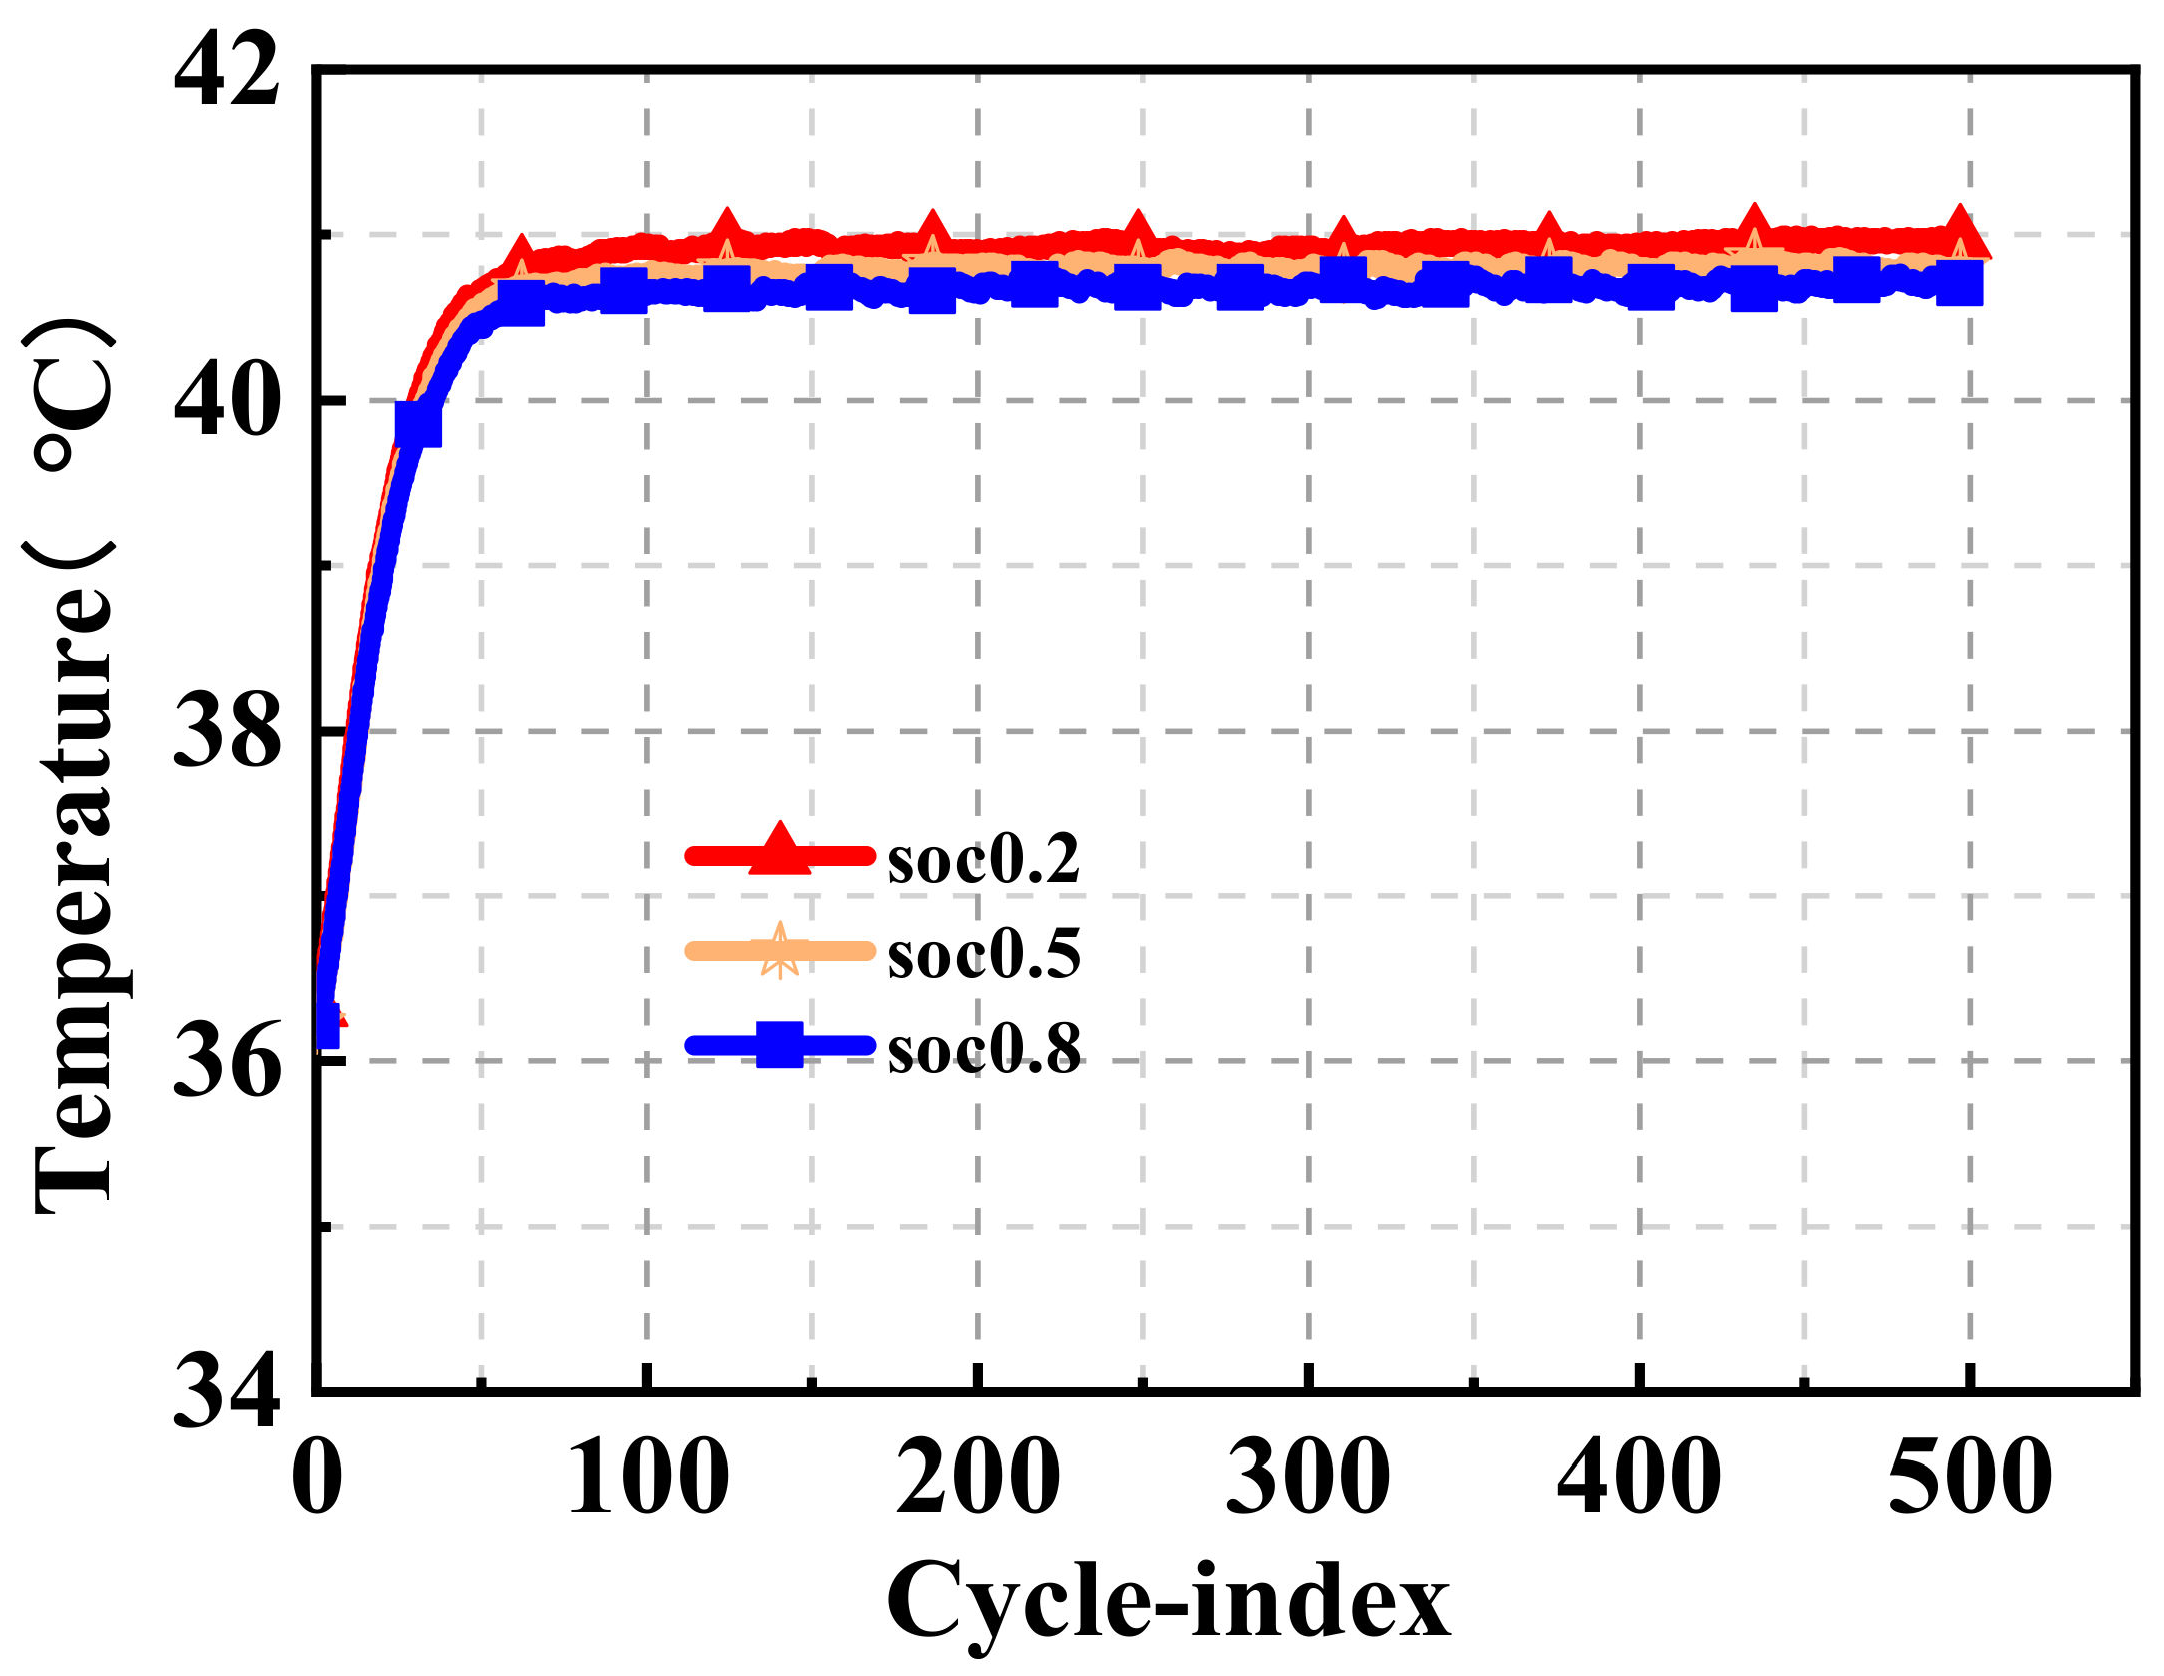
Figure 13 shows the pulse cycle of the battery at an ambient temperature of 37 °C. Different discharge depths affect the Ohmic and polarization resistances of the battery. In the lithium iron phosphate tab battery, the resistance increases with an increased discharge depth. Consequently, as the discharge depth increases, the surface temperature of the battery also increases. Lastly, when the SOC is 0.2, the surface temperature of the battery was 41.0 °C. In contrast, at an SOC of 0.8, the temperature of the battery surface was 40.7 °C. The maximum temperature difference of the battery under different discharge conditions was 0.3 °C. As a result, using the HPWF method can mitigate the effects of changing resistances in the battery.

4. Conclusions

Considering that the battery emits a significant amount of heat during the high-rate charging and discharging processes, this paper proposes a cooling method based on a combination of an aluminum plate with HPs. The experimental method considered high discharge rates with pulse cycle tests. In addition, the results of two heat dissipation methods of HP and natural convection were compared. The conclusions are drawn as follows.
1. In this system, the working performance of the HP is affected by the temperature. As the ambient temperature increases, the heat dissipation from the HPs increases and the rate of temperature increase of the battery is reduced. As the discharge rate grows, the temperature of the battery surface increases more rapidly, and the temperature uniformity of the battery deteriorates. At 37 °C, when the discharge current is 50, 75, and 100 A, the surface temperatures the battery and the Δ T max were 38.1, 38.6, and 39.0 °C and 0.8, 1.4, and 1.7 °C, respectively.
2. For the pulse cycle test, the resistance affects the temperature rise of the battery. Different discharge depths cause the temperature rise of the battery to differ. However, differences in the temperature are controlled to be 0.3 °C, and the BTMS can better resist temperature increases caused by changes in the resistance.
3. During the constant current discharge process, the fins did not change the temperature rate or uniformity of the battery. In the HPWF and the HPs, the differences in the battery temperature rise were less than 0.2 °C. However, during the pulse cycle, the BTMS with fins reduced the temperature rise of the battery and reduced its settling time. The difference in battery temperature increase was 4.8 °C.
The heat dissipation structure proposed in this study provides a stable and reliable solution for the short lifetime and poor safety of batteries caused by heat generation under high temperatures and high discharge rate conditions. The proposed methods have good application prospects for the rapid charging of electric vehicles and energy storage in lithium batteries.

Author Contributions

Data Curation, S.D.; Methodology, S.D., K.L., Y.X. and J.Z.; Project Administration, C.W.; Resources, P.W.; Software, Y.X., M.Y. and B.L.; Writing-Original Draft Preparation, S.D.; Writing-Review &Editing, S.D.

Funding

This work was supported in part by the National Key R&D Program of China (Grant No. 2018YFB0106102), the Technological Innovation and Application Project of Chongqing (Grant No. cstc2018jszx-cyztzx0130) and the NSF of China (Grant No. 51807017).

Conflicts of Interest

The authors declare no conflicts of interest.

Nomenclature

BTMSbattery thermal management system
TMSthermal management system
HPheat pipe
SOCstate of charge
PCMphase change material
CFDcomputed fluid dynamics
HPWFheat pipe with fins
begthe beginning of battery
endthe finial of battery
eevaporation
ccondensation
Bbattery
Q tatal battery heat; W
I working current; A
R j Ohmic internal resistance; Ω
R p polarized internal resistance; Ω
T battery temperature; °C
d E o c dT battery temperature influence factor

References

  1. Scrosati, B.; Garche, J. Lithium batteries: Status, prospects and future. J. Power Sources 2010, 195, 2419–2430. [Google Scholar] [CrossRef]
  2. Nieto, N.; Díaz, L.; Gastelurrutia, J.; Blanco, F.; Ramos, J.C.; Rivas, A. Novel thermal management system design methodology for power lithium-ion battery. J. Power Sources 2014, 272, 291–302. [Google Scholar] [CrossRef]
  3. E, J.Q.; Yue, M.; Chen, J.W.; Zhu, H.; Deng, Y.W.; Zhu, Y.; Zhang, F.; Wen, M.; Zhang, B.; Kang, S.Y. Effects of the different air cooling strategies on cooling performance of a lithium-ion battery module with baffle. Appl. Therm. Eng. 2018, 144, 231–241. [Google Scholar] [CrossRef]
  4. De Simón-Martín, M.; de la Puente-Gil, Á.; Borge-Diez, D.; Ciria-Garcés, T.; González-Martínez, A.J.E.P. Wind energy planning for a sustainable transition to a decarbonized generation scenario based on the opportunity cost of the wind energy: Spanish Iberian Peninsula as case study. Energy Procedia 2019, 157, 1144–1163. [Google Scholar] [CrossRef]
  5. Shoaib, M.; Siddiqui, I.; Rehman, S.; Khan, S.; Alhems, L.M. Assessment of wind energy potential using wind energy conversion system. J. Clean. Prod. 2019, 216, 346–360. [Google Scholar] [CrossRef]
  6. Fathi Nassar, Y.; Yassin Alsadi, S. Assessment of solar energy potential in Gaza Strip-Palestine. Sustain. Energy Technol. Assess. 2019, 31, 318–328. [Google Scholar] [CrossRef]
  7. López-Lapeña, O.; Pallas-Areny, R. Solar energy radiation measurement with a low–power solar energy harvester. Comput. Electron. Agric. 2018, 151, 150–155. [Google Scholar] [CrossRef]
  8. Gourdo, L.; Fatnassi, H.; Tiskatine, R.; Wifaya, A.; Demrati, H.; Aharoune, A.; Bouirden, L. Solar energy storing rock-bed to heat an agricultural greenhouse. Energy 2019, 169, 206–212. [Google Scholar] [CrossRef]
  9. Cetin, T.H.; Kanoglu, M.; Yanikomer, N. Cryogenic energy storage powered by geothermal energy. Geothermics 2019, 77, 34–40. [Google Scholar] [CrossRef]
  10. Bao, T.; Meldrum, J.; Green, C.; Vitton, S.; Liu, Z.; Bird, K. Geothermal energy recovery from deep flooded copper mines for heating. Energy Convers. Manag. 2019, 183, 604–616. [Google Scholar] [CrossRef]
  11. Guerra, M.; Cienfuegos, R.; Thomson, J.; Suarez, L. Tidal energy resource characterization in Chacao Channel, Chile. Int. J. Mar. Energy 2017, 20, 1–16. [Google Scholar] [CrossRef]
  12. Chawla, N.; Bharti, N.; Singh, S. Recent Advances in Non-Flammable Electrolytes for Safer Lithium-Ion Batteries. Batteries 2019, 5, 19. [Google Scholar] [CrossRef]
  13. Safa, M.; Adelowo, E.; Chamaani, A.; Chawla, N.; Baboukani, A.R.; Herndon, M.; Wang, C.; El-Zahab, B. Poly(Ionic Liquid)-Based Composite Gel Electrolyte for Lithium Batteries. ChemElectroChem 2019, 6, 3319–3326. [Google Scholar] [CrossRef]
  14. Ianniciello, L.; Biwolé, P.H.; Achard, P. Electric vehicles batteries thermal management systems employing phase change materials. J. Power Sources 2018, 378, 383–403. [Google Scholar] [CrossRef]
  15. Safa, M.; Chamaani, A.; Chawla, N.; El-Zahab, B. Polymeric Ionic Liquid Gel Electrolyte for Room Temperature Lithium Battery Applications. Electrochim. Acta 2016, 213, 587–593. [Google Scholar] [CrossRef]
  16. Huang, Q.; Li, X.; Zhang, G.; Zhang, J.; He, F.; Li, Y. Experimental investigation of the thermal performance of heat pipe assisted phase change material for battery thermal management system. Appl. Therm. Eng. 2018, 141, 1092–1100. [Google Scholar] [CrossRef]
  17. Liu, F.; Lan, F.; Chen, J. Dynamic thermal characteristics of heat pipe via segmented thermal resistance model for electric vehicle battery cooling. J. Power Sources 2016, 321, 57–70. [Google Scholar] [CrossRef]
  18. Mahamud, R.; Park, C. Reciprocating air flow for Li-ion battery thermal management to improve temperature uniformity. J. Power Sources 2011, 196, 5685–5696. [Google Scholar] [CrossRef]
  19. Yang, Y.; Hu, X.; Qing, D.; Chen, F. Arrhenius Equation-Based Cell-Health Assessment: Application to Thermal Energy Management Design of a HEV NiMH Battery Pack. Energies 2013, 6, 2709–2725. [Google Scholar] [CrossRef] [Green Version]
  20. Demircalı, A.; Sergeant, P.; Koroglu, S.; Kesler, S.; Öztürk, E.; Tumbek, M. Influence of the temperature on energy management in battery-ultracapacitor electric vehicles. J. Clean. Prod. 2018, 176, 716–725. [Google Scholar] [CrossRef]
  21. Chiu, K.C.; Lin, C.H.; Yeh, S.F.; Lin, Y.H.; Huang, C.S.; Chen, K.C. Cycle life analysis of series connected lithium-ion batteries with temperature difference. J. Power Sources 2014, 263, 75–84. [Google Scholar] [CrossRef]
  22. Pesaran, A.A. Battery thermal models for hybrid vehicle simulations. J. Power Sources 2002, 110, 377–382. [Google Scholar] [CrossRef]
  23. Al-Zareer, M.; Dincer, I.; Rosen, M.A. Heat and mass transfer modeling and assessment of a new battery cooling system. Int. J. Heat Mass Transf. 2018, 126, 765–778. [Google Scholar] [CrossRef]
  24. Giuliano, M.R.; Prasad, A.K.; Advani, S.G. Experimental study of an air-cooled thermal management system for high capacity lithium–titanate batteries. J. Power Sources 2012, 216, 345–352. [Google Scholar] [CrossRef]
  25. Wang, H.; Ma, L. Thermal management of a large prismatic battery pack based on reciprocating flow and active control. Int. J. Heat Mass Transf. 2017, 115, 296–303. [Google Scholar] [CrossRef]
  26. Arya, A.; Sarafraz, M.M.; Shahmiri, S.; Madani, S.A.H.; Nikkhah, V.; Nakhjavani, S.M. Thermal performance analysis of a flat heat pipe working with carbon nanotube-water nanofluid for cooling of a high heat flux heater. Heat Mass Transf. 2017, 54, 985–997. [Google Scholar] [CrossRef]
  27. Sarafraz, M.M.; Hormozi, F. Experimental study on the thermal performance and efficiency of a copper made thermosyphon heat pipe charged with alumina–glycol based nanofluids. Powder Technol. 2014, 266, 378–387. [Google Scholar] [CrossRef]
  28. Sarafraz, M.M.; Hormozi, F.; Peyghambarzadeh, S.M. Thermal performance and efficiency of a thermosyphon heat pipe working with a biologically ecofriendly nanofluid. Int. Commun. Heat Mass Transf. 2014, 57, 297–303. [Google Scholar] [CrossRef]
  29. Sarafraz, M.M.; Pourmehran, O.; Yang, B.; Arjomandi, M. Assessment of the thermal performance of a thermosyphon heat pipe using zirconia-acetone nanofluids. Renew. Energy 2019, 136, 884–895. [Google Scholar] [CrossRef]
  30. Sarafraz, M.M.; Tian, Z.; Tlili, I.; Kazi, S.; Goodarzi, M. Thermal evaluation of a heat pipe working with n-pentane-acetone and n-pentane-methanol binary mixtures. J. Therm. Anal. Calorim. 2019, 1–11. [Google Scholar] [CrossRef]
  31. Shah, K.; McKee, C.; Chalise, D.; Jain, A. Experimental and numerical investigation of core cooling of Li-ion cells using heat pipes. Energy 2016, 113, 852–860. [Google Scholar] [CrossRef] [Green Version]
  32. Putra, N.; Ariantara, B.; Pamungkas, R.A. Experimental investigation on performance of lithium-ion battery thermal management system using flat plate loop heat pipe for electric vehicle application. Appl. Therm. Eng. 2016, 99, 784–789. [Google Scholar] [CrossRef]
  33. Wang, J.C.; Transfer, M. Thermal investigations on LED vapor chamber-based plates. Int. Commun. Heat Mass Transf. 2011, 38, 1206–1212. [Google Scholar] [CrossRef]
  34. Yang, K.S.; Yang, T.Y.; Tu, C.W.; Yeh, C.T.; Lee, M.T. A novel flat polymer heat pipe with thermal via for cooling electronic devices. Energy Convers. Manag. 2015, 100, 37–44. [Google Scholar] [CrossRef]
  35. Naphon, P.; Wongwises, S.; Wiriyasart, S. Application of two-phase vapor chamber technique for hard disk drive cooling of PCs. Int. Commun. Heat Mass Transf. 2013, 40, 32–35. [Google Scholar] [CrossRef]
  36. Wang, R.T.; Wang, J.C.; Chang, T.L. Technology Experimental analysis for thermal performance of a vapor chamber applied to high-performance servers. Int. Commun. Heat Mass Transf. 2011, 19, 353–360. [Google Scholar]
  37. Jouhara, H.; Meskimmon, R. Heat pipe based thermal management systems for energy-efficient data centres. Energy 2014, 77, 265–270. [Google Scholar] [CrossRef] [Green Version]
  38. Wang, J.C. Development of vapour chamber-based VGA thermal module. Int. J. Numer. Methods Heat Fluid Flow 2010, 20, 416–428. [Google Scholar] [CrossRef]
  39. Zeng, J.; Zhang, S.; Chen, G.; Lin, L.; Sun, Y.; Chuai, L.; Yuan, W. Experimental investigation on thermal performance of aluminum vapor chamber using micro-grooved wick with reentrant cavity array. Appl. Therm. Eng. 2018, 130, 185–194. [Google Scholar] [CrossRef]
  40. Chi, R.G.; Rhi, S.H. Oscillating Heat Pipe Cooling System of Electric Vehicle’s Li-Ion Batteries with Direct Contact Bottom Cooling Mode. Energies 2019, 12, 1698. [Google Scholar] [CrossRef]
  41. Tran, T.H.; Harmand, S.; Sahut, B. Experimental investigation on heat pipe cooling for Hybrid Electric Vehicle and Electric Vehicle lithium-ion battery. J. Power Sources 2014, 265, 262–272. [Google Scholar] [CrossRef]
  42. Zhao, R.; Gu, J.; Liu, J. An experimental study of heat pipe thermal management system with wet cooling method for lithium ion batteries. J. Power Sources 2015, 273, 1089–1097. [Google Scholar] [CrossRef]
  43. Rao, Z.; Wang, S.; Wu, M.; Lin, Z.; Li, F. Experimental investigation on thermal management of electric vehicle battery with heat pipe. Energy Convers. Manag. 2013, 65, 92–97. [Google Scholar] [CrossRef]
  44. Wang, Q.; Jiang, B.; Xue, Q.F.; Sun, H.L.; Li, B.; Zou, H.M.; Yan, Y.Y. Experimental investigation on EV battery cooling and heating by heat pipes. Appl. Therm. Eng. 2015, 88, 54–60. [Google Scholar] [CrossRef]
  45. Fully Integrated Solutions. Available online: http://www.a123systems.com/automotive/products./systems/ (accessed on 24 April 2019).
  46. Jung, E.G.; Boo, J.H. Thermal numerical model of a high temperature heat pipe heat exchanger under radiation. Appl. Energy 2014, 135, 586–596. [Google Scholar] [CrossRef]
  47. Kline, S.J.; McClintock, F.A. Describing Uncertainties in Single-Sample Experiments. Mech. Eng. 1953, 75, 3–8. [Google Scholar]
Figure 1. (a) Battery cell and (b) 48-V battery pack.
Energies 12 03143 g001
Figure 2. Structure of the aluminum plate for HP insertion.
Energies 12 03143 g002
Figure 3. Diagram for the entire cooling system.
Energies 12 03143 g003
Figure 4. Schematic diagram of the experimental setup.
Energies 12 03143 g004
Figure 5. Diagram of the battery pack for the experiments.
Energies 12 03143 g005
Figure 6. (a) Arrangement of the battery surface temperature measurements and (b) the schematic diagram of the HPs.
Energies 12 03143 g006
Figure 7. Changes in the HPWF battery temperature at discharge rates of 50, 75, and 100 A for ambient temperature of (a) 37, (b) 27, and (c) 17 °C.
Energies 12 03143 g007
Figure 8. Temperature uniformity of the HPWF at different discharge currents.
Energies 12 03143 g008
Figure 9. (a) Picture of the insulated battery unit and (b) battery discharge infrared camera photograph.
Energies 12 03143 g009
Figure 10. Constant current (100 A) discharge and temperature change of the battery at 37 °C.
Energies 12 03143 g010
Figure 11. Battery pulse cycle diagram.
Energies 12 03143 g011
Figure 12. (a) Battery surface temperature and (b) battery surface maximum and minimum temperatures.
Energies 12 03143 g012
Figure 13. Depth of discharge at 37 °C using the HPWF method.
Energies 12 03143 g013
Table 1. Parameters for the chosen A123 battery pack.
Cell Dimensions (mm) 4.8 × 160 × 227
Voltage (V)3.3
Capacity (Ah)8-LFP
Operating Temperature (°C)−30 to 50
Storage Temperature (°C)−40 to 60
Cell Weight (g)330
Cutoff Voltage During Charging (V)3.85
Cutoff Voltage During Discharging (V)1.7
Table 2. Parameters of the BTMS.
Name Size   ( m m × m m × m m )
Aluminum plate 210 × 160 × 8
Groove 150 × 8.2 × 3
Fin 100 × 0.5 × 205
HP e 160 × 8 × 3
HP c φ = 6.0   mm ,   L = 110   mm
Fin aperture φ = 6.2   mm
Table 3. Specifications of the different measuring devices and their corresponding accuracies.
Device Accuracy
thermostatic test chamber±0.5 °C
Agilent Model 34972±0.004%
Type K Thermocouple±0.75% ×   T
Table 4. Different heat dissipation methods at 37 °C.
Heat Dissipation MethodsDischarge Current (A) T b e g   ( ° C ) T e n d   ( ° C ) Δ T   ° C Δ T m a x   ( ° C )
HP5036.338.32.01.0
7536.338.92.61.5
10036.339.33.01.8
HP with Fins5036.238.11.90.8
7536.238.62.41.4
10036.239.02.81.7
Ambient5036.141.04.93.8
7536.142.76.65.0
10035.943.87.96.0