Abstract
A brimmed-diffuser augmented turbine (called a wind lens turbine: WLT) actively uses vortices around the brim to enhance its power output. However, the vortices are usually unstable and asymmetric. This study attempted to stabilize the vortices to enhance the power output of a WLT. Then, we investigated new approaches using vortex stabilization plates and polygonal brims in wind tunnel experiments and numerical simulations. Both approaches achieved a 1.5–3.8% increase in power output compared with a standard WLT. Our numerical simulations revealed a periodicity existing in a fluctuating vortex structure on the circular brim. Importantly, vortex stabilization plates and polygonal brims must be the same periodic scale to suppress the vortex fluctuation and stabilize the vortices effectively. In addition, a larger brim tended to enhance the stabilizing effects. We believe that this discovery provides an easy way to increase the power output of existing wind turbines. It is particularly important in light of advances in wind energy technology and the increasing wind energy market.
1. Introduction
Diffuser augmented wind turbines (DAWTs) have diffuser ducts around their rotors [1,2]. The diffusers tend to accelerate the speed of approaching wind. This leads DAWTs to enhance their power output significantly because a wind turbine generates power proportionally to the cubed speed of an approaching wind; a slight wind acceleration enables a turbine to achieve a large increase in electricity generation. This advantage has attracted many researchers. As a result, various studies on DAWTs have been carried out: Hansen et al. [3] and Jamieson [4] have theorized that the power performance coefficient Cp of this energy extraction device exceeds the Betz limit when it is defined in relation to the area of flow intercepted at the device. Their theories have been discussed in detail and extended by Liu et al. [5]. Analysis and optimization of the shroud configuration have been conducted by Aranake et al. [6], Khamlaj and Rumpfkeil [7]. Oka et al. [8] and Vaz and Wood [9] have investigated the design of the blade, and Wang et al. [10] have provided mechanical insight into the blade. The aero-acoustic noise of the turbine has been assessed by Hashem [11].
In our research, we have developed a brimmed-diffuser augmented wind turbine (B-DAWT) that we have called a wind lens turbine (WLT) [12,13]. Its brim makes significant use of viscous flow effects, exploiting strong vortex shedding (Figure 1) to create suction in the wake. Although some researches on wind turbine performances have addressed the effective use of vortices [14,15,16,17], our concept is different; the WLT actively uses vortices to collect wind more and enhances its power in our research. Abe et al. have investigated flow fields behind WLTs precisely [18]. We have applied this WLT concept to floating turbines [19,20], vertical axis wind turbines [21], and several types of multi-rotor systems [22,23,24,25,26]
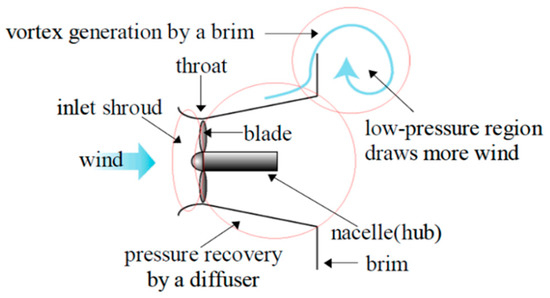
Figure 1.
Wind lens turbine (WLT) mechanism.
The duct of a WLT tends to enhance its flow augmentation with a longer diffuser or a higher brim [12,13], or both. A long-prototype diffuser (with a length 1.5 times that of the rotor diameter; see Figure 2a) exhibited five times larger power output than a bare turbine did with the same rotor diameter [12]. However, long ducts are difficult to build with large turbines, and it is also expensive. Thus, our team recently developed a very compact WLT, which generated almost twice the power output of a bare turbine (Figure 2b) [13]. Its power coefficient varied 0.48–0.54 even though it was based on the largest circular area at diffuser exit. Our main objective of this research is to add an extra enhancement to the power of the compact WLT by changing the shape of the duct without enlarging it. Accomplishing this goal will contribute substantially to growth of installed wind power capacity.
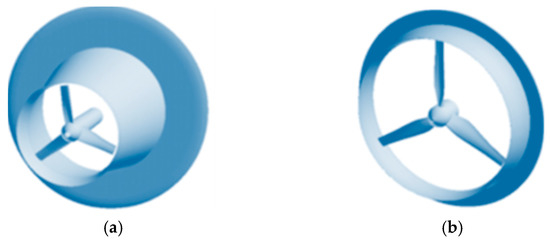
Figure 2.
Representative shapes of WLTs: (a) Prototype; (b) Compact type.
Stronger vortices with greater effectiveness were considered necessary to achieve our objective from the fluid dynamics perspective. Thus, we first focused on the structure of the vortex shed from the WLT brim. Figure 3 shows the vorticity derived by numerical simulations [27]. Because the vortices were observed instantaneously, the pattern was complicated and unstable; the vortex shedding from the circular brim was intrinsically three-dimensional and was not uniform in the circumferential direction. Accordingly, we aimed to stabilize and strengthen the vortices adding arrangement to the brim.
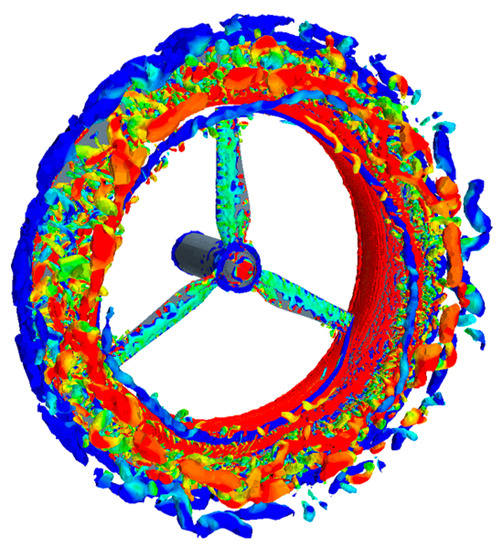
Figure 3.
Vorticity calculated downstream of a WLT brim [27]. Reproduced from [27], MDPI: 2012.
All the studies associated with the output performance and aerodynamic-drag increase of DAWTs or B-DAWTs require the research of the flow around three-dimensional bluff bodies. Taneda conducted a representative study of the flow around a sphere [28,29]. Achenbach also attempted to understand vortex shedding from spheres [30,31]. The research on square prism was conducted by Ohya and Nakamura [32,33]. Three-dimensional bluff bodies, dissimilar to two-dimensional bodies [34], usually shed vortices randomly in the circumferential direction and form very intricate near-wakes. Therefore, not much has been reported about them. Takamoto et al. [35,36] and Hirata et al. [37,38,39,40] carried out the research on a ring body whose shape was similar to the WLT brim. Hirata reported that the quite strong vortices that were produced from the ring incidentally in axisymmetric patterns lowered back pressure in the same way that a two-dimensional body did, even though the ring was three-dimensional. We leveraged the phenomenon across the WLT.
Wind tunnel experiments and numerical simulations were handled in this paper. Two new approaches, namely vortex stabilization plates and polygonal brims, were investigated in experiments and simulations. Both approaches achieved more power output than a standard WLT. Additionally, the analysis of vortex patterns around WLTs explained the mechanism.
2. Materials and Methods
We conducted wind tunnel experiments and numerical simulations. The wind tunnel experiments enabled power output measurements of the WLT and flow visualizations around the duct. The numerical simulations were especially helpful to visualize and analyze time-averaged flow fields around the duct.
Wind tunnel experiments: First, some additional plates were installed on the WLT for the purpose of stabilizing the vortices. Under this condition, the WLTs power output performance was checked. Parametric studies were performed with variations in the number and shape of the plates. Two brim heights of the WLT were tested. Flow visualizations and wind speed measurements were also implemented to analyze the flow structures around the WLT in detail. Second, we measured how much power output was generated by the WLT with some variations in the shapes of the polygonal brim. For this experiment, vortex stabilization plates were not installed.
Numerical simulations: Pressure distributions around the WLT were obtained in instantaneous and time-averaged fields to examine the vortex patterns. We especially focused on the pressure around the WLT brim where the vortex shed most actively. The simulations were conducted on the purpose of understanding physical phenomena around the WLT brim. The numerical results derived by the simple method accomplished our target; it was enough for qualitative discussions. We did not need quantitative discussions in this paper. However, more accurate simulations are prepared for further research.
2.1. Wind Tunnel Experiments
A large atmospheric boundary layer wind tunnel at the Research Institute for Applied Mechanics in Kyushu University was used for these experiments. The test section of the wind tunnel was 3.6 m wide, 2 m high, and 15 m long. We were able to set the uniform inflow speed from 0 m/s to a maximum of 30 m/s. To eliminate the possibility of the blockage effect, the side walls and the ceiling panels of the test section were removed. This suppressed the blockage effect on the turbine in the tunnel [26]. Table 1 shows the experimental materials and conditions.

Table 1.
Experimental materials and wind tunnel settings.
We used a Ci type diffuser; its length relative to its diameter was compact in the streamwise direction [13]. The diameter of the throat Dthroat was 1.0 m. The diffuser length Lt (m) in the streamwise.
Direction was Lt = 0.14 Dthroat. The brim height h (m) was 5% or 10% of the throat diameter of the duct (see Figure 4).
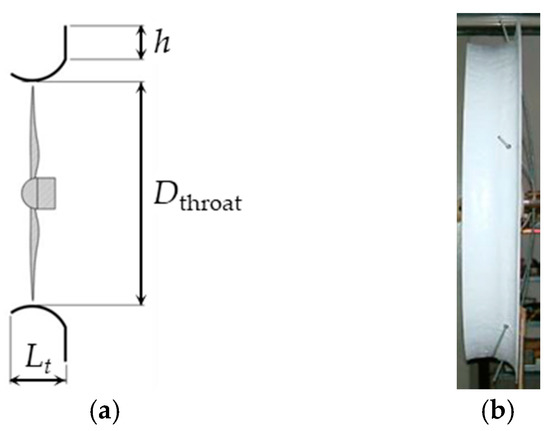
Figure 4.
Schemes of WLT and the duct with the shape of Ci type diffuser: (a) Representative configuration parameters of the duct of WLT; (b) In situ photograph of the duct (h = 0.05 Dthroat).
As shown in Figure 5, four types of vortex stabilization plates were tested, and the contributions of each to the power output were evaluated. We enlarged the shape of type 1 to create the shape of type 2. The type 3 plates had the same outline contour as the type 1 plates, although they did not have the part that the type 1 had behind the brim. The type 4 plates had an upstream-extended shape compared with the type 3 plates. In parametric studies, the number of the plates was varied as shown in Table 1.
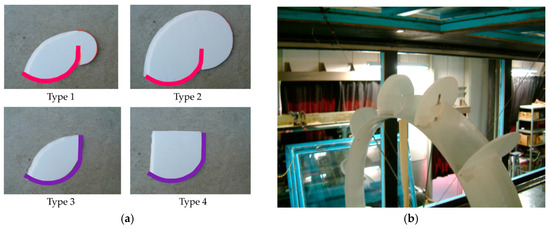
Figure 5.
Additional plates installed on WLT for the purpose of stabilizing vortices around the brim: (a) Four various shapes of the plates (Thick lines pink and purple indicate diffuser contours); (b) In situ photograph of the plates on the WLT (twelve plates type 2, h = 0.05 Dthroat).
Power output enhancements with polygonal (hexagon and dodecagon) WLT brims were also studied (Figure 6). The outline sides of the brims were straightened and curved as shown in Figure 6. The target of this investigation was to find a brim shape that produced strong vortices.
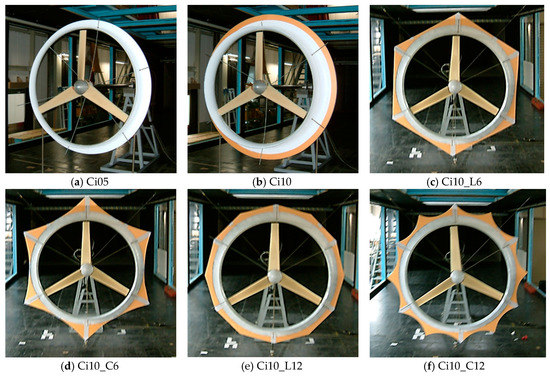
Figure 6.
The various WLT brim shapes tested in the wind tunnel experiments: (a) Ci05 (circular brim, h = 0.05 Dthroat); (b) Ci10 (circular brim, h = 0.10 Dthroat); (c) Ci10_L6 (hexagon brim with straight sides, h = 0.10 Dthroat); (d) Ci10_C6 (hexagon brim with curved sides, h = 0.10 Dthroat); (e) Ci10_L12 (dodecagon brim with straight sides, h = 0.10 Dthroat); (f) Ci10_C12 (dodecagon brim with curved sides, h = 0.10 Dthroat).
Figure 7 is a schematic of the torque measurement system used in the experiments to determine the power coefficient of the WLT. The dimensionless power coefficient Cp was defined as:
where P (W) was the power output of the turbine, ρ (kg/m3) was the density of the air, U0 (m/s) was inflow wind speed, and A (m2) was the swept area of the rotor. In addition, Tr (N·m) was the torque on the rotor with a given wind speed and ω (rad/s) was the angular velocity of the rotor. A torque transducer (rating: 5 N·m) was connected to the wind turbine and an AC torque motor brake was set under it for the loading. Table 2 shows specifications of the transducer. We measured the Tr with an accuracy of ±0.2% and measured the rotational speed n (1/s) of the wind turbine under the condition of gradually increasing its load from zero. The power output P was calculated as, P = Tr × ω = Tr × 2π × n.
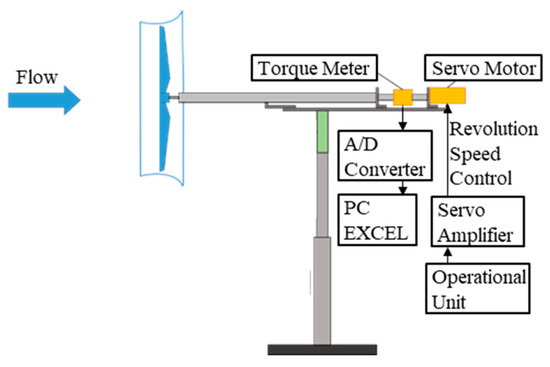
Figure 7.
Schematic of the torque-measurement system used in the WLT performance tests.
Table 2.
Torque transducer and AC servo-control system.
The smoke-wire technique was used for flow visualization. The wire was set upstream from the WLT brim, and vortices produced by the brim were visualized. The flow around the WLT with vortex stabilization plates was also visualized and compared with that of the original unenhanced WLT.
For the wind speed measurements, a hot-wire anemometer was used. Table 3 shows specifications of the hot-wire anemometer system. Each wind speed was measured along the duct radius at 50 mm downstream from the throat. The measurements were conducted with 0, 6, and 12 plates on the duct. The turbine was not installed during the measurements.
Table 3.
Hot-wire anemometer system.
2.2. Numerical Simulations
Numerical simulations were conducted to identify the periodic structure of temporal changes in the vortex, which was difficult to determine experimentally. For our simulations, we used a numerical code based on direct numerical simulation (DNS). The code was similar to the main flow solver of the RIAM-COMPACT® package (RIAM-COMPACT Co., Ltd., Fukuoka, Japan) developed at Kyushu University [44,45,46,47,48,49]. This numerical method had already been validated in our previous study, being compared wind tunnel experiment results [50]. Formulae (2) and (3) describe the two governing equations, the continuity equation and the Navier–Stokes equation for incompressible flows. In our DNS, the Navier–Stokes equations were solved on a generalized curvilinear collocate grid (Figure 8). The coupling algorithm between the velocity and the pressure was based on the fractional-step method [51] with the Euler explicit scheme. Poisson’s equation for pressure was solved by the successive over-relaxation (SOR) method. For spatial discretization, a second-order accurate central-difference scheme that excluded the convective terms was used. For the convective terms, a modified third-order upwinding scheme was applied. An interpolation technique based on four-point differencing and four-point interpolation by Kajishima et al. [52] was used for the fourth-order central differencing that appears in the discretized form of the convective term. The weight of the numerical viscosity term α was settled into a much smaller value (α= 0.5) than that of the Kawamura–Kuwahara scheme (α= 3) [53].
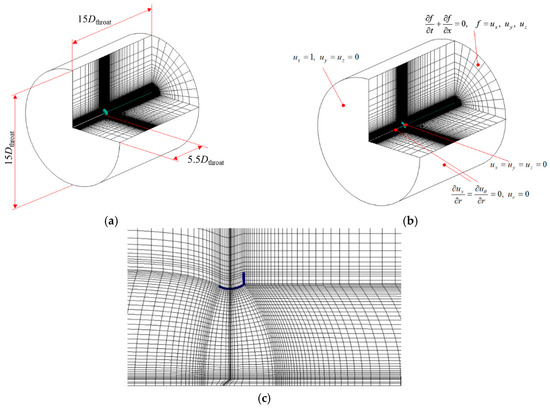
Figure 8.
Computational grid and conditions: (a) The computational domain; (b) The boundary conditions; (c) The grid near the WLT (Ci05).
The calculation domain is shown in Figure 8a. The diameter of the domain was 15 Dthroat, and the WLT model was placed 5.5 Dthroat downstream from the inflow surface of the domain. The total domain length in streamwise direction was 15 Dthroat. The total number of the grid points was approximately 1.7 × 10⁶. All physical values were calculated in a dimensionless field, and its representative length was Dthroat. Boundary conditions are shown in Figure 8b. The incoming flow was uniform and Re = 104. The characteristic length was Dthroat. For the outflow boundary, the convective outflow condition was employed. The Neumann condition was given to pressures at the domain boundaries. The code was run first for a time equivalent to 200 Karman vortex cycles (behind the brim) to establish steady flow throughout the computational domain before beginning the analysis of the field. The actuator-disc model [50,54] was used as a numerical model for the wind turbine. Its tip-speed ratio λ was set to 4.0, which was the optimum ratio of our turbine. All of the diffuser shapes were based on the Ci type with a 5% brim height (Figure 9). The shapes of the brim are shown in Figure 9. No vortex stabilization plates were simulated in any of the cases.
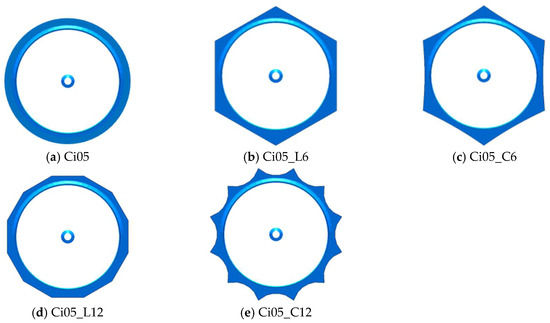
Figure 9.
The various WLT brim shapes modeled in the numerical simulations: (a) Ci05 (circular brim, h = 0.05 Dthroat); (b) Ci05_L6 (hexagon brim with straight sides, h = 0.05 Dthroat); (c) Ci05_C6 (hexagon brim with curved sides, h = 0.05 Dthroat); (d) Ci05_L12 (dodecagon brim with straight sides, h = 0.05 Dthroat); (e) Ci05_C12 (dodecagon brim with curved sides, h = 0.05 Dthroat).
3. Results and Discussion
3.1. Experimental Results
3.1.1. Power Output Enhancements by the Vortex Stabilization Plates
Figure 10 shows the power curves of WLT Ci05 with the type 1 and type 2 vortex stabilization plates. The smaller plates, type 1, had little effect on the curves (see Figure 10a). However, the bigger plates, type 2, enhanced the output in the wide range of the tip-speed ratio (Figure 10b). The significance of the power enhancements depended on the installed numbers of the plates.
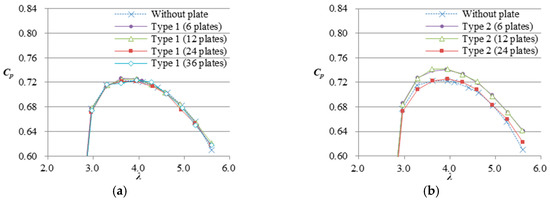
Figure 10.
Power curves of WLT Ci05: (a) Results of the WLT with the type 1 vortex stabilizing plates; (b) Results of the WLT with the type 2 vortex stabilizing plates.
Figure 11 shows power curves of WLT Ci10 with the type 3 and type 4 vortex stabilizing plates. Amazingly, the smallest plates, type 3, enhanced the power output for WLT Ci10, which had a brim was twice as high as that of Ci05 (see Figure 11a). In addition, the output enhancement with the type 4 plates avoided the large influence of changing the installed number of the plates (Figure 11b).
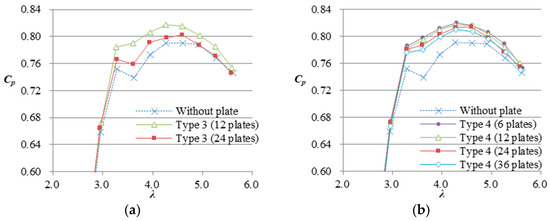
Figure 11.
Power curves of WLT Ci10: (a) Results of the WLT with the type 3 vortex stabilizing plates; (b) Results of the WLT with the type 4 vortex stabilizing plates.
From Figure 10 and Figure 11, we considered the results were strongly related to the strength of the vortices created by the brim: The WLT with a low brim, relative to the WLT with a high brim, does not generate strong vortices. It is already confirmed as the fact that the lower the WLT brim becomes, the smaller power it generates [12]. Therefore, the WLT with a low brim requires the vortex stabilization plates big enough to cover the large sectional area of the vortices for the power output enhancement. At the same time, the installed number of the plates needs to be in its optimum range. This is because the weak vortices shed from the low brim are not able to amplify the tiny effect of the vortex stabilization plates if it is out of its optimum range.
Table 4 and Figure 12 summarize each maximum value of Cp (=Cp_max) at the optimum tip-speed ratios. The increase rate of Cp_max with the type 3 plate was much higher than that of the type 1 plate. The results implied that a WLT with a high brim was able to enhance its power output even though the additional plates were small. As aforementioned, we considered that it was because of the stronger vortices produced by the higher brim; they amplified the effect of the vortex stabilization plates. The line graphs in Figure 12 indicate that Cp_max peaked between 6 and 12 plates, which suggests that this is the optimum range of the installed number of plates. As a typical result, WLT Ci10 with six type 4 plates achieved a 3.8% increase in power output.
Table 4.
The maximum values of Cp (=Cp_max) for every plate type.
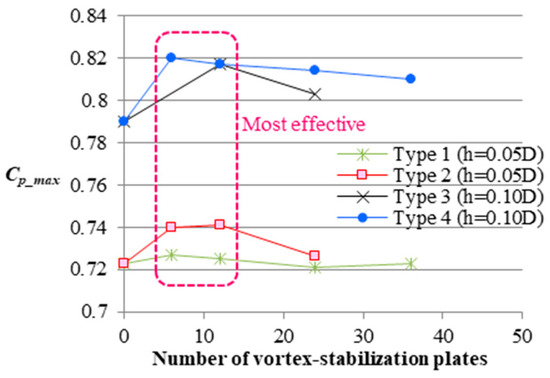
Figure 12.
Variations of Cp_max with increases in the installed number of vortex stabilization plates.
3.1.2. Wind Speed Acceleration Inside the Duct by the Vortex Stabilization Plates
We measured wind speeds inside the duct with varying numbers of installed vortex stabilization plates. We aimed to determine how the different plates affected the flow field. WLT Ci10 with type 4 plates was used. It was one of the most effective configurations, as shown in Figure 12. Wind speed profiles measured at 50 mm downstream from the throat of the duct are shown in Figure 13. Here, u was defined as the wind speed in the streamwise direction, and r was the distance from the rotational axis of the turbine in the radius direction. Both measurements were nondimensionalized. Figure 13 clearly shows that the WLT with 6 or 12 plates accelerated the wind speeds remarkably near the inside wall of the duct, regardless of the inflow wind speed. We considered this was due to the vortices formed by the brim; these vortices caused stronger drawing actions, especially near the wall. The effectiveness of the vortex stabilization plates is shown by the results.
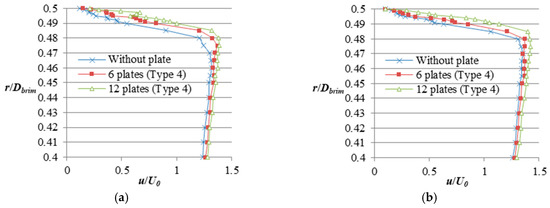
Figure 13.
Nondimensionalized wind speeds in the streamwise direction near the inside wall of the WLT Ci10 duct (without the turbine): (a) Inflow wind speed U0 = 4 m/s; (b) Inflow wind speed U0 = 8 m/s.
Wind acceleration near the inside wall of a WLT usually cause increases in the aerodynamic force at the tips. At the same time, wind turbines always gain torque effectively by increasing the rotational force at the blade tips. Therefore, this tendency of wind acceleration achieved by the vortex stabilization plates is preferable.
3.1.3. Two-Dimensional Vortices Generated by the Vortex Stabilization Plates
The images shown in Figure 14 were derived from flow visualization experiments. These images present contrasting features of vortices generated by the brim of two WLTs, one with vortex stabilization plates and the other without. WLT Ci05 with type 2 plates was used. It was one of the most effective configurations, as shown in Figure 12. The WLT with no vortex stabilization plates tended to generate vortices that diffused three-dimensionally (see Figure 14a). However, the WLT with vortex stabilization plates enabled its brim to form two-dimensional vortices around it (Figure 14b). Generally, a two-dimensional vortex dissipates more slowly than a three-dimensional vortex does because it has one less degree of freedom to diffuse. The two-dimensional vortices produced by the WLT were presumed to ease their rapid dissipation and to keep their strong drawing action, as mentioned in the previous section.
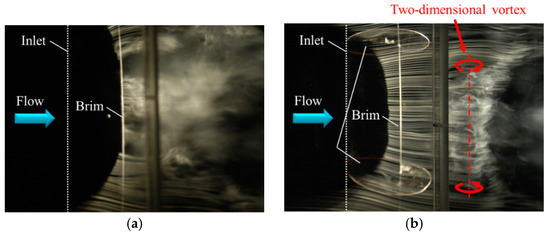
Figure 14.
Flow visualization results: (a) Vortices generated by WLT Ci05 without the vortex stabilizing plates; (b) Vortices generated by WLT Ci05 with the type 2 vortex stabilizing plates.
3.1.4. Power Output Enhancements by the Polygonal Brims
The power curves of WLTs with various polygonal brims (chosen from those illustrated in Figure 6) are plotted in Figure 15. The areas of all brims were equal in size. Figure 15a shows the results of the brim with straight sides. An approximately 1.5% increase in power output was achieved although the duct had no vortex stabilization plates. By contrast, no enhancement was seen in power curves of the WLT with the brim with curved sides (Figure 15b). We discuss the reason in Section 3.2.2.
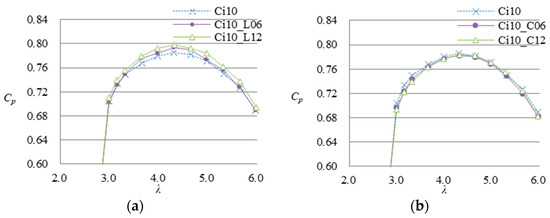
Figure 15.
Power curves of WLT Ci10: (a) Results of the WLT with the polygonal brim with straight sides; (b) Results of the WLT with the polygonal brim with curved sides.
3.2. Numerical Results
3.2.1. Fluctuating Vortex Structures around the WLT Brim
Figure 16 shows the instantaneous pressure distributions in the fluid on the upstream side of the standard circular brim of WLT Ci05. The vortex structure had fully developed before the moment of Figure 16a. The figures were captured every Δt* = Δt/(Dthroat/U0) = 0.01, which was a nondimensionalized time interval. The pressure was nondimensionalized. The blue indicates low-pressure regions and the red indicates high-pressure regions.
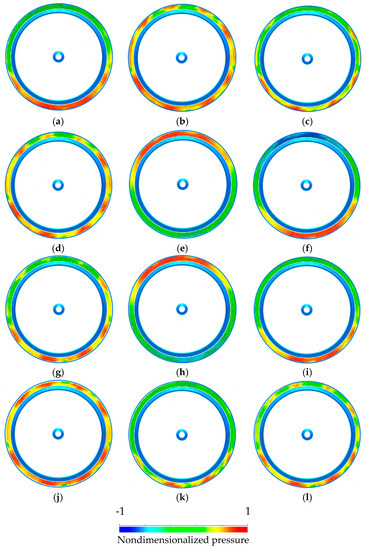
Figure 16.
Time-series behavior of instantaneous pressure upon the brim of WLT Ci05. (The nondimensionalized time interval Δt* between each of the figures was Δt* = 0.01): (a) t* = t0* (at the moment 200 Karman vortex cycles have produced behind the brim); (b) t = t0* + 0.01; (c) t = t0* + 0.02; (d) t = t0* + 0.03; (e) t = t0* + 0.04; (f) t = t0* + 0.05; (g) t = t0* + 0.06; (h) t = t0* + 0.07; (i) t = t0* + 0.08; (j) t = t0* + 0.09; (k) t = t0* + 0.10; (l) t = t0* + 0.11.
As time progressed, the low-pressure region fluctuated quickly (see Figure 16). Since the low-pressure pattern reflected the vortex pattern, the fluctuation implied that the vortex shedding was unstable and asymmetrical. However, we realized that some periodic pressure patterns nevertheless existed in the circumferential direction of the brim. The periodic pattern was clearly visible in the time-averaged pressure field as shown in Figure 17. From this figure, we confirmed the periodic characteristic of vortex shedding around the brim.
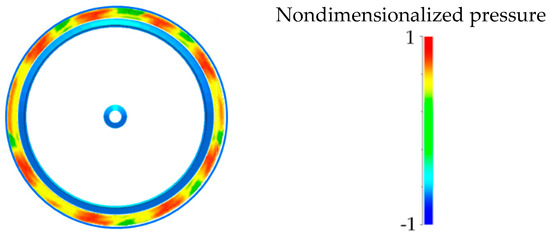
Figure 17.
Time-averaged pressure distribution on the WLT Ci05 brim.
A similar periodic vortex pattern was derived in a numerical simulation of a ring body by Sheard et al. [55]. They explained the periodic vortex pattern using the analogy of them being in “mode A” instability. The modes were defined by Williamson [56] in his study of a cylinder wake, and confirmed by numerical simulations by Labbé et al. [57]. Each vortex pattern had specific wavelengths according to their modes. In our case with the WLT, the wavenumber shown in Figure 17 was 10. This number 10 coincided with the optimum installation number of the plates suggested in Figure 12. From these, we recognized the vortex stabilization process achieved by the plates as follows: the vortex stabilization plates suppressed vortex fluctuations, deciding the vortex locations and keeping them in the circumferential direction. The plates shut off the mutual interference of the vortices. Furthermore, the contribution was maximized when a pair of plates divided the structure of the vortices into a size corresponding to the wavelength of its periodic loop.
3.2.2. Periodic Vortex Structures around the Polygonal Brim
As mentioned in the previous section, we found out that the vortex around the WLT brim had a fluctuating periodic structure. We also revealed that the stabilization of the vortex structure led to a power output increase of the WLT. Therefore, we assumed that the polygonal brims possibly increased the power output of the WLT, if a similar mechanism was used. We conducted numerical simulations of the flow around the WLT with the polygonal brim so that we could confirm this theory. The shading patterns in Figure 18 illustrate time-averaged pressure distributions of WLTs with various polygonal brims. Clear periodic pressure patterns appeared coinciding with the vertices of the polygonal brims. It is noteworthy that the pressure was unexceptionally high at all the vertices and it did not fluctuate much. That was because the higher part of the brims always had more drag on the flow approaching than the lower part did. Hence, the polygonal brims were able to form the periodical vortex continuously. The stabilized vortex increased the power output of the WLT. As for the brims with curved sides, the heights were very low at the middle of the sides where primary vortices were generated two-dimensionally. The absence of power enhancements by the brims, as shown in Figure 15b, was probably due to the low brim height.
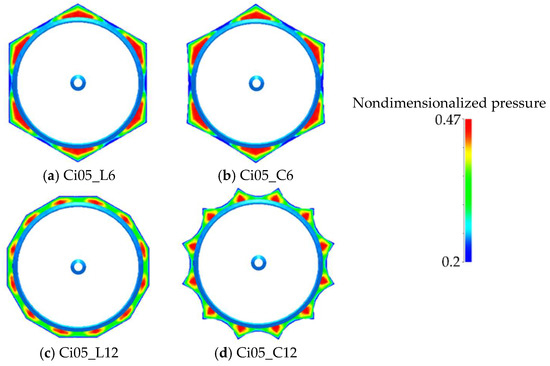
Figure 18.
Time-averaged pressure distributions on the polygonal WLT brims: (a) Ci05_L6 (hexagon brim with straight sides, h = 0.05 Dthroat); (b) Ci05_C6 (hexagon brim with curved sides, h = 0.05 Dthroat); (c) Ci05_L12 (dodecagon brim with straight sides, h = 0.05 Dthroat); (d) Ci05_C12 (dodecagon brim with curved sides, h = 0.05 Dthroat).
3.3. Future Possibilities
Future possibilities of adopting the ideas presented in this paper are worth mentioning. The duct of a practical WLT [58] is commonly composed of several parts (see Figure 19). The joint flanges can be used as the vortex stabilization plates by enlarging them. The polygonal brim is easily constructed by molding each of the brim parts into a trapezoid-like shape. We are able to adopt these ideas without changing its initial manufacturing cost.
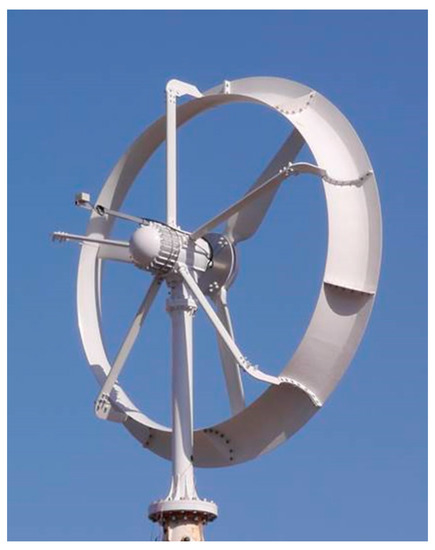
Figure 19.
Practical WLT [58] with a duct composed of several parts.
4. Conclusions
Enhancements to power output of WLTs were investigated using various types of vortex stabilization plates and polygonal brims. The following results were achieved in wind tunnel experiments and numerical simulations.
- The vortex stabilization plates enhance the output in a wide range of tip-speed ratios while the significance of the power enhancement depends on the installed number of the plates. A WLT with a high brim is able to enhance its power output even if the additional plates are small. In this study, the output peaked between 6 and 12 plates, which suggested the optimum range of the installed number of plates. WLT Ci10 with six plates achieved a maximum 3.8% increase in power output.
- A WLT with vortex stabilization plates enables its brim to form two-dimensional vortices around itself. The vortices maintain the WLT’s strong drawing action, especially near the inside wall of the duct where wind speed is accelerated.
- The vortex shedding from the WLT brim has a circumferentially periodic pattern, while the pattern instantaneously becomes unstable and asymmetrical. The vortex stabilization plates suppress vortex fluctuations, and the contribution is maximized when a pair of plates divides the structure of vortex shed into a size corresponding to the wavelength of its periodic loop. The wavenumber of the periodic loop derived by numerical simulation coincided with the optimum range of the installed number of the plates in wind tunnel experiments.
- The polygonal brims are able to form periodical vortex patterns without vortex stabilization plates, and the effect stabilizes the vortices. The wavelengths of the patterns coincide with the distances between the vertices of the brims. The WLT with the dodecagon brim achieved an approximately 1.5% increase in power output without vortex stabilization plates.
Author Contributions
Conceptualization, K.W. and Y.O.; Investigation, K.W.; Methodology, Y.O.; Software, T.U.; Supervision, Y.O.; Validation, K.W., Y.O., and T.U.; Writing – original draft, K.W.; Writing—review & editing, K.W. and Y.O.
Funding
This research received no external funding.
Acknowledgments
The authors are grateful to laboratory engineers, Kimihiko Watanabe, Keiji Matsushima, and Tomoyuki Nagai. Advice and comments given by Ai Watanabe were a great help during writing.
Conflicts of Interest
The authors declare no conflict of interest.
References
- Gilbert, B.L.; Foreman, K.M. Experiments with a diffuser-augmented model wind turbine. J. Energy Resour. Technol. 1983, 105, 46–53. [Google Scholar] [CrossRef]
- Bussel, G.J.W. The science of making more torque from wind: Diffuser experiments and theory revisited. J. Phys. Conf. Ser. 2007, 75, 012010. [Google Scholar] [CrossRef]
- Hansen, M.O.L.; Sørensen, N.N.; Flay, R.G.J. Effect of placing a diffuser around a wind turbine. Wind Energy 2001, 3, 207–213. [Google Scholar] [CrossRef]
- Jamieson, P.M. Beating betz: Energy extraction limits in a constrained flow field. J. Sol. Energy Eng. 2009, 131, 031008. [Google Scholar] [CrossRef]
- Liu, Y.; Yoshida, S. An extension of the generalized actuator disc theory for aerodynamic analysis of the diffuser-augmented wind turbines. Energy 2015, 93, 1852–1859. [Google Scholar] [CrossRef]
- Aranake, A.C.; Lakshminarayan, V.K.; Duraisamy, K. Computational analysis of shrouded wind turbine configurations using a 3-dimensional RANS solver. Renew. Energy 2015, 75, 818–832. [Google Scholar] [CrossRef]
- Khamlaj, T.A.; Rumpfkeil, M.P. Analysis and optimization of ducted wind turbines. Energy 2018, 162, 1234–1252. [Google Scholar] [CrossRef]
- Oka, N.; Furukawa, M.; Kawamitsu, K.; Yamada, K. Optimum aerodynamic design for wind-lens turbine. J. Fluid Sci. Technol. 2016, 11, JFST0011. [Google Scholar] [CrossRef]
- Vaz, J.R.P.; Wood, D.H. Aerodynamic optimization of the blades of diffuser-augmented wind turbines. Energy Convers. Manag. 2016, 123, 35–45. [Google Scholar] [CrossRef]
- Wang, W.X.; Matsubara, T.; Hu, J.; Odahara, S.; Nagai, T.; Karasudani, T.; Ohya, Y. Experimental investigation into the influence of the flanged diffuser on the dynamic behavior of CFRP blade of a shrouded wind turbine. Renew. Energy 2015, 78, 386–397. [Google Scholar] [CrossRef]
- Hashem, I.; Mohamed, M.H.; Hafiz, A.A. Aero-acoustics noise assessment for Wind-Lens turbine. Energy 2017, 118, 345–368. [Google Scholar] [CrossRef]
- Ohya, Y.; Karasudani, T.; Sakurai, A.; Abe, K.; Inoue, M. Development of a shrouded wind turbine with a flanged diffuser. J. Wind Eng. Ind. Aerodyn. 2008, 96, 524–539. [Google Scholar] [CrossRef]
- Ohya, Y.; Karasudani, T. A shrouded wind turbine generating high output power with wind-lens technology. Energies 2010, 3, 1043–1052. [Google Scholar] [CrossRef]
- Fernandez-Gamiz, U.; Velte, C.M.; Réthoré, P.E.; Sørensen, N.N.; Egusquiza, E. Testing of self-similarity and helical symmetry in vortex generator flow simulations. Wind Energy 2016, 19, 1043–1052. [Google Scholar] [CrossRef]
- Fernandez-Gamiz, U.; Gomez-Mármol, M.; Chacón-Rebollo, T. Computational modeling of gurney flaps and microtabs by POD method. Energies 2018, 11, 2091. [Google Scholar] [CrossRef]
- Aramendia, I.; Fernandez-Gamiz, U.; Zulueta, E.; Saenz-Aguirre, A.; Teso-Fz-Betoño, D. Parametric study of a gurney flap implementation in a DU91W(2)250 airfoil. Energies 2019, 12, 294. [Google Scholar] [CrossRef]
- Lee, G.; Ding, Y.; Xie, L.; Genton, M.G. A kernel plus method for quantifying wind turbine performance upgrades. Wind Energy 2015, 18, 1207–1219. [Google Scholar] [CrossRef]
- Abe, K.; Nishida, M.; Sakurai, A.; Ohya, Y.; Kihara, H.; Wada, E.; Sato, K. Experimental and numerical investigations of flow fields behind a small wind turbine with a flanged diffuser. J. Wind Eng. Ind. Aerodyn. 2005, 93, 951–970. [Google Scholar] [CrossRef]
- Zhu, H.; Sueyoshi, M.; Hu, C.; Yoshida, S. A study on a floating type shrouded wind turbine: Design, modeling and analysis. Renew. Energy 2018, 134, 1099–1113. [Google Scholar] [CrossRef]
- Watanabe, K.; Ohya, Y.; Uchida, T.; Nagai, T. Numerical prediction and field verification test of wind-power generation potential in nearshore area using a moored floating platform. J. Flow Control Meas. Vis. 2017, 5, 21–35. [Google Scholar] [CrossRef][Green Version]
- Watanabe, K.; Takahashi, S.; Ohya, Y. Application of a diffuser structure to vertical-axis wind turbines. Energies 2016, 9, 406. [Google Scholar] [CrossRef]
- Amano, R.S. Review of wind turbine research in 21st century. J. Energy Resour. Technol. 2017, 139, 050801. [Google Scholar] [CrossRef]
- Göltenbott, U.; Ohya, Y.; Yoshida, S.; Jamieson, P. Aerodynamic interaction of diffuser augmented wind turbines in multi-rotor systems. Renew. Energy 2017, 112, 25–34. [Google Scholar] [CrossRef]
- Ohya, Y.; Miyazaki, J.; Göltenbott, U.; Watanabe, K. Power Augmentation of shrouded wind turbines in a multirotor system. J. Energy Resour. Technol. 2017, 139, 051202. [Google Scholar] [CrossRef]
- Watanabe, K.; Ohya, Y. Multi-Rotor Systems Using Three Shrouded Wind Turbines for Power Output Increase. J. Energy Resour. Technol. 2019, 141, 051211. [Google Scholar] [CrossRef]
- Ohya, Y.; Watanabe, K. A new approach toward power output enhancement using multirotor systems with shrouded wind turbines. J. Energy Resour. Technol. 2019, 141, 051203. [Google Scholar] [CrossRef]
- Takahashi, S.; Hata, Y.; Ohya, Y.; Karasudani, T.; Uchida, T. Behavior of the blade tip vortices of a wind turbine equipped with a brimmed-diffuser shroud. Energies 2012, 5, 5229–5242. [Google Scholar] [CrossRef]
- Taneda, S. Experimental investigation of the wake behind a sphere at low Reynolds numbers. J. Phys. Soc. Jpn. 1956, 11, 1104–1108. [Google Scholar] [CrossRef]
- Taneda, S. Visual observations of the flow past a sphere at Reynolds numbers between 104 and 106. J. Fluid Mech. 1978, 85, 187–192. [Google Scholar] [CrossRef]
- Achenbach, E. Experiments on the flow past spheres at very high Reynolds numbers. J. Fluid Mech. 1972, 54, 565–575. [Google Scholar] [CrossRef]
- Achenbach, E. Vortex shedding from spheres. J. Fluid Mech. 1974, 62, 209–221. [Google Scholar] [CrossRef]
- Nakamura, Y.; Ohya, Y. The effects of turbulence on the mean flow past square rods. J. Fluid Mech. 1983, 137, 331–345. [Google Scholar] [CrossRef]
- Nakamura, Y.; Ohya, Y. Vortex shedding from square prisms in smooth and turbulent flows. J. Fluid Mech. 1986, 164, 77–89. [Google Scholar] [CrossRef]
- Bearman, P.W. Vortex shedding from oscillating bluff bodies. Annu. Rev. Fluid Mech. 1984, 16, 195–222. [Google Scholar] [CrossRef]
- Bearman, P.W.; Takamoto, M. Vortex shedding behind rings and discs. Fluid Dyn. Res. 1988, 3, 214–218. [Google Scholar] [CrossRef]
- Castro, I.P.; Takamoto, M. Vortex shedding from a ring in shear flow. Exp. Fluid 1994, 16, 187–195. [Google Scholar] [CrossRef]
- Hirata, K.; Funaki, J.; Tsuno, N. On the critical geometry of a ring in flow. Trans. JSME Ser. B 2001, 67, 3101–3109. [Google Scholar] [CrossRef][Green Version]
- Hirata, K.; Nagase, A.; Funaki, J. On the development of ring-vortex wake. Trans. JSME Ser. B 2006, 72, 285–290. [Google Scholar] [CrossRef]
- Hirata, K.; Funaki, J.; Nagase, A.; Fujikawa, A. On curvature and thickness effects on flow past a ring. Trans. JSME Ser. B 2007, 73, 126–132. [Google Scholar] [CrossRef][Green Version]
- Funaki, J.; Sakata, Y.; Nagase, A.; Hirata, K. PIV Measurements of Ring Vortex Wake. In Proceedings of the 5th International Symposium on Measurement Techniques for Multiphase Flows, Macau, China, 10–13 December 2006; AIP Publishing: Melville, NY, USA, 2006. [Google Scholar]
- Obase, Y.; Hiratani, F.; Furukawa, M. Development of Wind Lens Turbine by Three-Dimension Blade Design. In Proceedings of the Annual Meeting, Japan Society of Fluid Mechanics, Kobe, Japan, 4–7 September 2008; The Japan Society of Fluid Mechanics: Tokyo, Japan, 2008; p. 150. (In Japanese). [Google Scholar]
- Sugita, Y.; Ueda, M.; Nagatsu, J.; Furukawa, M.; Ohya, Y. Effects of Blade Profile on Aerodynamic Performance of Wind Turbines with Brimmed Diffuser. In Proceedings of the JSME Annual Meeting, Chofu, Japan, 19–22 September 2005; The Japan Society of Mechanical Engineers: Tokyo, Japan, 2005; pp. 255–256. (In Japanese). [Google Scholar] [CrossRef]
- Matsumiya, H.; Tsutsui, Y.; Kawamura, S.; Kieda, K.; Kato, E.; Takano, S.; Toe, Y. Performance of New ‘MEL-WING SECTIONS’ for Wind Turbines. In Proceedings of the European Community Wind Energy Conference, Madrid, Spain, 10–14 September 1990; H. S. Stephens & Associates: Lyngby, Denmark, 1990; pp. 258–263. [Google Scholar]
- Uchida, T. Computational fluid dynamics (CFD) investigation of wind turbine nacelle separation accident over complex terrain in japan. Energies 2018, 11, 1485. [Google Scholar] [CrossRef]
- Uchida, T. LES investigation of terrain-induced turbulence in complex terrain and economic effects of wind turbine control. Energies 2018, 11, 1530. [Google Scholar] [CrossRef]
- Uchida, T. Computational fluid dynamics approach to predict the actual wind speed over complex terrain. Energies 2018, 11, 1694. [Google Scholar] [CrossRef]
- Uchida, T. Numerical investigation of terrain-induced turbulence in complex terrain by large-eddy simulation (LES) technique. Energies 2018, 11, 2638. [Google Scholar] [CrossRef]
- RIAM-COMPACT Co., Ltd. Available online: http://riam-compact.com/ (accessed on 24 January 2019).
- RIAM; Kyushu University Division of Renewable Energy Dynamics; Wind Engineering Section. Available online: https://www.riam.kyushu-u.ac.jp/windeng/en_index.html (accessed on 24 January 2019).
- Ohya, Y.; Uchida, T.; Karasudani, T.; Hasegawa, M.; Kume, H. Numerical studies of flow around a wind turbine equipped with a flanged-diffuser shroud using an actuator-disk model. Wind Eng. 2012, 36, 455–472. [Google Scholar] [CrossRef]
- Harlow, F.H.; Welch, J.E. Numerical calculation of time-dependent viscous incompressible flow of fluid with free surface. Phys. Fluids 1965, 8, 2182–2189. [Google Scholar] [CrossRef]
- Kajishima, T.; Taira, K. Computational Fluid Dynamics—Incompressible Turbulent Flows, 1st ed.; Springer International Publishing AG: Cham, Switzerland, 2017; pp. 110–114. [Google Scholar]
- Kawamura, T.; Takami, H.; Kuwahara, K. Computation of high Reynolds number flow around a circular cylinder with surface roughness. Fluid Dyn. Res. 1986, 1, 145–162. [Google Scholar] [CrossRef]
- Sørensen, J.N.; Myken, A. Unsteady actuator disc model for horizontal axis wind turbine. J. Wind Eng. Ind. Aerodyn. 1992, 39, 139–149. [Google Scholar] [CrossRef]
- Sheard, G.J.; Thompson, M.C.; Hourigan, K. From spheres to circular cylinders: Non-axisymmetric transitions in the flow past rings. J. Fluid Mech. 2004, 506, 45–78. [Google Scholar] [CrossRef]
- Williamson, C.H.K. Vortex dynamics in the cylinder wake. Annu. Rev. Fluid Mech. 1996, 28, 477–539. [Google Scholar] [CrossRef]
- Labbé, D.F.L.; Wilson, P.A. A numerical investigation of the effects of the spanwise length on the 3-D wake of a circular cylinder. J. Fluids Struct. 2007, 23, 1168–1188. [Google Scholar] [CrossRef]
- RIAMWIND Co., Ltd. Available online: http://www.riamwind.co.jp/english/index.html (accessed on 24 January 2019).


© 2019 by the authors. Licensee MDPI, Basel, Switzerland. This article is an open access article distributed under the terms and conditions of the Creative Commons Attribution (CC BY) license (http://creativecommons.org/licenses/by/4.0/).