Abstract
Digital core simulation technology, as an emerging numerical simulation method, has gradually come to play a significant role in the study of petrophysical properties. By using this numerical simulation method, the influence of micro factors on seepage properties of reservoir rock is taken into consideration, making up the shortcomings of the traditional physical experiment. Three-dimensional core images are reconstructed by a computed tomography scanning technique. Different sizes of the sub-region were simulated by three methods including the direct computation of Navier-Stokes equations, the simulation of the pore network model, and the lattice Boltzmann method. The permeability computed by each simulation was compared. After comparison between these three methods, the results of the direct computation method based on Navier-Stokes equations were found to be higher than the other two methods. The pore network model simulation has an obvious advantage on the computation speed and the simulation area. The lattice Boltzmann method shows the low efficiency due to the time-consuming process. At last, the permeability calculated by the three methods is matched by the Kozeny-Carman equation. A more accurate formula can be obtained by a series of numerical simulations, which can be applied to marco-scale simulation.
1. Introduction
Microscopic flow simulation technology and computed tomography (CT) such as X-ray CT, have rapidly become essential non-destructive techniques for imaging rocks under deformation in petroleum research. Gradually they have become popular technical tools in the oil industry for studying the physical properties of rocks, due to technological advances in high-quality, high-resolution data acquisition and image processing [1,2]. X-ray Micrometer CT scanning is a technique that uses cone-shaped X-rays to penetrate an object and magnify an image by an objective lens of a different magnification. It consists of a large number of X-ray attenuation images, obtained by 360-degree rotation to reconstruct a three-dimensional model. The CT image reflects the energy attenuation of X-rays as they penetrate the object. Therefore, the three-dimensional CT image can truly reflect the pore structure and relative density in the core. An overview of recent advances and developments in the application of X-ray CT to subsurface flow and transport problems can be found in Wildenschild et al. [3]. Numerical reconstruction methods can also be used to construct three-dimensional representations of the pore space, including Gaussian simulation [4], simulated annealing [5,6], processed-based [7], multiple-point statistic [8], Markov Chain Monte Carlo (MCMC) method [9], etc. Montemagno et al. [10] measured the fracture geometry with X-ray tomography; Wolf et al. [11] determined the cleat angle distribution of the RECOPOL coal seams; Cai et al. [12] conducted permeability evolution in fractured coal by combining triaxial confinement with X-ray computed tomography, acoustic emission, and ultrasonic techniques. Some studies determined aperture structure and fluid flow in a rock fracture by high resolution numerical modeling on the basis of a flow-through experiment under confining pressure [13,14].
For the permeability prediction, the direct solution of the Navier-Stokes equations [15], pore network model [16], and lattice Boltzmann method [17] are used to simulate the flow. In order to better reflect the distribution of pores and throats in the rock, a pore network model needs to be established. To date, there have been numerous models of pore networks established by researchers, but in terms of the topological properties modeled, all previous network models can be divided into two broad categories: Regular topological pore network models and real topological pore network models. In recent years, the lattice Boltzmann (LB) method has become a promising method, and has been successfully applied to a variety of fields such as flows in porous media [18], chemical reactions [19], dissolution and precipitation [20], and multiphase and multicomponent flows [21]. The LB method can be efficiently implemented on parallel computers and easily deals with complex boundaries.
For the digital core analysis, the representative elementary volume (REV) usually needs to be investigated, especially for the calculation of permeability and porosity. In this study however, our purpose is to find the heterogeneity in the core sample, and give the relation between porosity and permeability, which allows us to not consider the permeability-based REV and porosity-based REV [22]. In this study, real rock samples were taken, and core images were obtained by CT scanning technology. The three-dimensional digital core images were processed, including image filtering and image segmentation. The porosity of five digital cores was calculated, and the sub-regions of different sizes were selected for the whole digital core. The direct solution of the Navier-Stokes (N-S) equations, pore network model, and lattice Boltzmann method are used to simulate the flow and to calculate permeability. First, we introduce the three mathematical methods used in the study. Then, different sub-regions are chosen for each method, and the permeability are calculated. Finally, the results are compared and matched by the Kozeny-Carman (K-C) equation.
2. Mathematical Method
2.1. Direct Simulation of Navier-Stokes Equations
In general, the pore network modelling and some numerical methods are solved by Poiseuille equations, degenerated by the N-S equations. Firstly, we directly solve the N-S equations with the finite element method. The control equation of in-compressible viscous fluids is shown in Equation (1):
2.2. Pore Network Model Simulation
The general approach to establishing the pore-network model is to impose mass conservation on the N pores, and to obtain pore pressures by solving the resultant system of equations, subject to specified boundary conditions. For an in-compressible fluid, mass conservation on pore i must be satisfied. For a simple case of Newtonian fluid, the continuity equation applies and we get:
For each pore qij in Equation (2) is the volumetric rate of flow from an adjacent pore j into pore i through their interconnected throat. Pi is the pressure in pore i, and gij is the hydraulic conductivity for the pore throat that connects pores i and j. Equation (2) states that the net accumulation of fluid in pore i is zero. The pressure at each pore and flow rate at each pore-throat are calculated by solving the system of equations.
2.3. Lattice Boltzmann Method
The lattice Boltzmann Method, is a flow field calculation method developed in the mid-1980s. It is derived from the lattice Gas Automata (LGA), developed from a completely discrete lattice gas approach. The Lattice Boltzmann equation is a special discrete form of Boltzmann-BGK equation. The BGK model is defined by the following equation:
where is a particle distribution function representing the probability of finding a fluid particle with a velocity at location x and time t. is the relaxation time. b is the number of velocities. is an equilibrium distribution function. All the variables in the lattice Boltzmann method are dimensionless.
Qian et al. proposed a series of models of DdQm (d-dimensional space, m discrete velocities) as the basic model of the lattice Boltzmann method [17]. For 2D regular cell models, the most commonly used lattice structure is D2Q9.
The equilibrium distribution function for the D2Q9 lattice model is given as follows:
where is the weight factor in the j direction. is the speed of sound, and . The relaxation time is related to the viscosity by
3. Numerical Simulation and Analysis
3.1. Physical Models
3.1.1. X-Ray CT Scanning Test
Five sandstone core samples were used in CT scanning. The instrument used by the X-ray CT scanning is the Xradia 400 micron CT scanner. Basic information of the five cores of the X-ray CT scanning is shown in Table 1. The scanning image of No. 1 core sample is shown in Figure 1.

Table 1.
Scanning parameters for each core sample.
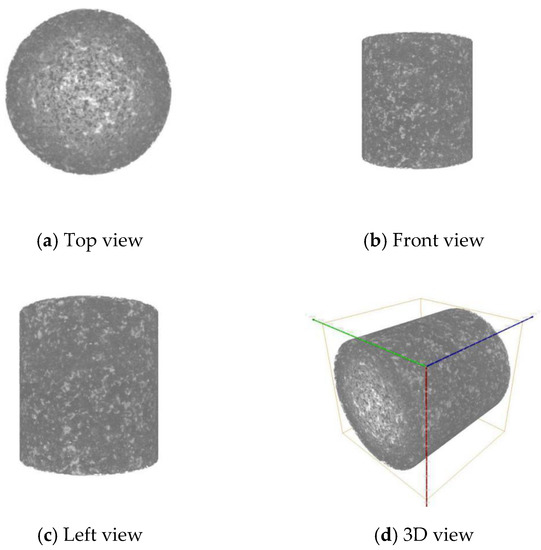
Figure 1.
Scanning result of No. 1 core sample.
Then, the watershed segmentation algorithm is adopted in this study. Watershed algorithm, based on the morphological segmentation algorithm, is the gradient of image segmentation. This algorithm will use local threshold values, not one threshold value for the whole map. The purpose of image segmentation is to divide the image into different objects, that is, to extract the edge of the object. Since the edge of the object changes sharply, the gradient image just describes the change of the image’s gray level. Therefore, the original image can be detected by the gradient operator edge detection gradient image, and then through the gradient image watershed transform image segmentation. Figure 2 shows the pore size distribution [18,23] of No. 1 rock sample. The pore size mainly ranges from 150 μm to 200 μm. Permeability and porosity are calculated in the sub-regions. Then, the porosity of the whole core can be calculated for each of the five digital cores.
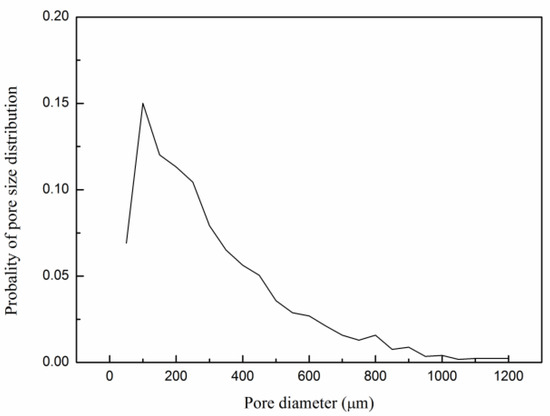
Figure 2.
Pore size distribution of No. 1 rock sample.
3.1.2. Permeability Calculation Based on Direct Solving of N-S Equations in Avizo
Avizo is adopted for the direct solving of N-S equation. A preliminary test that can be performed prior to the permeability computation is a percolation test. The aim is to be sure that the void space existing in the material allows a fluid going from one side to another. One core example is shown in Figure 3. The isolated void spaces are removed, which makes the computation more efficient.
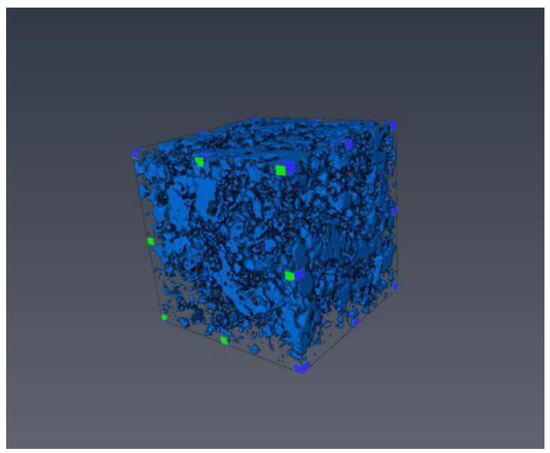
Figure 3.
Filtered and segmented image of one digital core (3D).
The permeability simulation was performed with the Absolute Permeability Experiment Simulation Module in Avizo, and the absolute permeability was calculated. The default parameters simulate an experiment along the Z axis with the input pressure at and the atmospheric pressure at output. The resolution or the pixel size is 19.8502 μm, as shown in Table 1. The default viscosity is the viscosity of water. The boundary conditions of the experiment can also be modified, so that the velocity and pressure fields are scaled with these values. In this study, the permeability of each core sample in X, Y and Z directions was obtained. The simulation results of five core samples are shown in Table 2, and the velocity distribution of No. 5 core sample is shown in Figure 4. From the results of permeability in three directions, it can be found that the permeability in each direction varies greatly, with the difference ranging from 0.8 μm2 to 3.4 μm2, which reflects heterogeneity of cores.
Table 2.
Permeability calculation results using direct solution of N-S equations in Avizo.
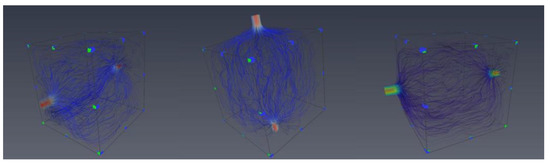
Figure 4.
Experimental simulation of the flow in X, Y and Z directions.
3.1.3. Permeability Calculation Based on Pore Network Model Simulation
The pore network model of digital core is as shown in Figure 5. The above operation was performed for each of the five digital cores to obtain the permeability in different parts of the digital cores. For the simulation, seven sub-regions with the size of 350 × 350 × 350 were selected to calculate the permeability, and the simulation results are shown in Table 3.
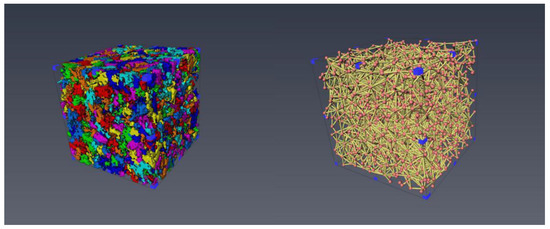
Figure 5.
The establishment of the pore network model.
Table 3.
Permeability calculation results using pore network model simulation.
From the results, it can be seen that the permeability calculated in different sub-regions differs greatly. The difference is between 0.1 μm2 and 0.6 μm2, reflecting the heterogeneity of the core. In addition, compared with the previous results, this method performs a more extensive range of permeability simulation and faster calculation speed, which is an efficient method of permeability prediction.
3.1.4. Permeability Calculation Based on the Lattice Boltzmann Method
Due to the heavy computation problem, the size of sub-region is set as 100 × 100 × 100. This study performed the above operations on all five digital cores, and obtained the permeability calculation results as shown in Table 4.
Table 4.
Permeability calculation results using the lattice Boltzmann method.
The method has more rigorous calculation conditions, and the sub-region is the smallest compared to the other two methods. The calculation requires about 8 h for each case, but only a few seconds or minutes are needed for the previous two methods.
3.2. Results Analysis
The permeability calculated by the above three methods is matched by the K-C equation, as shown in Equation (6).
where is porosity, is permeability, and d is the average diameter of sand grains. Fit the calculated porosity and permeability to the K-C formula curve, as shown in Figure 6.
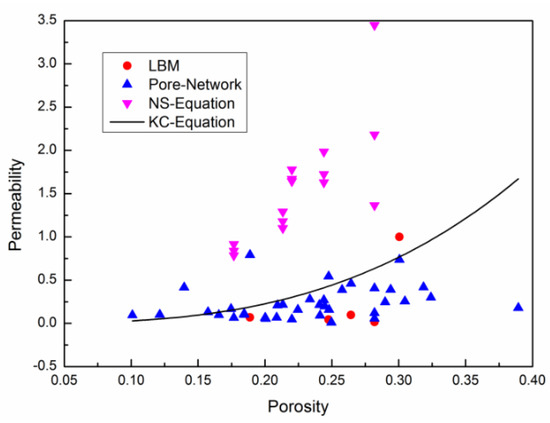
Figure 6.
Permeability fitting results.
The results of direct solving N-S equation in Avizo deviate from the other two methods, almost above 1 μm2. The permeability calculated by the pore network model is between 0.1 μm2 and 0.6 μm2, reflecting the heterogeneity of the core. In addition, compared with the other two methods, this method performs a faster calculation speed, which is a very efficient method of permeability simulation. The calculation with the lattice Boltzmann method is cumbersome, and the computation time is much longer.
Comparing the three methods, the permeability predicted by direct solving of the N-S equation in Avizo is greater than that predicted by pore network model simulation and the lattice Boltzmann method.
4. Conclusions
We investigated the most common three methods of permeability prediction by computational fluid dynamics calculation, which solve the Navier-Stokes equations, pore network model simulation, and the lattice Boltzmann method. The first two methods are implemented in Avizo, and the lattice Boltzmann method is implemented by our own code. These three methods show different characteristics in the process of permeability simulation, and their calculation results are also different from each other. The permeability predicted by the direct solving N-S equation in Avizo is greater than that predicted by pore network model simulation and the lattice Boltzmann method. The computation time with the lattice Boltzmann method is the longest.
The results of different sub-regions are quite different, which can reflect the core heterogeneity of cores. The final results were matched by KC formula. For future work, a more accurate formula can be obtained by a series of numerical simulations, which can be applied to macro-scale simulation.
Author Contributions
The following statements should be used: Conceptualization, L.Z. and H.S.; formal analysis, W.J. and J.Z.; writing—original draft preparation, W.J. and L.Z.; writing—review and editing, Y.G., Y.Y., and H.Y.; project administration, J.Y.; funding acquisition, J.Y.
Funding
This research was funded by Fundamental Research Funds for the Central Universities (No. 18CX02031A, No. 17CX05003), National Natural Science Foundation of China (No. 51674280), Shandong Provincial Natural Science Foundation (ZR2019JQ21), Key Research and Development Plan of Shandong Province (2018GSF116009).
Conflicts of Interest
The authors declare no conflict of interest.
References
- Knackstedt, M.A.; Sok, R.; Adrian, S.; Arns, C.H. 3D Pore Scale Characterisation of Carbonate Core: Relating pore types and interconnectivity to petrophysical and multiphase flow properties. In Proceedings of the International Petroleum Technology Conference, Dubai, UAE, 4–6 December 2007; p. 6. [Google Scholar]
- Cipolla, C.L.; Lolon, E.; Mayerhofer, M.J.; Warpinski, N.R. Fracture Design Considerations in Horizontal Wells Drilled in Unconventional Gas Reservoirs. In Proceedings of the SPE Hydraulic Fracturing Technology Conference, The Woodlands, TX, USA, 19–21 January 2009; p. 10. [Google Scholar]
- Wildenschild, D.; Sheppard, A.P. X-ray imaging and analysis techniques for quantifying pore-scale structure and processes in subsurface porous medium systems. Adv. Water Resour. 2013, 51, 217–246. [Google Scholar] [CrossRef]
- Joshi, M.Y. A Class of Stochastic Models for Porous Media; University Microfilms: Ann Arbor, MI, USA, 1975. [Google Scholar]
- Hazlett, R. Statistical characterization and stochastic modeling of pore networks in relation to fluid flow. Math. Geol. 1997, 29, 801–822. [Google Scholar] [CrossRef]
- Yeong, C.; Torquato, S. Reconstructing random media. Phys. Rev. 1998, 57, 495. [Google Scholar] [CrossRef]
- Bryant, S.; Blunt, M. Prediction of relative permeability in simple porous media. Phys. Rev. 1992, 46, 2004. [Google Scholar] [CrossRef] [PubMed]
- Okabe, H.; Blunt, M.J. Prediction of permeability for porous media reconstructed using multiple-point statistics. Phys. Rev. 2004, 70, 066135. [Google Scholar] [CrossRef] [PubMed]
- Wu, K.; Van Dijke, M.I.; Couples, G.D.; Jiang, Z.; Ma, J.; Sorbie, K.S.; Crawford, J.; Young, I.; Zhang, X. 3D stochastic modelling of heterogeneous porous media–applications to reservoir rocks. Transp. Porous Media 2006, 65, 443–467. [Google Scholar] [CrossRef]
- Montemagno, C.; Pyrak-Nolte, L. Fracture network versus single fractures: Measurement of fracture geometry with X-ray tomography. Phys. Chem. Earth A Solid Earth Geod. 1999, 24, 575–579. [Google Scholar] [CrossRef]
- Wolf, K.-H.A.; van Bergen, F.; Ephraim, R.; Pagnier, H. Determination of the cleat angle distribution of the RECOPOL coal seams, using CT-scans and image analysis on drilling cuttings and coal blocks. Int. J. Coal Geol. 2008, 73, 259–272. [Google Scholar] [CrossRef]
- Cai, Y.; Liu, D.; Mathews, J.P.; Pan, Z.; Elsworth, D.; Yao, Y.; Li, J.; Guo, X. Permeability evolution in fractured coal—Combining triaxial confinement with X-ray computed tomography, acoustic emission and ultrasonic techniques. Int. J. Coal Geol. 2014, 122, 91–104. [Google Scholar] [CrossRef]
- Watanabe, N.; Hirano, N.; Tsuchiya, N. Determination of aperture structure and fluid flow in a rock fracture by high-resolution numerical modeling on the basis of a flow-through experiment under confining pressure. Water Resour. Res. 2008, 44. [Google Scholar] [CrossRef]
- Nemoto, K.; Watanabe, N.; Hirano, N.; Tsuchiya, N. Direct measurement of contact area and stress dependence of anisotropic flow through rock fracture with heterogeneous aperture distribution. Earth Planet. Sci. Lett. 2009, 281, 81–87. [Google Scholar] [CrossRef]
- Zhu, G.; Chen, H.; Yao, J.; Sun, S. Efficient energy-stable schemes for the hydrodynamics coupled phase-field model. Appl. Math. Model. 2019, 70, 82–108. [Google Scholar] [CrossRef]
- Blunt, M.; King, P. Relative permeabilities from two-and three-dimensional pore-scale network modelling. Transport. Porous Media 1991, 6, 407–433. [Google Scholar] [CrossRef]
- Qian, Y.-H.; d’Humières, D.; Lallemand, P. Lattice BGK models for Navier-Stokes equation. EPL Europhys. Lett. 1992, 17, 479. [Google Scholar] [CrossRef]
- Zhang, L.; Kang, Q.; Yao, J.; Gao, Y.; Sun, Z.; Liu, H.; Valocchi, A.J. Pore scale simulation of liquid and gas two-phase flow based on digital core technology. Sci. China Technol. Sci. 2015, 58, 1375–1384. [Google Scholar] [CrossRef]
- Chen, L.; Kang, Q.; He, Y.-L.; Tao, W.-Q. Pore-scale simulation of coupled multiple physicochemical thermal processes in micro reactor for hydrogen production using lattice Boltzmann method. Int. J. Hydrog. Energy 2012, 37, 13943–13957. [Google Scholar] [CrossRef]
- Kang, Q.; Zhang, D.; Chen, S.; He, X. Lattice Boltzmann simulation of chemical dissolution in porous media. Phys. Rev. 2002, 65, 036318. [Google Scholar] [CrossRef] [PubMed]
- Chen, L.; Kang, Q.; Mu, Y.; He, Y.-L.; Tao, W.-Q. A critical review of the pseudopotential multiphase lattice Boltzmann model: Methods and applications. Int. J. Heat Mass Transf. 2014, 76, 210–236. [Google Scholar] [CrossRef]
- Javanbakht, G.; Arshadi, M.; Qin, T.; Goual, L. Micro-scale displacement of NAPL by surfactant and microemulsion in heterogeneous porous media. Adv. Water Resour. 2017, 105, 173–187. [Google Scholar] [CrossRef]
- Qin, T.; Javanbakht, G.; Goual, L.; Piri, M.; Towler, B. Microemulsion-enhanced displacement of oil in porous media containing carbonate cements. Coll. Surf. A Physicochem. Eng. Asp. 2017, 530, 60–71. [Google Scholar] [CrossRef]


© 2019 by the authors. Licensee MDPI, Basel, Switzerland. This article is an open access article distributed under the terms and conditions of the Creative Commons Attribution (CC BY) license (http://creativecommons.org/licenses/by/4.0/).