Abstract
The zero energy building (ZEB) is being introduced as a new energy policy in the building sector. Accordingly, to realize the ZEB, renewable energy systems that can produce energy are essential. Various hybrid systems are being proposed to develop a more efficient system than individual renewable energy systems, among which tri-generation systems are attracting attention. In this study, in order to find an economic solution of a tri-generation system for the realization of ZEB, the simulation model using the dynamic energy analysis code was constructed and a feasibility study was conducted. Moreover, the conventional design method and the design method for ZEB realization were proposed, and the return on investment (ROI) was calculated according to four local conditions and two design methods. As a result of energy analysis, the energy self-sufficiency (ES) in Seoul, Ulsan, Ottawa and Toronto were calculated as 62%, 65.1%, 57.7%, and 60.2%, respectively. Moreover, results of feasibility analysis compared to a conventional system showed that the payback period of the tri-generation system in South Korea was within 13 years, and Canada was within 10 years.
1. Introduction
Global energy demand is expected to increase by 25% by 2040 as per the new policies scenario of the International Energy Agency (IEA); increasing global population and people’s incomes mostly in urban areas of developing economies are the predominant causes [1]. As global energy demand grows, countries around the world are developing clean energy technologies as an alternative to reduce greenhouse gas emissions and cope with climate change while actively encouraging the use of such technologies through diverse policies. The energy demand of South Korea is high compared to the size of its economy, as 94.2% of its energy supply depends on imports. South Korea’s energy demand and supply structure is highly vulnerable to energy security issues [2]. To address this, South Korea is promoting the development of technologies for renewable energy as an energy source. South Korea has also presented a plan to increase the percentage of power generation using renewable energy to 20% by 2030 and is expected to expand the supply of renewable energy such as photovoltaic, wind power, solar thermal, and geothermal [2]. In particular, the zero energy building (ZEB) is introduced as a new energy policy of building sector. Accordingly, in order to realize ZEB, renewable energy systems that can produce energy are essential. However, a performance of an individual renewable energy system such as a photovoltaic (PV) system or a geothermal system is affected by an external condition or a heat source condition, and it is difficult to ensure reliability on energy supply due to intermittent production of energy.
To cope with various load patterns of buildings, it is essential to minimize the effect of the external conditions on the performance of the system and stably produce energy. To overcome disadvantages of individual renewable energy such as photovoltaic and geothermal and improve reliability on the performance of the system and energy production, many studies on hybrid systems which combine renewable energy technologies have been conducted in various aspects. In order to improve the thermal and electric efficiency of the photovoltaic-thermal (PVT) system, which combines the solar-thermal system and PV module. The parameter study is carried out through the verification experiment and energy simulation. The optimal design method of the system is proposed by using this result [3,4,5,6,7]. Ramos et al. [8] analyzed feasibility and affordability of the PVT systems coupled with small-scale electrically or thermally driven solar heating and absorption chillers or heat pumps cooling systems in Europe. As a result, Seville, Rome, Madrid and Bucharest were proved to be the most promising for the installation of PVT systems. Guarracino et al. [9] have developed a three-dimensional numerical model of a hybrid PVT collector with the aim of calculating the temperature distribution over the PV panel. In addition, to estimate the annual thermal and electrical energy outputs generated by the collector in a UK domestic installation, Zhou et al. [10] conducted a solar PVT cogeneration system that consists of novel PVT collectors that can generate thermal energy and electric energy simultaneously. Furthermore, it is suggested that the optimization design of solar PVT cogeneration system is based on the building energy demand.
On the other hand, the performance analysis of the hybrid system with PVT and ground source heat pump (GSHP) has been compared with the conventional system, and the energy efficiency and economic analysis of the system have been performed through dynamic simulation. Xia et al. [11] have developed an optimal control strategy for hybrid GSHP-PVT systems and evaluated an energy-efficient control setting such as a genetic algorithm. The evaluation of the optimal control strategy described that this development strategy was able to reduce the system electricity consumption by a maximum of 7.8%. Entchev et al. [12] have studied hybrid renewable microgeneration system with a GSHP and PVT that able to satisfy both heating and cooling loads in a load-sharing application between a detached house and small office building. As a result, the combined hybrid GSHP–PVT system saves overall energy of 58%. Canelli et al. [13] investigated the performance of two different hybrid renewable systems in load-sharing applications through dynamic simulation. In addition, to evaluate the different systems, energy, environmental and economic analysis (3-E) was conducted. The hybrid GSHP-PVT reduction of operational cost equal to 56.4% against the other cases such as conventional boiler and chiller, ground source heat pump system, hybrid microgeneration system. Emmi et al. [14] have investigated and compared the energy performances of a heat pump coupled with the photovoltaic-thermal hybrid solar collector for a single-family dwelling located in North East Italy. As a result of simulation, multi-energy source systems increased the energy efficiency by 16%–25% against an ordinary air-to-water heat pump system. Jeong et al. [15] calculated annual performance based on hourly system performance and weather data. Moreover, in order to decide a suitable system capacity between PVT and GSHP, a sensitivity analysis was conducted. The results show that the hybrid system can achieve 15.5% higher performance at most than only a GSHP system. Conti et al. [16] analyzed the use of hybrid PVT collectors in nearly zero-energy buildings. A design methodology based on the dynamic simulation of the whole energy system, which includes the building load, the thermal storage, a reversible heat pump, the power exchange with the grid, and solar collectors was suggested.
As such, in previous studies, performance analysis or a prototype experiment for a hybrid system was conducted. However, there are few studies on the quantitative analysis on energy performance of the renewable hybrid system considering building load condition. Furthermore, even though energy simulation was conducted as a case study, a suitable design method for tri-generation system has not been considered. In this study, in order to find an economic solution of tri-generation system for the realization of a ZEB, the simulation model using the dynamic energy analysis code was constructed and a feasibility study was conducted. Moreover, the conventional design method and the design method for ZEB realization were proposed, and return on investment (ROI) was calculated according to four local conditions and two design methods. In addition, economic solution for tri-generation system was suggested based on the ROI of alternative cases.
2. Design Methods of the Tri-Generation System
In this study, the design method was set up to analyze the energy performance of the tri-generation system and to evaluate the feasibility.
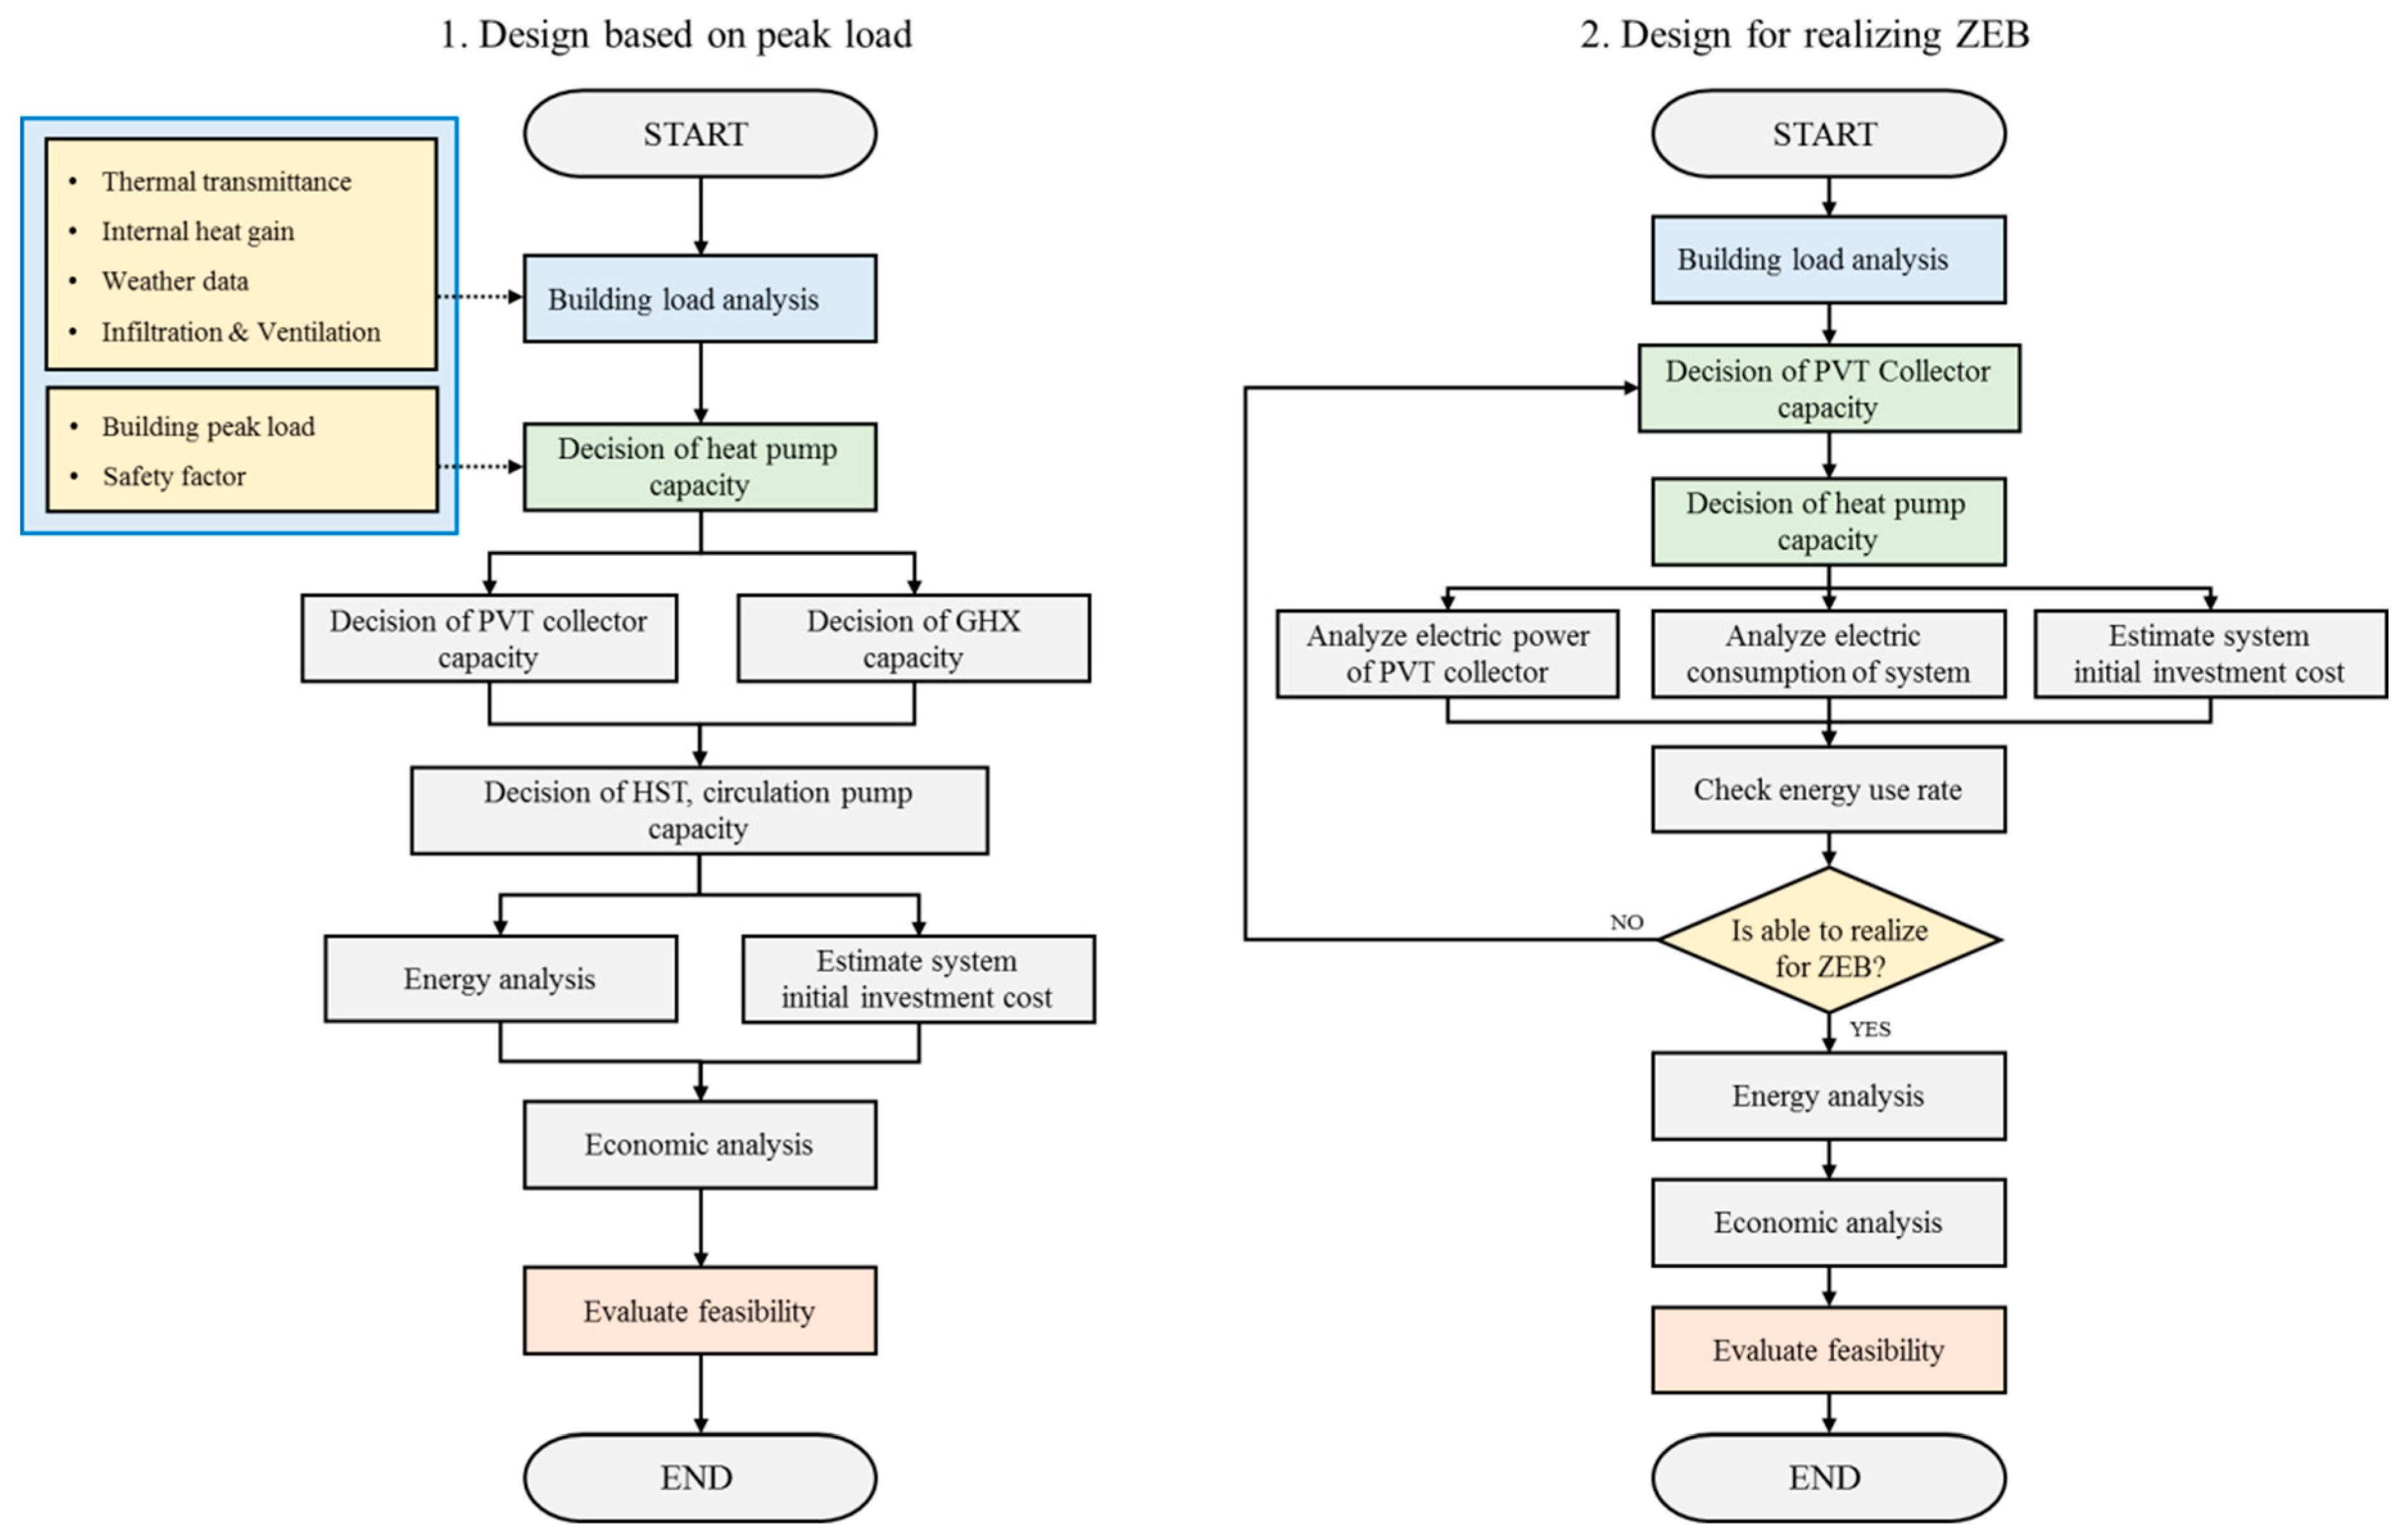
Figure 1 shows the design methods of the tri-generation system. Design methods are classified into two types: design based on peak load of the building and design for realizing the ZEB. The design based on peak load is a commonly used system design method, that is based on the peak load of the building and the safety factor. The peak load of the building is calculated by inputting the conditions required for building load analysis such as thermal transmittance according to the building code for each nation, weather data of each region, and internal heat gain. After the peak load of the building is calculated, the heat pump capacity is determined by considering the safety factor. The capacity of the photovoltaic-thermal (PVT) collector and the ground heat exchanger (GHX) are determined by the capacity of the heat pump. After the capacity of each unit (heat pump, PVT collector, GHX, heat storage tank and circulation pump) is determined, the initial investment cost of the system can be estimated. In addition, performance analysis can be performed on system energy efficiency. The energy cost of the system is calculated based on the energy efficiency analysis, and the total cost (initial investment cost and energy cost) is determined via economic analysis. Based on the results of the economic analysis, feasibility evaluation of the system is conducted.
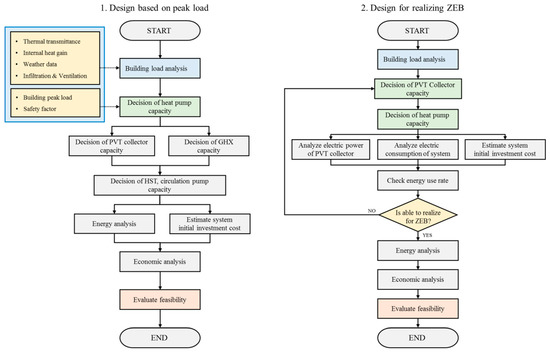
Figure 1.
Design methods of the tri-generation system.
The design for realizing a ZEB allows the sum of annual system energy demand and annual PVT collector power production to be zero to cope with heating/cooling and the domestic hot water (DHW) load of buildings. The system capacity is determined as the in the design method for the peak load; however, the capacity of the PVT collector is preferentially determined for realizing ZEB. After the determination of the PVT collector and heat pump capacities, expected power production of the PVT collector and expected power consumption of the system are calculated. Based on the results of power production and power consumption, the building energy use rate is calculated and it is determined whether the realization of a ZEB is possible. When a ZEB is realized, the feasibility of the system is evaluated through performance analysis and economic analysis as in design based on peak load. If a ZEB is not realized, the capacity of the PVT collector is altered, and all sequential steps are repeated.
3. Performance Prediction Model of the Tri-Generation System
3.1. Overview of the Tri-Generation System
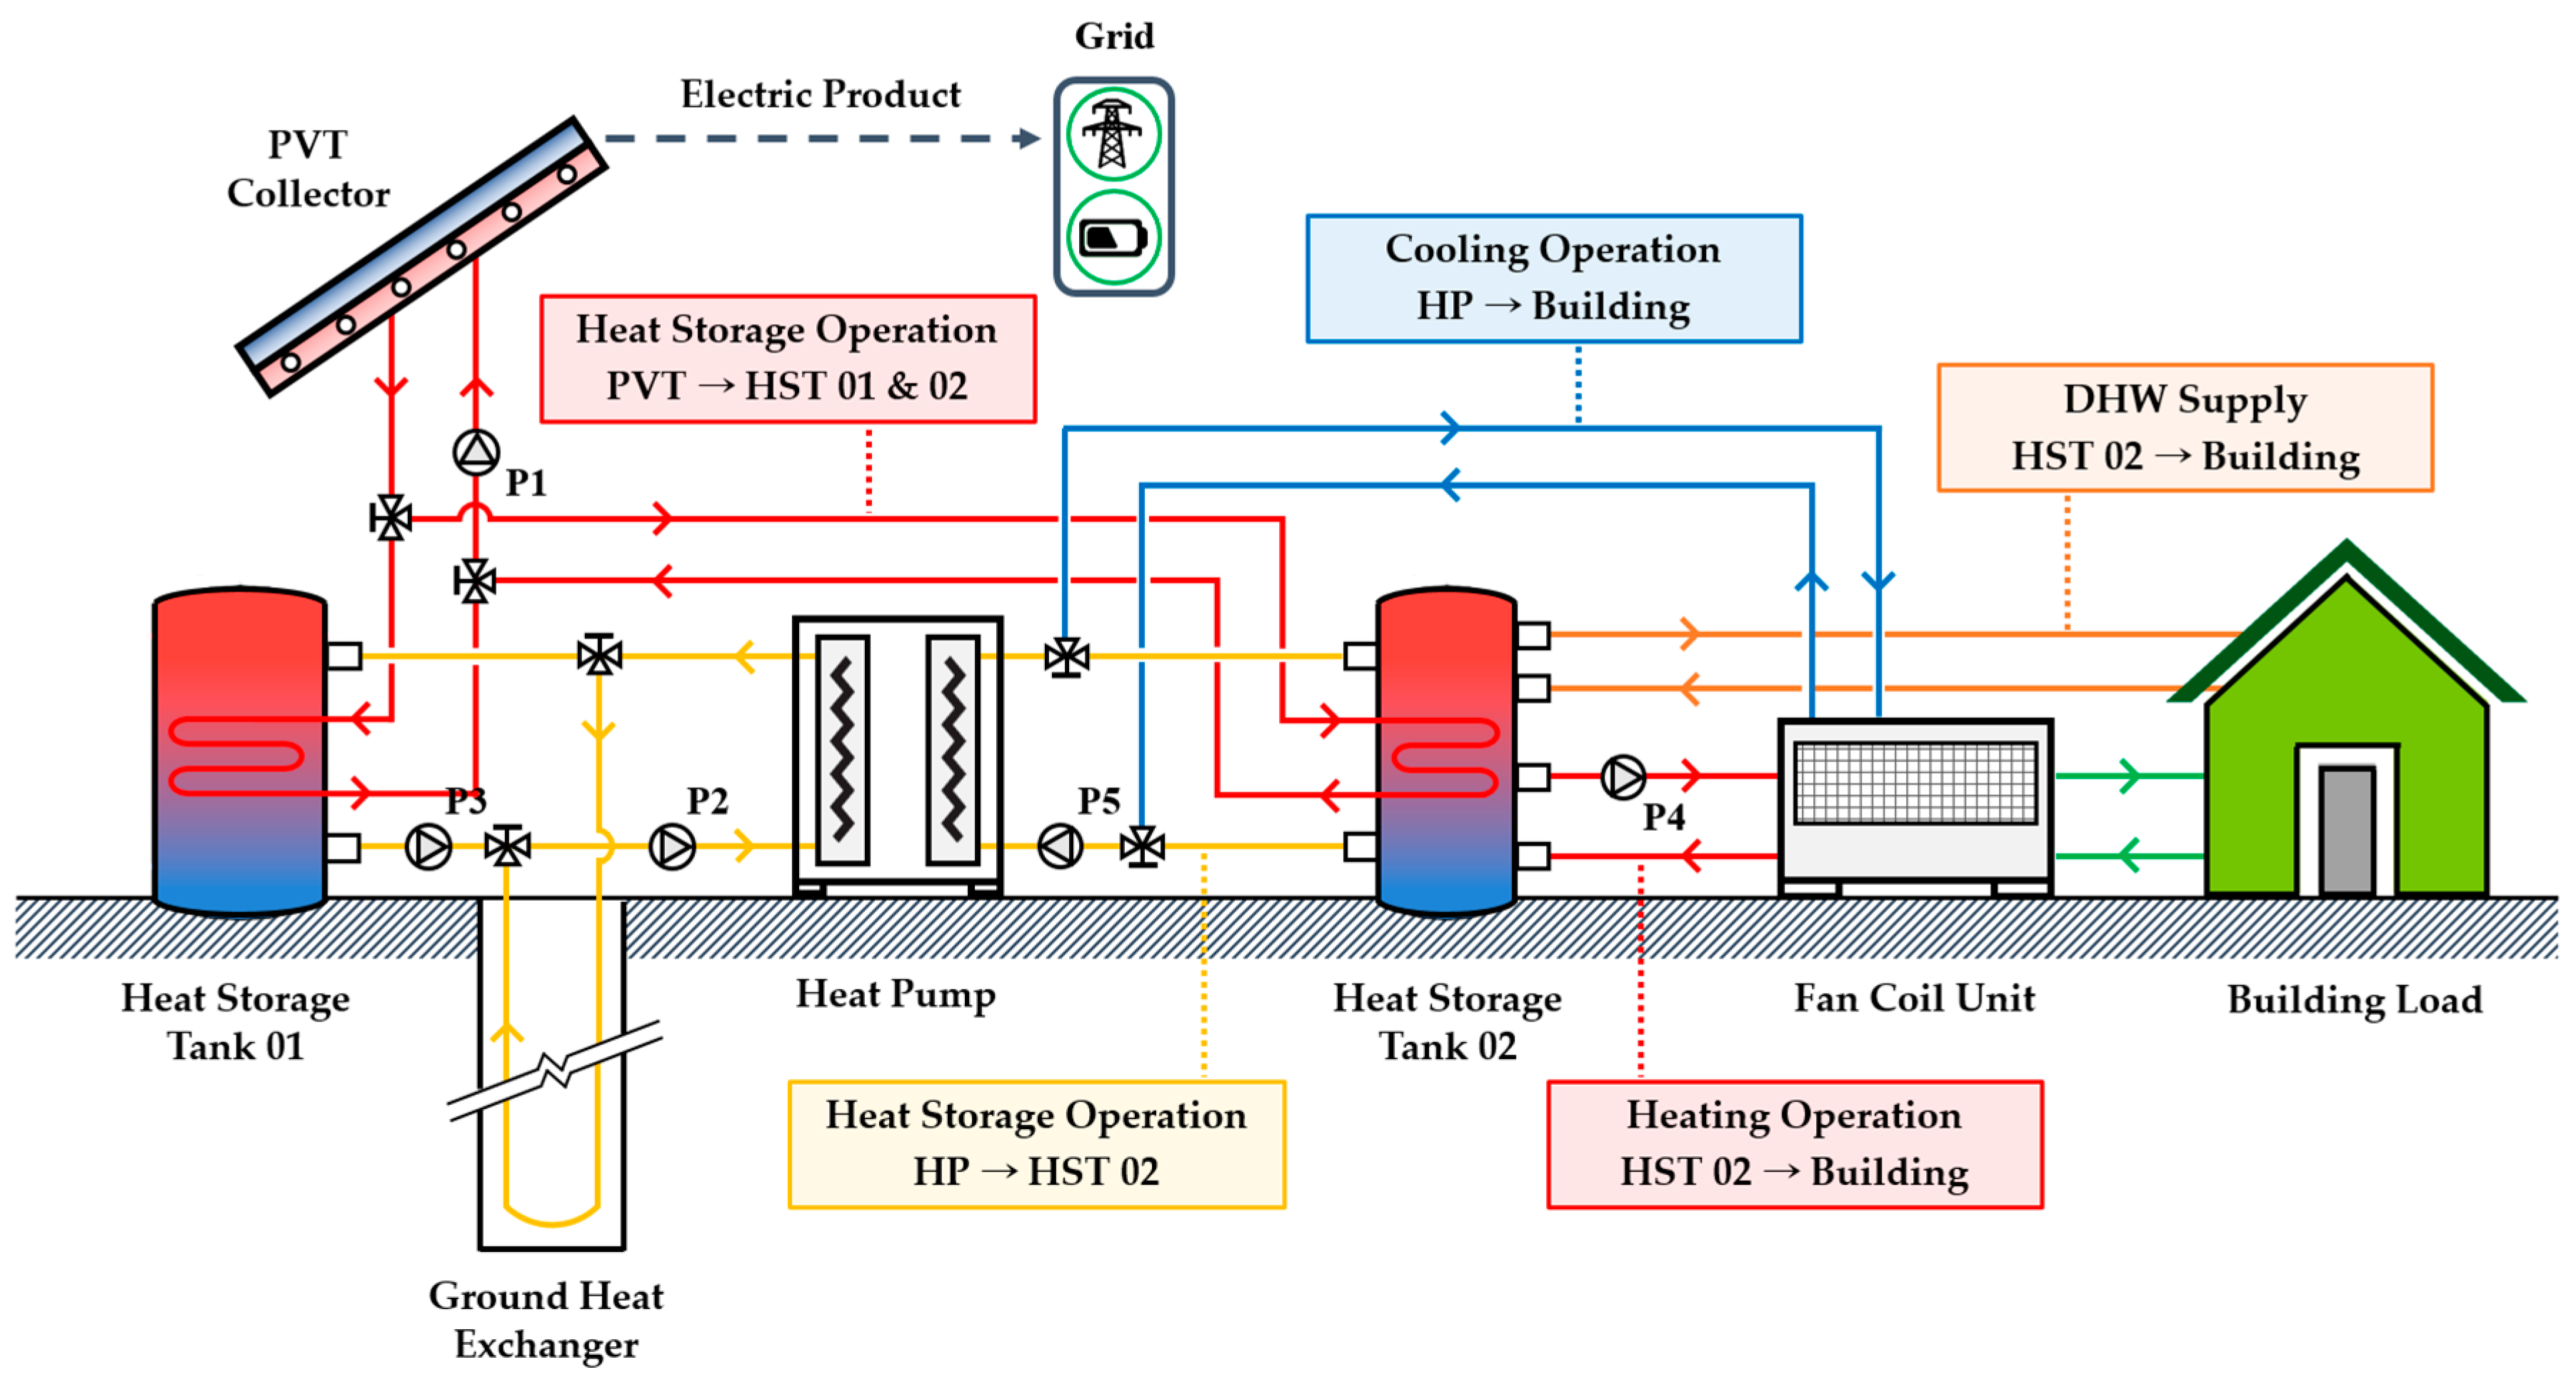
Figure 2 shows the overview of the tri-generation system. The tri-generation system is consisted of ground heat exchanger (GHX), PVT collector, heat pump, heat storage tank (HST), fan coil unit (FCU), circulating pump, and flow diverter.

Figure 2.
Concept of the tri-generation system.
This system is able to fulfill the energy demand such as electric power, heating, cooling and DHW of buildings by the PVT collectors and the ground source heat pump (GSHP). Also, the electric power produced in the photovoltaic module can be used for system operation or sold through reverse transmission. Besides, the tri-generation system can reduce the design capacities of the PVT collector and GSHP in comparison to the individual system as the peak load of building can be distributed. In addition, when the weather is cloudy or the solar radiation is not available, GSHP can be used instead of the PVT collector to cope with building heating and DHW load, and stable energy production is possible. On the other hand, as operation for supply of DHW using the PVT collector and operation for cooling using a GSHP can be carried out at the same time in the summer. This operation can be carried out even under a situation where demands for cooling and DHW supply coexist. The system operation method consists of eight types, and these are detailed in Section 3.4.
3.2. Decision of the Initial System Capacity
3.2.1. Climate Data for Each Local
To design the initial system capacity, cooling and heating loads of buildings are required to be analyzed based on the building design standard of each country. In addition, the building design standards and the heating/cooling loads are vastly affected by meteorological conditions. An analysis of the ambient temperature in each area was required for building load analysis. In this study, the monthly average ambient temperature was analyzed for four regions in South Korea and Canada.
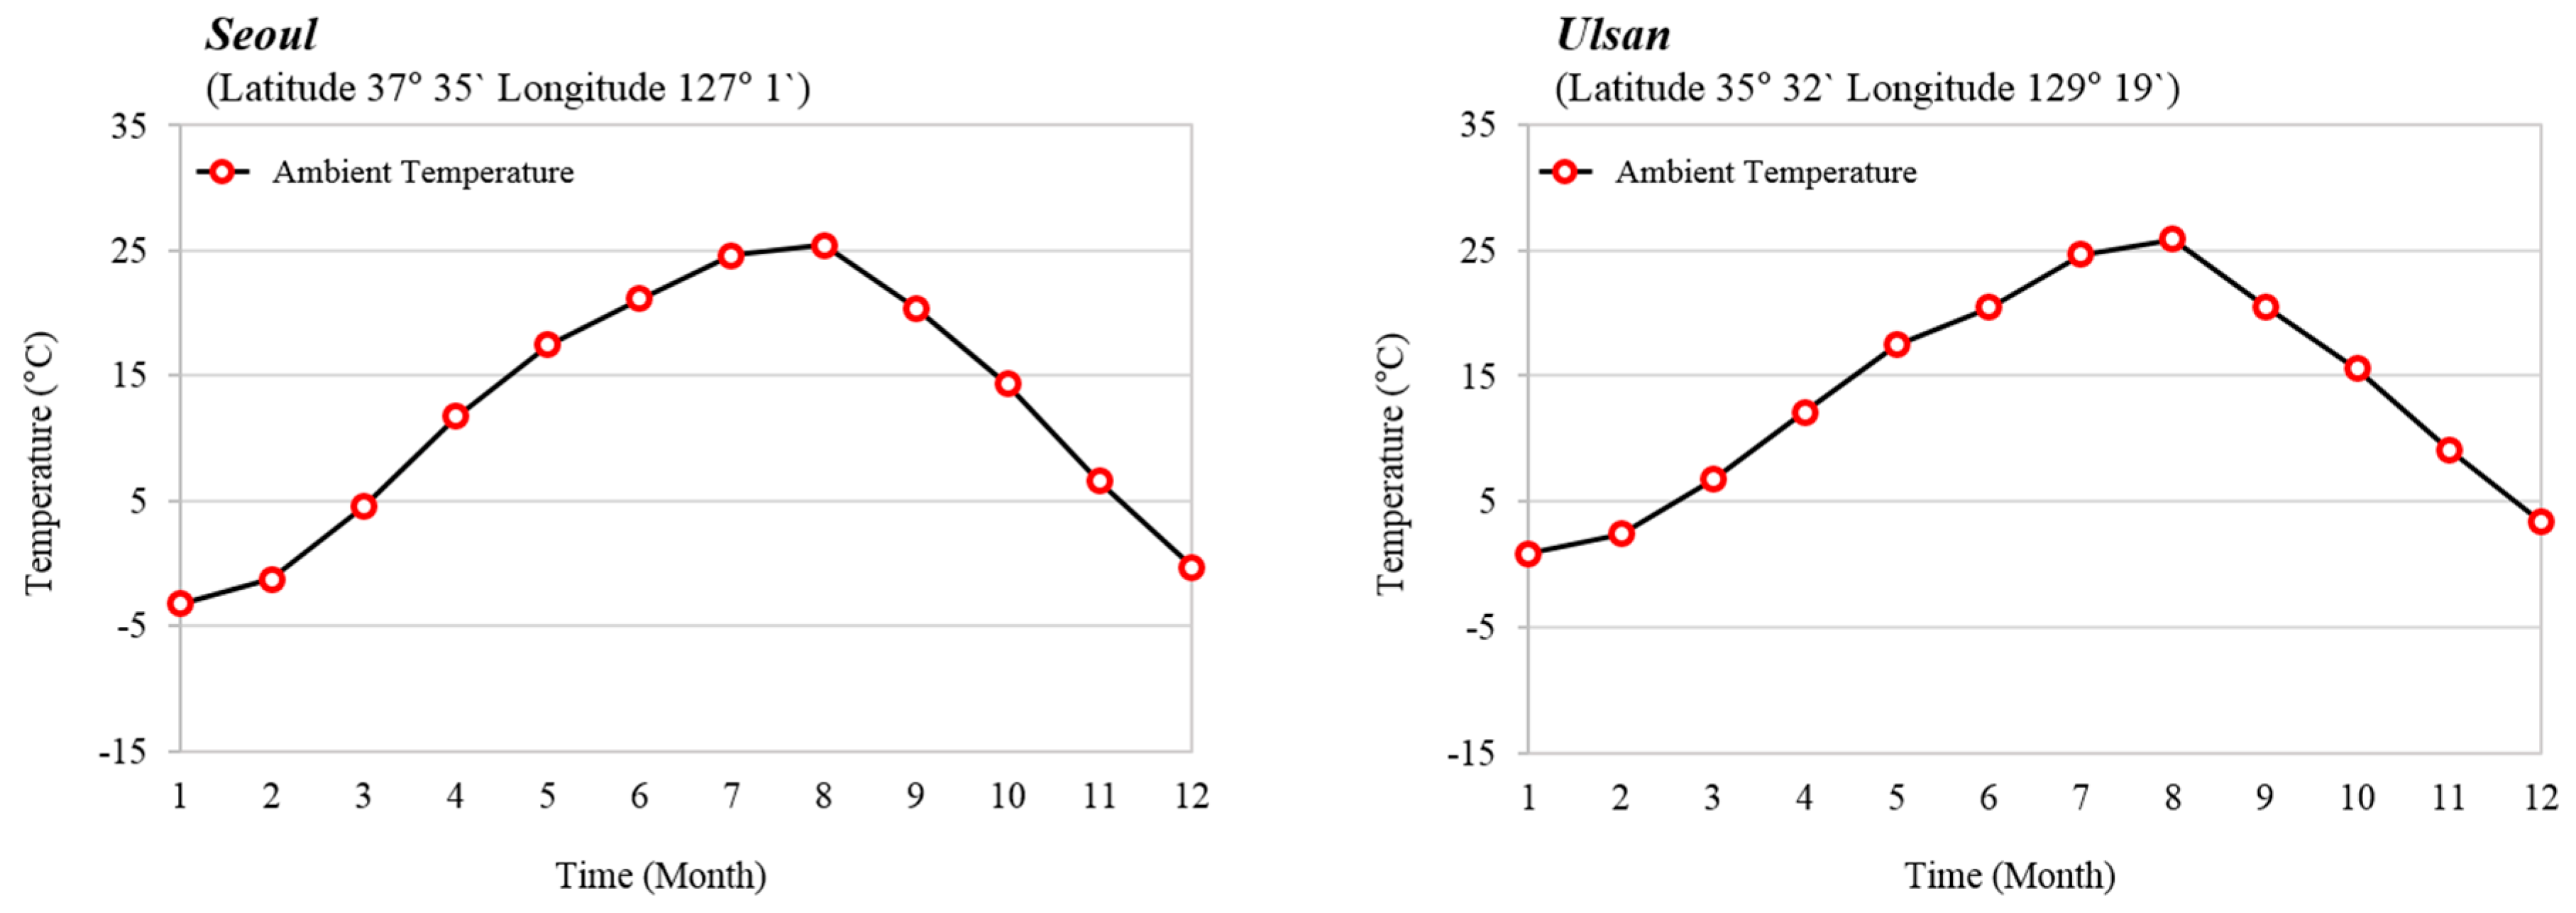
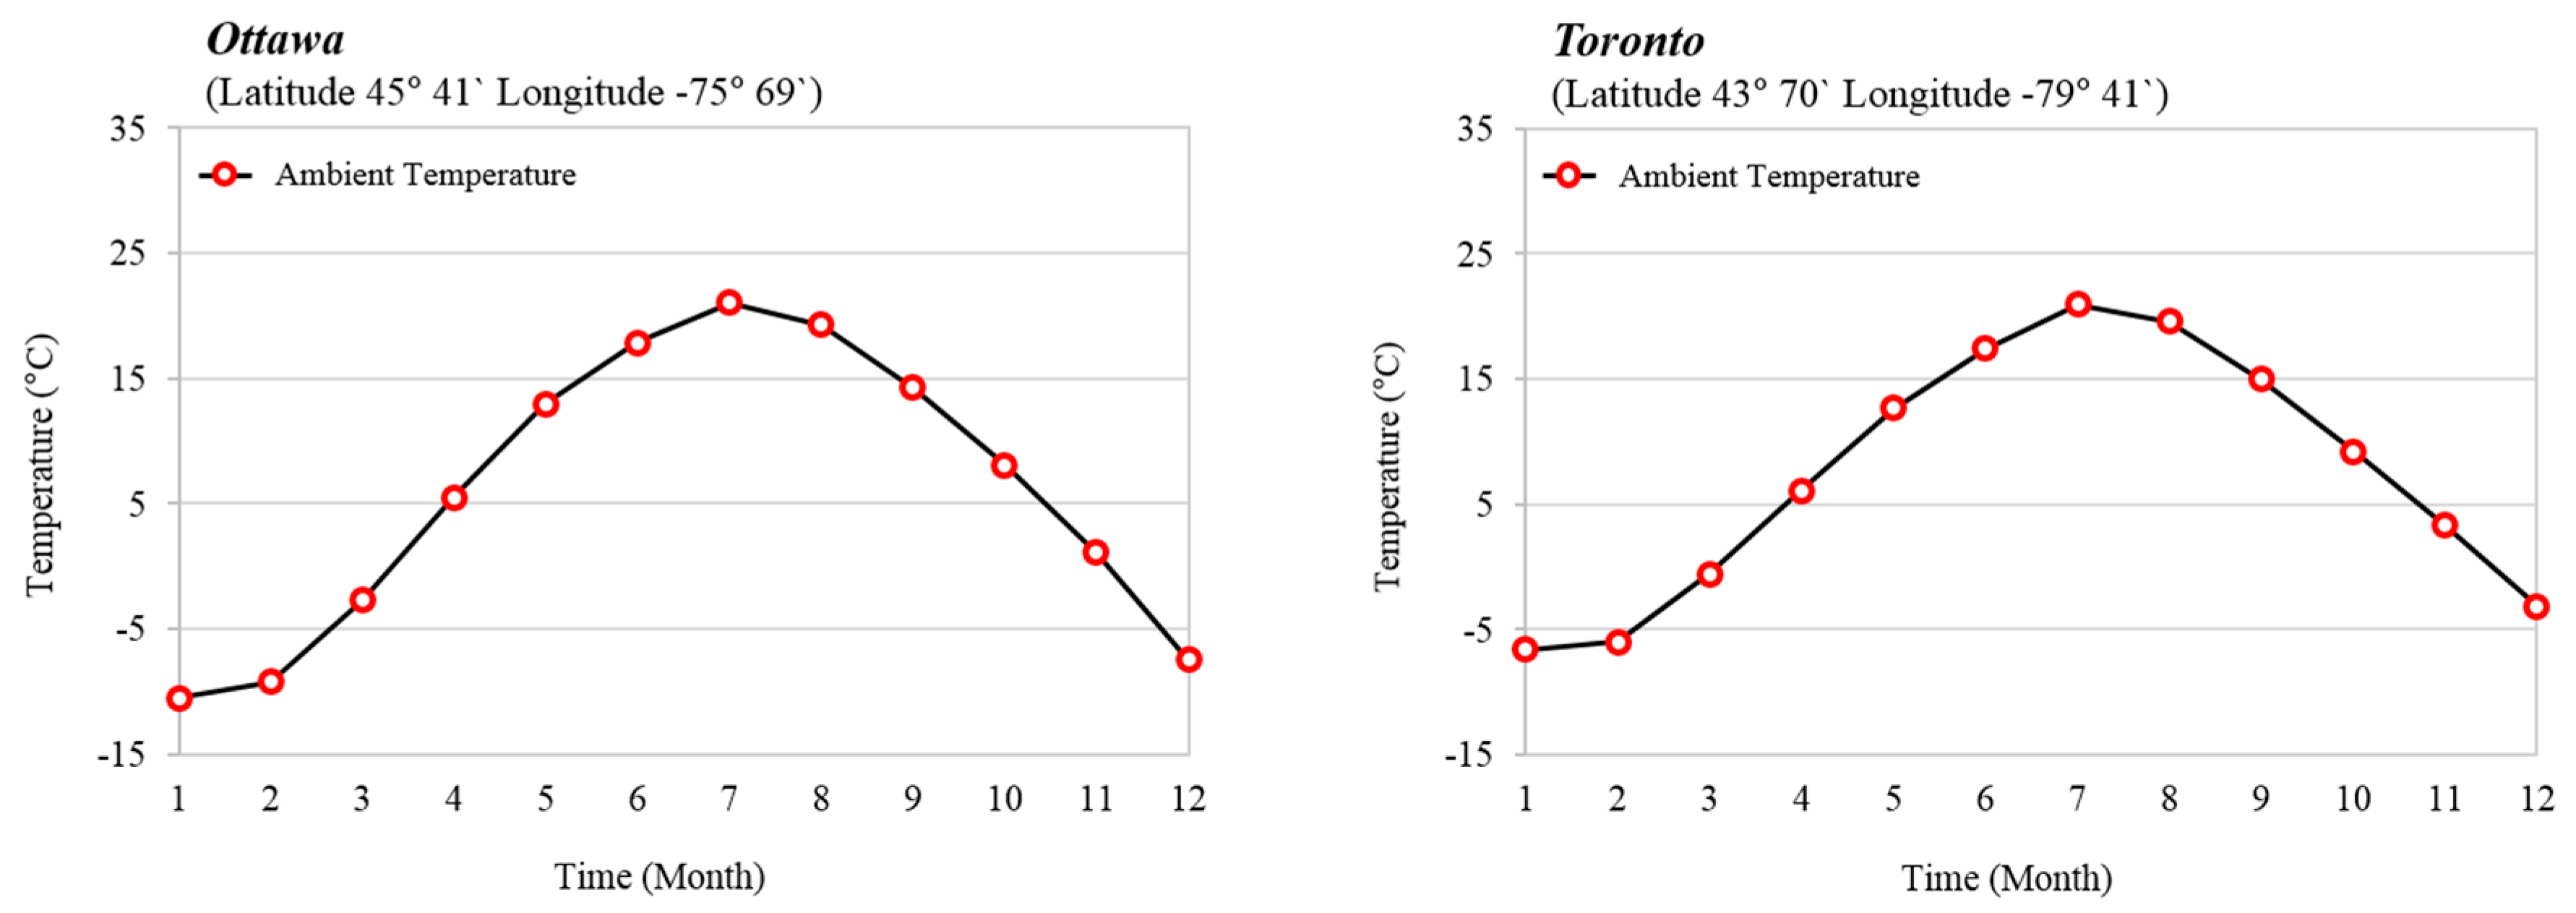
Figure 3 shows the latitude and longitude for the four regions. The latitude of Seoul is 37°35′ and its longitude is 127°1′, and those of Ulsan are 35°32′ and 129°19′ respectively. Also, the latitude of Ottawa is 45°41′ and its longitude is −75°69′, and those of Toronto are 43°70′ and −79°41′ respectively.
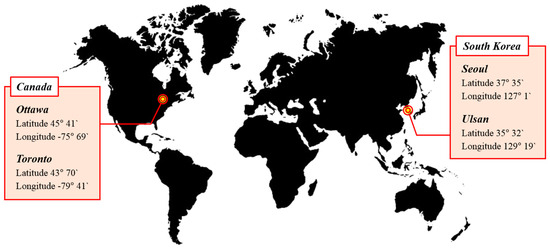
Figure 3.
Latitude and longitude for the four regions.
Figure 4 shows the monthly average ambient temperature. The weather data used for the building load model are from U.S. National Renewable Energy Laboratory (NREL) database in TMY2 format [17]. The annual average ambient temperature in Seoul was 11.7 °C, while the highest and lowest temperatures were 33.8 °C and −14.5 °C, respectively. The annual average ambient temperature in Ulsan was 13.2 °C, while the highest and lowest temperature were 33.9 °C and −9.6 °C, respectively. The annual average temperature difference between Seoul and Ulsan was 1.5 °C. The maximum temperatures during the summer in both cities were similar. However, the monthly average temperature in Ulsan was confirmed to be higher during the winter season. On the other hand, the annual average ambient temperatures in Ottawa and Toronto were 5.9 °C and 7.3 °C, respectively; highest temperature was similar to that of Seoul. Lowest ambient temperatures in Ottawa and Toronto were −28.6 °C and −22.1 °C, respectively; in Ottawa the temperature was 6.5 °C lower than that in Toronto, and 19 °C lower than that in Ulsan.
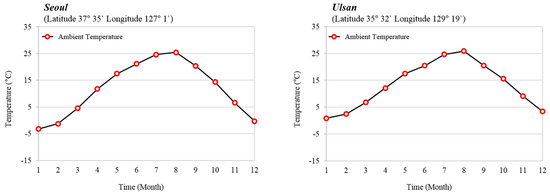
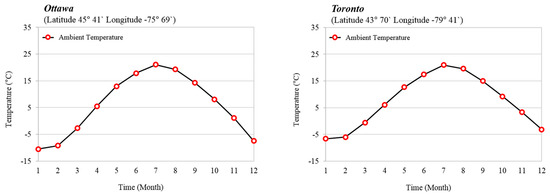
Figure 4.
Monthly average ambient temperature.
3.2.2. The Building Load Model
Figure 5 shows the building load model and the floor plan. The building load analysis model was based on the low-energy house standard design document announced by the Korean Ministry of Land, Infrastructure and Transport [18].
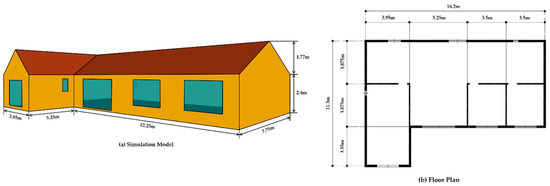
Figure 5.
Building load analysis model and floor plan.
The indoor point temperatures of the load model were set to 20 °C and 26 °C for heating and cooling, respectively, based on ISO 13790 [19]. The thermal transmission standards for the walls, roof, floor, and windows were based on the building codes of South Korea and Canada; the thermal transmission standard is shown in Table 1 [20,21].

Table 1.
Overall thermal transmittance of building. (Unit: W/m2·K).
The thermal transmission standard by section is announced differently in each region and, transmission standard has improved in the colder region. On the other hand, the condition of internal heat gain such as people sensible heat gain, people latent heat gain, lighting and equipment heat gain, the infiltration flow and the ventilation air flow were based on the American Society of Heating, Refrigerating and Air-Conditioning Engineers (ASHRAE) standard 62.2 [22] and International Organization for Standardization (ISO) 7730 [23], and each conditions were shown in Table 2.
Table 2.
Building load analysis conditions.
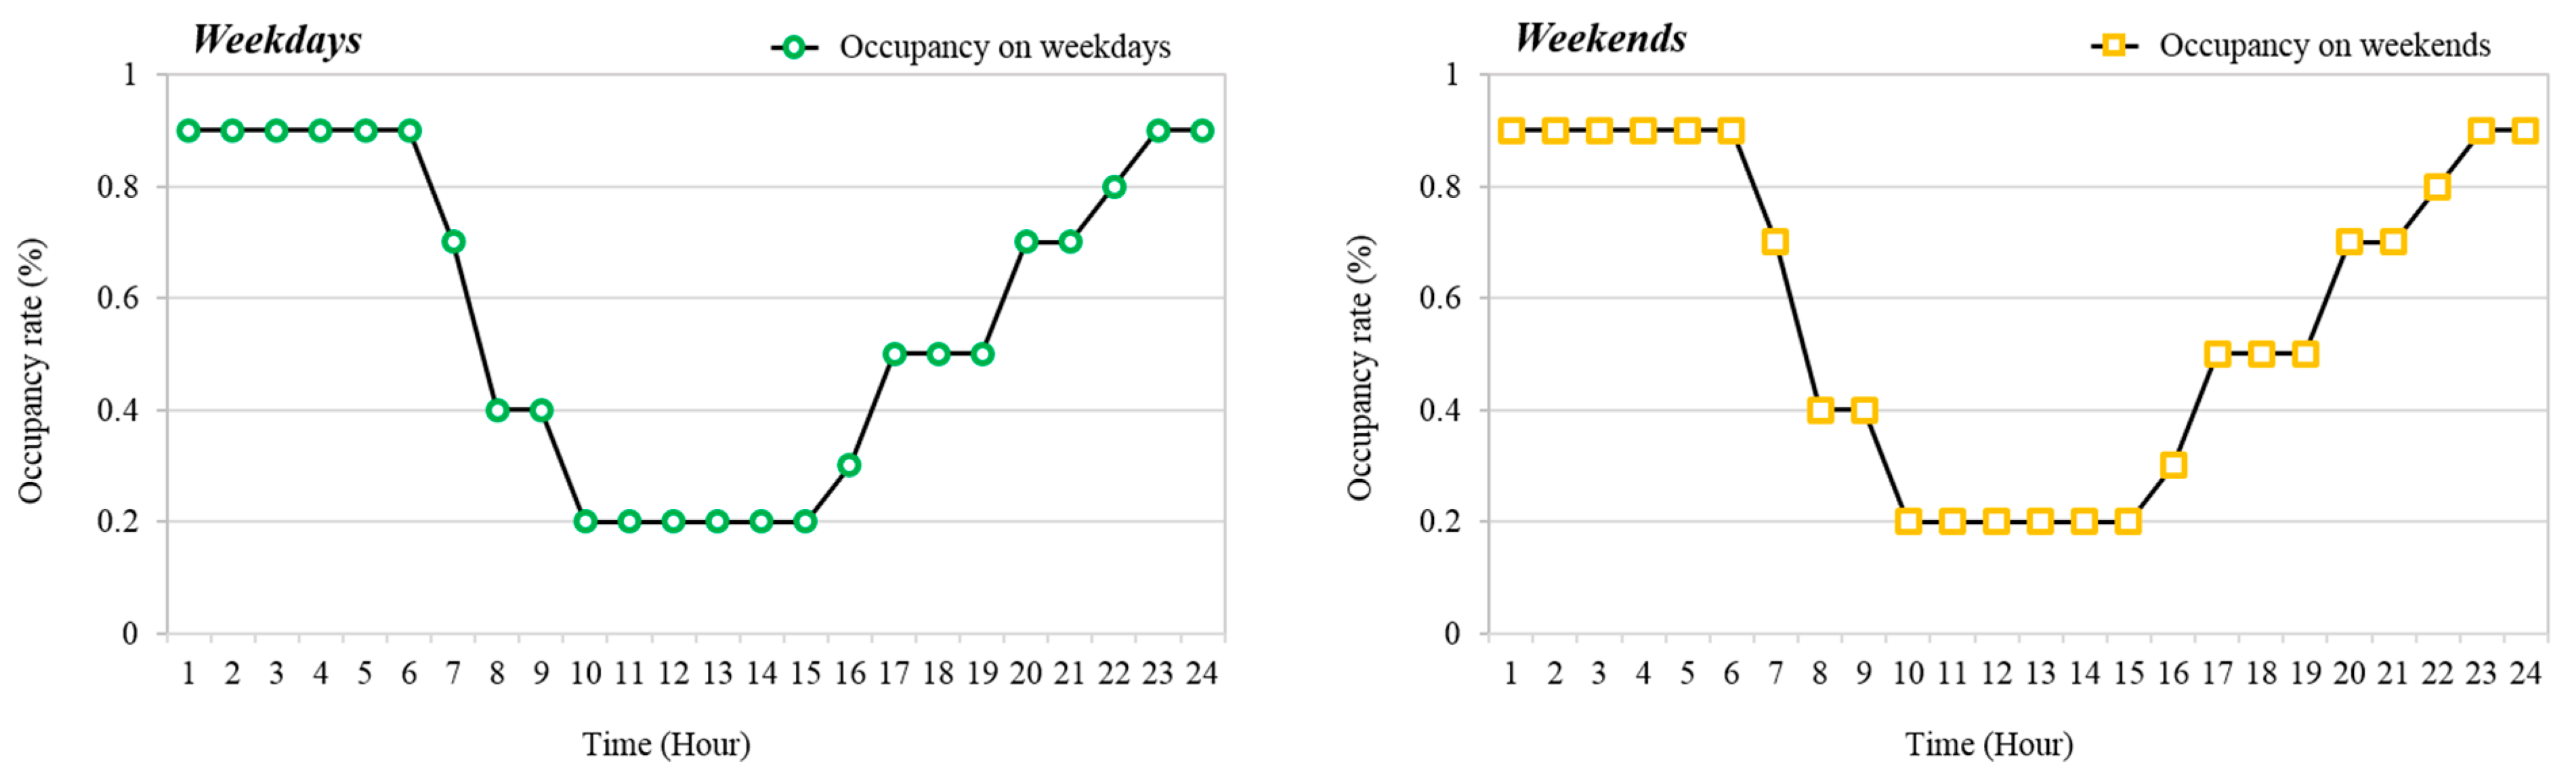
The number of occupants was entered as 4, and the sensible heat gain and the latent heat gain were set to 75 W/person respectively assuming that the occupants were sitting, doing light work or typing. Lighting heat gain and equipment heat gain were set to be 5.0 W/m2 respectively. Also, the infiltration flow and the ventilation flow were input as 0.4 1/h and 0.5 1/h respectively.
Figure 6 shows the occupancy of the residential house. Occupancy rate by the occupants was divided into that of weekdays and weekends based on the ASHRAE standard [24].
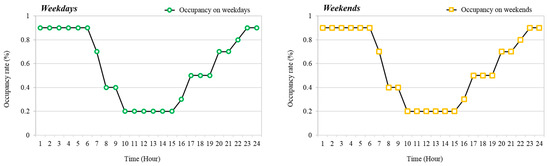
Figure 6.
Occupancy on weekdays and weekends.
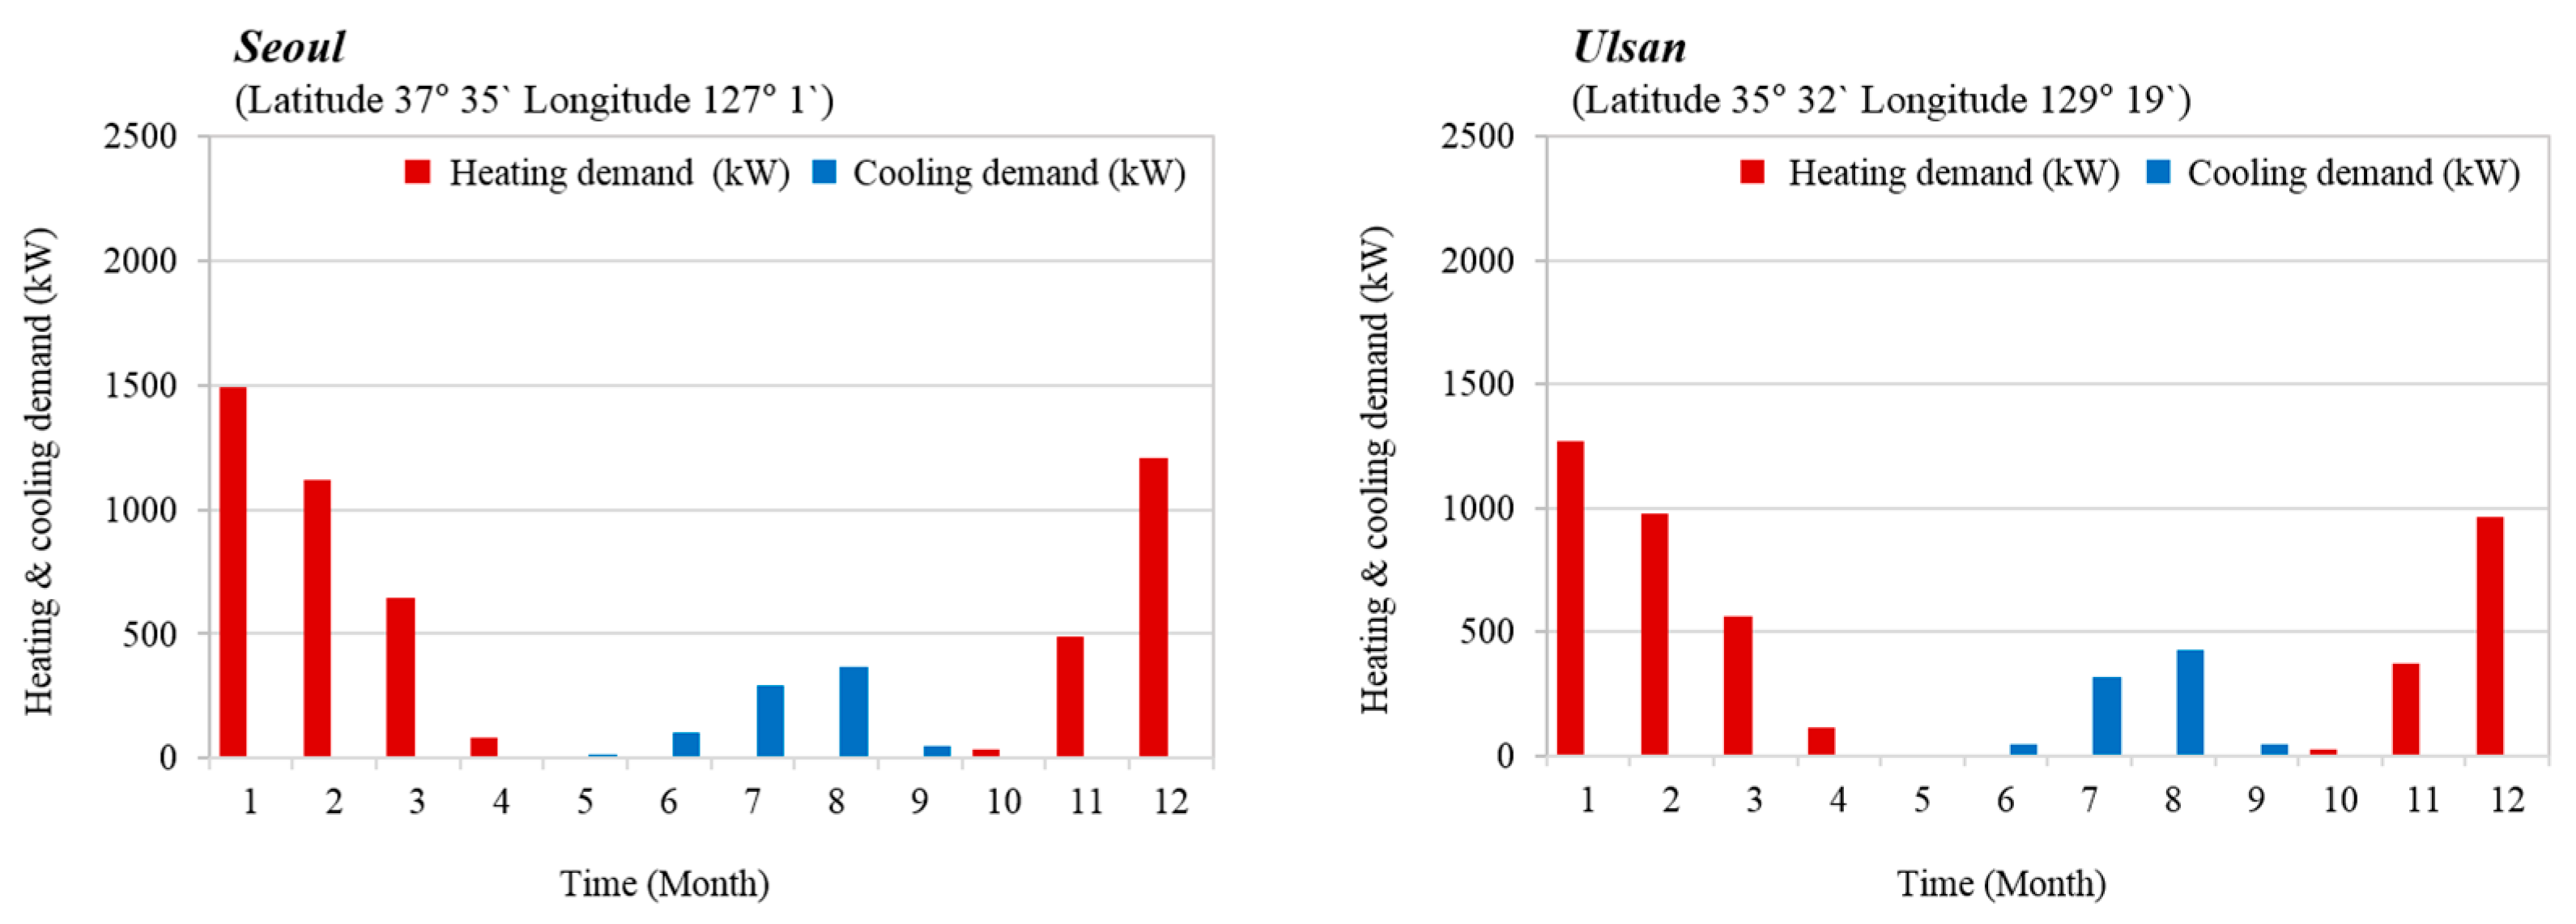
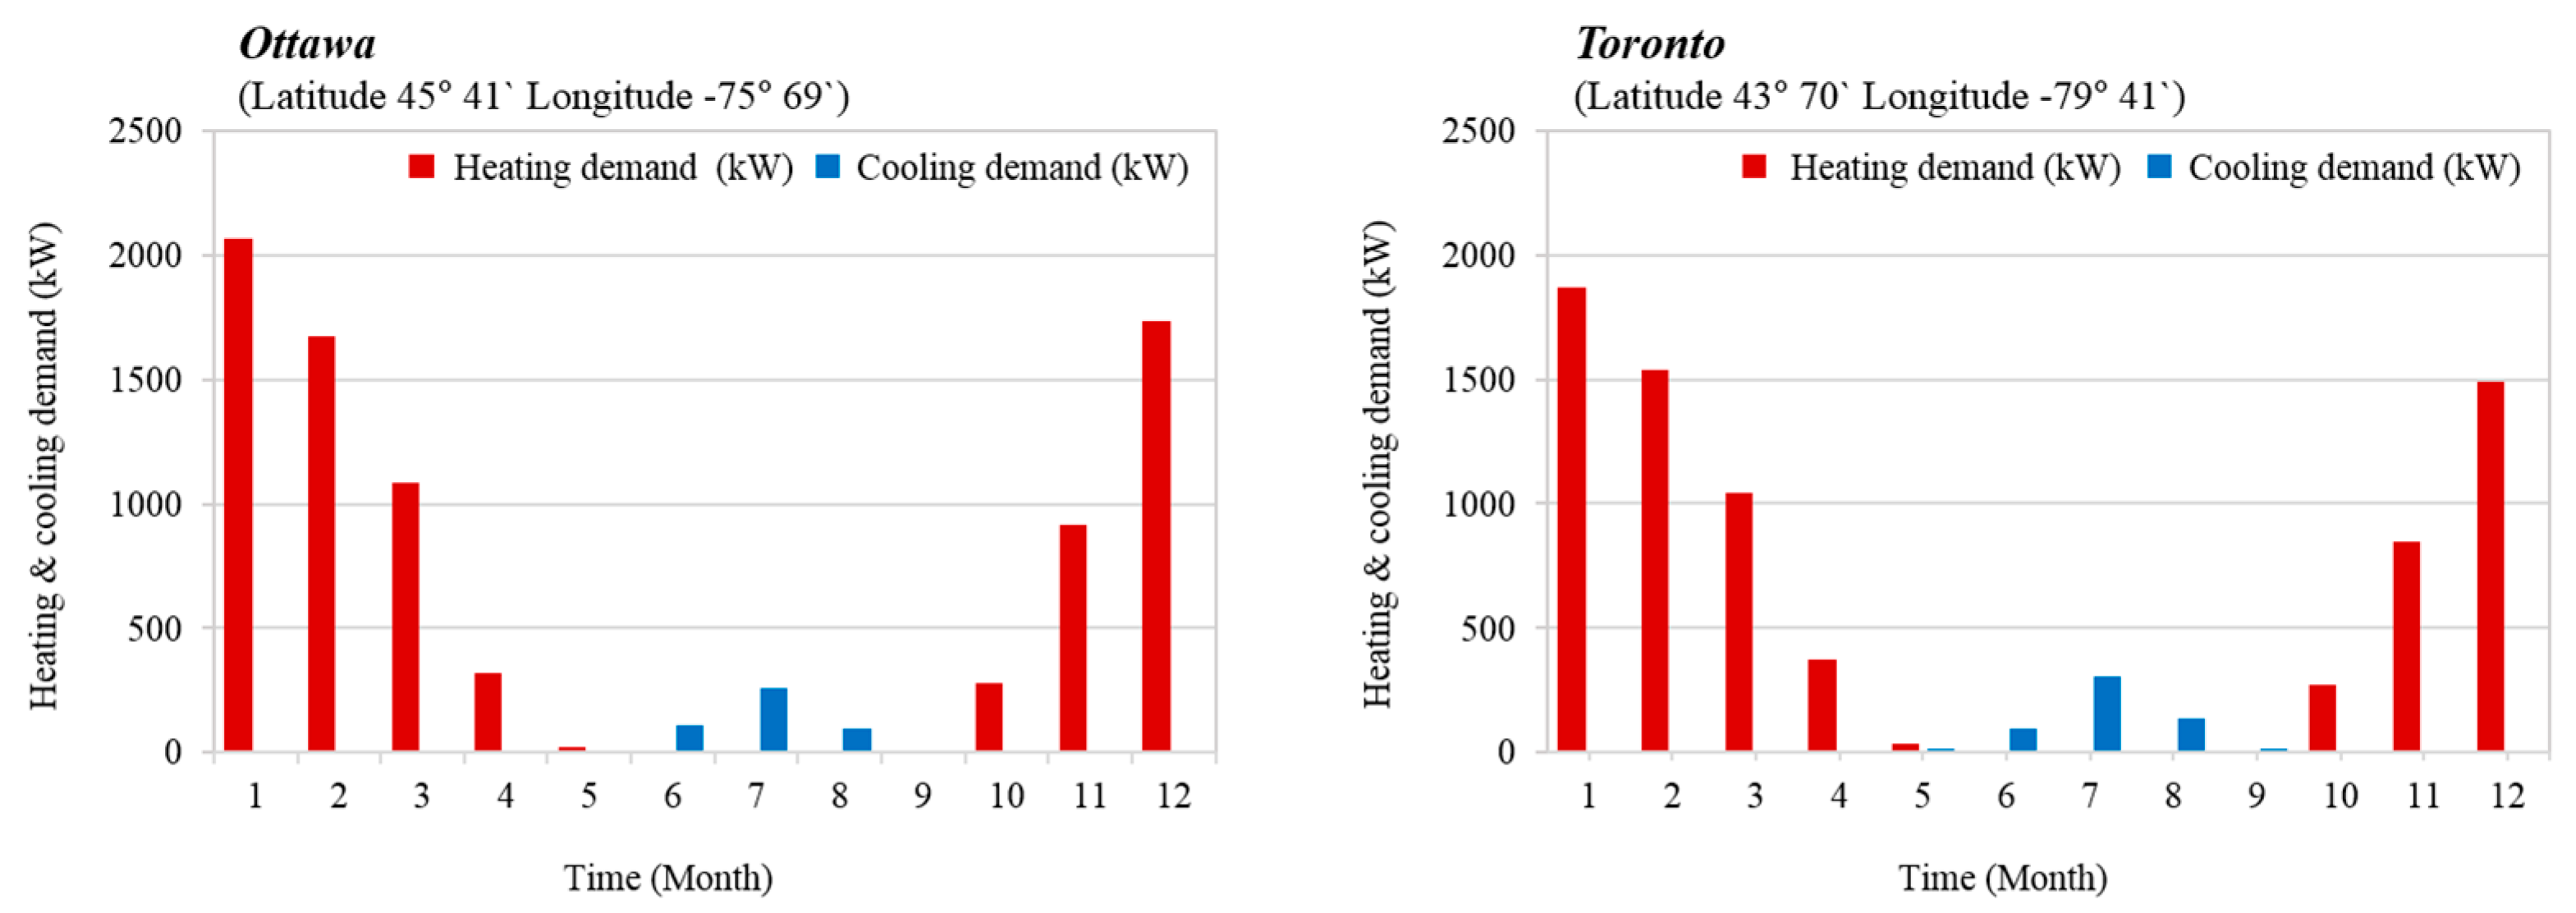
3.2.3. Result of Energy Need for Heating and Cooling
Figure 7 shows energy need for heating and cooling in each region. The cooling and heating peak loads of Seoul were calculated to be 8.61 kW and 3.14 kW, respectively. The heat pump design capacity of Seoul was determined to be 10.34 kW (3.0usRT) considering the safety factor and the heating peak load. The cooling and heating peak loads of Ulsan were calculated to be 7.55 kW and 3.45 kW respectively. The heat pump design capacity of Ulsan was determined to be 9.06 kW (2.5usRT).
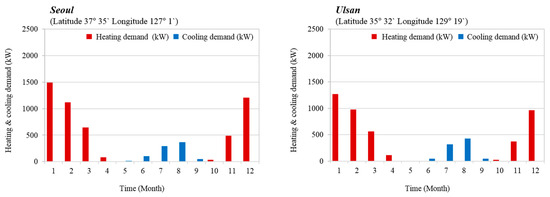
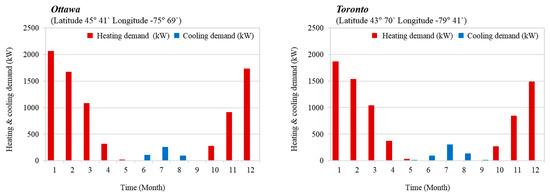
Figure 7.
Energy need for heating and cooling in each region.
In addition, the heating peak loads of Toronto and Ottawa were calculated to be 10.71 kW and 12.61 kW, respectively. The heat pump design capacities were determined to be 12.85 kW (4.0usRT) and 15.13 kW (4.5usRT) respectively considering the safety factor. The cooling and heating peak loads and the heat pump design capacity of each region are shown in Table 3.
Table 3.
Heating/cooling peak load and heat pump capacity.
3.3. Modeling of the Tri-Generation System
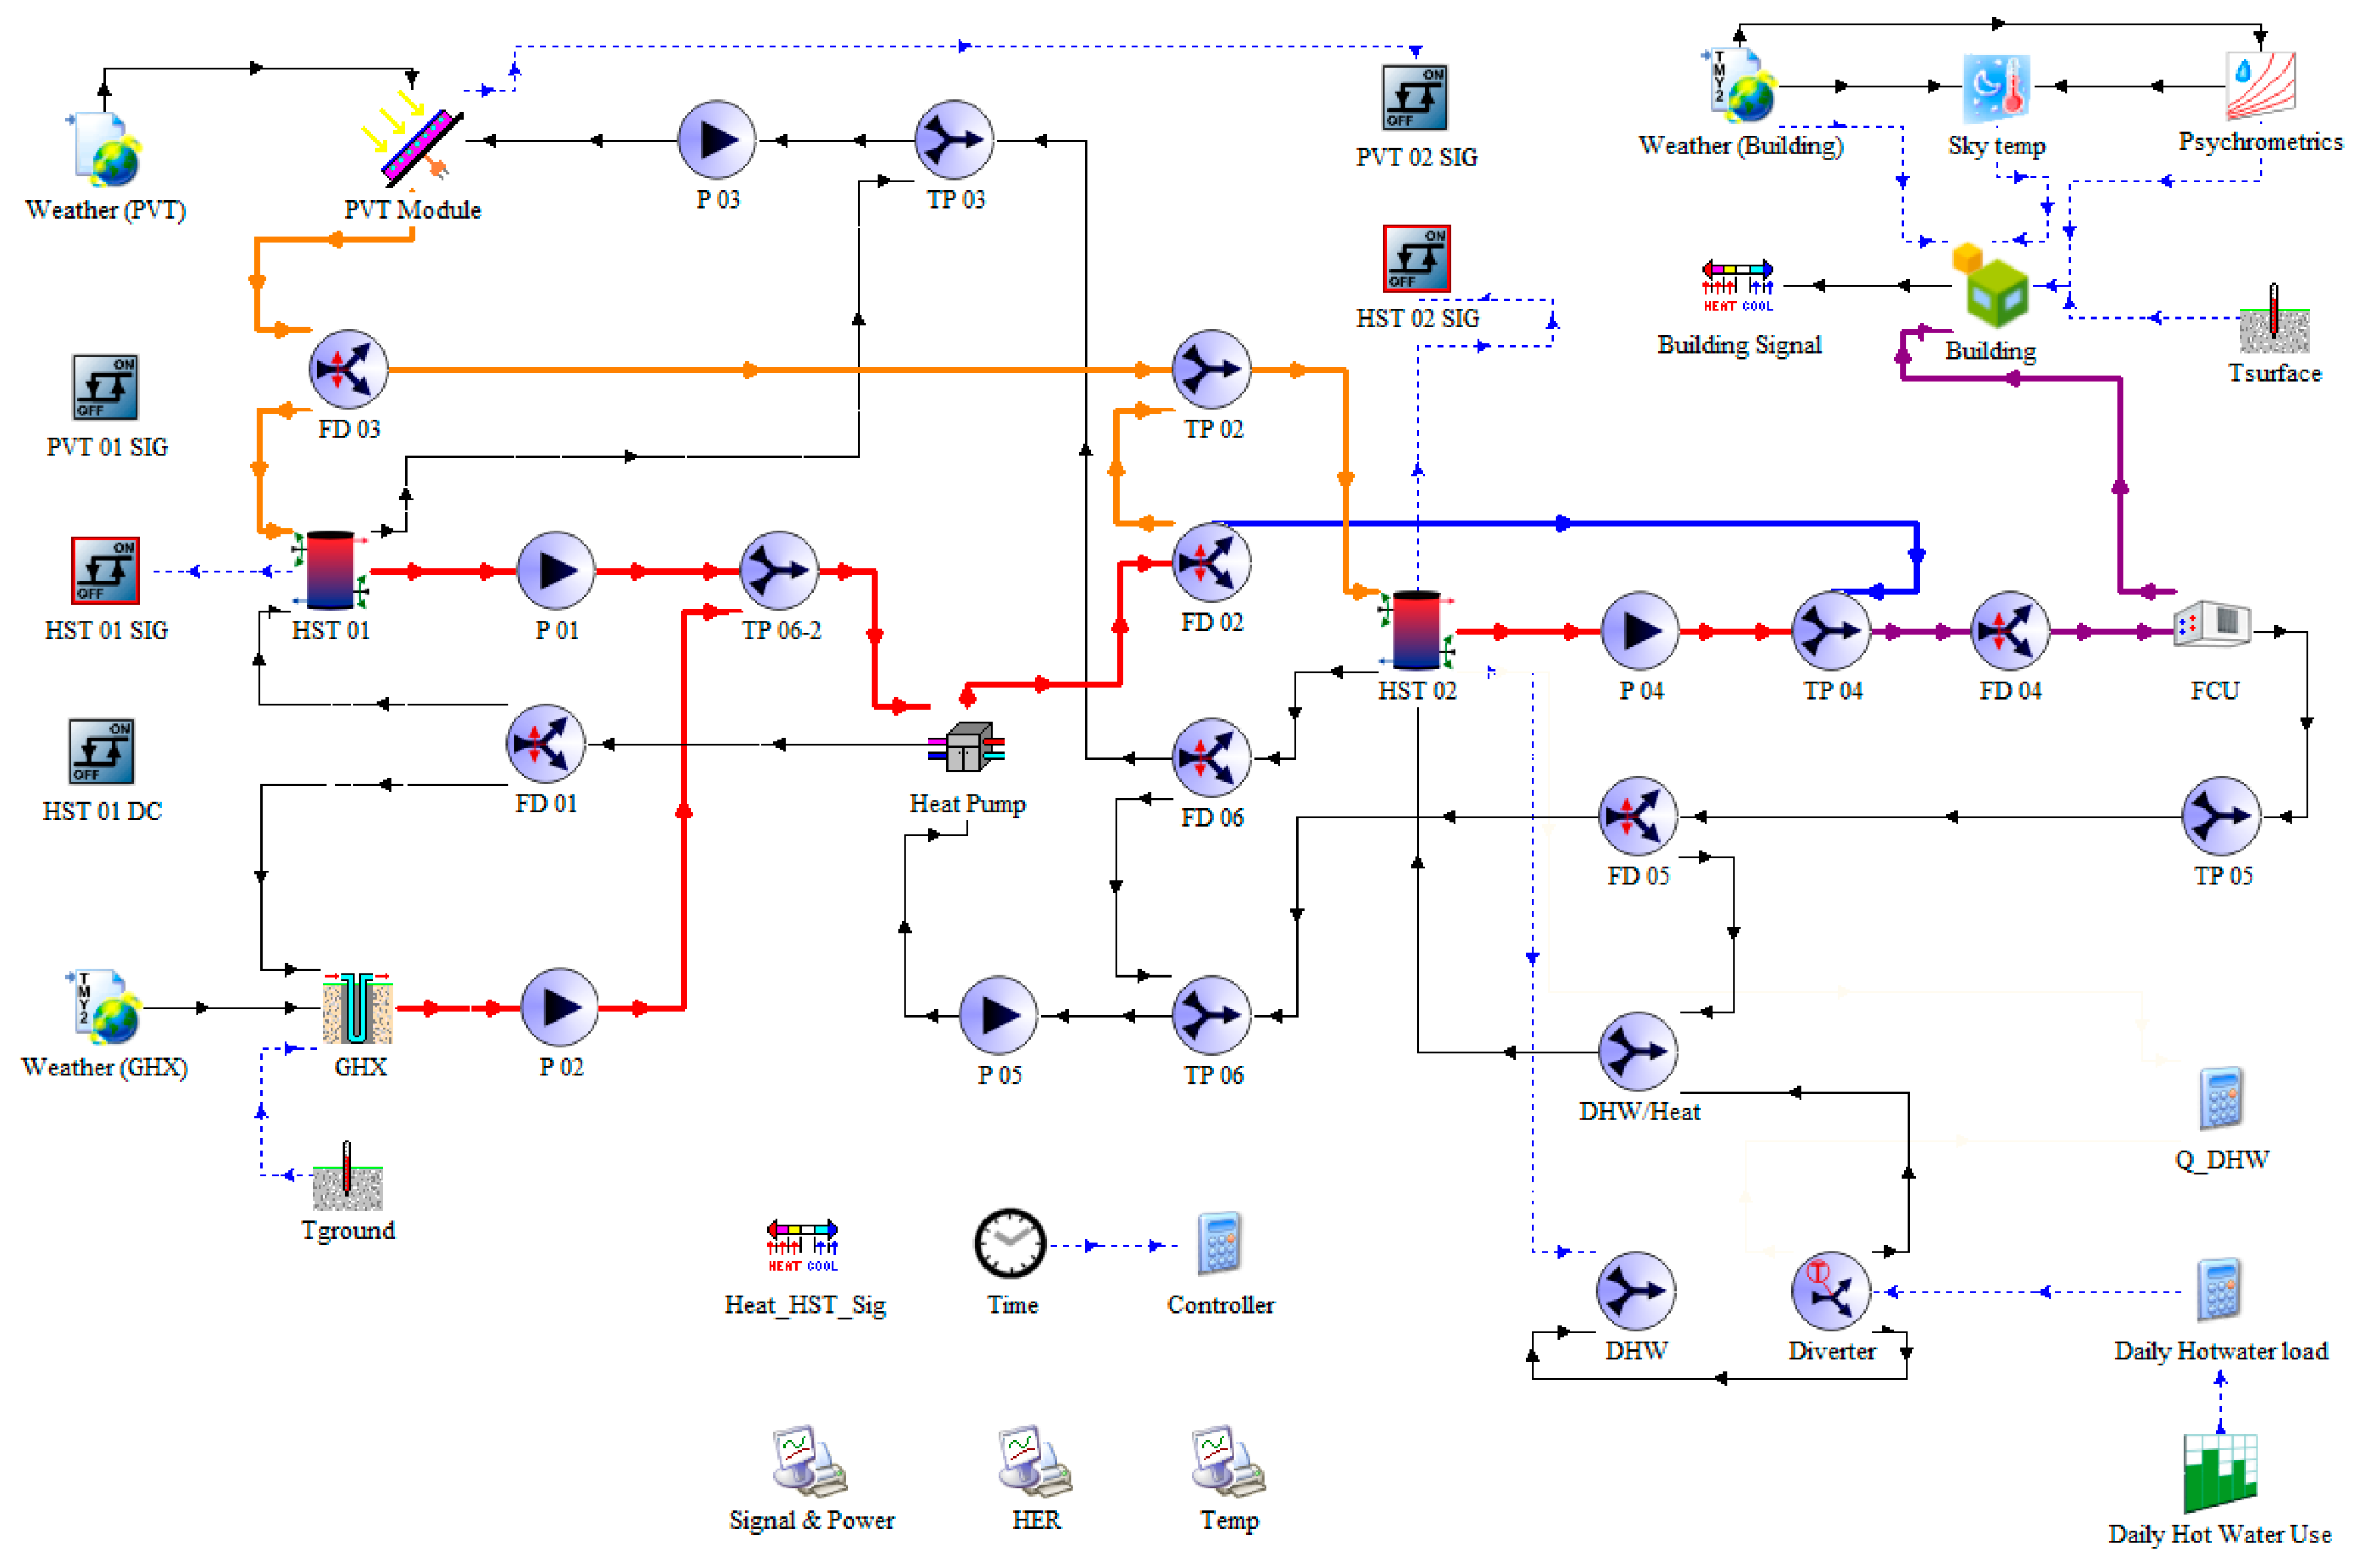
Figure 8 shows the performance prediction model of the tri-generation system using energy simulation. The performance prediction model is comprised of PVT collector considering the efficiency of the PV cells to the cell temperature and the incident solar radiation (type 560). The following other models are as follows: a vertical U-tube ground heat exchanger that interacts thermally with the ground (type 557a), water to water heat pump based on user-supplied data files containing the entering load and source temperature, normalized source and load flow rates (type 927), heat storage tank with variable inlets and uniform losses (type 4c), and a 4-pipe fan coil unit (type 987). A multi-zone building that utilizes information of thermal behavior based on user-supplied information by TRNBuild (type 56) is considered. The cooling/heating and heat storage control logic of the system is entered into the controller, each macro value entered is delivered to the components such as pump (type 3d), tee piece (type 11h), and flow diverter that splits the liquid stream into two (type 11f) based on the user-specified valve settings, on/off differential controller (type 2b), and a thermostat (type 108) that is controlled in real time.
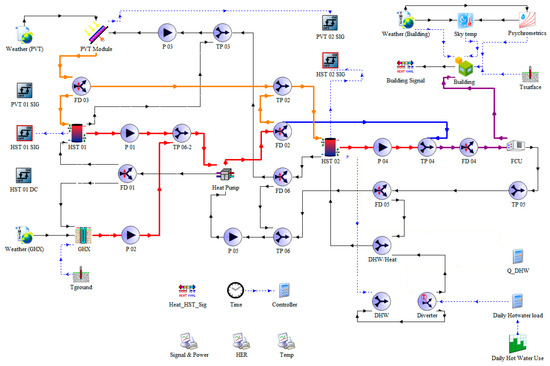
Figure 8.
Performance prediction model of the tri-generation system.
The condition for each component used for the performance prediction model is shown in Table 4. A ground heat exchanger of vertical closed-loop type U-tube (borehole diameter: 0.15 m, depth: 150 m) was installed based on the capacity of the heat pump. Ten panels of unglazed-water type PVT collectors (1 panel size: 0.994 m × 1.937 m) were installed. The number of solar absorbers attached to the rear of the PV panel was set to be 21 per PVT collector while the power efficiency of the PV was 16.1% and the collector slope was 45°.
Table 4.
Component condition.
The capacities of the heat storage tanks (HST) 1 and 2 were set to be 1.5 m3 and 0.5 m3 respectively and the heat loss coefficient was 0.694 W/m2·K. The set point temperatures of the heat storage tanks were classified based on the use method, and the set temperature of HST 1 located at the side of the heat source which was 15 °C and that of HST 2 connected to the load side was 55 °C. The rated total cooling/heating capacity of the fan coil unit was input based on the heat pump capacity, and those of Seoul, Ulsan, Ottawa, and Toronto were set to 10 kW, 9 kW, 15 kW, and 13 kW, respectively.
Meanwhile, regarding the cooling and heating operation period of the system, the period from Jun. to Sep. was set to be a cooling operation period. The periods from January to April and from October to December were set to be heating operation periods. Regarding the heat storage operation period, the periods from Jan. to May and from Oct. to Dec. were set to be periods of heat storage operation using the heat pump, and the heat storage operation using the PVT module continues all year round.
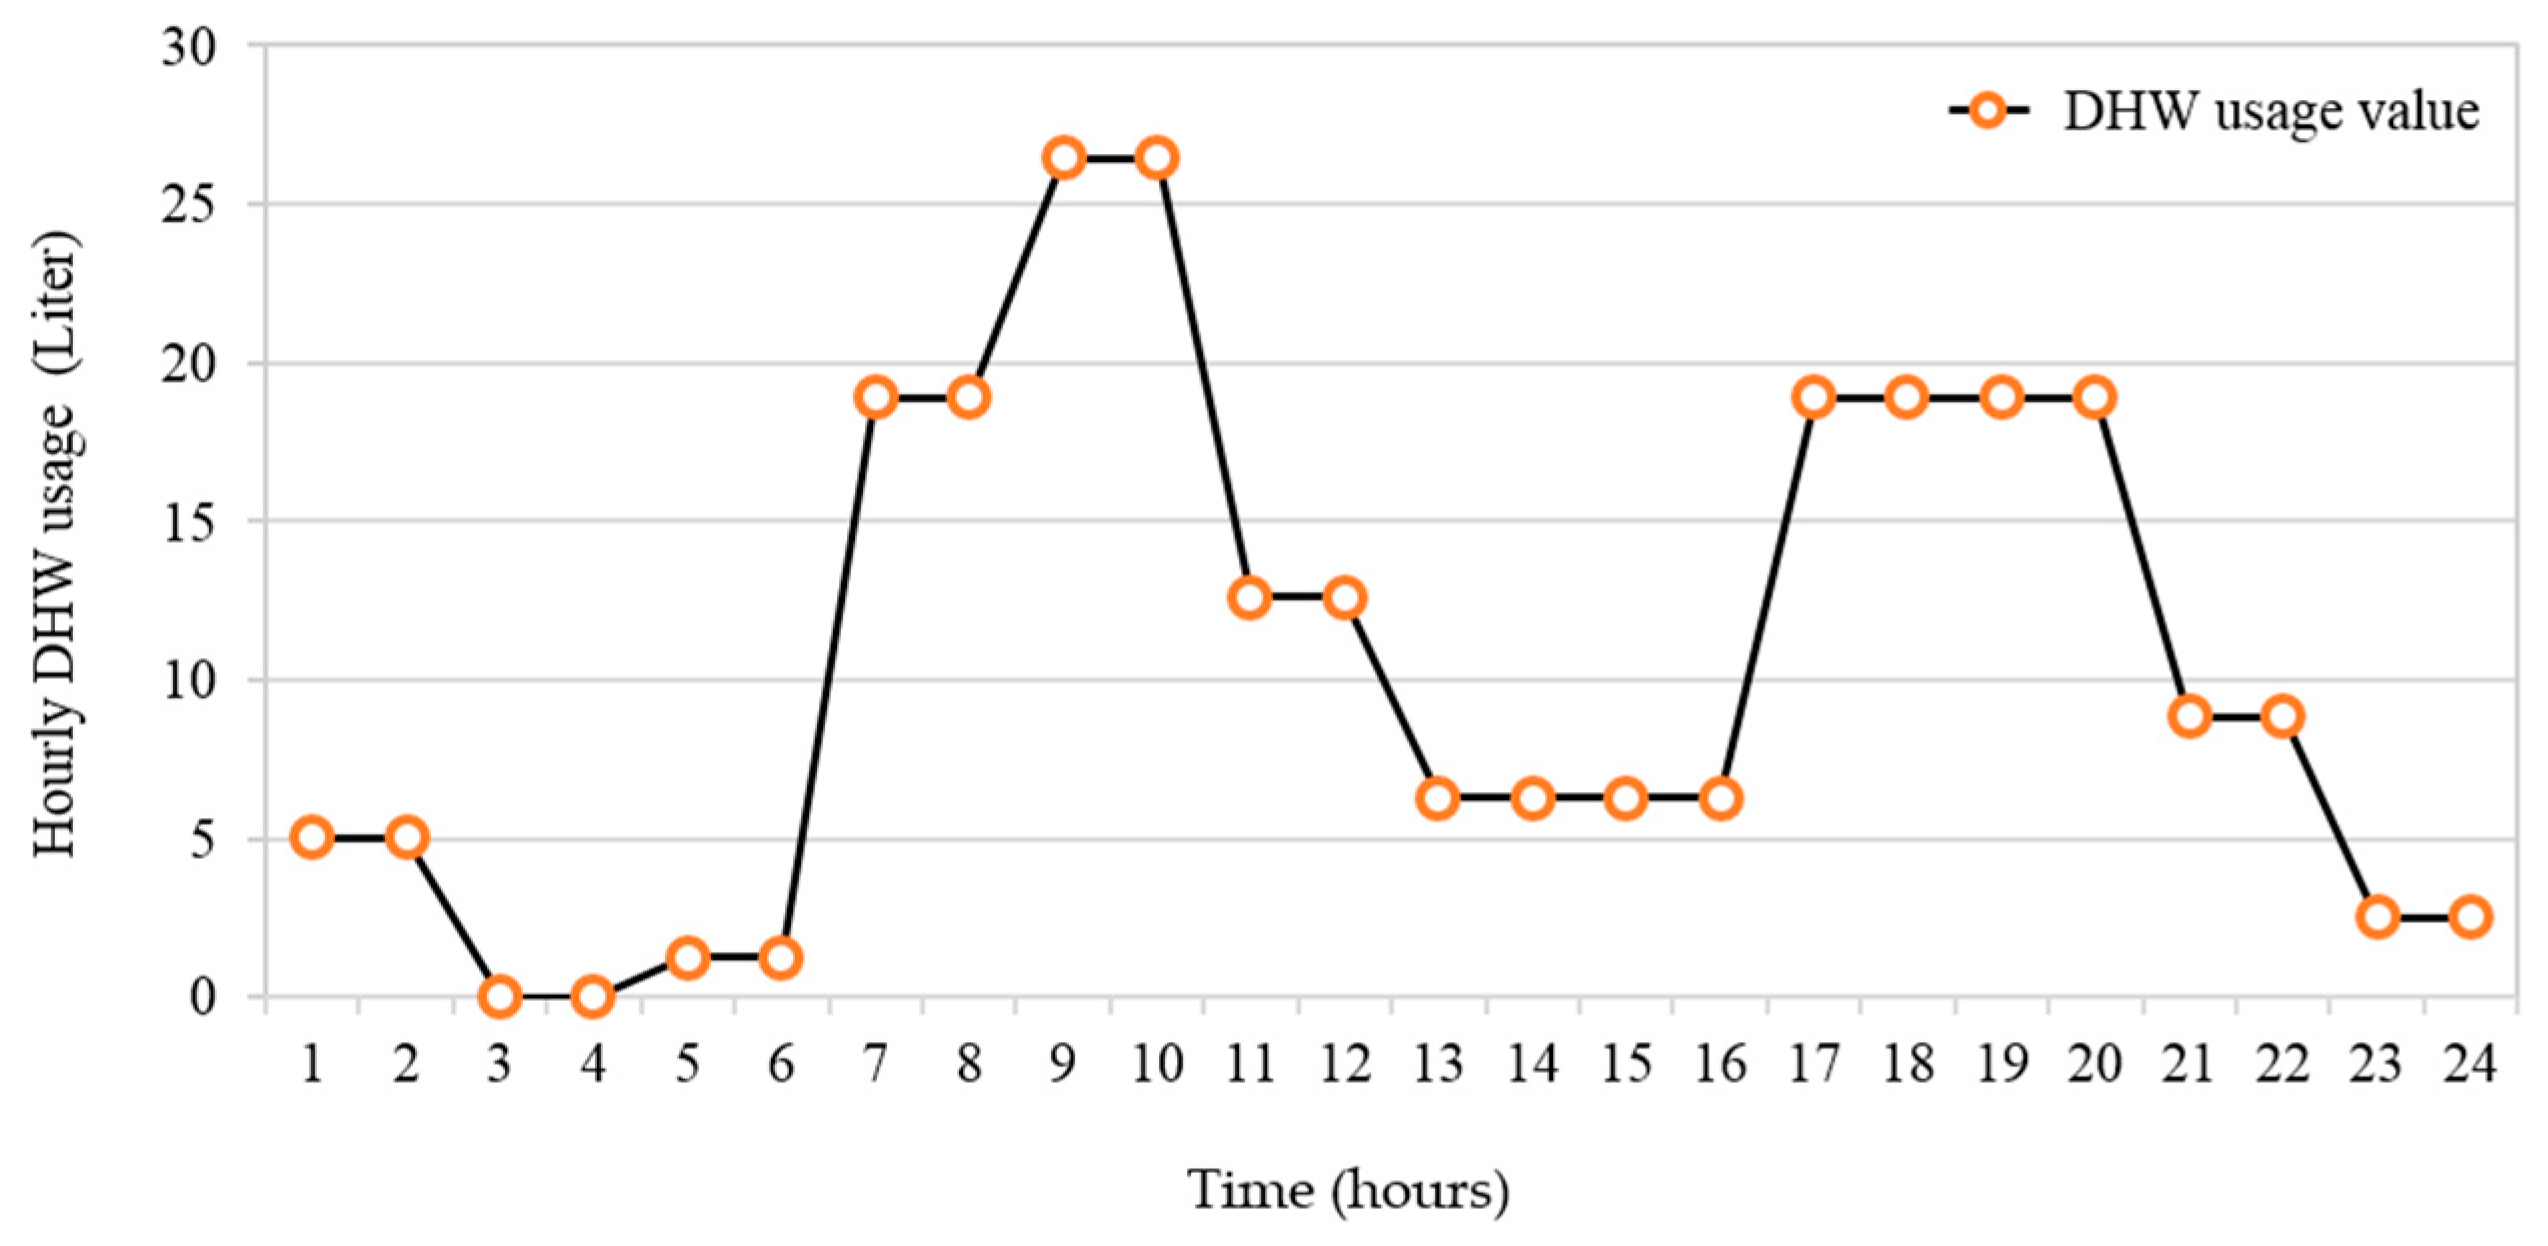
The average DHW usage value (252 L/day) was recommended by ASHRAE [25] for typical families, and the residential house DHW usage pattern was based on the previous study [25,26]. The hourly DHW usage pattern was described in Figure 9.
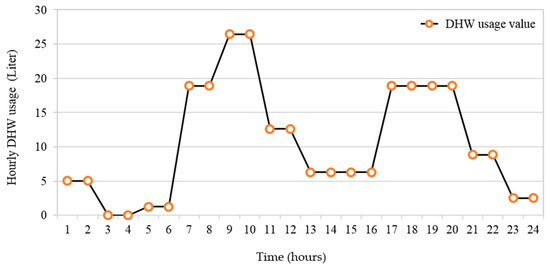
Figure 9.
Hourly domestic hot water (DHW) usage pattern.
3.3.1. Ground Heat Exchanger Model
The vertical U-tube ground heat exchanger model is based on duct ground heat storage (DST) model developed by Hellstrom [27]. The DST is defined as a system where heat is stored directly in the ground. The ground heat exchanger are assumed to be uniformly placed in the ground. The heat flow from the ground heat exchanger to the ground is determined by the temperature in the ground surrounding the ground heat exchanger, fluid temperature, and heat transfer. In the DST model, the fluid temperature at the outlet can be expressed as:
Here, is the fluid temperature at the inlet of ground heat exchanger (°C). is the temperature of the surrounding ground (°C). When the fluid flow rate approaches zero, the fluid temperature at the outlet approaches the temperature of the surrounding ground (). On the other hand, the outlet temperature equals the inlet temperature as the fluid flow rate moves to infinity. The damping factor () can be determined as:
Here, is the exponential function, is heat capacity of the fluid (kJ/kg·K), is heat transfer coefficient (W/m2·K), is the storage volume (m3), is the total fluid flow rate (kg/hr), and is the pipe length of the storage volume (m).
3.3.2. Photovoltaic-Thermal Collector Model
The PVT collector model is based on the algorithms proposed in Chapter 6 (Flat-Plate Collectors) of the “Solar Engineering of Thermal Processes” textbook by Duffie and Beckman [28,29]. This model has the dual purpose of generating power from the embedded photovoltaic (PV) modules and transferring heat to a fluid stream passing through tubes bonded to a solar absorber located beneath the PV modules. The energy useful gain () generated by the solar absorber can be calculated as:
Here, is the fluid flow rate through the solar absorber (kg/hr). is the specific heat of the fluid through the solar absorber (kJ/kg·K). and are the outlet and inlet temperatures of the solar absorber, respectively (°C). On the other hand, the power generation of the PV module can be calculated by the transmittance-absorbance of the PV module (), the incidence angle modifier (), a total solar radiation (beam and diffuse radiation) incident upon the collector surface (), the top area of the PV module () and the power efficiency of the PV module (), as in the following Equation (4).
The power efficiency of the PV module can be determined considering a function of the cell temperature and the incident solar radiation, as in the following Equation (5).
Here, is the multiplier for the power efficiency as a function of the module temperature. is the multiplier for the power efficiency as a function of the incident radiation.
3.3.3. Heat Pump Model
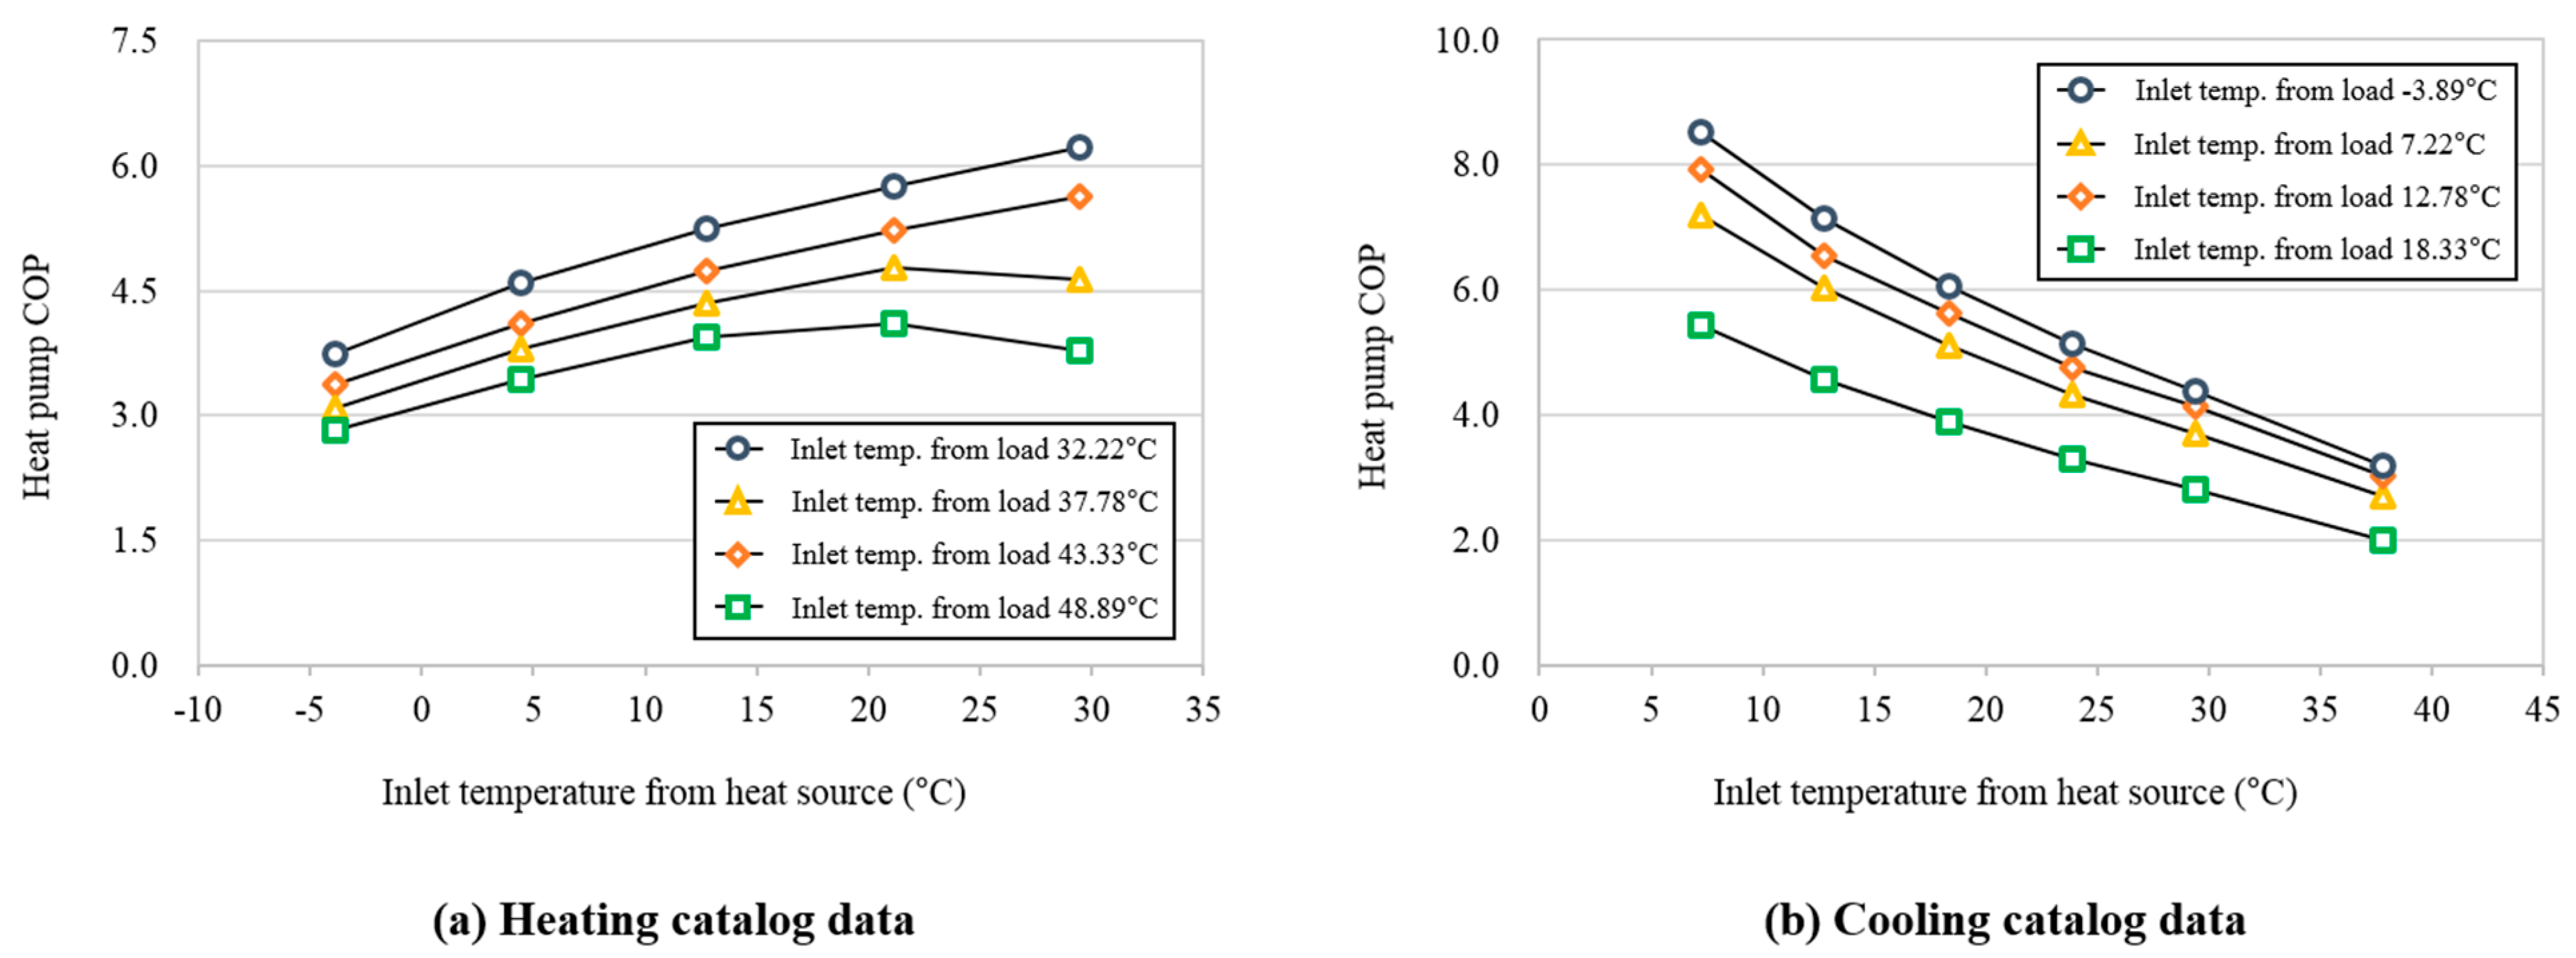
The heat pump conditions a one fluid flow by rejecting energy to cooling mode or absorbing energy from heating mode. The heat pump model is based on user-supplied data files containing catalog data for the capacity and power draw, based on the inlet load and source temperatures [30]. Both data files provide capacity and power consumption of the heat pump as functions of entering source fluid temperature and entering load fluid temperature. Figure 10 shows the catalog data of the heat pump.
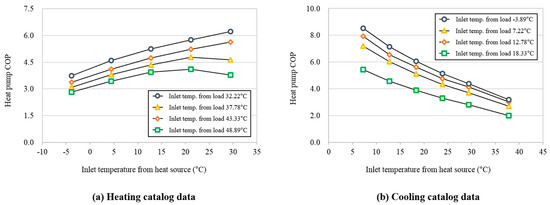
Figure 10.
Catalog data of the heat pump.
The amount of energy absorbed from the source fluid flow in heating is given by Equation (6)
Here, is energy absorbed in heating mode c. is heat pump heating capacity at current conditions. is heat pump power consumption in heating mode (kJ/hr).
In the heating mode, the outlet temperatures of the heat source side and load side can then be expressed using Equations (7) and (8).
Here, is outlet temperature of fluid on heat source side (°C). is inlet temperature of fluid on the heat source side (°C). is flow rate of fluid on the heat source side (°C). is specific heat of fluid on the heat source side (kJ/kg·K). is outlet temperature of fluid on the load side. is inlet temperature of fluid on the load side (°C). is flow rate of fluid on the load side. is specific heat of fluid on the load side (kg/hr).
On the other hand, the amount of energy rejected by the source fluid flow in cooling is given by Equation (9)
Here, is energy rejected in cooling mode (kJ/hr). is heat pump cooling capacity at current conditions. is heat pump power consumption in cooling mode (kJ/hr).
In the cooling mode, the outlet temperatures of the heat source side and load side can then be expressed using Equations (10) and (11).
3.3.4. Heat Storage Tank Model
The thermal performance of a heat storage tank, subject to thermal stratification, can be modeled by assuming that the tank consists of equal volume segments [31]. The degree of stratification is determined by the number of nodes () in the heat storage tank entered by the user. If the number of nodes is equal to one, the heat storage tank is modeled as a fully-mixed tank and no stratification effects are possible. The heat storage tank model used in this study set the number of nodes to three, and it considered temperature dead band, heat loss coefficient and environment temperature. The energy balance of the -th segment considering the outlet and inlet fluid temperatures of the heat storage tank and the temperature of surroundings can be expressed as follows:
Here, is mass of fluid in the -th section (kg/hr). is specific heat of the tank fluid (kJ/kg·K). is temperature of the -th tank segment (°C). is time. and are a control function. is fluid mass flow rate to tank from the heat source (kg/hr). is temperature of the fluid replacing that extracted to supply the load (°C). is heat loss coefficient (kJ/hr·m2·K). is surface area of the -th tank segment (m2). is temperature of the environment surrounding the tank (°C).
3.4. Control Strategy
As the tri-generation system uses diverse heat sources, an efficient operation method is required to be established taking into account the building load and use characteristics of each unit. The system is operated based on the cooling and heating loads of the building and the preset indoor temperature. Operation of each system unit (PVT collector and heat pump) is determined by the inlet/outlet temperatures and the preset temperature of the heat storage tanks.
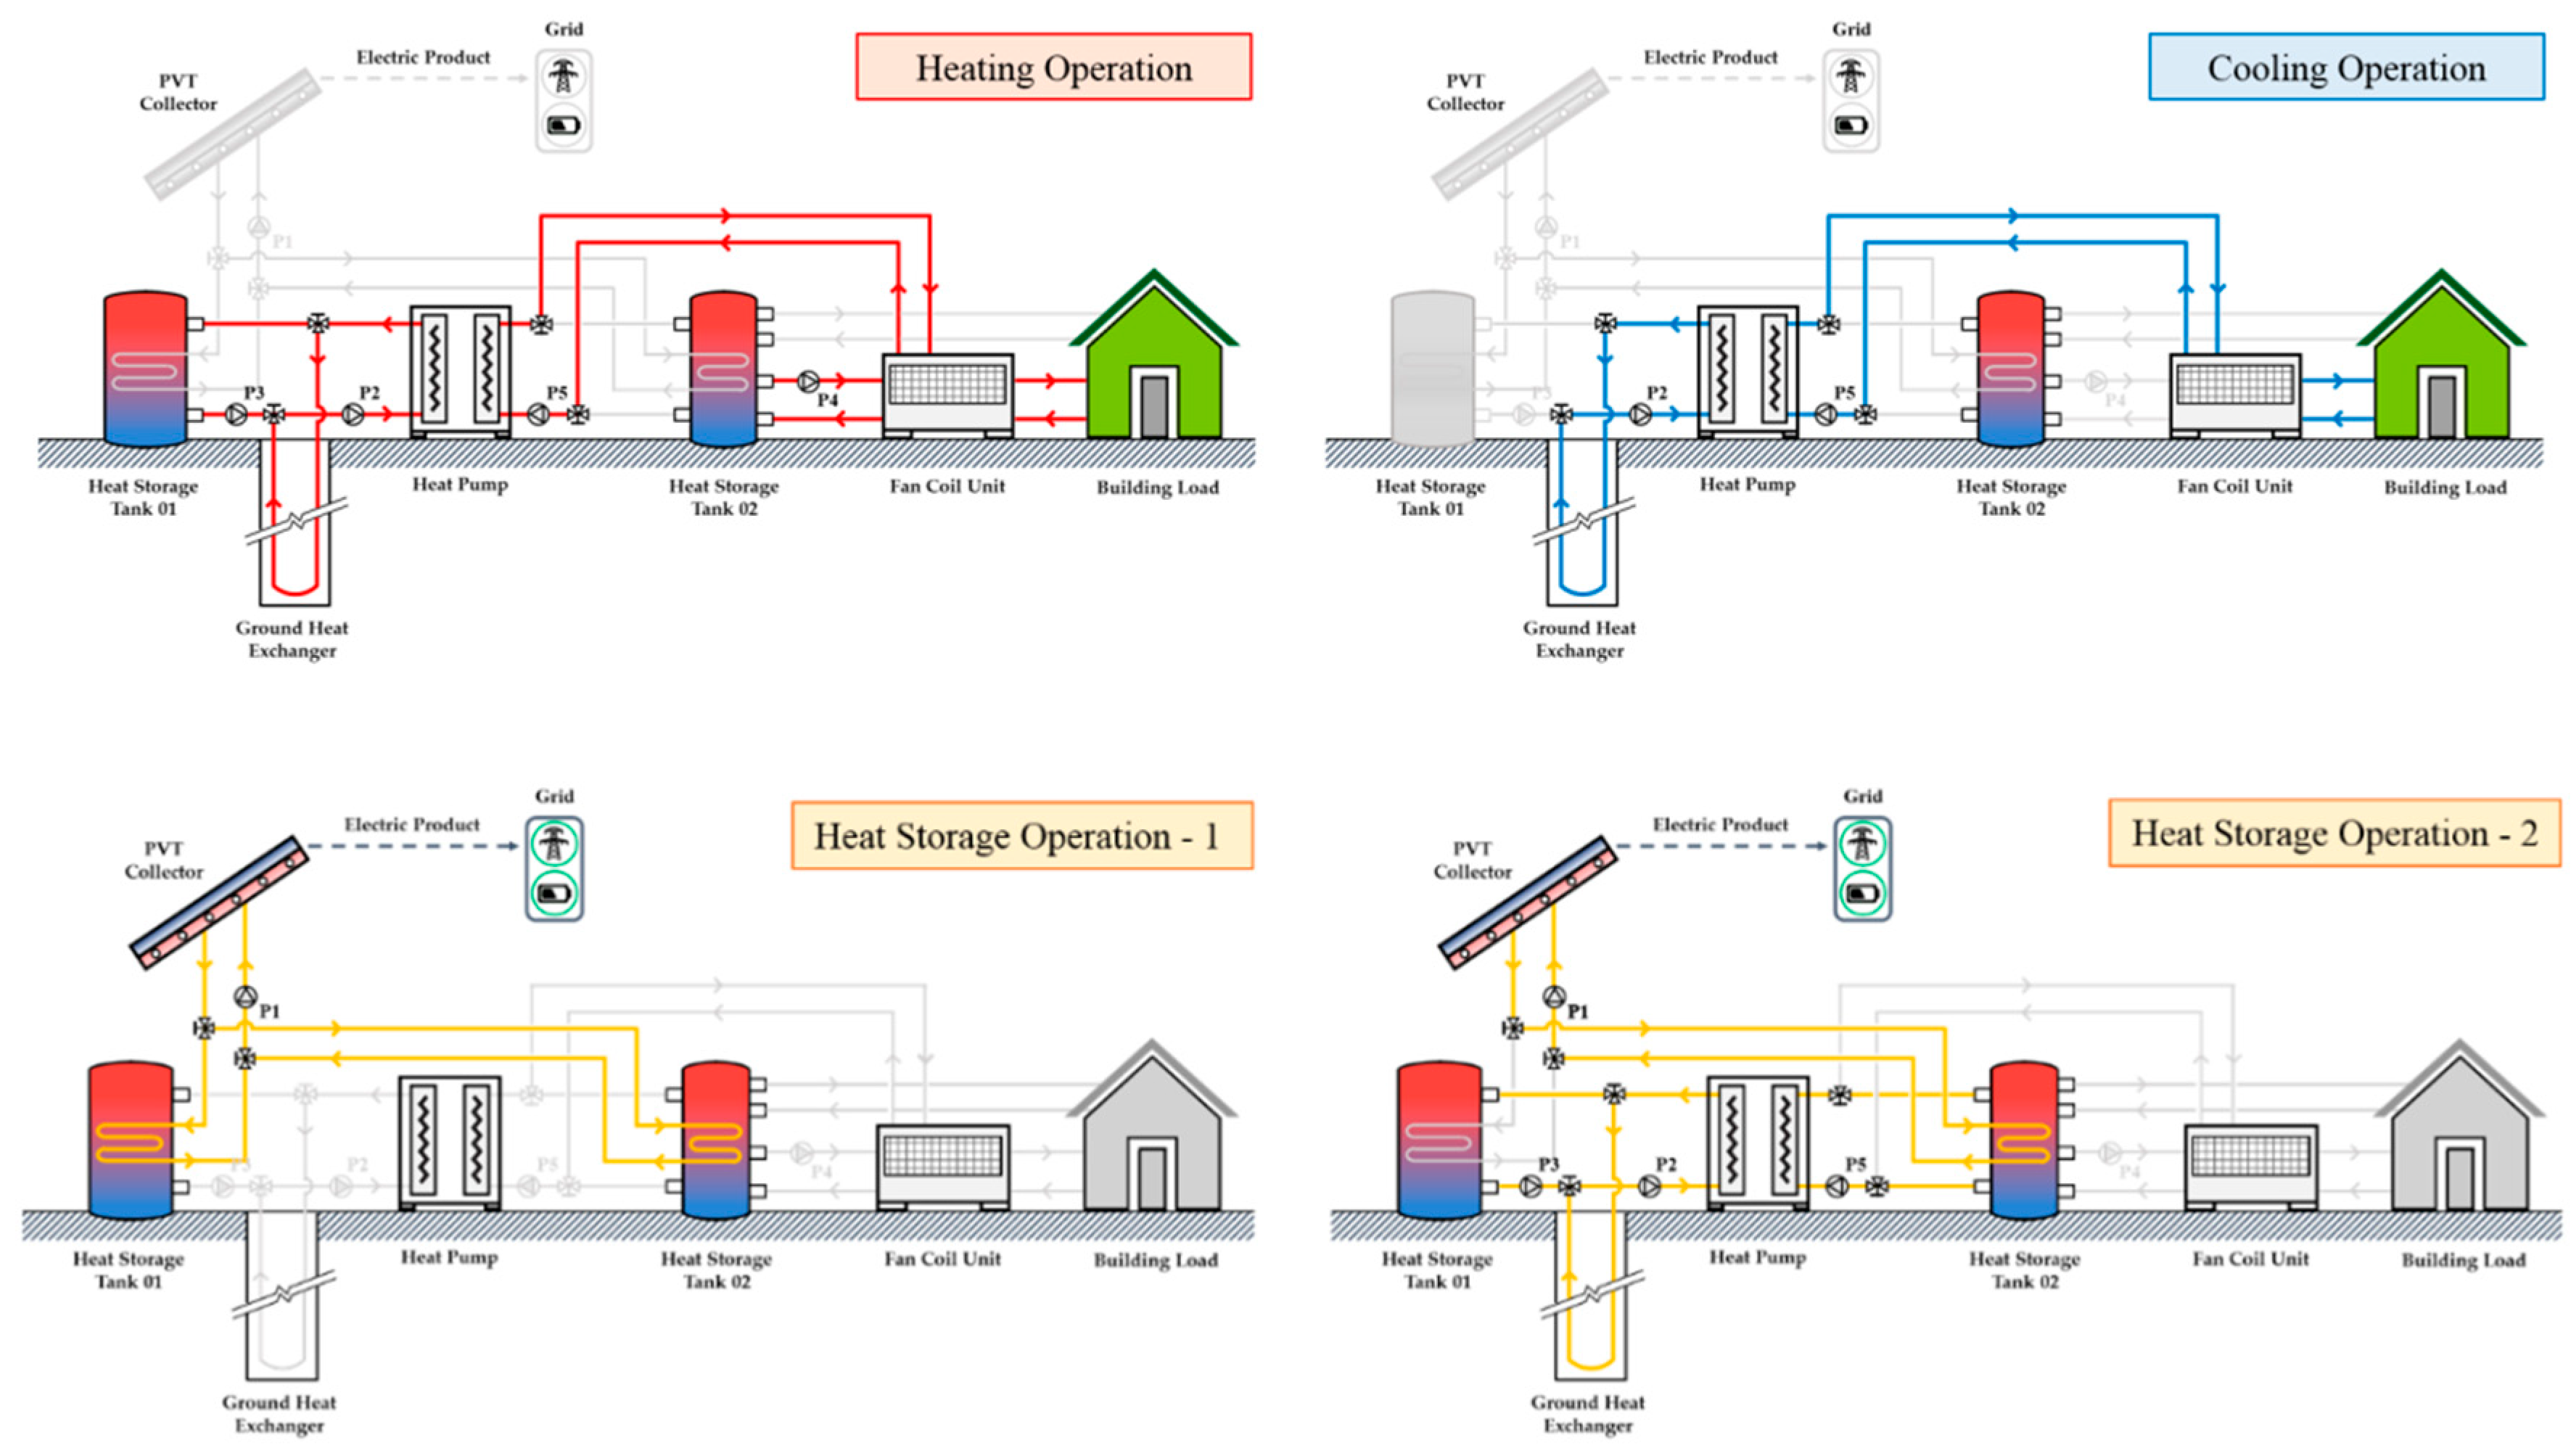
Figure 11 shows the heating/cooling and heat storage operation methods of the tri-generation system. The operation methods comprise heating, cooling, and heat storage operations. Heating operation is either carried out using the heat pump and HST 2, or only the heat pump in case HST 2 is non-functional. Heating operation through the heat pump uses HST 1 and the GHX as the heat sources; operation using the heat pump utilizes higher outlet temperature between the HST1 and the GHX. On the other hand, the cooling operation is carried out using only the GSHP, and only the GHX is used as the heat source.
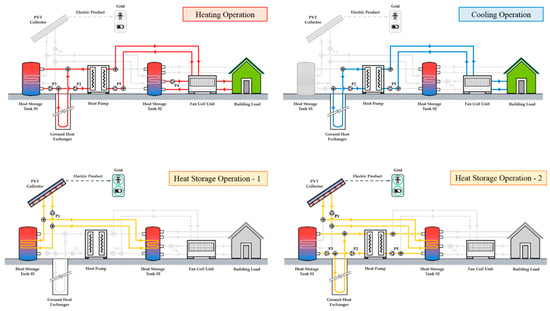
Figure 11.
Operation methods of the tri-generation system.
Heat storage operation is divided into two types and is carried out using either the PVT collector or the heat pump. Heat storage operation 1 is carried out for HST 1 and HST 2 using the PVT collector. The HST 1 takes the role of a buffer tank and receives heat from the PVT collector to maintain a temperature similar to that of the underground heat source. The heat storage operation 1 of the PVT collector for HST 2 is carried out when the temperature of the PVT collector is higher than that of HST 2. The heat storage operation 2 is the heat storage operation for HST 2 and is carried out using the PVT collector and the heat pump. As the heat storage operation using the PVT collect is conducted only under the specific conditions stated earlier, it is difficult to cover the entire heat of the HST 2 consumed by heating load and hot water supply load. Accordingly, heat storage operation is carried out through the heat pump to recover the heat consumed in HST 2. For the heat storage operation through the heat pump, either HST 1 or the GHX, is utilized based on which has the higher outlet temperature, similar to the case of heating operation.
The flow diverter and On/Off differential controller were used to control the cooling and heating operation. The flow diverter simulates incoming fluid from the inlet in either direction of the two outlets according to the control signal [31]. The control signal sets the position of a damper controlling the proportion of fluid to each outlet, as in the following Equations (13) and (14).
Here, is mass flow rate at outlet position 1. is mass flow rate of inlet fluid. is mass flow rate at outlet position 2. is control function having a value between 0 and 1. Normally, the mass fluid flow in the outlet position is 1 (). If the specific condition is satisfied, the mass fluid flows in the outlet position is 2 (). In other words, when the value of the control signal is 0, the fluid flows in outlet position 1, thus the value is 1 and the fluid flows in outlet position 2.
In addition, On/Off differential controller generates a control function which can have a value of 0 or 1. The value of the control signal is chosen as a function of the difference between upper () and lower () temperatures, compared with dead band temperature difference (). The control function of On/Off differential controller can be expressed as follows Equations (15) and (16):
When the dead band difference () is less than the difference between upper temperature () and lower temperature (), the controller is activated by the control signal (). In this study, On/Off differential controllers were applied to the operation using HST 1 and HST 2.
When using the heat pump for heating and heat storage operations, the heat source with higher temperature was utilized. At this time, the outlet temperature of the HST 1 was set to , the outlet temperature of the GHX was set to , and was entered as 1 °C. When the temperature difference between and is higher than , the control signal was set to 1, and the heat pump operation using the HST 1 was conducted. However, when the temperature difference between and was lower than , the control signal was set to 0, and the heat pump operation using the HST 1 was not possible. These conditions were applicable only if the heat pump performed heating and heat storage using the GHX.
Cooling and heating operation is determined by the operation periods and the building load result. First, in the heating period, the building indoor temperature is checked and heating operation is conducted when the building indoor temperature is 20 °C or lower. When the temperature of HST 2 inside is 45 °C higher, heating operation is conducted using HST 2. However, when the temperature of HST 2 inside does not reach 45 °C, heating operation is carried out using the heat pump. The heating operation is conducted using either HST 1 or the GHX, depending on which operation mode has the higher outlet temperature.
Secondly, in a cooling period, the cooling operation is conducted when the building indoor temperature is 26 °C or higher. For cooling operation, only the GSHP is used.
Finally, HST 2 is preferentially considered for the heat storage operation. If the temperature of HST 2 inside is below 52 °C, the heat storage operation is conducted. The heat storage operation for HST 2 using the PVT collector is carried out only if the outlet temperature of the PVT collector is higher than the inside temperature of HST 2 by 5 °C. The temperature of the PVT collector is determined by ambient temperature and solar radiation. However, if these conditions are poor, it is difficult to conduct heat storage operation using the PVT collector. Accordingly, the heat storage operation is carried out through the heat pump, either HST 1 or the GHX. The higher outlet temperature between HST 1 and GHX is that which is utilized. However, when the temperature of the HST 1 is 12 °C or lower, the heat storage operation is performed using the PVT collector. At this time, the outlet temperature of the PVT collector is 1 °C higher than the inside temperature of HST 1.
4. Energy and Economic Analysis According to Design Method
4.1. Dynamic Performance
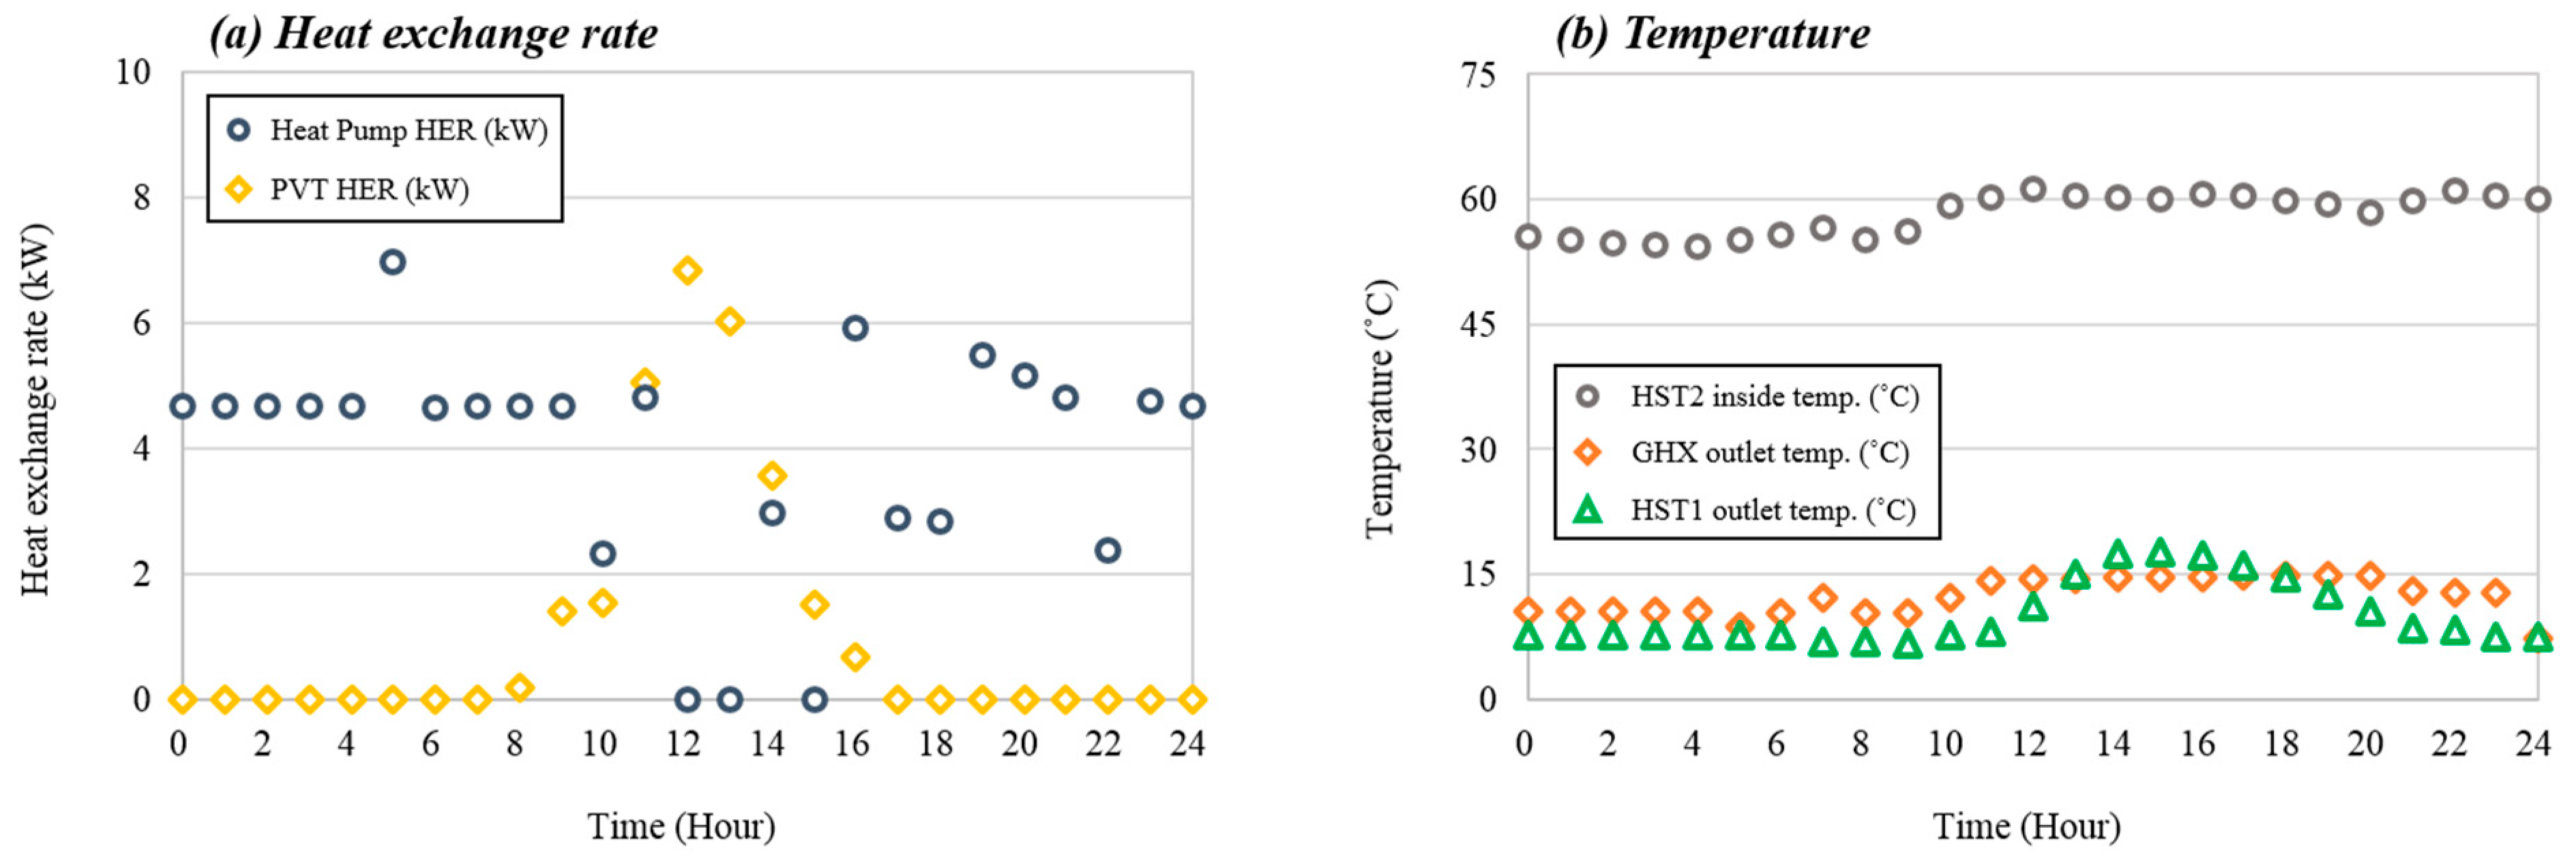
Figure 12 shows the dynamic performance of the tri-generation system. The dynamic performance was analyzed through average hourly data on 16 January. The heat pump is operated intermittently for 24 h, and the PVT collector is gained heat during the daytime.
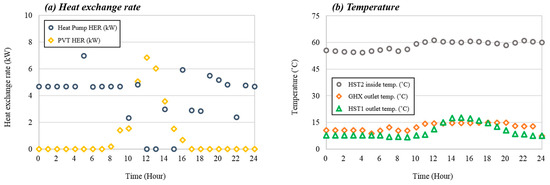
Figure 12.
Dynamic performance of the tri-generation system.
On the other hand, the temperature of the HST2 was changed depending on the system operation method. When the heat storage operation using the heat pump and heating operation using the HST2 were performed at the same time, the temperature of the HST2 indicated a constant state. However, when only the heat storage operation was conducted, the temperature of the HST2 was increased. In addition, the outlet temperature of HST1 was higher than the outlet temperature of the GHX at 14:30. In this case, the heat pump used HST1 as a heat source, not the GHX.
4.2. Energy Analysis
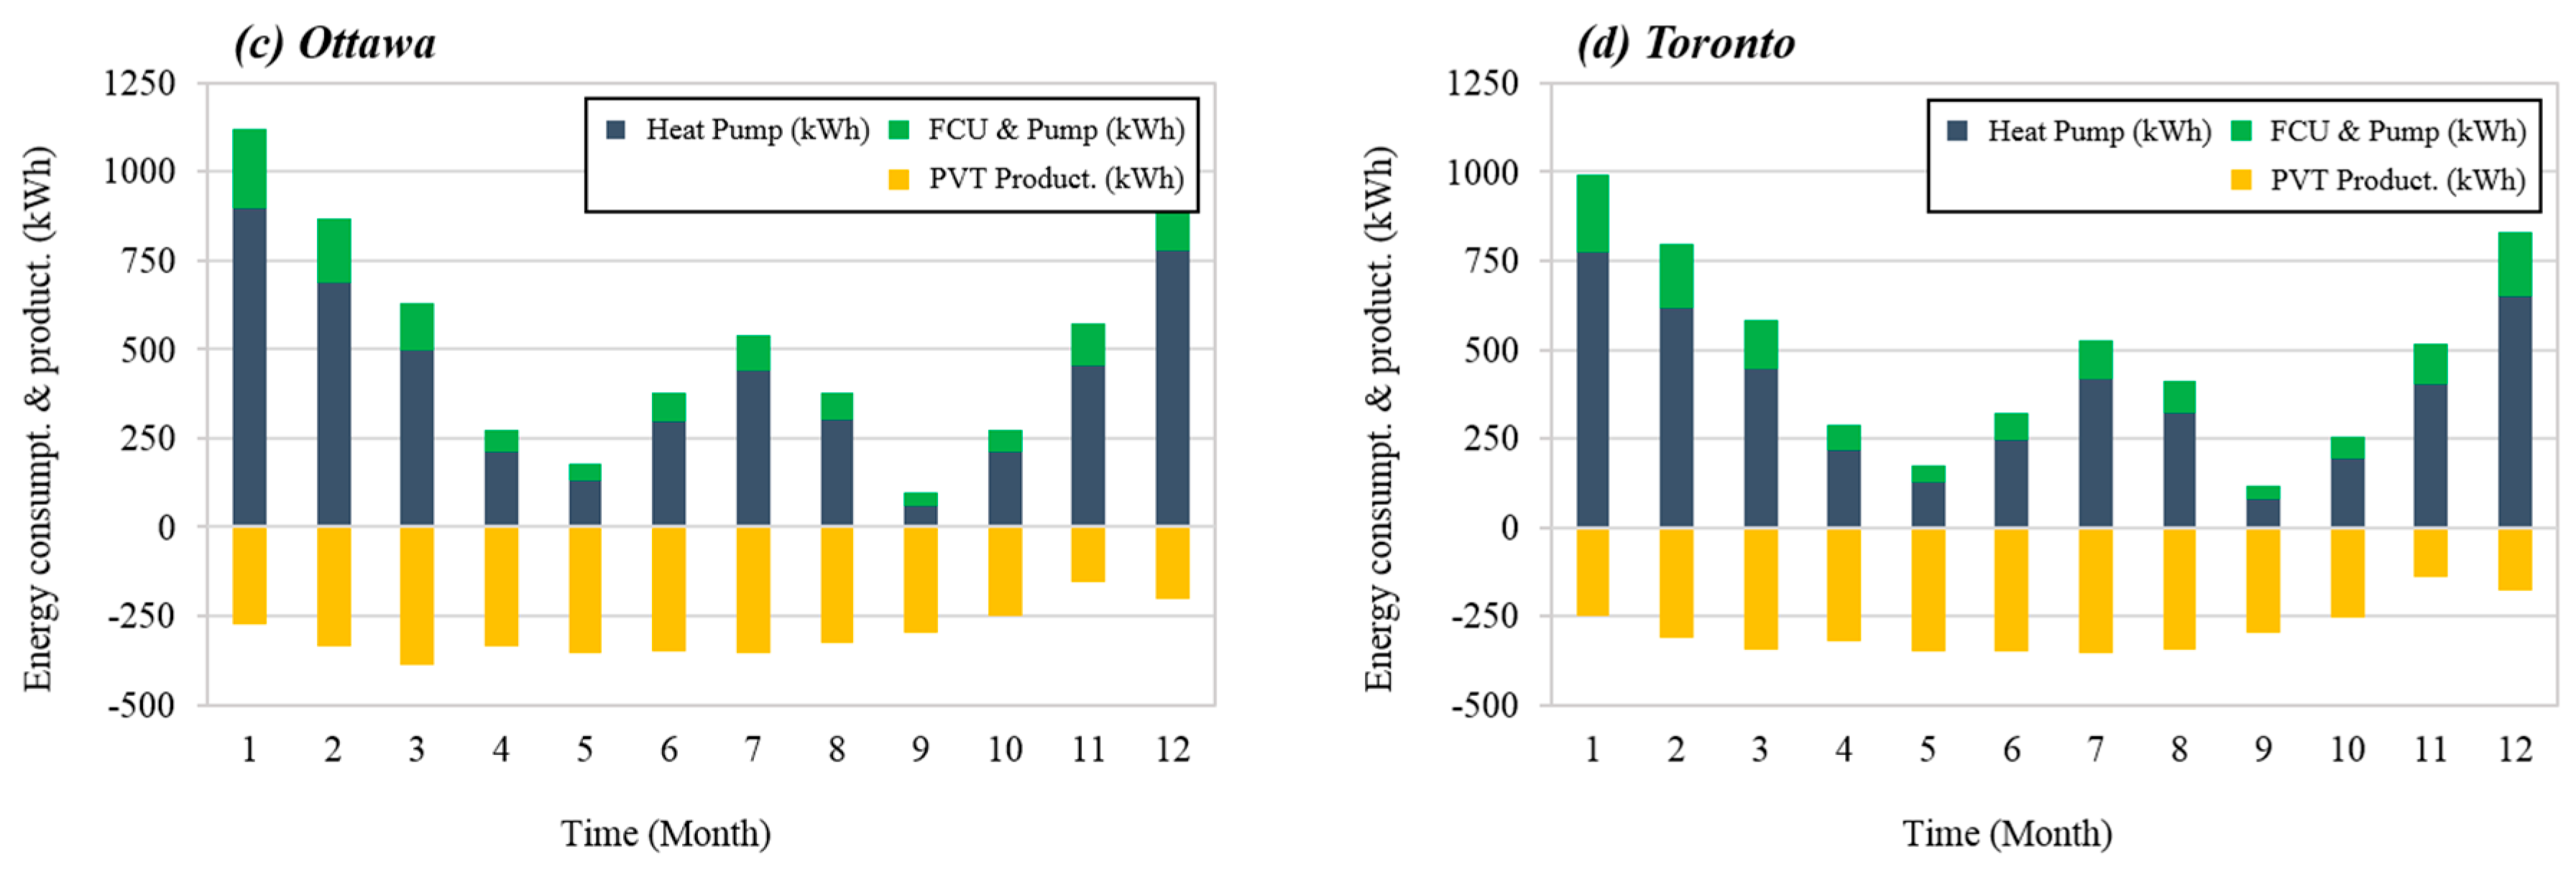
Figure 13 shows the energy consumption of the system and the energy production of the PVT collector by the design based on peak load according to region. The total energy consumption of the system in Seoul and Ulsan was calculated as 4710 kWh and 4672 kWh, respectively. Ulsan decreased the energy consumption of the system by 0.8% (37.1 kWh) compared to Seoul. The cooling load was similar in both regions, but it appears that Ulsan decreased its monthly energy consumption because the heating load from November to January is lower than that of Seoul. On the other hand, the energy production of the PVT collector was higher in an intermediate season than in winter and summer seasons. The total energy production of the PVT collector in Seoul and Ulsan was calculated as 2921 kWh and 3044 kWh, respectively. The monthly energy production of the PVT collector was similar to that of Seoul and Ulsan, but the energy production of the PVT collector installed in Ulsan had been improved by 4.2% (122.6 kWh).
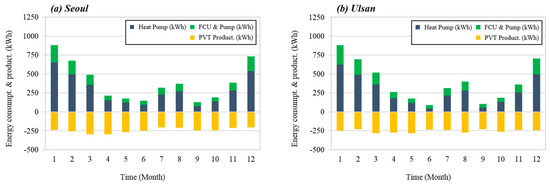
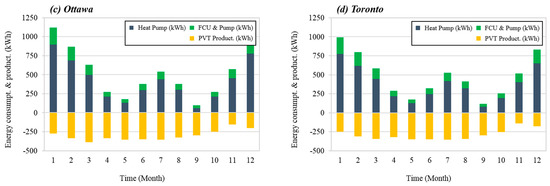
Figure 13.
Energy consumption and production by design based on peak load.
The total energy consumption of the system in Ottawa and Toronto was calculated as 6280 kWh and 5815 kWh, respectively. The systems in both regions in Canada have higher energy consumptions than those in South Korea, and Ottawa increased the energy consumption of the system by 8.0% (465.2 kWh) compared to Toronto. The monthly energy consumption of the system in Ottawa and Toronto was higher in terms of heating energy demand than cooling energy demand like South Korea. Toronto has decreased the energy consumption of the system because of the smaller heating and cooling load than Ottawa. The energy production of the PVT collector in Ottawa and Toronto was calculated as 3623 kWh and 3501 kWh, respectively. Ottawa is located in the north of Toronto, but the energy production of the PVT collector increased by 3.5% (121.4 kWh).
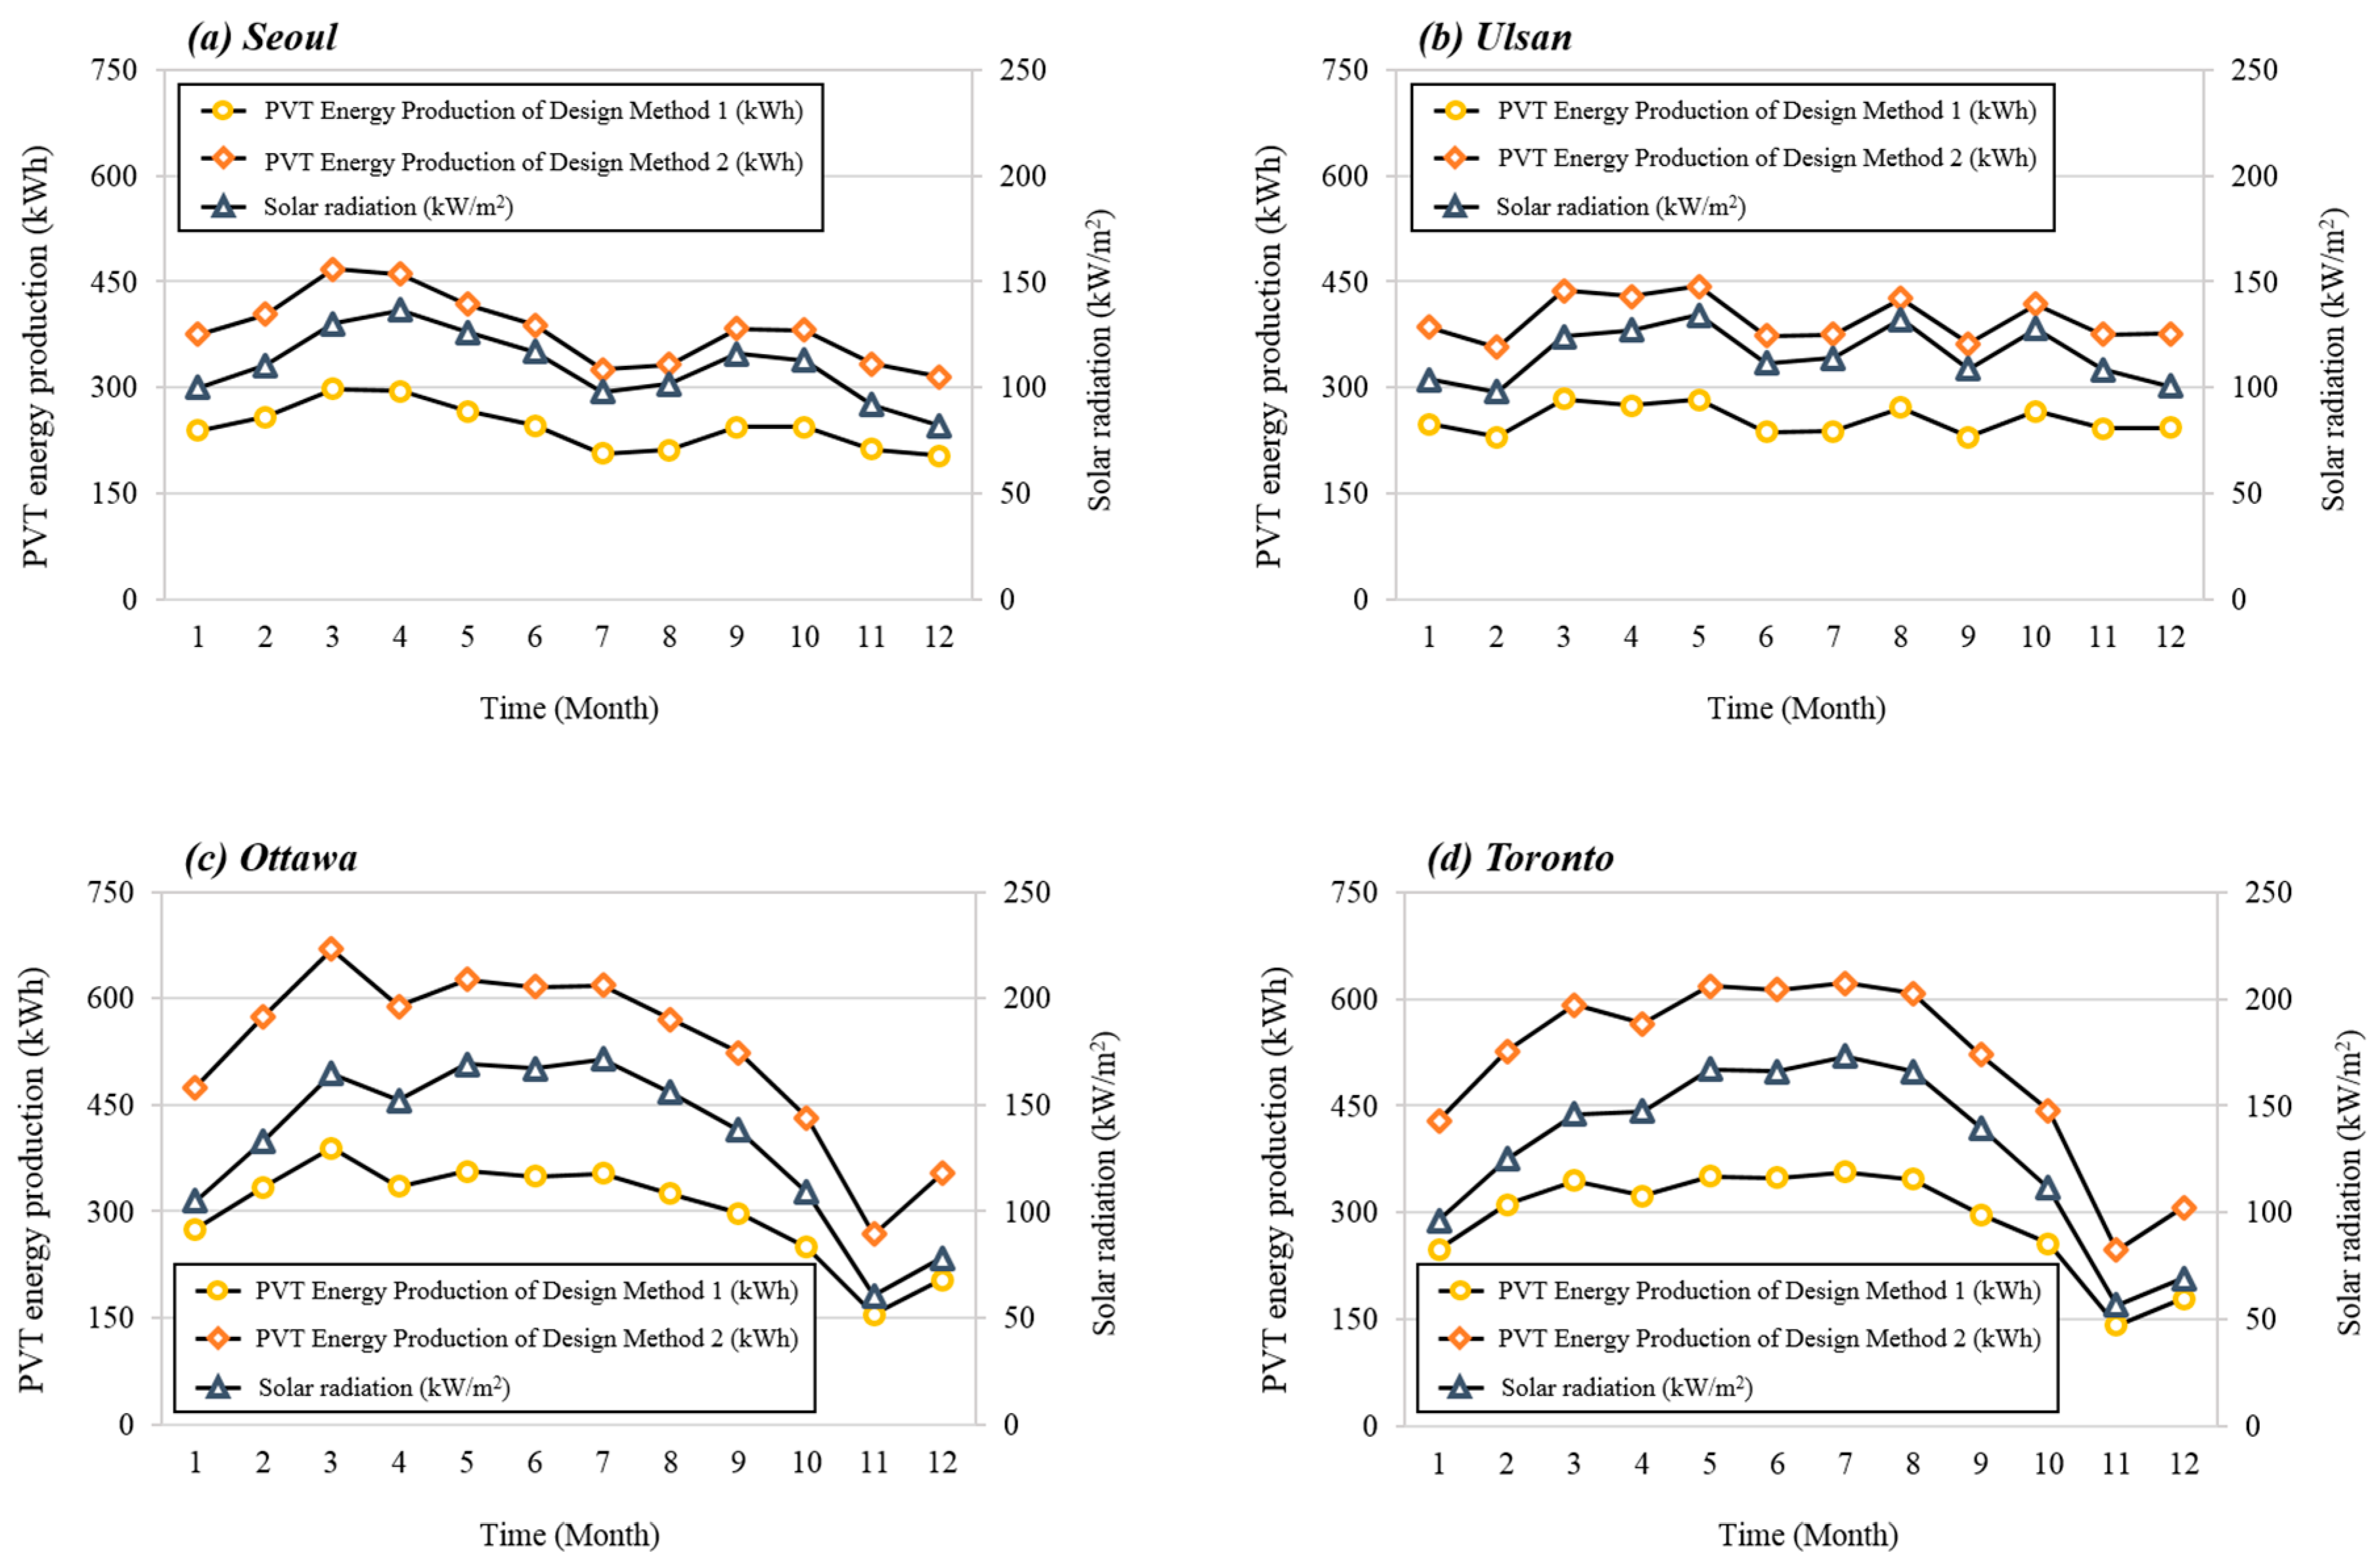
Figure 14 shows the energy production of the PVT collector and the solar radiation according to design method and region. The PVT collector with 10 panels were installed using a design based on peak load. Thus, the annual energy production per PVT collector was estimated to be about 300 kWh in Seoul and Ulsan. The number of installations of the PVT collectors in design for realizing ZEB was calculated based on the energy consumption of the system designed based on peak load. As a result, Seoul and Ulsan needed PVT collectors with 16 panels to realize ZEB. The total energy production of the PVT collector in Seoul and Ulsan was calculated as 4644 kWh and 4755 kWh, respectively, by the design for realizing a ZEB. The energy production was 59.0% (1723 kWh) and 56.2% (1711 kWh) higher than that of the design based on peak load, respectively.
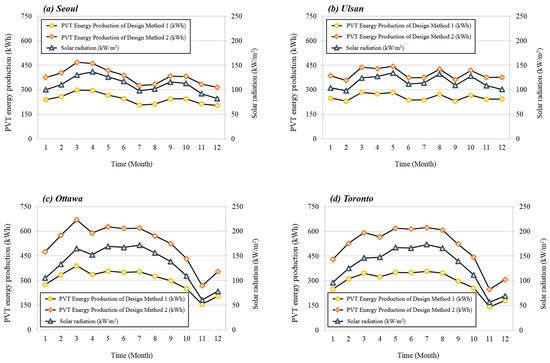
Figure 14.
Energy production of photovoltaic-thermal (PVT) collector and solar radiation according to design method.
On the other hand, the annual energy production per PVT collector was estimated to be about 350 kWh in Ottawa and Toronto. The number of installations of the PVT collectors in Ottawa and Toronto was set to 18 panels based on the energy consumption of the system designed based on peak load. As the result, the total energy production of the PVT collector in Ottawa and Toronto was 6317 kWh and 6092 kWh, respectively. Table 5 shows the energy consumption of the system and the energy production of the PVT collector according to their design methods.
Table 5.
Energy consumption and production by the design method. (Unit: kWh).
4.3. Comparative Analysis of Energy Self-Sufficiency by Design Method
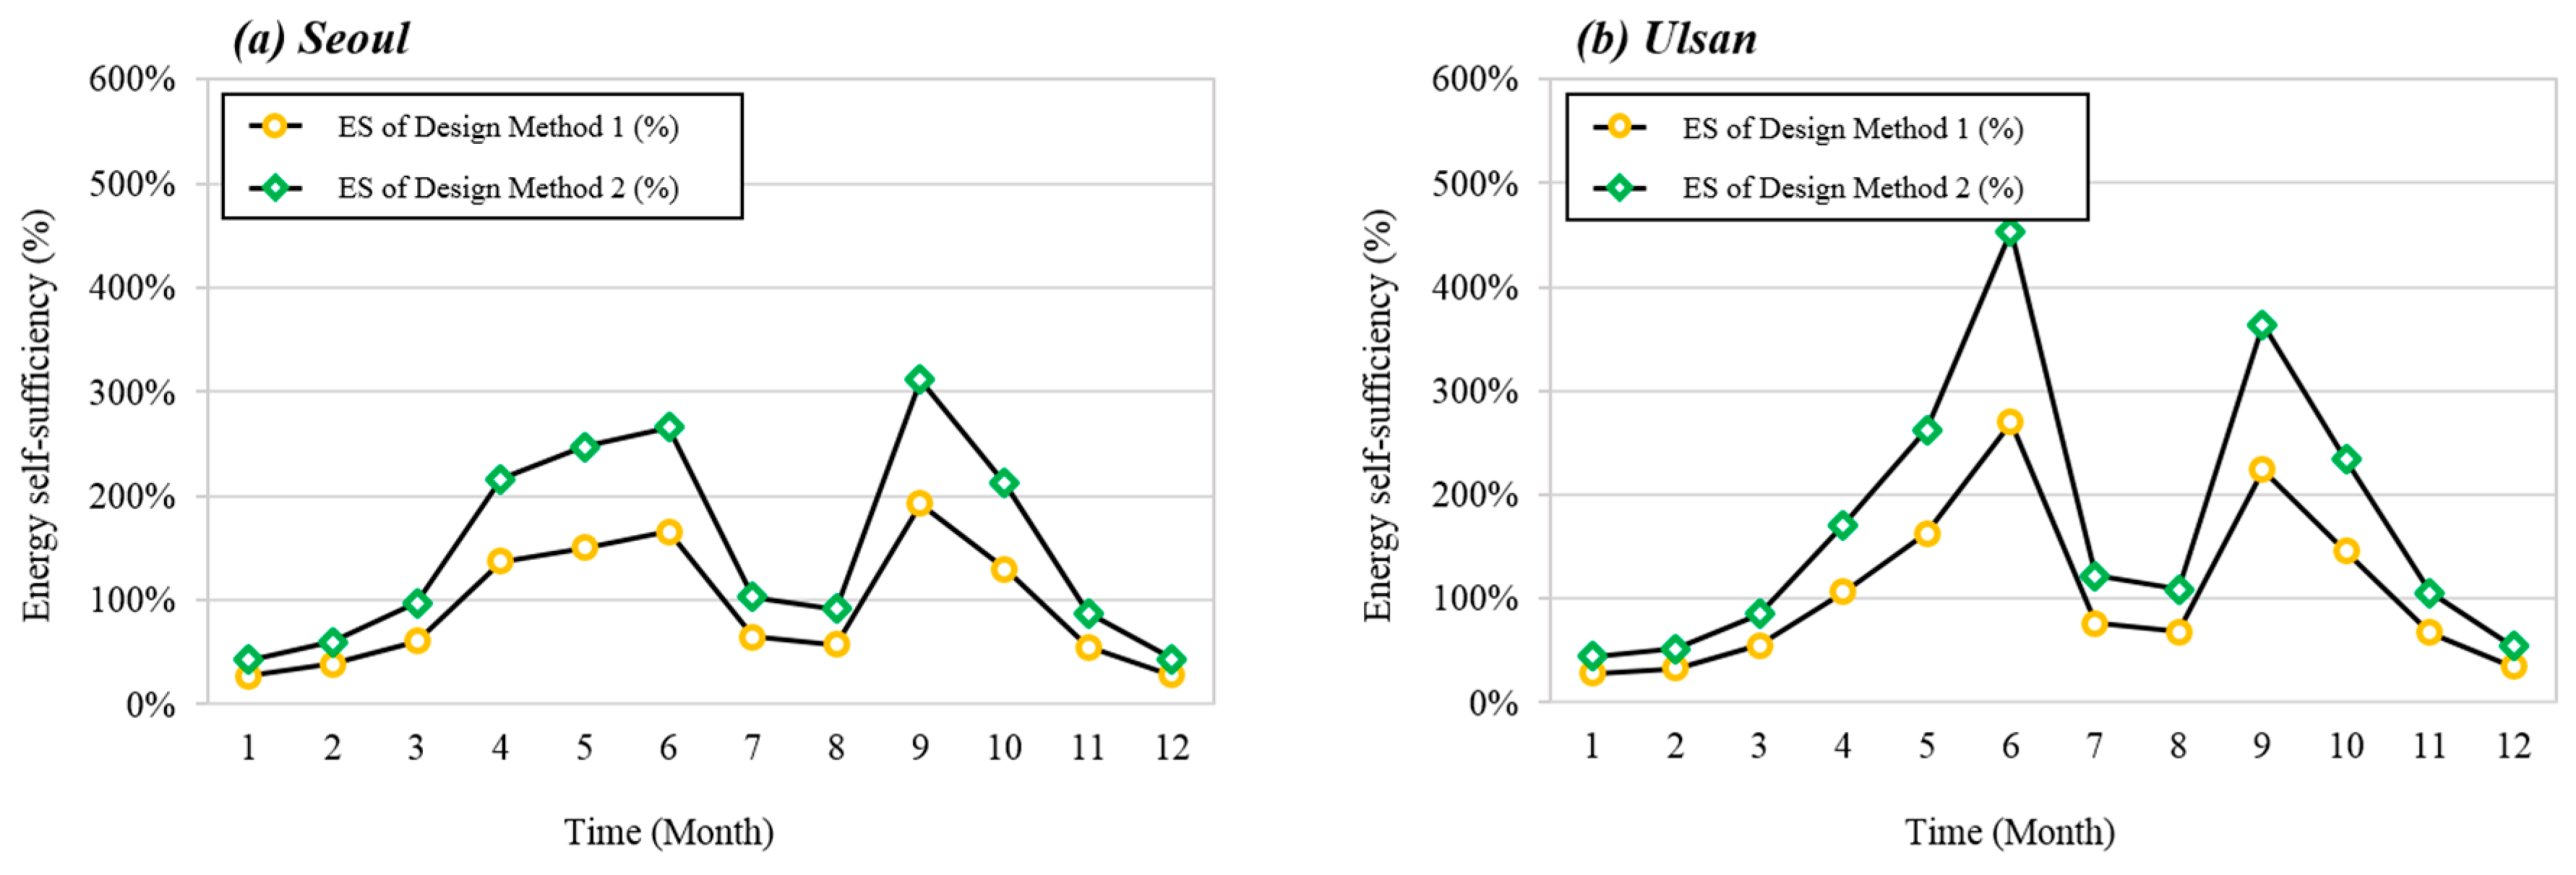
Figure 15 shows the energy self-sufficiency (ES) according to the design method. The ES of buildings can be expressed as Equation (17) using the energy consumption of the system and the energy production of the PVT collector [32].
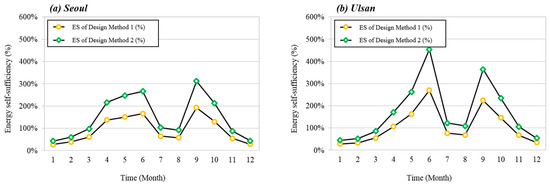
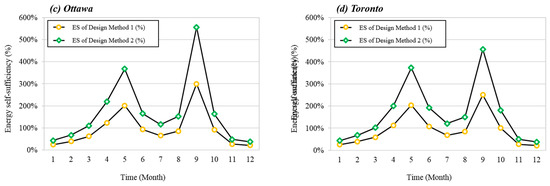
Figure 15.
Energy self-sufficiency (ES) according to design method.
Here, is energy self-sufficiency (%). is energy production of PVT collector (kWh). is energy consumption of system (kWh). The ES in Seoul and Ulsan by the design based on peak load were calculated as 62.0% and 65.1%, respectively. Therefore, the PVT collector with 10 panels is installed. In Seoul and Ulsan, the annual energy production per PVT collector is estimated to be about 300 kWh. Therefore, the design for realizing the ZEB method involves the installation of the PVT collector with 16 panels, considering the total energy consumption of the system by the design based on peak load. The ESs in Seoul and Ulsan by the design for realizing a ZEB were calculated as 98.7% and 103.2%, respectively. Both design methods have identified higher ES during intermediate seasons than in winter and summer. This is because the heating and cooling load is low, and a large amount of solar radiation can be obtained during the intermediate season. In particular, the ES was the highest in June and September in South Korea.
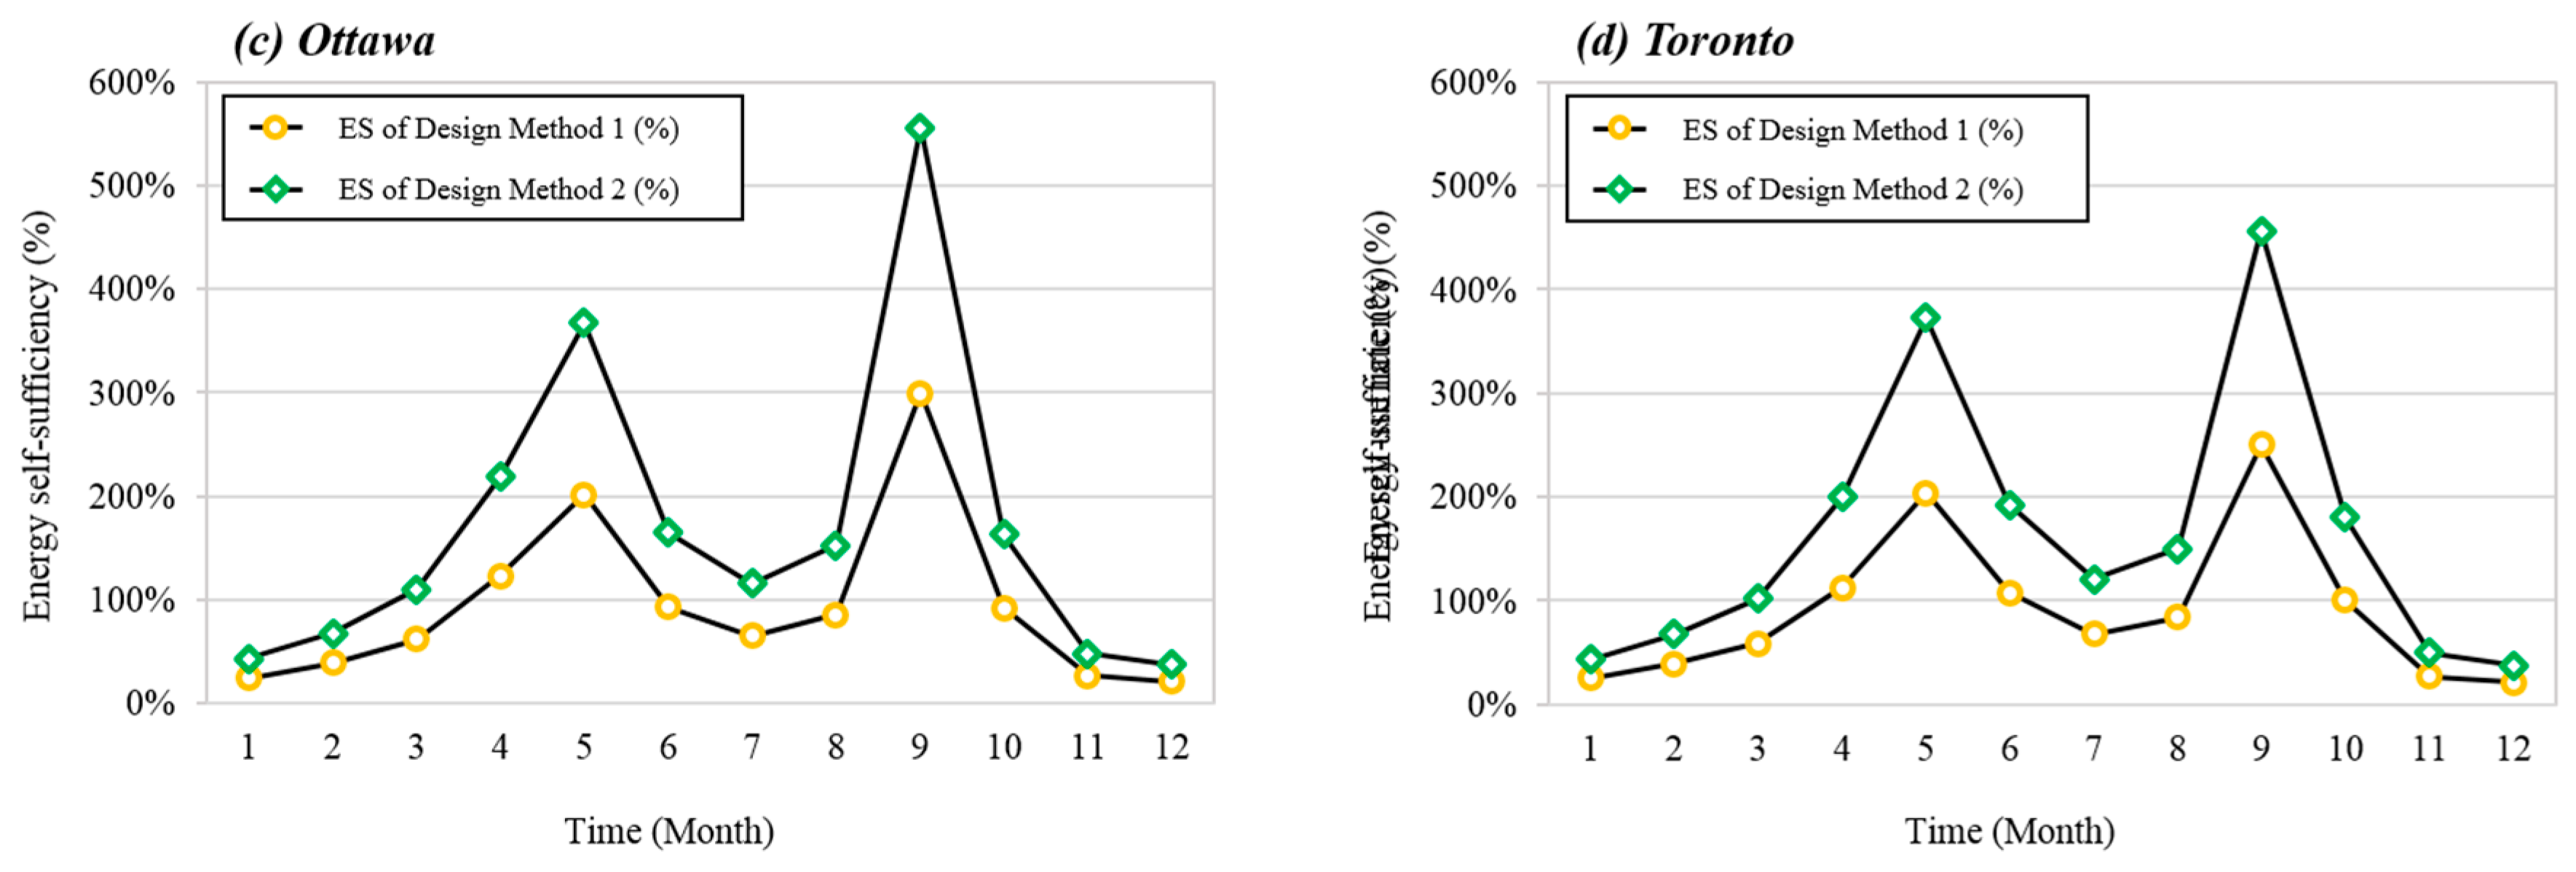
In contrast, the ES in Ottawa and Toronto by the design based on peak load were calculated as 57.7% and 60.2%, respectively. In Canada, the annual energy production per PVT collector is estimated to be about 350 kWh. Therefore, it was assumed that the PVT collector with 18 panels is installed to realize a ZEB, considering the total energy consumption of the system by the design based on peak load. The ES in Ottawa and Toronto by the design for realizing a ZEB were calculated as 102.4% and 106.4%, respectively. This trend was similar to that shown by South Korea’s ES. Moreover, the ES was low during the winter, when building loads were high and solar radiation conditions were poor.
4.4. Economic Analysis
4.4.1. Initial Investment Cost by Design Method
The tri-generation system was combined with the PVT and GSHP systems. Thus, both constructions of the system should be considered when calculating the initial investment cost. In this study, the initial investment cost was calculated by separating the PVT and GSHP systems for accurate economic analysis. The initial investment cost was calculated based on the design capacity of each unit, such as the heat pump, PVT collector, borehole, and circulating pump. In addition, the cost was obtained using quotations from a PVT and GSHP system construction company, government organizations such as the Public Procurement Service [33], and by consultation with system design experts. Table 6 shows the initial investment costs of PVT system construction in South Korea and Canada. The initial investment cost of the PVT system in South Korea was calculated using the PVT manufacturer’s quotation. In Canada, it was calculated by consultation with an expert. As a result of the meeting, a cost of 3 dollars per watt was proposed for the PV panel. The cost of the PVT collector was calculated by considering a 10% surcharge on the PV panel.
Table 6.
Initial investment cost of PVT system cost in South Korea and Canada.
On the other hand, in the system composition by design based on peak load, the PVT collector with 10 panels was installed in both South Korea and Canada. Thus, the initial investment costs for PVT systems in South Korea and Canada were calculated at 10,590 USD and 12,309 USD, respectively. In the system composition by design for realizing a ZEB, the PVT collector with 16 panels was installed in South Korea and the PVT collector with 18 panels was installed in Canada. The costs of the PVT systems in South Korea and Canada were calculated as 15,500 USD and 20,229 USD, respectively. For the realization of the ZEB, South Korea and Canada have improved the initial investment costs of PVT systems by 46.4% (4910 USD) and 64.3% (7920 USD), respectively, from the design based on peak load.
Table 7 shows the initial investment costs of GSHP system construction in South Korea. The initial investment cost of GSHP systems in South Korea was based on a quotation from a GSHP construction company and a cost announced by the Public Procurement Service in Korea [33]. The costs for GSHP systems in Seoul and Ulsan were calculated as 9703 USD and 9431 USD, respectively. The cost in Seoul were higher because the heat pump capacity was higher than that in Ulsan. The initial GSHP investment cost in Canada was calculated based on the product price of GSHP contractors and expert advice. The costs for GSHP systems in Ottawa and Toronto were calculated as 8387 USD and 8245 USD, respectively. Table 8 shows the initial investment costs of the PVT and GSHP systems according to the design method.
Table 7.
Initial investment cost of ground source heat pump (GSHP) system installation cost in South Korea. (Unit: USD).
Table 8.
Initial investment cost of PVT and GSHP system according to design method. (Unit: USD).
4.4.2. Energy Cost by Design Method
The energy cost of the tri-generation system was calculated based on the annual energy consumption of the system and the energy production of the PVT collector. The electric rates of the system in Seoul and Ulsan were based on the Korea Electric Power Corporation (KEPCO) and Korea Power Exchange (KPX) [34,35]. Table 9 shows the monthly electric rates in Seoul and Ulsan. The electric rates of the system in Ottawa and Toronto were based on the Ontario energy report proposed by the Ontario Ministry of Energy. The cost of energy production of the PVT collector was referred to as the Feed-in Tariff (FIT)/microFIT price of the Independent Electricity System Operator (IESO) [36]. In Ottawa and Toronto, the applicable hours for off-peak, mid-peak, and on-peak electrical rates are different in summer and winter [37]. Therefore, the hourly electric rates in summer and winter were averaged. Table 10 shows the monthly electric rates in Ottawa and Toronto.
Table 9.
Monthly electric rates of Seoul and Ulsan according to design method. (Unit: USD).
Table 10.
Monthly electric rates of Ottawa and Toronto according to design method. (Unit: USD).
4.4.3. Initial Investment Cost and Energy Cost of Conventional System
In order to analyze the feasibility of the tri-generation system, it is necessary to compare it with the conventional system. Table 11 shows the initial investment cost and energy cost of conventional systems in South Korea. In South Korea, the initial investment cost and the energy cost were calculated for the conventional system such as kerosene boiler and air-conditioner (A/C) that is most actively used.
Table 11.
Initial investment cost and energy cost of conventional system in South Korea.
The kerosene boiler was used for the heating and DHW loads, and the air-conditioner was used for the cooling load. The initial investment costs were based on quotations from kerosene boiler and air-conditioner manufacturers with the construction company. Also, the energy costs were based on kerosene and electric rates notified by the Korea National Oil Corporation (KNOC) and KEPCO [34,38].
Table 12 shows the initial investment cost and energy cost of conventional system in Canada. The conventional system in Canada is assumed to use the boiler and air-conditioner similar to South Korea. The initial investment costs referred to quotation of manufacturers. The energy costs were based on electrical rates notified by Natural Resources Canada and Ontario Ministry of Energy [37,39].
Table 12.
Initial investment cost and energy cost of conventional system in Canada.
4.5. Evaluate Feasibility
In order to evaluate the feasibility of the tri-generation system, return on investment (ROI) analysis was performed considering life-cycle cost (LCC). In this study, the payback period of the tri-generation system compared to that of the conventional system was analyzed using the net present value (NPV), which converts the future value to the present value. The NPV analysis method can be expressed by the following:
Here, is present value of future cash, is capitalization factor of annuity, is cost incurred after n years. is annual cost, Ir is discount value. South Korea’s bank rate and inflation rate were based on the one-year (2018–2019) data announced by the Economic Statistics System of Korea bank; the average real discount rate for one-year was 0.74% [40,41]. Canada’s bank rate and inflation rate were based on the Bank of Canada, and the average annual real discount rate was −0.07% [42]. A period of 20 years was used for the ROI analysis.
Figure 16 shows the ROI analysis results for the South Korea according to the design method. Figure 16a shows a comparison between the ROI of the tri-generation system designed based on peak load and that of the conventional system. Compared to the conventional system, the initial investment cost of the tri-generation system in Seoul was higher by 80.1% (9026 USD), the annual energy cost was lower by 83.0% (769 USD), and the payback period was calculated as 13 years. In addition, the initial investment cost of the tri-generation system in Ulsan was higher by 77.7% (8754 USD), the annual energy cost was lower by 84.6% (770 USD), and payback period was calculated as 12 years. The payback period was shortened by one year in Ulsan, in which the capacity of the system was low, and the energy production of the PVT collector was high.
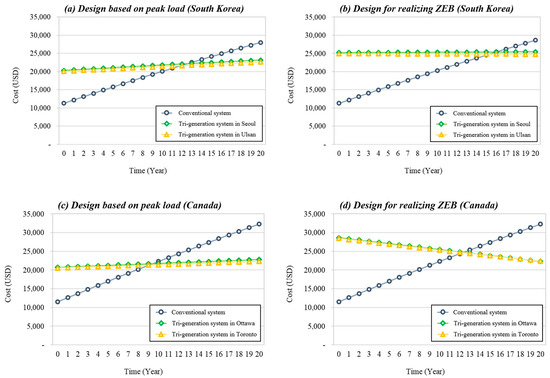
Figure 16.
Return on investment (ROI) comparative and payback period analysis: (a)Design based on peak load(South Korea); (b)Design for realizing ZEB(South Korea); (c)Design based on peak load(Canada); (d)Design for realizing ZEB (Canada).
Figure 16b shows a comparison between the ROI of the tri-generation system designed for realizing ZEB and that of the conventional system. The annual energy costs of Seoul and Ulsan reduced by 98.6% (916 USD) and 100.9% (936 USD), respectively, compared to the conventional system. However, the initial investment costs increased and the payback periods were calculated as 17 years and 16 years, respectively.
Figure 16c shows a comparison between the ROI of the tri-generation system designed based on peak load and that of the conventional system in Canada. The initial investment costs of the tri-generation systems in Ottawa and Toronto were higher by 79.9% (9194 USD) and 78.7% (9052 USD), respectively, of those of conventional systems. On the other hand, the costs of energy were lower by 90.7% (1017 USD) and 92.4% (1035 USD), respectively. The payback period was 10 years in Ottawa and 9 years in Toronto. The payback periods were confirmed in Canada earlier than in South Korea.
Figure 16d shows a comparison between the ROI of the tri-generation system designed to realize ZEB and that of the conventional system in Canada. The annual energy costs of Ottawa and Toronto were reduced by 128.1% (1436 USD) and 129.3% (1450 USD), respectively. With the increase in initial investment costs, the payback periods for Ottawa and Toronto were calculated to be 13 years. Under similar ES conditions, the payback period for the tri-generation system was lower in Canada than in South Korea.
On the other hand, there are benefits in South Korea of the installation of the renewable energy system and certification of the ZEB [43,44]. Table 13 shows the support fund of renewable energy system installation in South Korea.
Table 13.
Support fund of renewable energy system installation in South Korea.
The support fund for the renewable energy system referred to the public announcement of the Korea Energy Agency [42]. The support fund of the PVT collector was calculated by assuming the role of both the PV system and the solar system. In addition, the fund of the geothermal system referred to the vertical closed-loop type.
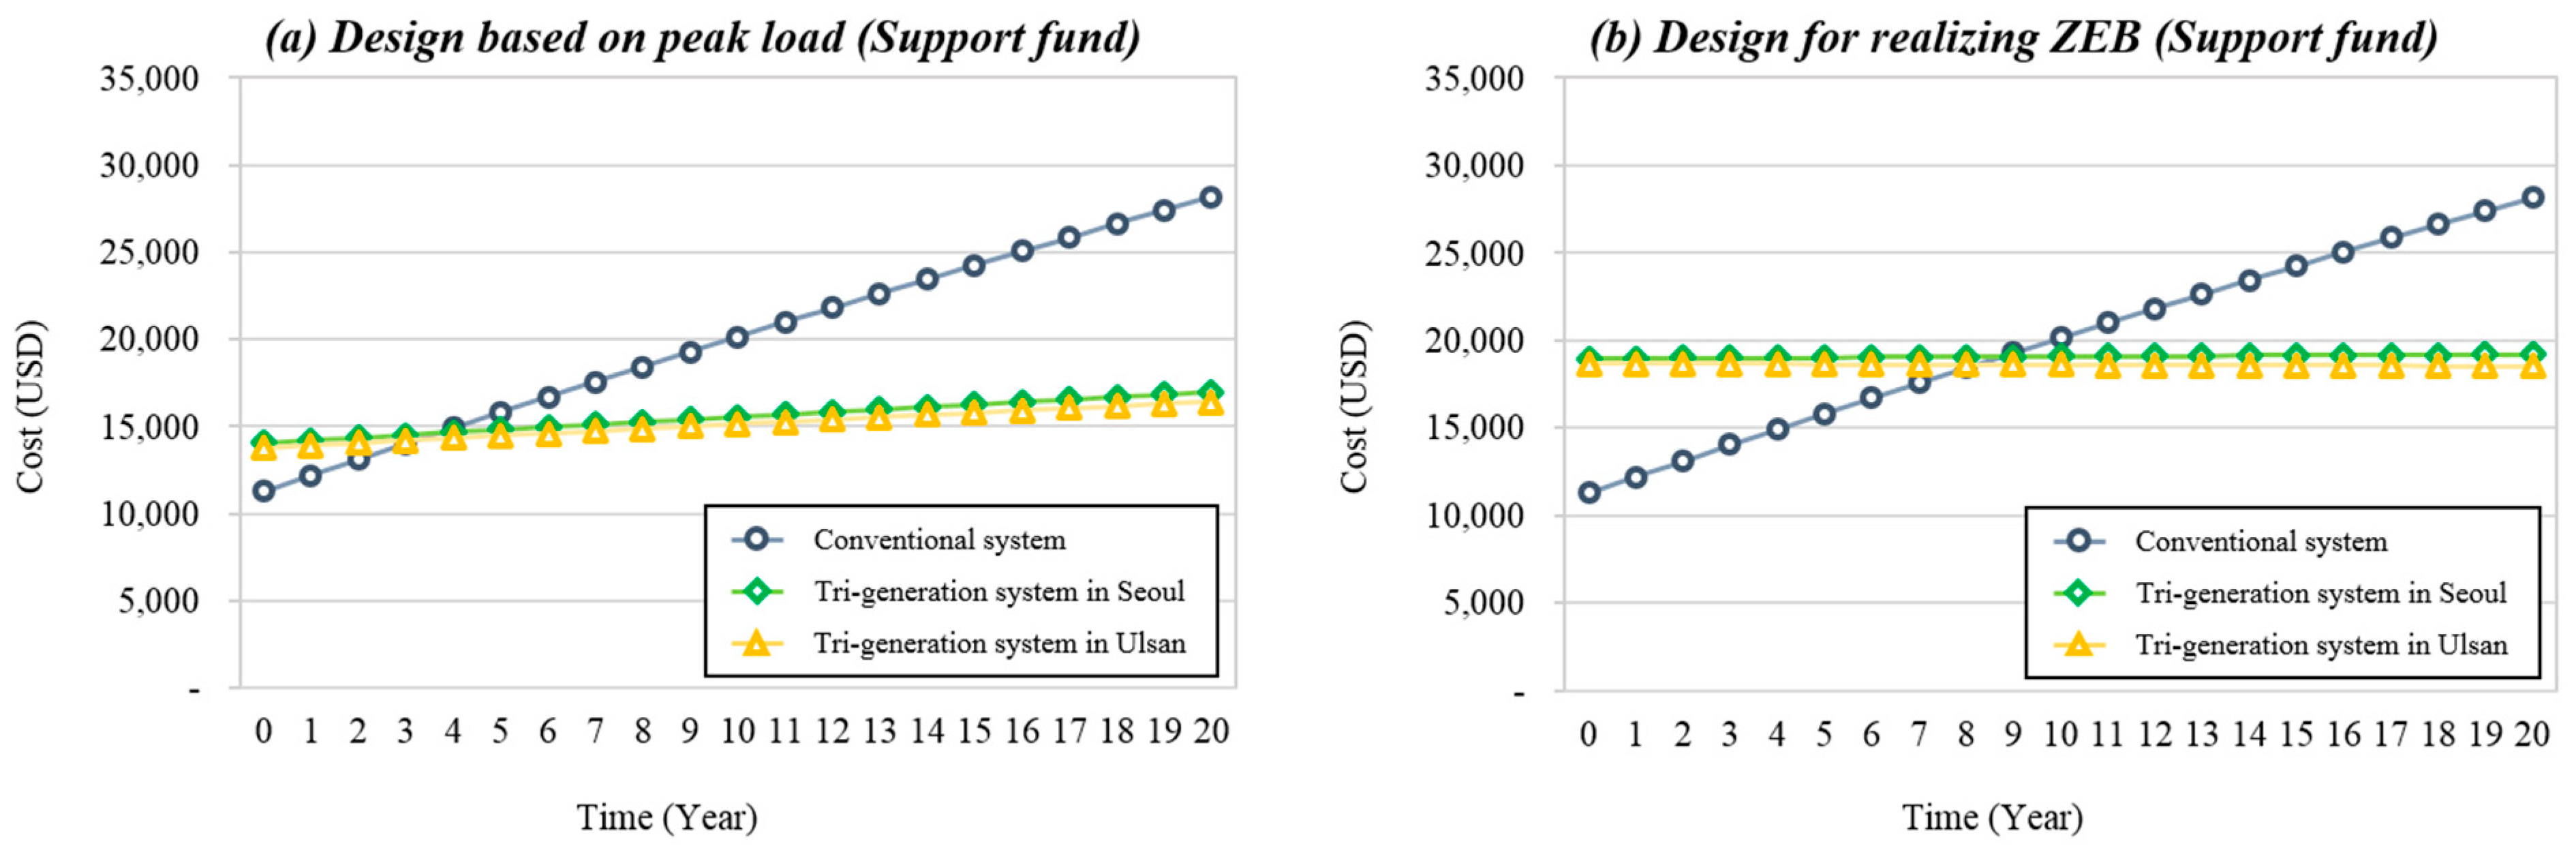
Figure 17 shows the ROI analysis results considering the support fund for the installation of the renewable energy system. The initial investment costs were reduced, and the costs of the system designed based on peak load in Seoul and Ulsan were 14,049 USD and 13,777 USD, respectively. Thus, the payback period was calculated to be 4 years for both regions; it could be shortened by up to 9 years compared to when no funding was received. In addition, the initial investment costs of the system designed to realize ZEB in Seoul and Ulsan were calculated as 18,960 USD and 18,687 USD, respectively. The payback period was calculated to be 10 years in Seoul and 9 years in Ulsan; the payback period was shortened by 7 years.
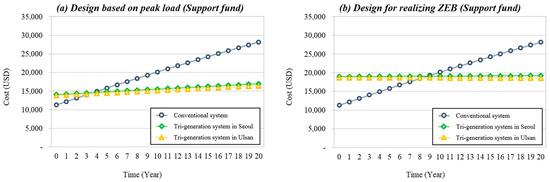
Figure 17.
ROI comparative and payback period analysis considering support fund.
5. Conclusions
In this study, a performance prediction model for the tri-generation system considering the building load condition and local condition was developed. Furthermore, the conventional design method and the design method for a ZEB realization were proposed. In addition, the feasibility of the system according to design method and local condition was evaluated through comparative analysis of the economy of the tri-generation system and the conventional system. Results of this study are summarized as follows.
(1) According to the design based on peak load, the ES of building with the tri-generation system at Seoul and Ulsan were calculated as 62.0% and 65.1%, respectively. PVT collectors with 16 panels were required for ZEB realization. The ESs of Seoul and Ulsan designed for realizing ZEB were calculated as 98.7% and 103.2%, respectively. The ESs were high during the intermediate season because the cooling and heating load was low and the energy production of the PVT collector was high in the intermediate season.
(2) In addition, the ES of Ottawa and Toronto designed based on peak load were calculated as 57.7% and 60.2%, respectively. Therefore, PVT collectors with 18 panels were required for ZEB realization. The ES of Ottawa and Toronto designed for realizing ZEB were calculated as 102.4% and 106.4%, respectively. The ES trend in Canada was similar to that of the ES in South Korea. The ESs were lower in the winter when the heating load was high and solar radiation was lower.
(3) The payback periods of the tri-generation systems in Seoul and Ulsan designed based on peak load was were calculated as 13 years and 12 years, respectively. The payback period in Ulsan was shorter than that in Seoul by one year, because the energy production of the PVT collector was high. However, the payback period of the tri-generation system designed for realizing a ZEB was calculated as 17 years and 16 years, respectively. The payback period by design realizing for a ZEB was lengthened because the initial investment costs were higher.
(4) In addition, the payback period of the tri-generation systems in Ottawa and Toronto designed based on peak load were calculated as 10 years and 9 years, respectively. The payback period was shorter in Canada than in South Korea because of the high initial investment cost and annual energy cost of the conventional system in Canada. Meanwhile, the payback periods of the systems designed for realizing ZEB in Ottawa and Toronto were calculated as 13 years. Under similar ES conditions, the payback period of the tri-generation system was found to be shorter in Canada than in South Korea.
(5) On the other hand, in South Korea, government supports the installation of the renewable energy system and the ZEB through several incentive programs. Therefore, the payback period by design based on peak load considering the support fund was calculated as 4 years.
In the future, we will propose an optimal design method to meet the cost and performance of the tri-generation system and conduct a performance and feasibility analysis.
Author Contributions
The authors S.B. and Y.N. constructed performance prediction model of tri-generation system and wrote the full manuscript. The author I.d.C. conducted data curation for economic analysis.
Funding
This research was financially supported by the Ministry of Trade, Industry and Energy (MOTIE) and Korea Institute for Advancement of Technology (KIAT) through the International Cooperative R&D program (N062000014_Economic Solution for Trigeneration system).
Acknowledgments
This research was financially supported by the Ministry of Trade, Industry and Energy (MOTIE) and Korea Institute for Advancement of Technology (KIAT) through the International Cooperative R&D program (N062000014_Economic Solution for Trigeneration system) and was financially supported by the Government of Canada under the Canada-Korea Collaborative Industrial Research and Development Program (CIRDP) administered through the Industrial Research and Development Program (IRAP).
Conflicts of Interest
The authors declare no conflict of interest.
References
- International Energy Agency. World Energy Outlook 2018; IEA: Paris, France, 2018. [Google Scholar]
- Korea Energy Agency. New & Renewable Energy White Paper; Korea Energy Agency: Kyeonggi-do, Korea, 2018. [Google Scholar]
- Zhagn, L.; Chen, Z. Design and research of the movable hybrid photovoltaic-thermal (PVT) system. Energies 2017, 10, 507. [Google Scholar]
- Lee, K.S.; Putrayudha, S.A.; Kang, E.C.; Lee, E.J. An experimental performance comparison study of solar heat and power hybrid unit module. Trans. Korea Soc. Mech. Eng. B 2014, 38, 757–762. [Google Scholar] [CrossRef]
- Jeong, Y.D.; Yu, M.G.; Nam, Y. Feasibility study of a heating, cooling and domestic hot water system combining a photovoltaic-thermal system and a ground source heat pump. Energies 2017, 10, 1243. [Google Scholar] [CrossRef]
- Kim, Y.H.; Dai, L.; Bae, S.M.; Nam, Y.; Hwang, J.H. A proposal for optimal liquid solar and thermal systems (L-PVTs) and analysis of seasonal energy production. J. Korean Inst. Archit. Sustain. Environ. Build. Syst. 2019, 13, 55–69. [Google Scholar]
- Kim, S.M.; Kim, J.H.; Kim, J.T. An experimental study on thermal and electrical performance of an air-type PVT collector. J. Korean Sol. Energy Soc. 2019, 39, 23–32. [Google Scholar]
- Ramos, A.; Chatzopoulou, M.A.; Guarrachino, I.; Freeman, J.; Markides, C.N. Hybrid photovoltaic-thermal solar systems for combined heating, cooling and power provision in the urban environment. Energy Convers. Manag. 2017, 150, 838–850. [Google Scholar] [CrossRef]
- Guarrcino, I.; Mellor, A.; Ekins-Daukes, N.J.; Markides, C.N. Dynamic coupled thermal-and-electrical modeling of sheet-and-tube hybrid photovoltaic/thermal (PVT) collectors. Appl. Therm. Eng. 2016, 101, 778–795. [Google Scholar] [CrossRef]
- Zhou, C.; Liang, R.; Zhang, J. Optimization design method and experimental validation of a solar PVT cogeneration system based on building energy demand. Energies 2017, 10, 1281. [Google Scholar] [CrossRef]
- Xia, L.; Ma, Z.; Kokogiannakis, G.; Wang, S.; Gong, X. A model-based optimal control strategy for ground source heat pump system with integrated solar photovoltaic thermal collectors. Appl. Energy 2018, 228, 1399–1412. [Google Scholar] [CrossRef]
- Entchev, E.; Yang, L.; Ghorab, M.; Lee, E.J. Performance analysis of a hybrid renewable microgeneration system in load sharing applications. Appl. Therm. Eng. 2013, 71, 697–704. [Google Scholar] [CrossRef]
- Canelli, M.; Entchev, E.; Sasso, M.; Yang, L.; Ghorab, M. Dynamic simulations of hybrid energy systems in load sharing application. Appl. Therm. Eng. 2015, 75, 315–325. [Google Scholar] [CrossRef]
- Emmi, G.; Zarrella, A.; Carli, D.M. A heat pump coupled with photovoltaic thermal hybrid solar collectors: A case study of a multi-source energy system. Energy Convers. Manag. 2017, 151, 386–399. [Google Scholar] [CrossRef]
- Jeong, Y.D.; Nam, Y.; Yeo, S.G. Dynamic energy simulation for suitable capacity decision of GSHP-PVT hybrid system. J. Archit. Inst. Korea Struct. Constr. 2017, 33, 53–61. [Google Scholar]
- Conti, P.; Schito, E.; Testi, D. Cost-benefit analysis of hybrid photovoltaic/thermal collectors in nearly zero-energy building. Energies 2019, 12, 1582. [Google Scholar] [CrossRef]
- U.S National Renewable Energy Laboratory (NREL). Available online: www.nrel.gov (accessed on 26 August 2019).
- Beginning Farmers Center. Available online: www.returnfarm.com (accessed on 26 August 2019).
- International Organization for Standardization. Energy Performance of Buildings—Calculation of Energy Use for Space Heating and Cooling; ISO 13790; ISO: Geneva, Switzerland, 2007. [Google Scholar]
- Natural Resources Canada. National Energy Coed of Canada for Buildings 2017; Natural Resources Canada: Hamilton, ON, Canada, 2017. [Google Scholar]
- Framework Act on Low Carbon, Green Growth. Available online: www.law.go.kr (accessed on 26 August 2019).
- International Organization for Standardization. Ergonomics of the Thermal Environment—Analytical Determination and Interpretation of Thermal Comfort Using Calculation of the PMV and PPD Indices and Local Thermal Comfort Criteria; ISO 7730; ISO: Geneva, Switzerland, 2005. [Google Scholar]
- ASHRAE. Ventilation and Acceptable Indoor Air Quality in Residential Buildings; ASHRAE Standard 62.2-2016; ASHRAE: Atlanta, GA, USA, 2016. [Google Scholar]
- Occupancy Schedule. Available online: knowledge.autodesk.com (accessed on 26 August 2019).
- ASHRAE. ASHRAE Handbook, HVAC Applications (SI); ASHRAE: Atlanta, GA, USA, 2011. [Google Scholar]
- Chung, S.W. A study on the Characteristics of Hot Water Supply Ratio and Consumption in Apartment Housing with District Heating System—In the Case Study of Goyang City Only. Master’s Thesis, Seoul National University, Seoul, Korea, 2005. [Google Scholar]
- Hellström, G. Duct Ground Heat Storage Model Manual for Computer Code; Department of Mathematical Physics, University of Lund: Lund, Sweden, 1989. [Google Scholar]
- Duffie, J.A.; Beckman, W.A. Solar Engineering of Thermal Process, 4th ed.; John Wiley & Sons, Inc.: Hoboken, NJ, USA, 2013. [Google Scholar]
- TRNSYS 17. Electrical library mathematical Reference; TESS Libs 17: Milwaukee, WI, USA, 2012; Volume 3. [Google Scholar]
- TRNSYS 17. HVAC Library Mathematical Reference; TESS Libs 17: Milwaukee, WI, USA, 2012; Volume 6. [Google Scholar]
- TRNSYS 17. Mathematical Reference; TESS Libs 17: Milwaukee, WI, USA, 2014; Volume 4. [Google Scholar]
- Lee, S.M.; Kim, J.H.; Shin, G.S.; Kim, E.J. Market acceptability of the ZEB certification system for public buildings according to the 2025 roadmap. J. Korean Inst. Archit. Sustain. Environ. Build. Syst. 2018, 12, 557–566. [Google Scholar]
- Public Procurement Service in Korea, National Market Shopping Mall. Available online: http://shopping.g2b.go.kr (accessed on 26 August 2019).
- Korea Electric Power Corporation, Electric Rates Table—Residential Service. Available online: http://home.kepco.co.kr (accessed on 26 August 2019).
- Korea Power Exchange, System Marginal Price. Available online: www.kpx.or.kr (accessed on 26 August 2019).
- Independent Electricity System Operator, FIT/microFIT Price Schedule. Available online: www.ieso.ca (accessed on 26 August 2019).
- Ontario Ministry of Energy, Ontario Energy Report Q3. 2018. Available online: ontarioenergyreport.ca (accessed on 26 August 2019).
- Korea National Oil Corporation, Domestic Oil Prices. Available online: www.opinet.co.kr (accessed on 26 August 2019).
- Natural Resources Canada, Average Retail Prices for Furnace Oil in 2019. Available online: www.ncran.gc.ca (accessed on 26 August 2019).
- Korea Economic Statistics System, Interest Rates. Available online: http://ecos.bok.or.kr (accessed on 26 August 2019).
- K-Indicator, Inflation Rate. Available online: www.index.go.kr (accessed on 26 August 2019).
- Bank of Canada, Policy Interest Rate and Total CPI Inflation. Available online: www.bankofcanada.ca (accessed on 26 August 2019).
- Korea Energy Agency. Public Announcement of New & Renewable Energy 2019-12; Korea Energy Agency: Kyeonggi-do, Korea, 2019. [Google Scholar]
- Korea Energy Agency. Zero Energy Building Incentive. Available online: zeb.energy.or.kr (accessed on 26 August 2019).


© 2019 by the authors. Licensee MDPI, Basel, Switzerland. This article is an open access article distributed under the terms and conditions of the Creative Commons Attribution (CC BY) license (http://creativecommons.org/licenses/by/4.0/).