Abstract
The aim of this research was to improve the understanding of the complex flow features found around a wheel and wheelhouse and to examine how the lateral displacement of the wheel affects these features and the production of exhibited pressures and forces. A bespoke rotating wheel rig and accompanying wheelhouse with a fully-pressure-tapped wheel arch was designed and manufactured at Loughborough University. Wind tunnel tests were performed where force and pressure measurements and Particle Image Velocimetry (PIV) data were obtained. The experimental data was used to validate unsteady CFD predictions where a k- SST Improved Delayed Detached Eddy Simulation (IDDES) turbulence model was used in STAR-CCM+ (10.04.009, Siemens). The CFD showed good agreement with all trends of the experimental results providing a validated numerical methodology. For both methodologies, a lower amount of wheelhouse drag was found generated when the wheel was rotating. However, the CFD showed that whilst this was the case, total configuration drag had increased. This was attributed to an increase of the wheel and axle drag, illustrated by the change in separation over the wheel itself when located within a wheelhouse and so overcompensating the reduction in body and stand drag. Differences in vortex locations when comparing to previously-attained results were due to differences in housing geometry, such as blockage in the cavity or housing dimensions. Experimental and computational results showed that up until a 10 mm displacement outboard of the housing, overall drag decreased. The reduction in housing drag was credited to a reduction in the size of outboard longitudinal vortex structures. This led to the lateral width of the shear layer across the housing side being narrower. Overall, this study identified that there were potential benefits to be gained when offsetting a wheel outboard of the longitudinal edge of a model housing.
1. Introduction
1.1. Existing State of the Art
Over recent years, the economic and environmental impact of the car industry has driven the need to find new and novel ways to reduce fuel burn and harmful emissions. With road vehicles responsible for approximately 12% of the EU’s total emissions of CO, stringent legislation with significant financial penalty has been put in place, with the fleet average emission for new cars being restricted to 95 g CO/km [1]. Reducing the aerodynamic drag is one way to achieve these requirements, as well as maximising the range for electric propulsion vehicles; thus, this has led to a great deal of research focused on improving ground vehicle aerodynamics. As automotive vehicles are complex in design, the use of simplified bodies to isolate and consequently understand the flow physics has become prevalent with time, with the aim of identifying opportunities for drag reduction.
Previous research has, for the majority, concentrated on minimising the drag created by the rear end of vehicles, as this can account for up to 70% of the total vehicle drag, as found from a simplified model by Ahmed et al. [2]. Fewer publications have focused on wheel and wheelhouse flows although these have been shown to contribute between 20% and 40% of a passenger vehicle’s overall drag and strongly influence the rear-end drag, as stated by Hucho [3], Wickern et al. [4] and Elofsson and Bannister [5]. Wheels in isolation have been sufficiently documented, incipiently by Morelli [6] to more recently by Croner et al. [7]. Hence, the importance of rotation and ground contact on the pressure and velocity distribution over the wheel has thus been well defined, as shown by Morelli [6], Stapleford and Carr [8], Cogotti [9] and Rajaratnam and Walker [10]. However, the inclusion of wheels on vehicles located within housings adds a significant amount of complexity to the aerodynamic behaviour of wheels due to the interaction of vortex shedding, swirling motion and strong pressure gradients within the cavity [11].
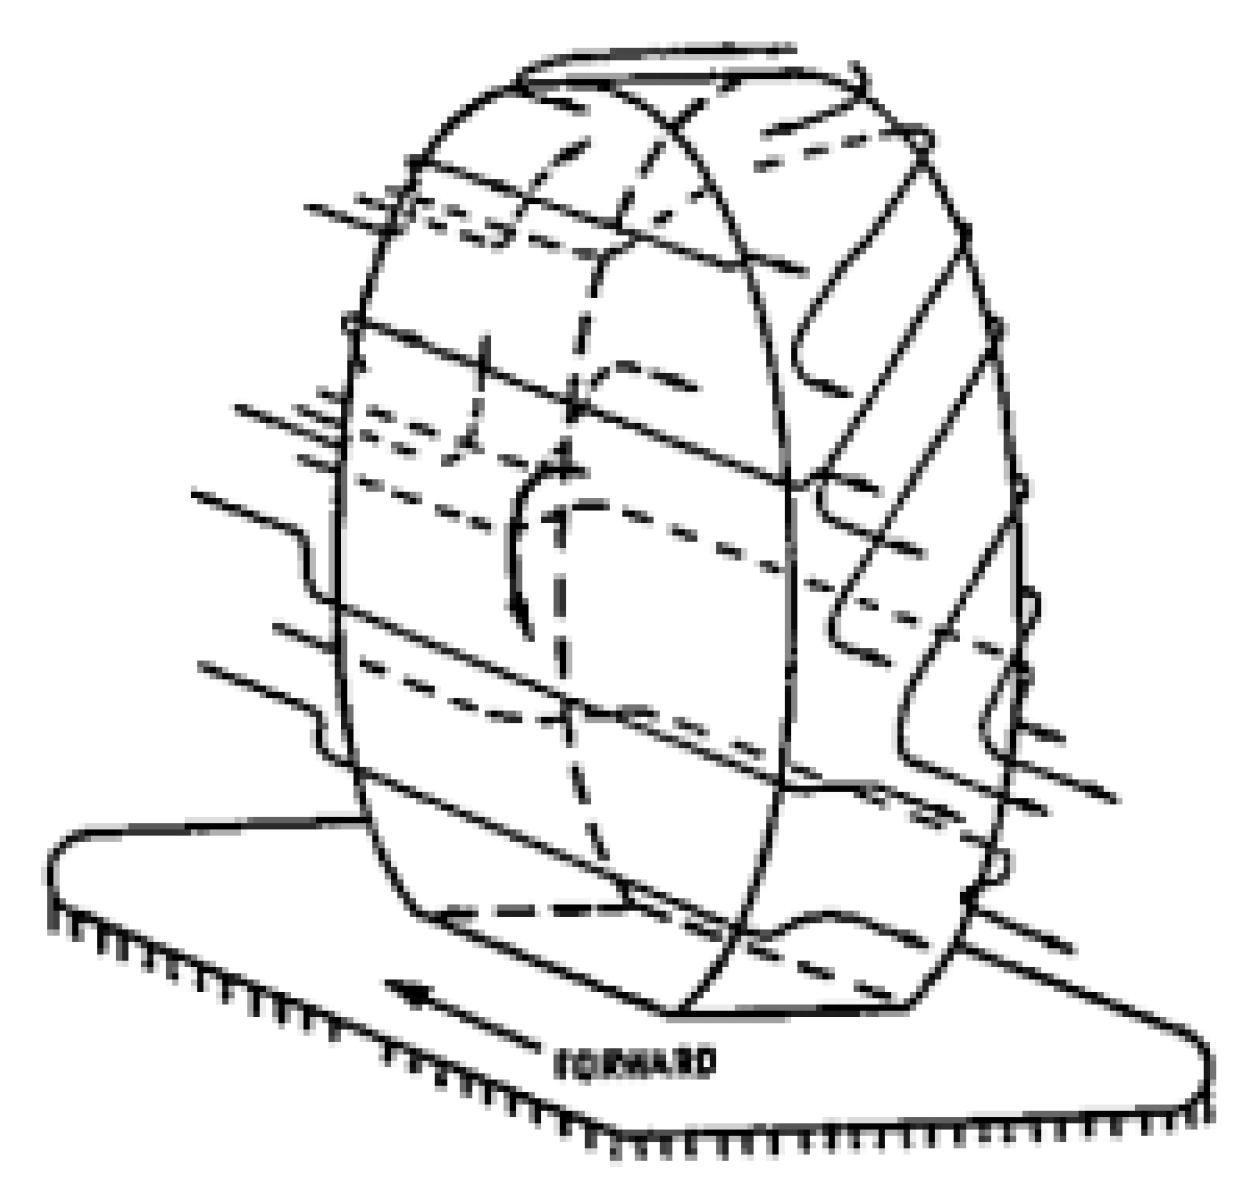
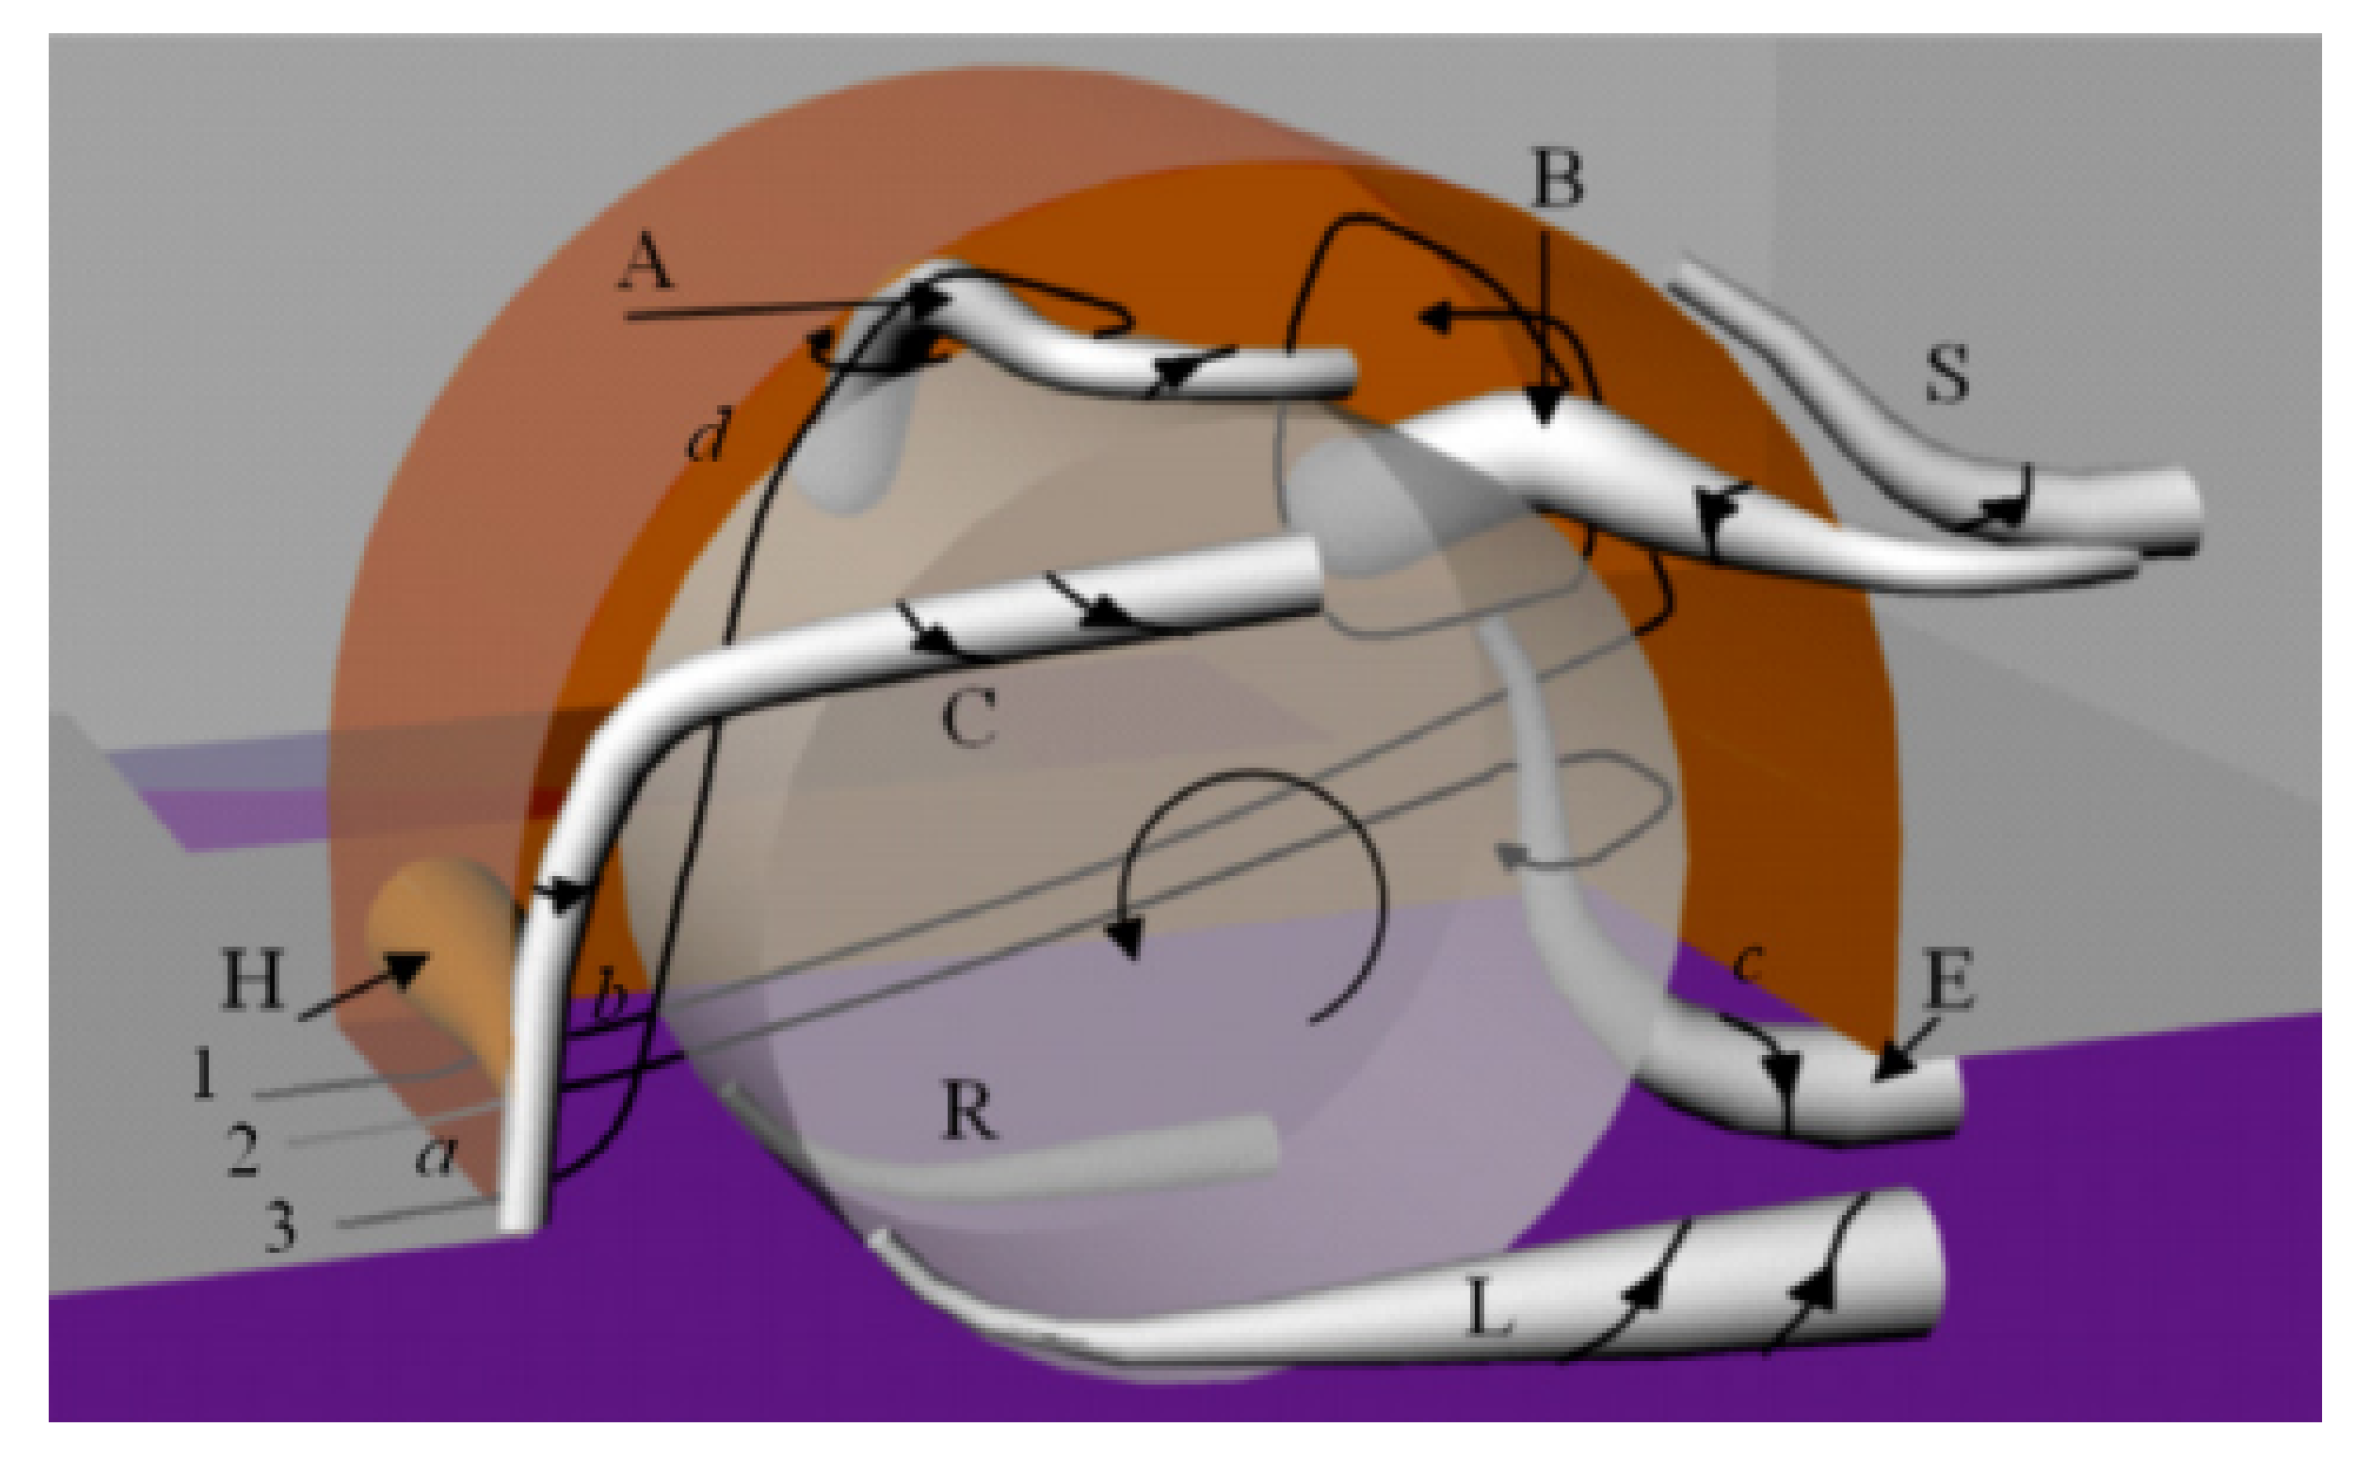
Oswald and Browne [12] were some of the first to study the flow field around a full-scale shrouded road tyre as a subsidiary investigation on quantifying tyre power loss. Hotwire anemometry was used to measure mean and fluctuating velocity with a wool-tuft grid fitted around the wheel to visualize the local flow behaviour over a range of Reynolds numbers. As a result, the schematic shown in Figure 1 was constructed, and it was found that the flow field was generally independent of vehicle velocity.

Figure 1.
Tyre airflow schematic by Oswald and Browne [12].
Subsequent tests by Cogotti [9] investigated a wheel, of fixed orientation, housed in a simplified, low drag “tear-drop-shaped” shroud. The rotation of the wheel was generated by internal motors with no contact between the wheel and the stationary ground plane. However, due to the issues evaluated previously on isolated wheels by Stapleford and Carr [8], developed from findings by Morelli [6], the gap between the rotating wheel and stationary ground plane was sealed to ensure a positive lift force was generated due to the contact of the ground with the wheel. It was found that both drag and lift increased when wheels were added to the housing design, as well as when the housing radius and depth were increased. Therefore, it was concluded that to minimise the forces exhibited by wheels and wheelhouses, the cavity volume should be minimised.
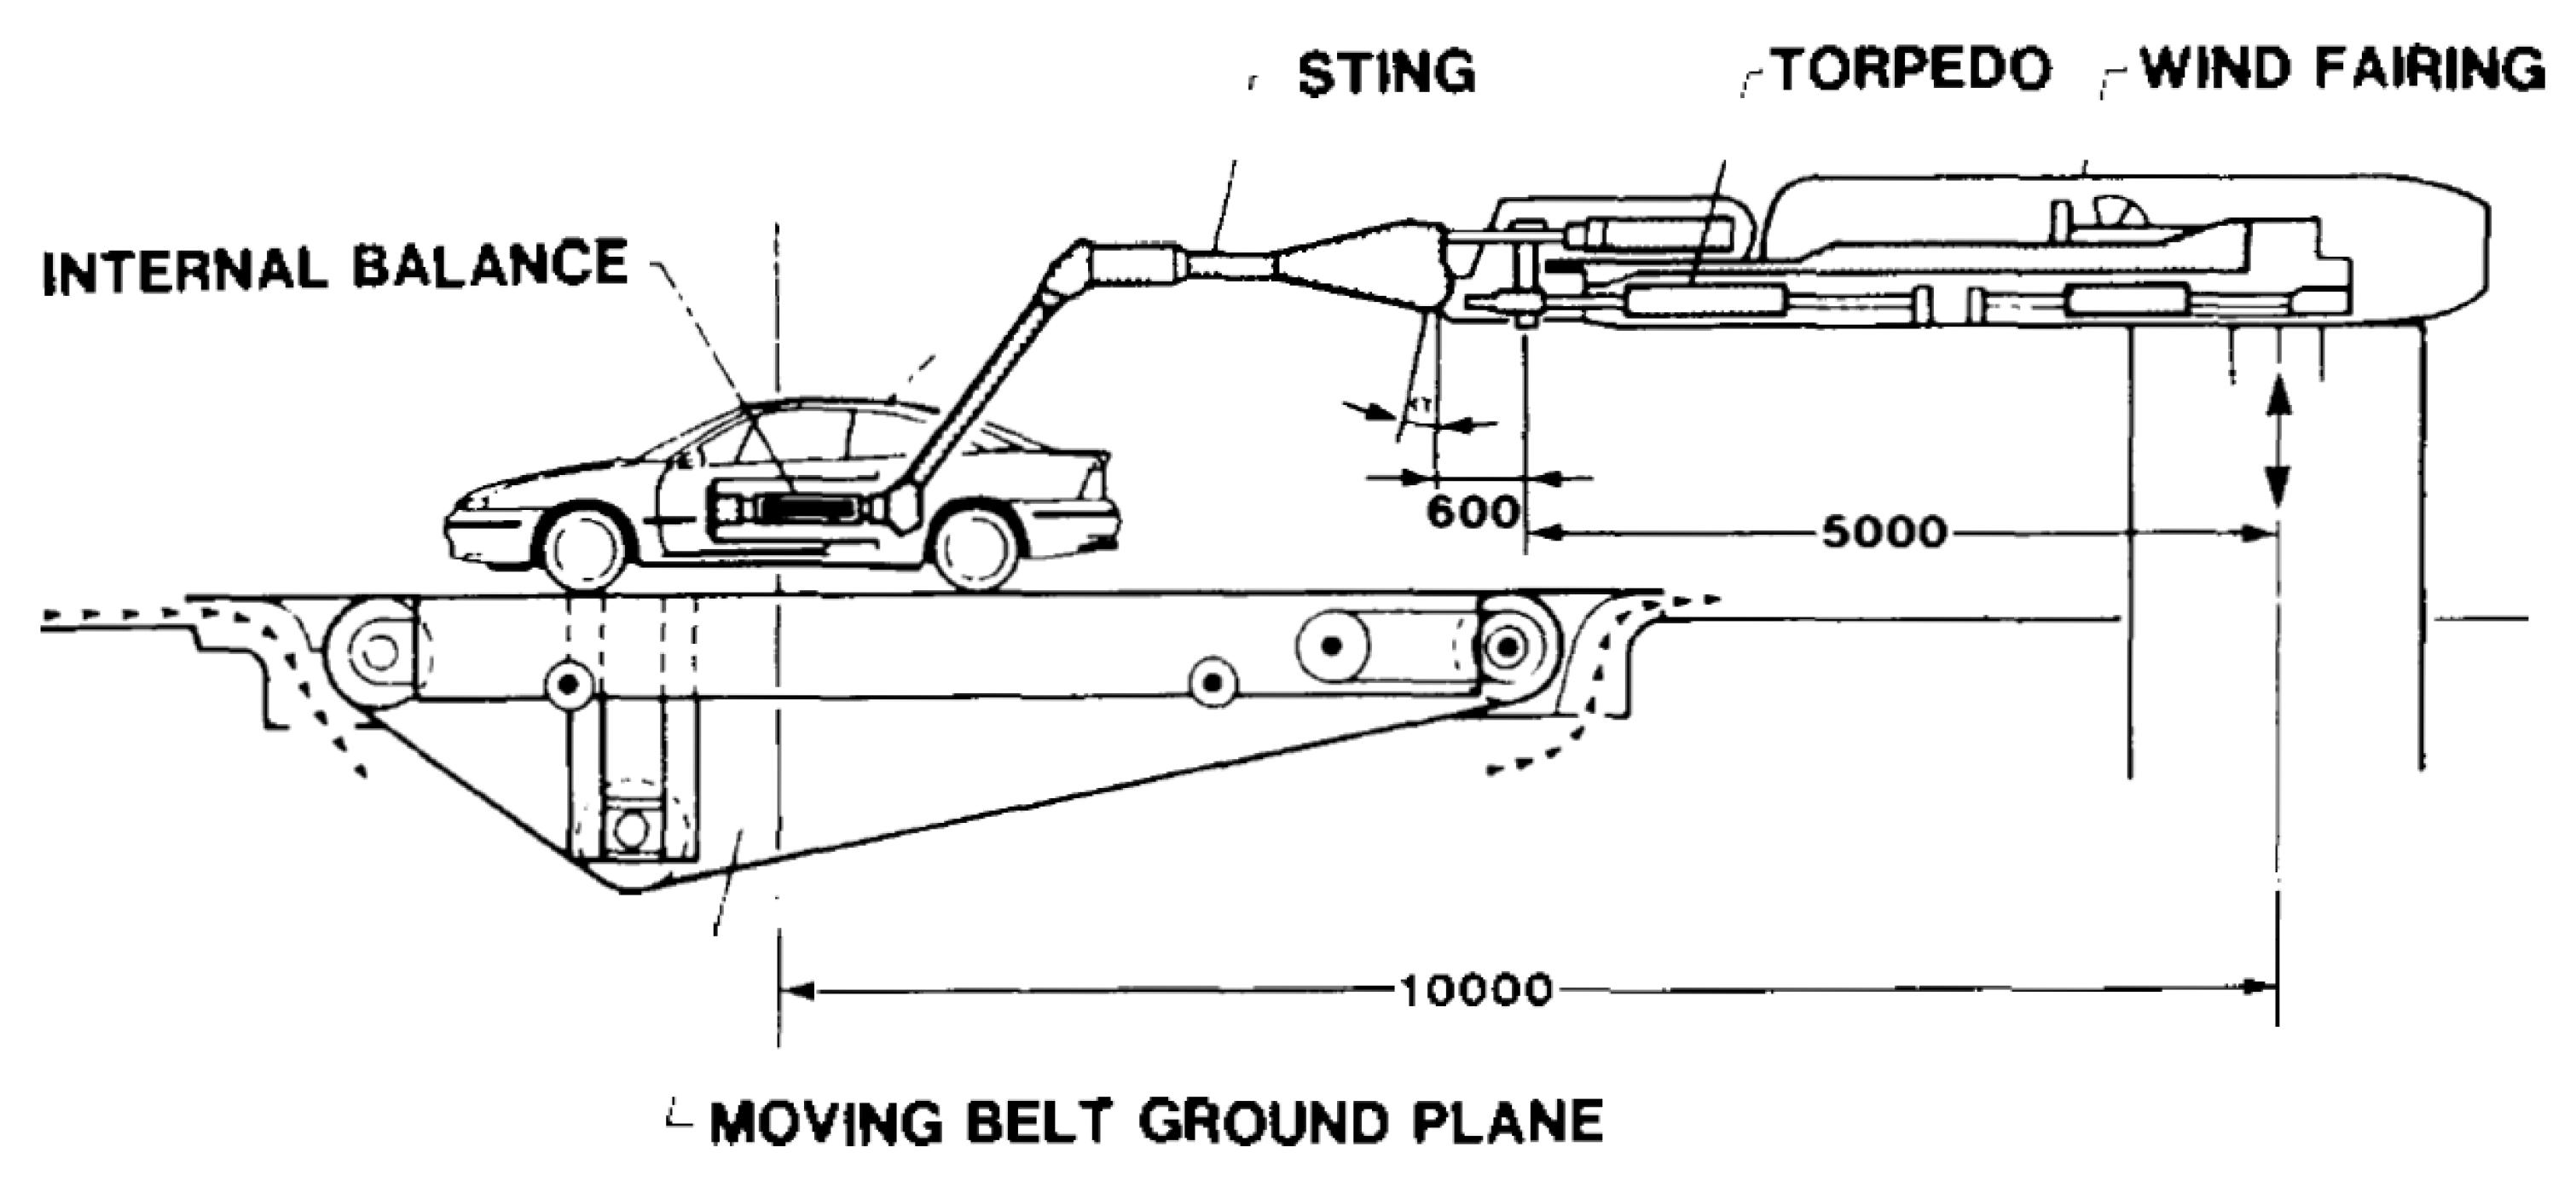
Mercker et al. [13] studied the effect of wheel rotation on the forces of a full-scale passenger vehicle in a wind tunnel using a moving belt system. Suspended by a sting, an internal balance was fitted within the Opel Calibra to obtain the relative force measurements, as shown in Figure 2. The wheels were mounted so that they could be lifted sequentially, allowing individual forces for each wheel to be calculated independently. A wake rake was also used to calculate total pressure deficit along a plane behind both front and rear wheels. It was found that regardless of the vehicle configuration, a drag increase was obtained due to the addition of wheels, but was reduced again upon rotation. Overall, lift was shown to increase (or where applicable, downforce was reduced) for rotating wheels and attributed to the upwards shifting of the stagnation point reducing downwash, increasing base pressure and thus constraining the lower bound vortex structures. The lowest drag recorded was for the half open wheelhouse configuration for which the upper vortex was suppressed, and it was also shown that when taking into account the change in frontal area caused by increasing the tyre width, only an extra was exhibited when comparing the widest to smallest tyre.
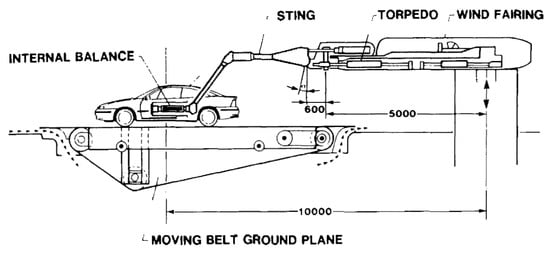
Figure 2.
Experimental setup by Mercker et al. [13].
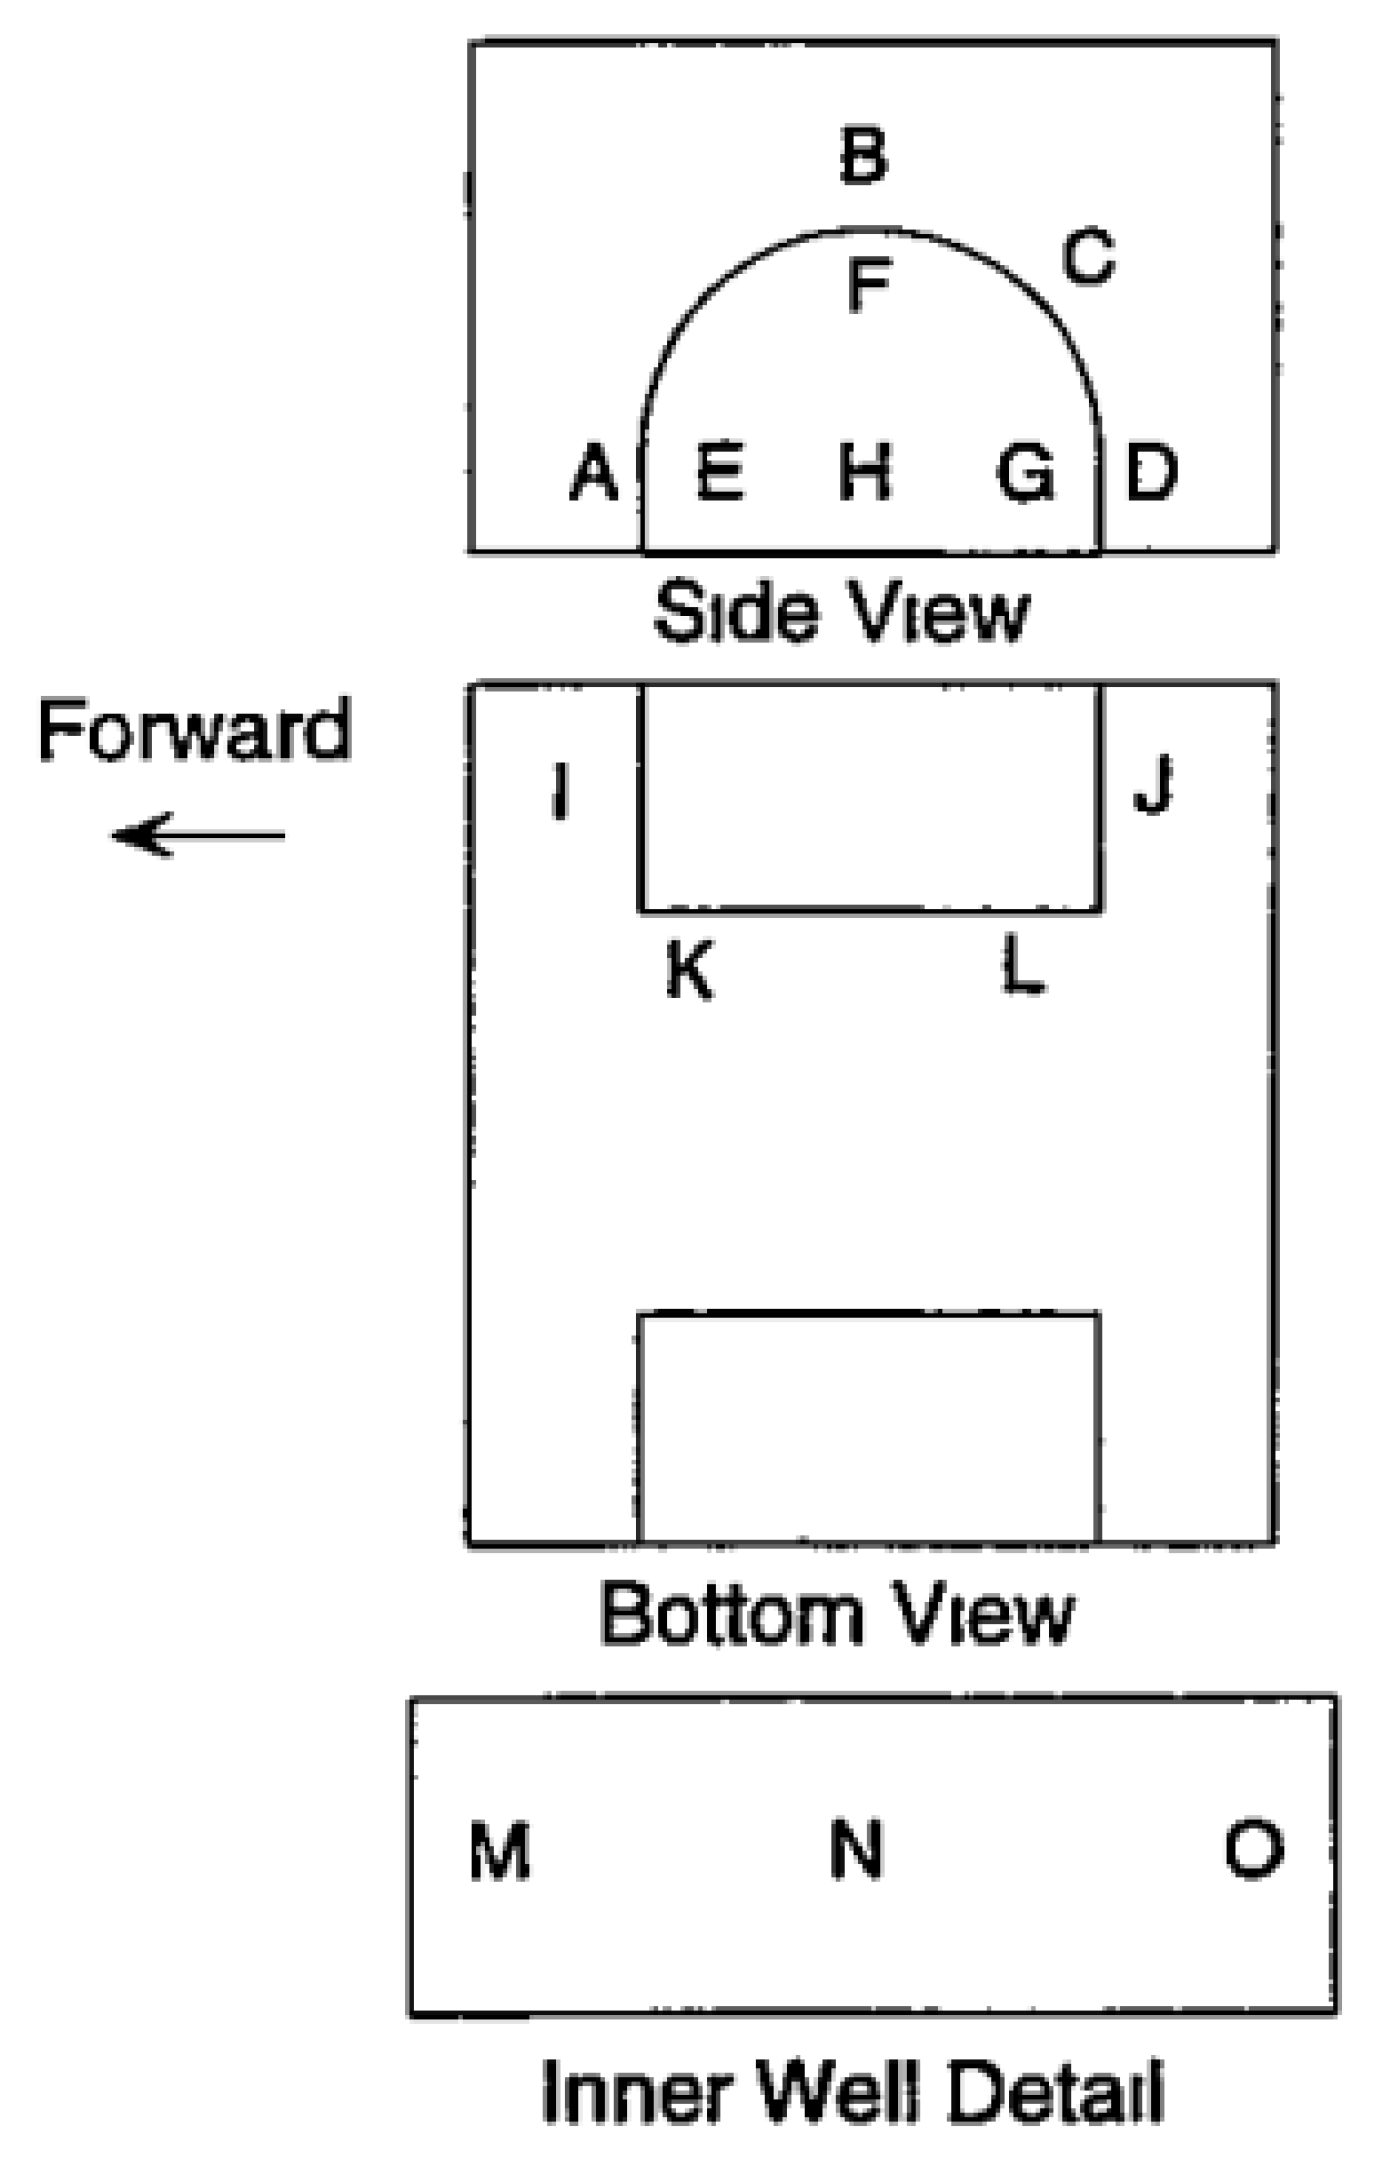
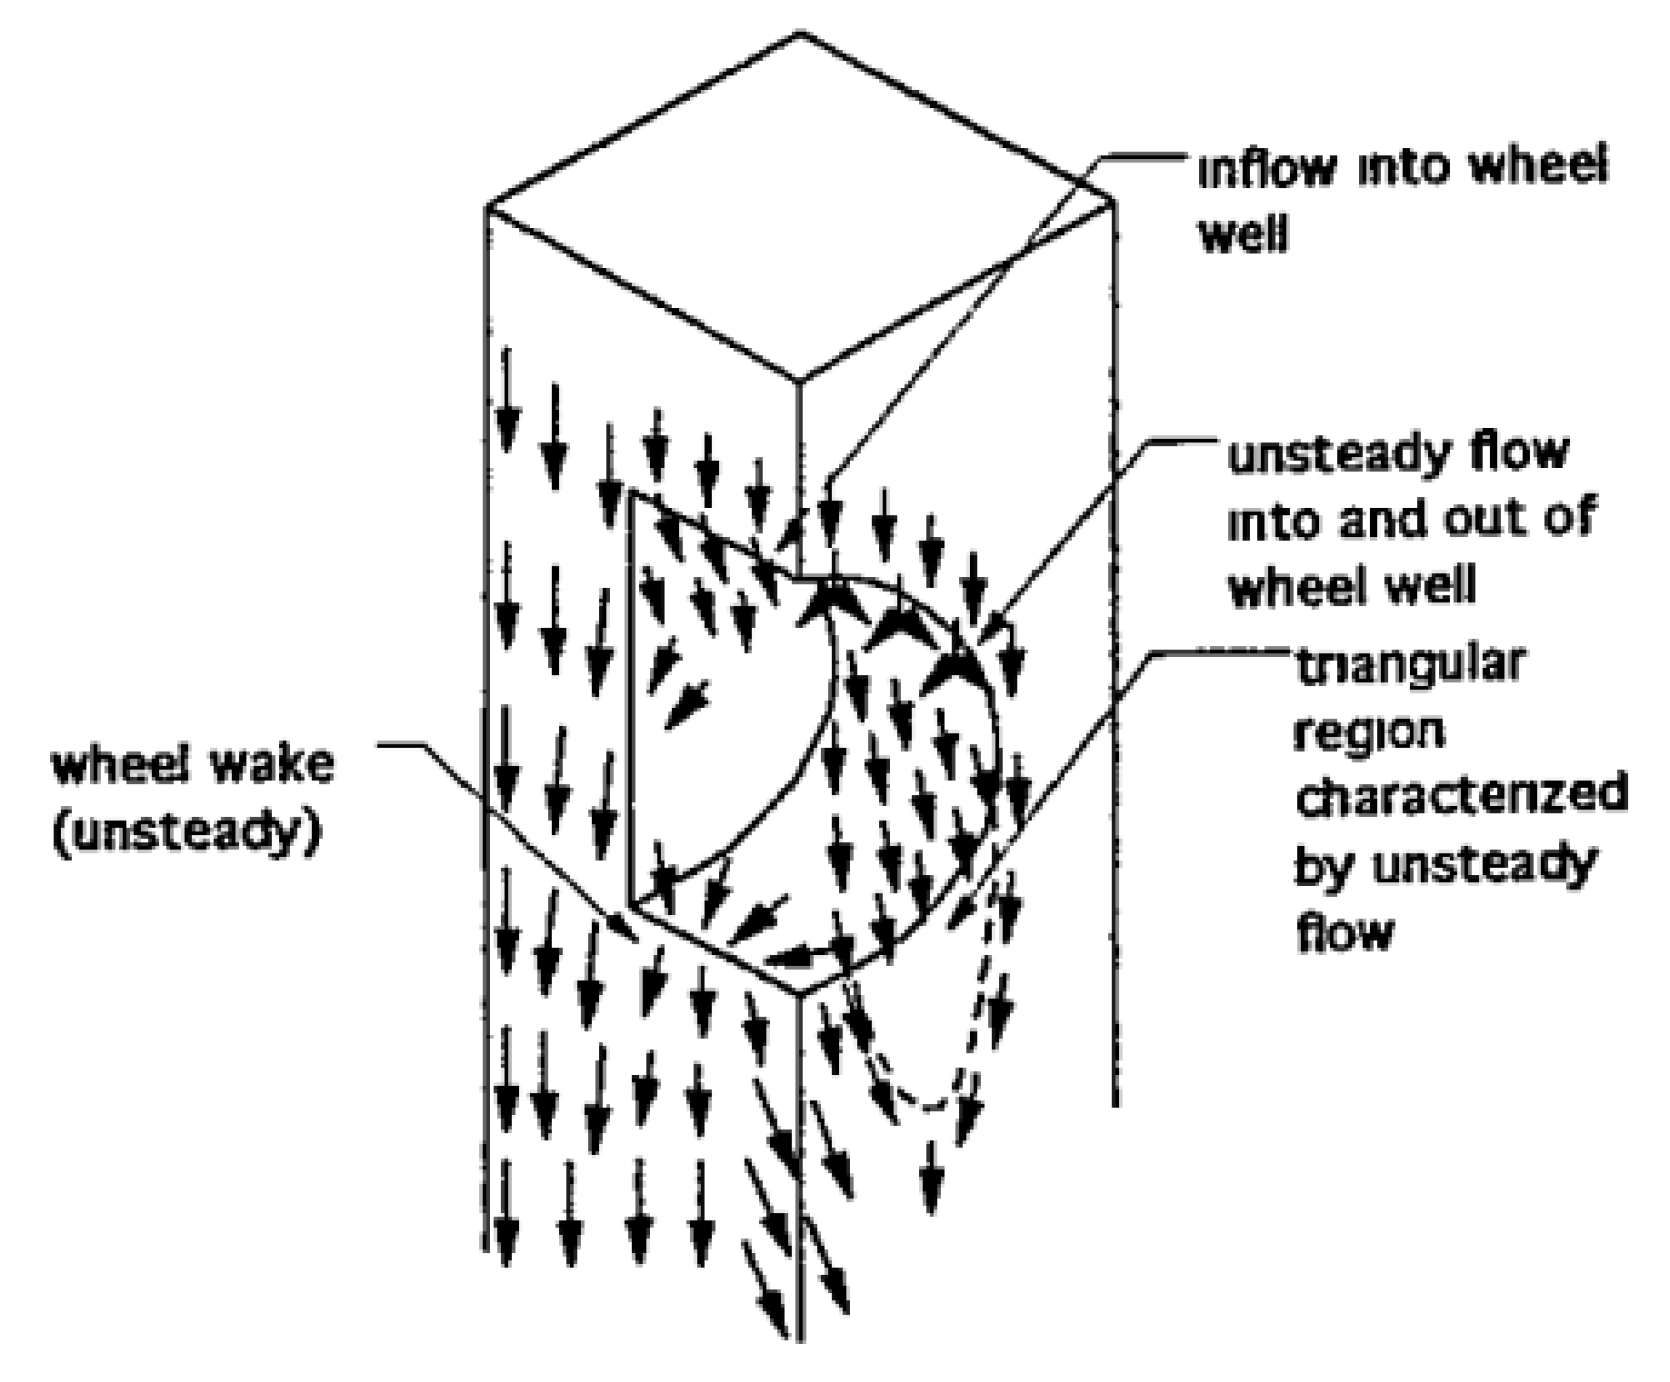
Fabijanic [14] continued the research by conducting tests using a simplified automotive body, the design of which has now become the basis for a standard test model. The work analysed the influence of cavity parameters such as radius, height and depth on model forces and flow behaviour. All tests were performed using a rotating wheel on a moving ground plane, where the wheel was mounted separately by cantilever struts secured to the wind tunnel walls. Forces and pressure measurements were taken for the housing; however, the accuracy was low due to issues controlling the model setup. Tests using surface oil flow visualisations and tufts showed that the flow was very unsteady within this region. To illustrate this, Figure 3 and Figure 4 display the locations of the cavity region and a front view of the general surface flow, respectively.
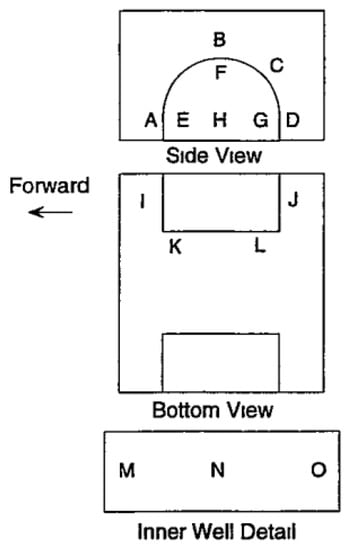
Figure 3.
Cavity region labels by Fabijanic [14].

Figure 4.
Surface oil flow visualisation by Fabijanic [14].
From these images, one can see that most of the inner cavity flow is from the high-pressure fluid originating from in front of the wheel. Airflow between Regions A and B alternately feeds into and exits the housing. The general cavity flow is also shown to exit around the side and rear sections, Regions B–D. A mean flow originating from H is displayed to travel up and over the wheel, exiting also between B and D. This collective region was seen to be highly unsteady, as well as the wheel wake region located around J. It was postulated that if this highly unsteady flow could be stabilized, a drag benefit could be obtained. Mean pressure measurements taken from within the wheel arch and on the outboard side of the wheelhouse showed that the jetting from the rotating wheel, as defined by Fackrell [15] and Fackrell and Harvey [16], interacting with the underbody flow was the reason for an increased lift. Thus, it was found that as cavity depth increased, lift decreased to a minimum as the added area allowed the fluid jet to flow up into the cavity instead of interfering in the underbody flow, but then began to increase again, contradicting the linear increasing volume and lift relationship found previously by Cogotti [9]. Drag was found to be more dependent on wheelhouse radius, so as radius increased, so too did the drag. The wheel forces however were shown to remain fairly consistent throughout testing. Yawed flow ahead of wheel was found to be greater for shallower cavities. This insinuates that the deeper cavities aided in reducing the effect of blockage generated by the wheels. It was concluded that the agreement of the results from this sub-scale model when compared to other full-scale investigations was excellent, proving that it was possible to simulate the relevant flow trends of a shrouded wheel accurately with a simplified model. It was also stated that both the rotation of the wheel and movement of the ground plane were needed to generate the correct jetting vortex effect, as this feature is not evident in a stationary wheel and ground plane configuration; however, it has also been found that general flow fields can also be obtained with just the rotation of the wheel in place [10]. The high level of turbulent motion found in this study also demonstrated that when simulated, a numerical model capable of generating this complex unsteady data is essential.
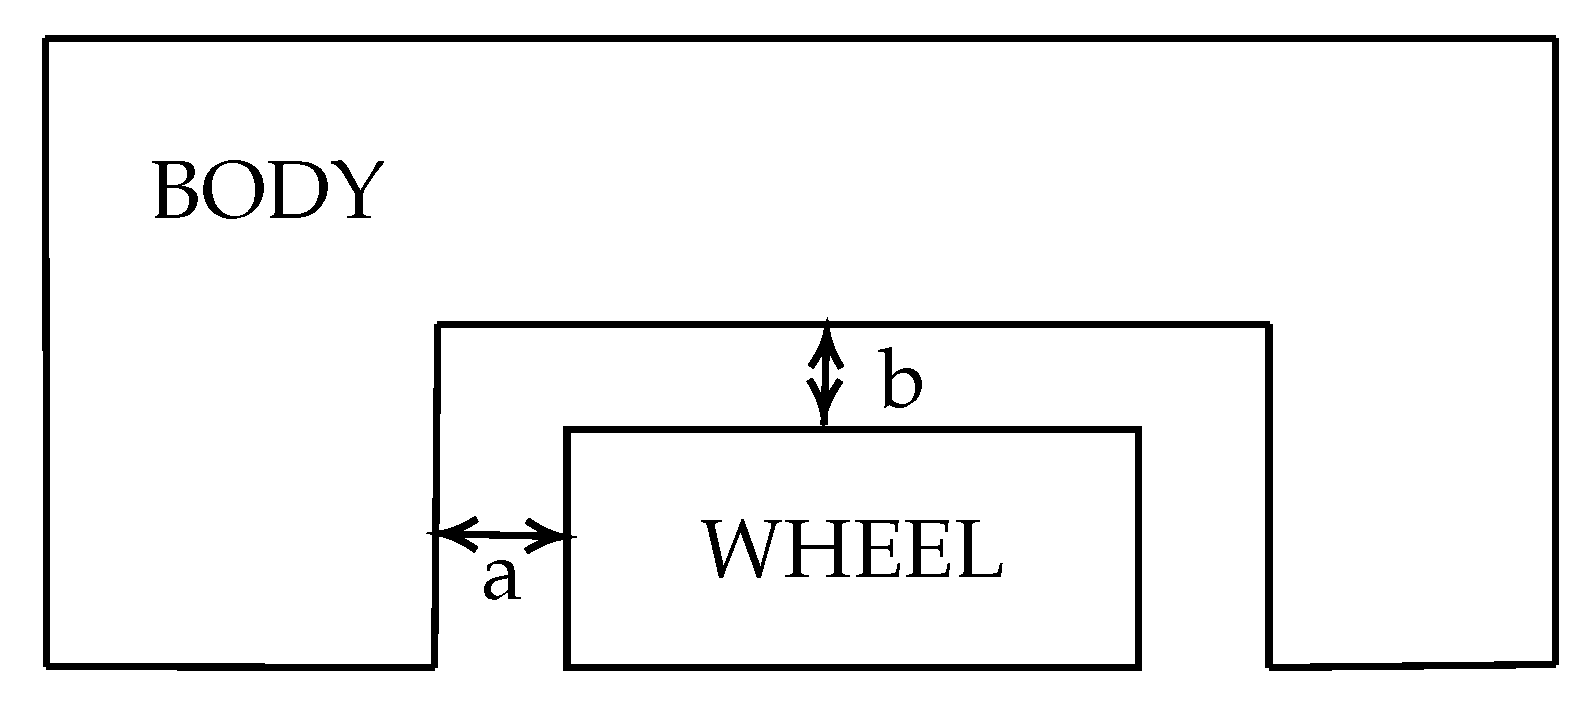
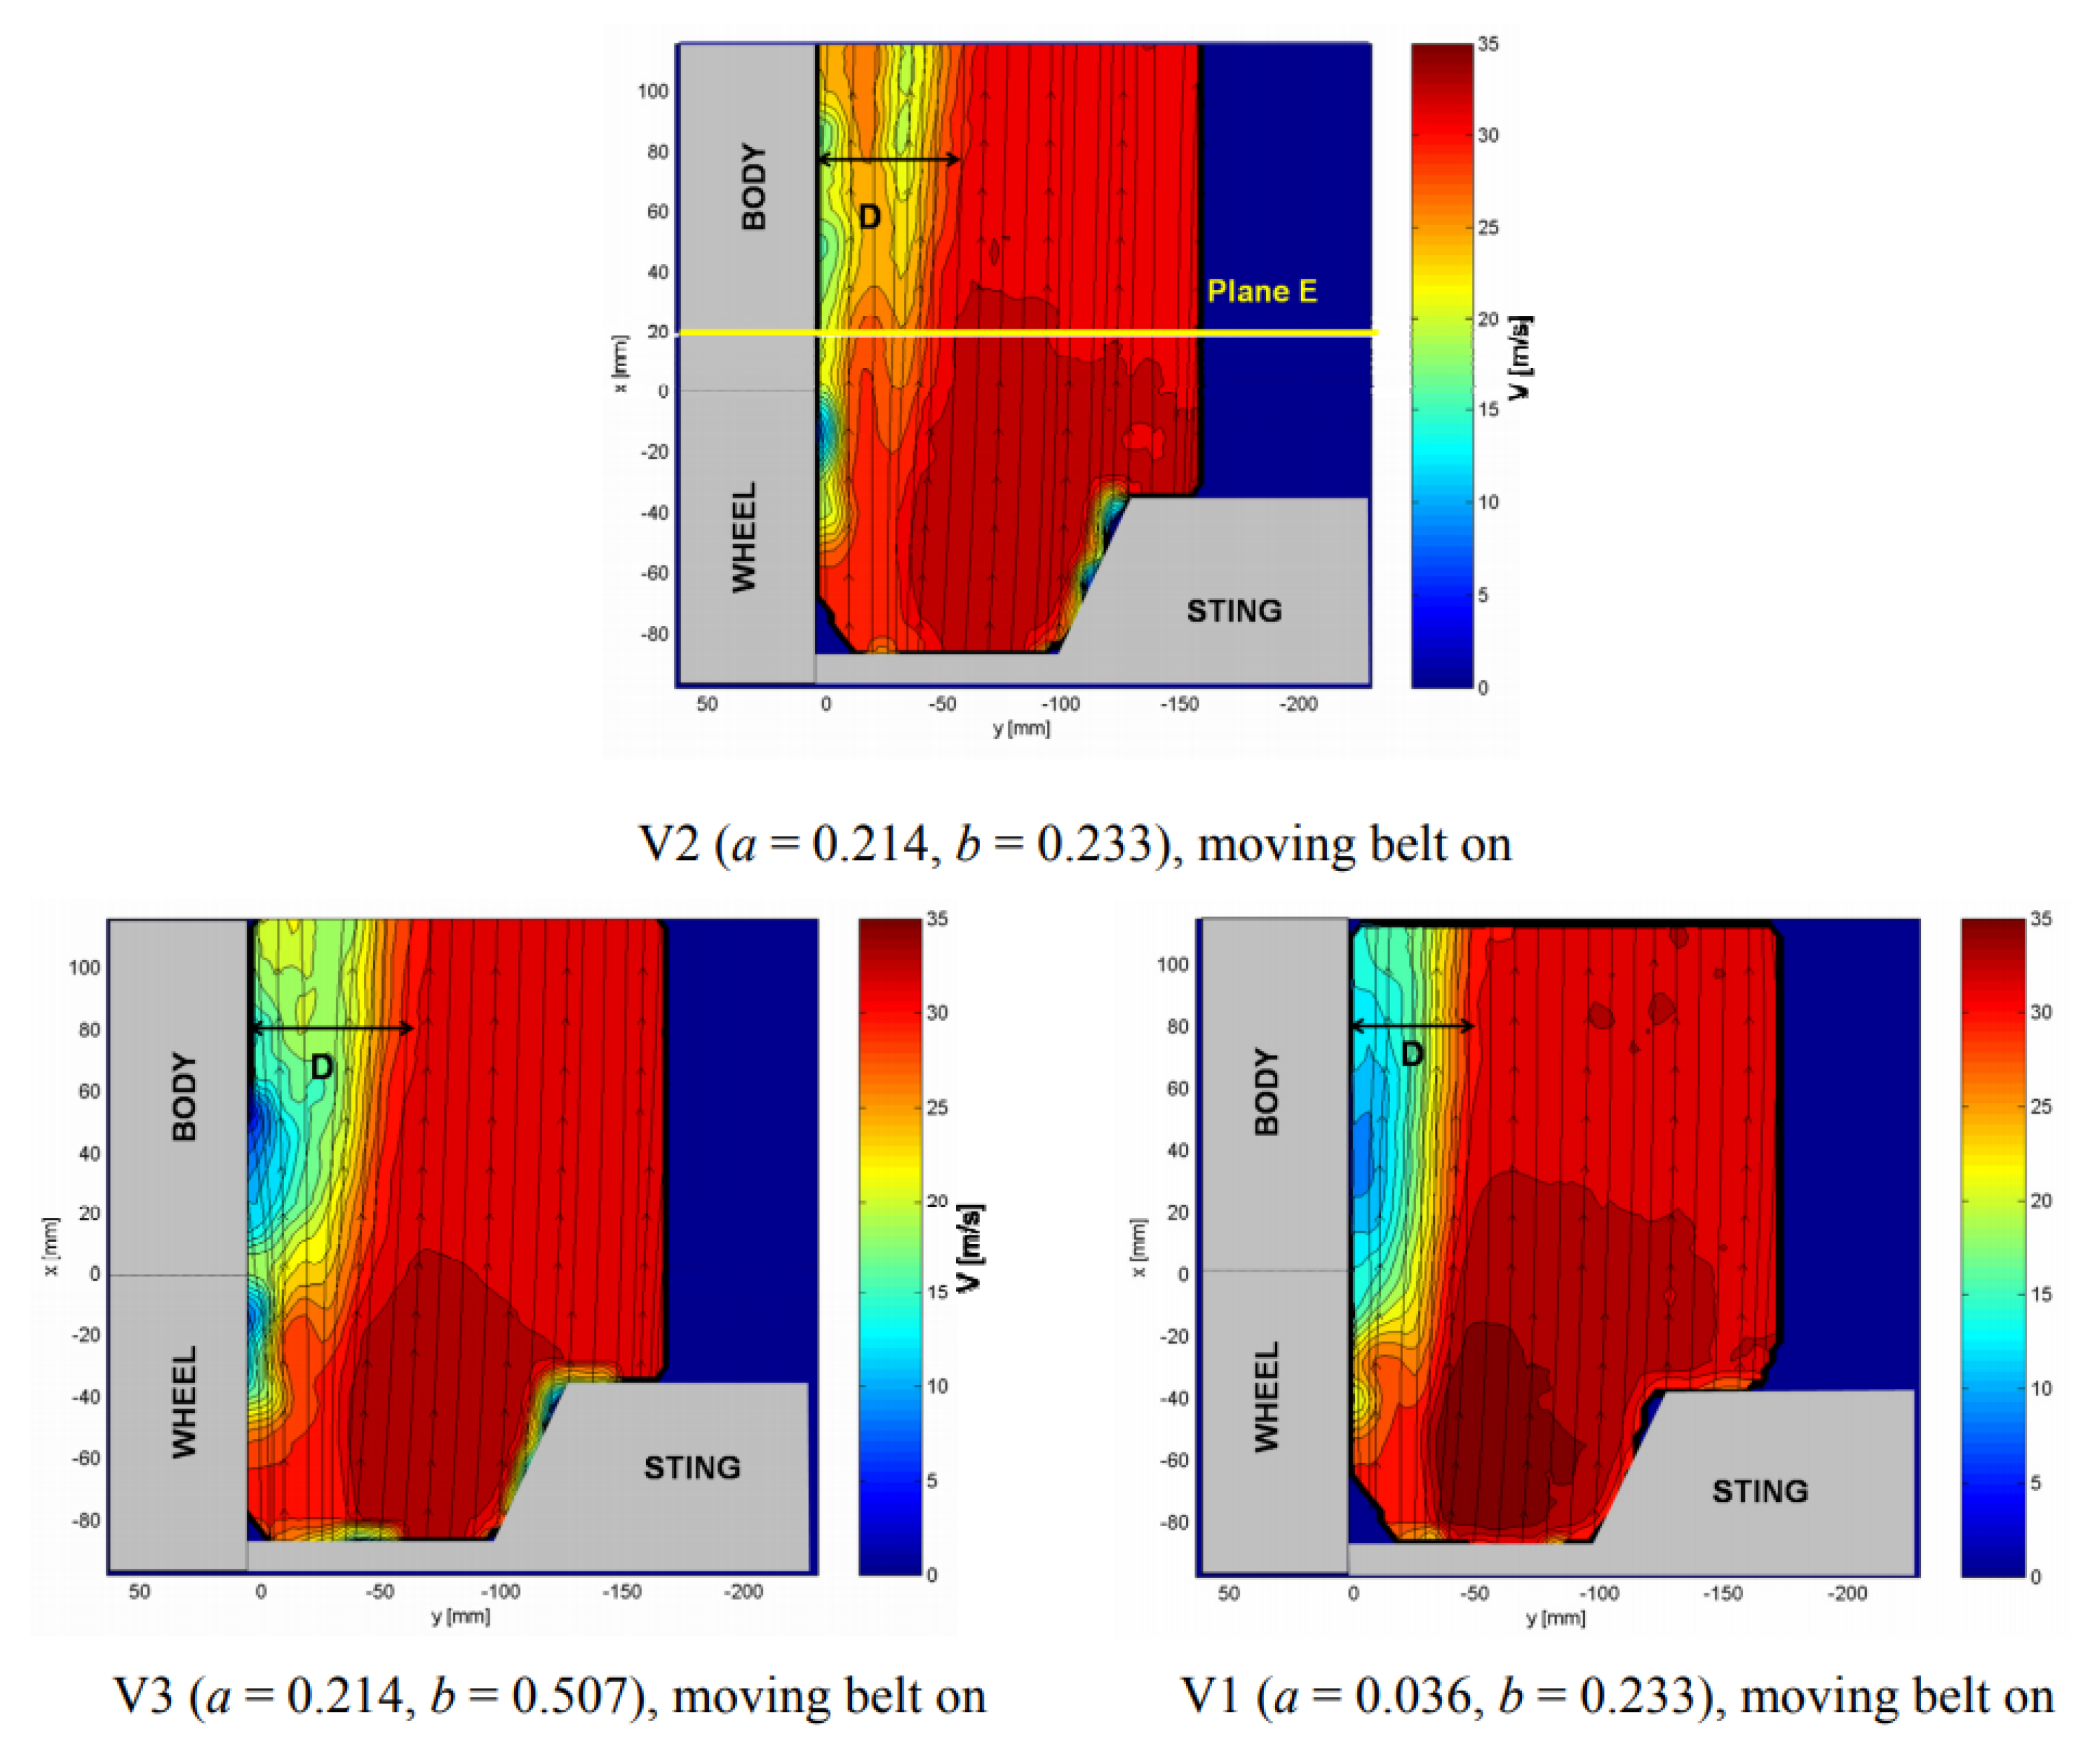
Cazat and Gilliéron [17] conducted tests using a different simplified quarter (front corner) car model at a scale of 2/5, displayed in Figure 5 and Figure 6, that was mounted from the roof separately to the strut mounted wheel and located on a moving ground plane. 2D PIV and aerodynamic force data were obtained for the various models, which were designed to test the influence of housing parameters such as radius and depth. The results obtained showed that once again, drag increased with cavity volume, corroborating to Cogotti [9], and that it was mostly dependent on wheelhouse radius, which is in agreement with Fabijanic [14]. The PIV images (Figure 7) showed that as cavity depth increased, so too did the side wakes’ lateral dimensions, which can be directly related to the increased drag. The height of the wake was also shown to increase with increasing radius, but decreased with added depth. The depth increase induced only a slight magnification of the wake width, but a decrease of the wake height was exhibited, which was used to explain the slight drag decrease for this configuration. Cross-plane images illustrated that, as expected, the jetting phenomena [15] occurred with higher strength when the wheel was rotating. Finally, the wheel sting was shown to disturb the flow with the creation of extra vortices, and so, it was suggested that a new experimental setup was needed for future studies.
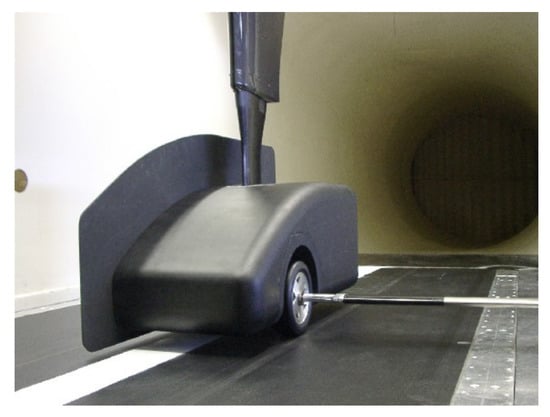
Figure 5.
Experimental model by Cazat and Gilliéron [17].

Figure 6.
Cavity dimensions [17].

Figure 7.
Top view horizontal plane: velocity contours and streamlines in configuration of volumes V1, V2, and V3 with the rotating wheel by Cazat and Gilliéron [17].
Geometries similar to the Fabijanic [14] model were also tested numerically by Regert and Lajos [18] and Skea et al. [19], whilst one of the first simulations involving a housed rotating wheel was performed by Axon et al. [20]. Both Axon et al. [20] and Skea et al. [19] used RANS calculations with the RNG k- turbulence model to simulate the main features found around this model. Axon et al. [20] compared the pressures and forces, which showed some good agreement with the test data, and this was also the case for Skea et al. [19], albeit there were slight discrepancies with the pressure coefficient separation and reattachment points. This was attributed to the highly unsteady behaviour found within this region. Regert and Lajos [18] used a range of turbulence modelling for both RANS and uRANS calculations. Validation and justification studies were performed using both the isolated wheel, as well as the Fabijanic [14] shrouded wheel. All simulation mesh sizes were below four million, and the total temporal time period for the uRANS cases was based on 70-wheel diameter flow-through time when computed with the freestream velocity. Not much comparison could be made between the experimental results [14] and those found in this study due to the unreliability in the experimental setup [11]; however, the results found were as follows. The rotation of the wheel was shown to have a relatively small effect on the structure of the flow field provided the gap between the wheel and cavity was larger than the thickness of the boundary layers. It was also found that the increase of total drag force was due to the increased force exhibited by the wheel or via the interaction of the wheel and underbody flow. The increase of lift force, however, was attributed to the lift acting upon the wheel altering the flow around it. It was also shown that forces and flow structure changed the most when the floor opening was closed, and only slightly when the side opening was closed, meaning that cavity flow was dominated by underbody flow. Vortex structures were detected using analysis of the Q criterion, the second invariant of the velocity gradient tensor that illustrates the domination of the swirling flow [21]. Isosurfaces of small total pressures were also used to pick out vortex structures due to the low total pressure regions inside them. Using these techniques, the following proposed vortex structure schematic was generated; see Figure 8.

Figure 8.
Vortex skeleton model of the wheelhouse flow field by Regert and Lajos [18].
The proposed formation of the vortex structures shown in Figure 8 can be described as follows:
- Vortex :
- -
- These are longitudinal vortices that correspond to the lower bound lateral jetting structures formed by the impingement of the flow at the front of the contact patch [22], as found around an isolated wheel.
- Vortex A:
- -
- A product of the interaction of airflow entering the wheelhouse and the moving lateral surface of the wheel, where hypothesised by Fackrell [15] and shown experimentally more recently by Croner et al. [7] for an isolated wheel, the flow mixing with the fluid film moving in the opposite direction of the freestream results in boundary layer separation near the top of the wheel.
- -
- The arch-shaped vortex found for an isolated wheel [7,23] no longer exists.
- Vortex B:
- -
- Results from flow entering the wheelhouse from the leading edge, which is then entrained by the wheel rotation, recirculating inside the wheelhouse and leaving from the rear upper area.
- Vortex C and S:
- -
- Caused by boundary layer separation over the front and rear edges of the wheel arch.
- Vortex E:
- -
- Originates from the flow entering at the front of the wheelhouse between the wheel and inner wall, impinging on the downstream part of the wheel arch and then stretched down towards the underbody.
- Vortex H:
- -
- Generated by the recirculation of the separated flow at the front of the wheelhouse.
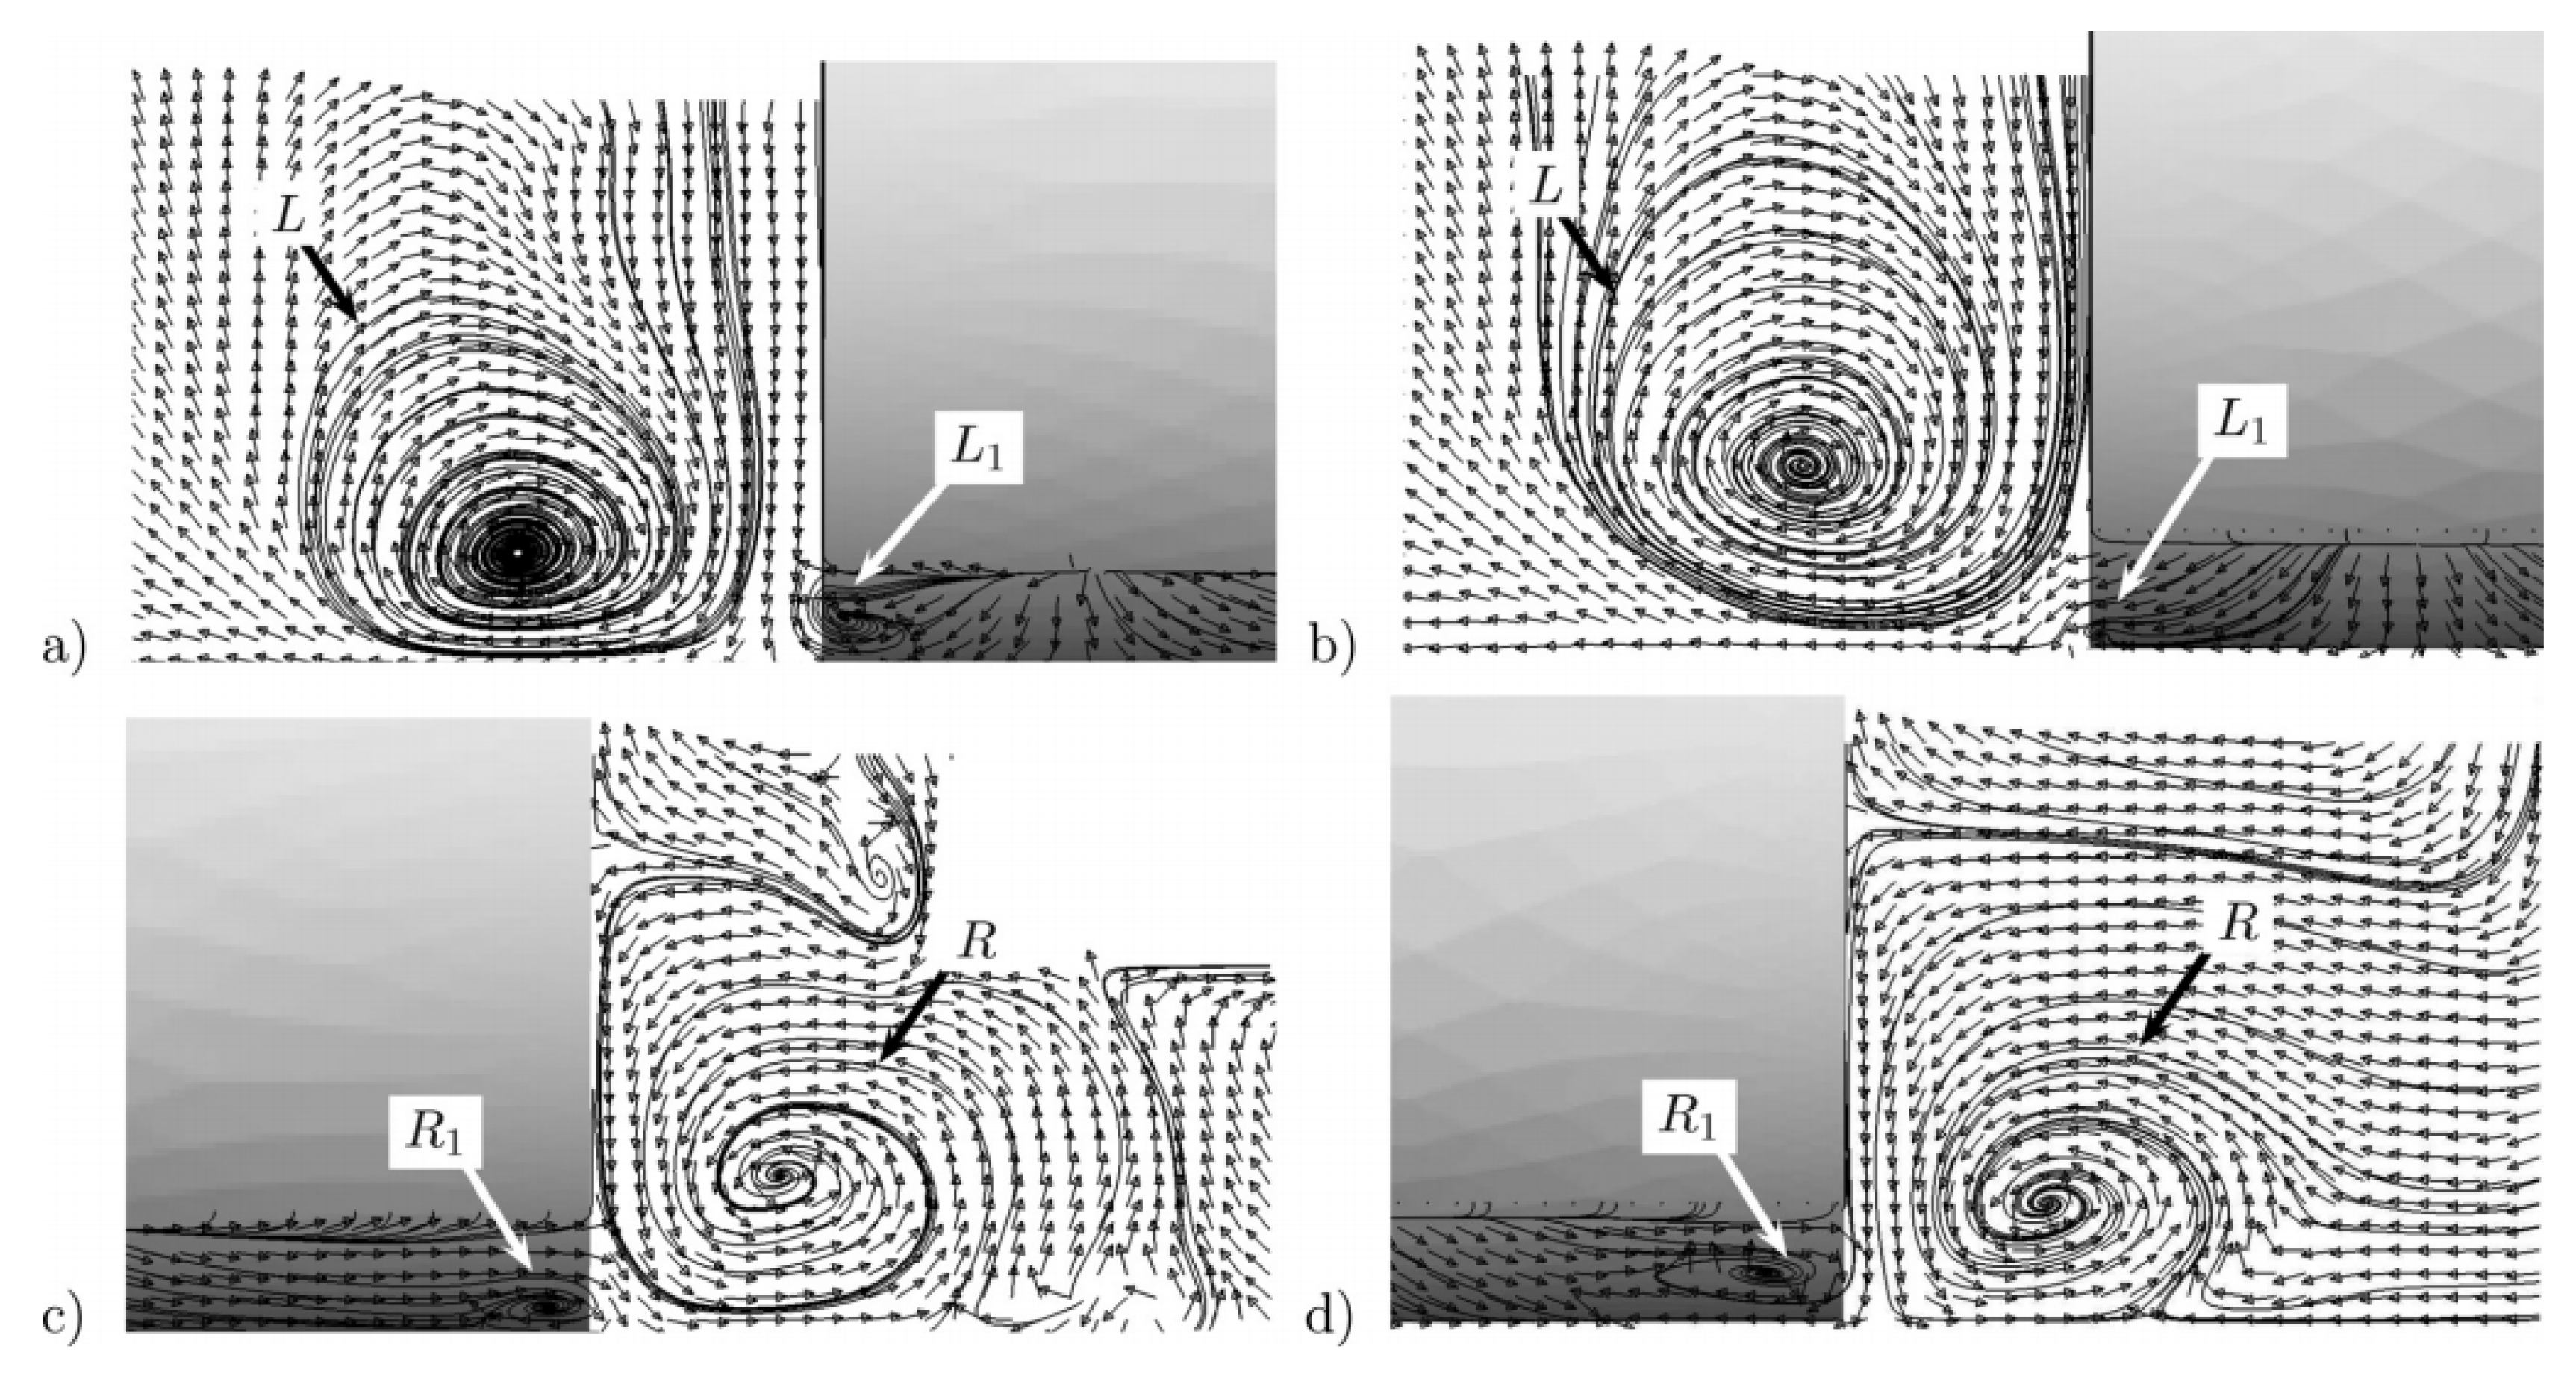
Consequently, Krajnovic and Fernandes [11] used LES simulations to further explore the flow features around the Fabijanic [14] model, but to a far finer degree than had been accomplished before. Results were compared to the original experimental results performed by Fabijanic [14], as well as those produced previously by Regert and Lajos [18]. An inlet velocity of 30 m/s was set, and the mesh sizes for both wheel widths tested were under 13 million cells. A time step size of s was used, giving a smallest mesh cell size-based CFL of approximately 1. Due to the unreliable test data [14], aerodynamic force coefficients were difficult to match; however, it was claimed that whilst this did not prove the incorrectness of the simulations, it did show differences in the setup. Figure 9 illustrates the differences (the addition of ) with the proposed theoretical model generated earlier by Regert and Lajos [18].
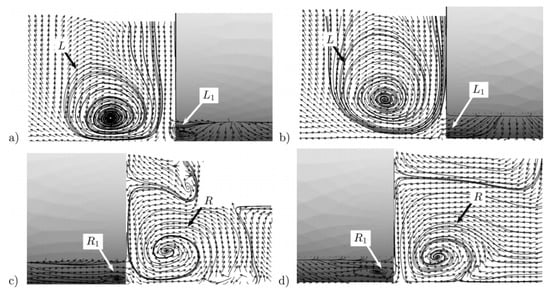
Figure 9.
Velocity vectors and streamlines in plane x = 20 mm behind the wheel centre. (a,b) Outside the wheelhouse. (c,d) Inside the wheelhouse by Krajnovic [11].
- Vortex :
- -
- The main pair () was found to be coupled with a smaller in magnitude, counter rotating, secondary pair () that was generated by the air entrained from the rotation of the wheel.
These smaller jetting vortices were shown to be counter rotating, but the order of those directions has been disputed in published literature. Cogotti [9] previously proposed that these vortices rotate in such a way that they lift the flow upwards and away from the ground and onto the wheel. On the other hand, Mercker et al. [13] hypothesised that they moved in the opposite direction, drawing flow away from the wheel and towards the ground. Krajnovic’s results [11] were congruous with those found by Mercker et al. [13], which were more recently shown experimentally with LDA measurements obtained by Knowles et al. [22].
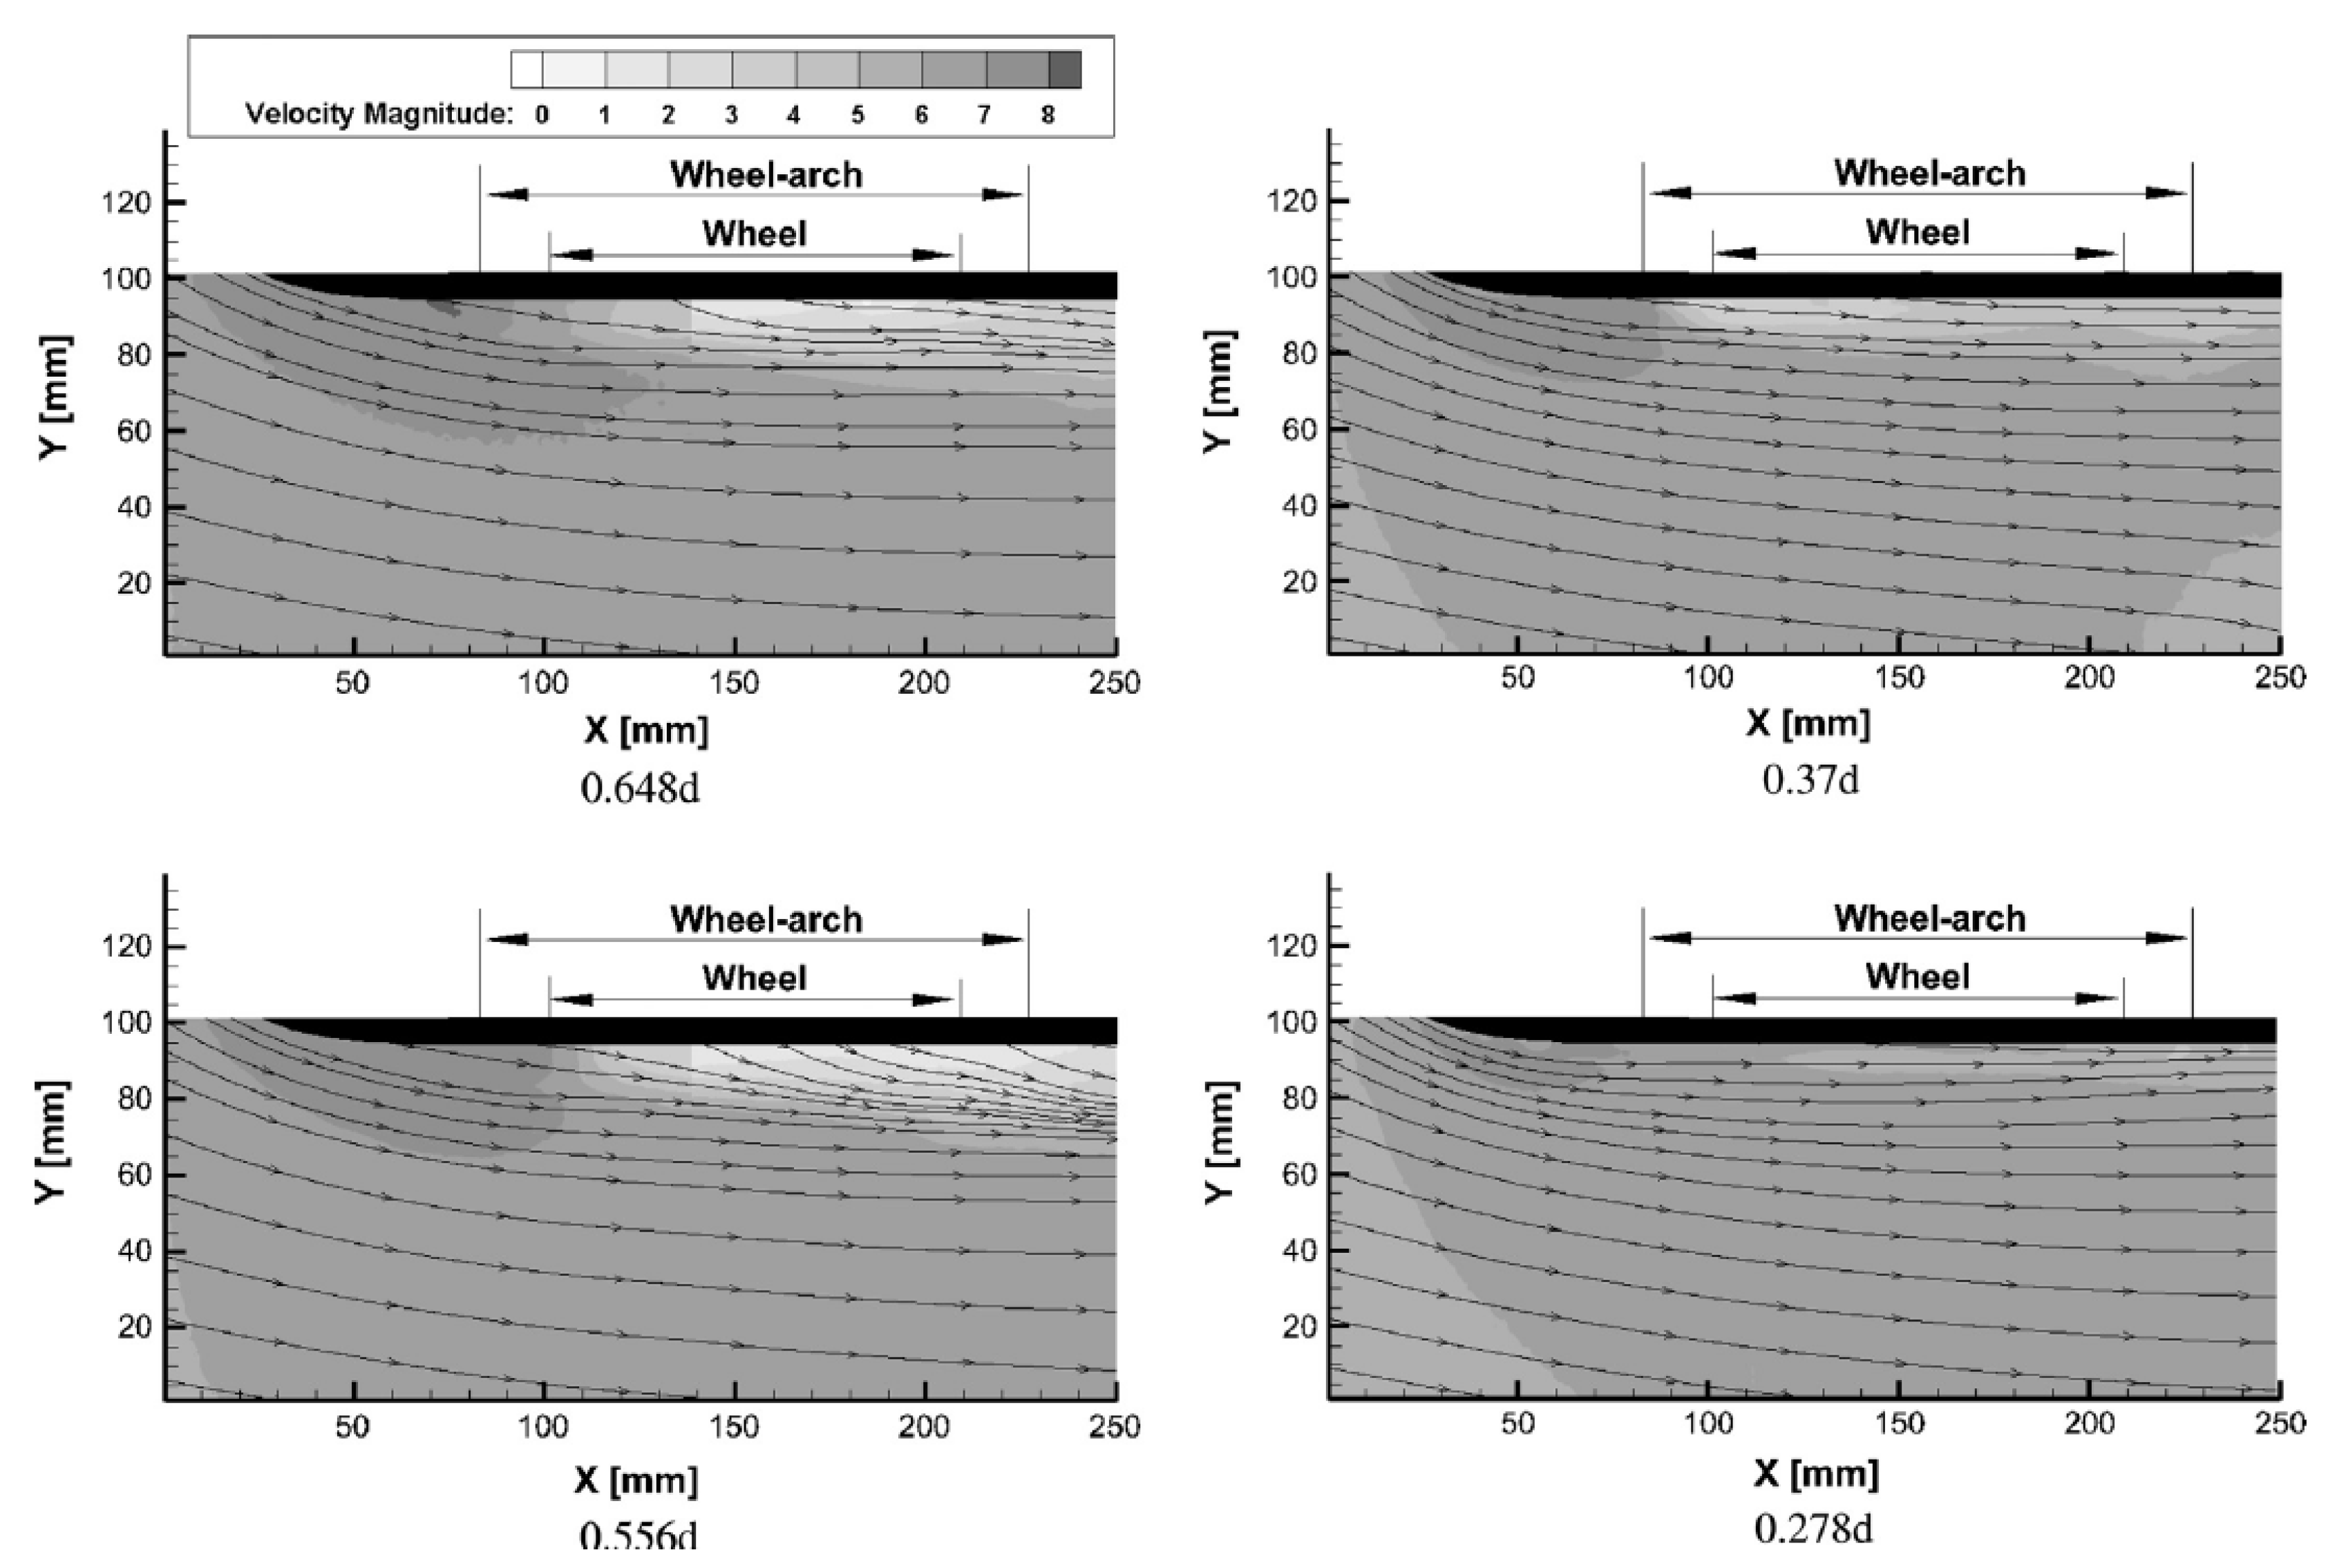
When testing a range of wheelhouse configurations, it was found that the lowest drag was measured when the wheelhouse was half open [13]. The reason for this was hypothesised as the suppression of the bound vortex shed from the upper part of the rotating wheel, where the outflow was at a maximum when the wheel arch was open. This vortical feature was first displayed by Fabijanic [14], computationally using RANS by Regert and Lajos [18] and later with PIV measurements performed by Gulyás et al. [24]. For the latter study [24], a PIV investigation of the rotating front wheel of an Ahmed body located on a stationary ground plane was presented. The contact patch between the wheels and ground plane was simulated by immersing the wheels into the ground plane by 3 mm. The free stream velocity was set to only 5 m/s, thus limiting the Reynolds number to below . This was done to allow for comparative studies to be performed using LES calculations; however, this is not representative of typical post-critical Reynolds numbers found around full-scale vehicles. This maximum outflow region was illustrated in the horizontal plane measurements, shown in Figure 10 at 0.648d and 0.556d, where the streamlines can be seen to be more deflected from the region beside the opening of the wheelhouse [24]. This occurred with the greatest effect between the top of the wheel and the highest point on the wheel arch curve. Moving down towards the horizontal centreline, the streamlines become more aligned with the side face of the model, as shown in Figure 10, 0.37d and 0.278d, indicating that the top of the longitudinal vortex was reached [24]. It was also noted the airflow slowed down when travelling downstream along the wheel, and this implies that the cross-flow originating from upstream of the wheel led to a loss of stream-wise momentum. Further down towards the ground plane, the viscous effects of the low Reynolds number used were also shown to affect the flow field, causing early separation along the wheel outboard surface. The stationary ground plane was shown to create a horseshoe vortex around the wheel that rotated in the opposite direction to the dominating longitudinal vortex originating from the jetting effect, as defined by Fackrell [15]. The turbulence intensity was also measured and not found to exceed 30% anywhere in the flow field. However, a high degree of turbulence was found in the region of maximum outflow from the wheel arch due to the mixing with the longitudinal freestream flow. The unsteadiness was shown to decrease between this point and the centreline of the wheel and increased again when regarding the space between the centreline and the ground plane.

Figure 10.
Horizontal plane streamlines with contours of velocity magnitude. Planes are measured from the centre of the wheel [24].
1.2. Objectives
The previous section collated and discussed the relevant papers that have been published in the past 30 years that utilised both experimental and, more recently, computational testing techniques, to evaluate the flow field around a wheel and wheelhouse structure. Generic models, such as the Ahmed body [2] or the Fabijanic model [14], are extensively used in research, as they allow the user to isolate and analyse particular attributes of the flow physics in detail, as well as being simple to manufacture. In the case of the Fabijanic model [14], it generates a satisfactory front wheel oncoming flow yaw angle when compared to real-world parameters, although it does not include the front overhang curvature. The importance of the front section geometry on the oncoming flow yaw angle was shown computationally with the PowerFLOW numerical work by Wittmeier et al. [25]. It was found that the more realistic model produced a data trend and flow field that better matched those found for a full vehicle simulation. Other computational works presented have also either been simulated using RANS or low Reynolds number LES, which are either not suitable for the complex, unsteady, separated flows [26] found within and around wheelhouse structures or relevant for full-scale, post-critical flow regime analysis. Hence, this paper focuses on:
- Further improving the understanding of post-critical front wheel and wheelhouse aerodynamics. This includes:
- -
- The design, manufacture and testing of a realistic quarter car wheelhouse structure.
- -
- The validation of an unsteady numerical methodology with experimentally-obtained balance, pressure, and flow field data.
- Exploring the effect of lateral wheel displacement.
2. Methodology
2.1. Experimental Methodology
This study utilised a 60%-scale isolated wheel model, the details of which can be found in Rajaratnam and Walker [10], in tandem with a representative, quarter car wheelhouse structure; see Figure 11. The entire experimental model, including the housing, was designed, manufactured, and tested at Loughborough University, where balance, pressure, and 2D particle image velocimetry data were obtained experimentally. All experiments were conducted in the Loughborough University Large Wind Tunnel at an operating velocity of 30 m/s with a freestream turbulence of 0.2%. Further information on this facility can be found in Johl et al. [27]. The model scaling considerations were set based on tests previously conducted by Cogotti [9] and confirmed by Rajaratnam and Walker [10], where the trend line found from the pre-post critical Reynolds number, for a stationary isolated wheel configuration, illustrated a transition from pre-post critical drag. It was defined that to capture post-critical drag separation on a 60% scale vehicle wheel successfully, a Reynolds number airflow, based on the wheel diameter (), of over is needed [10].
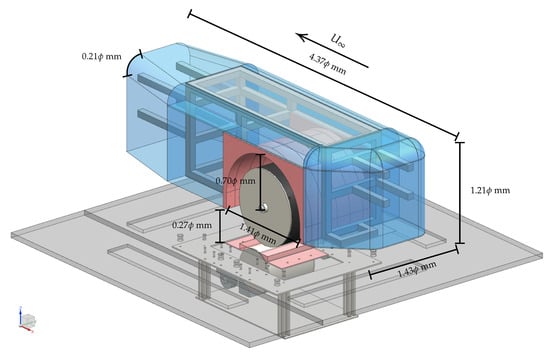
Figure 11.
Full wheelhouse rig design with wind tunnel floor.
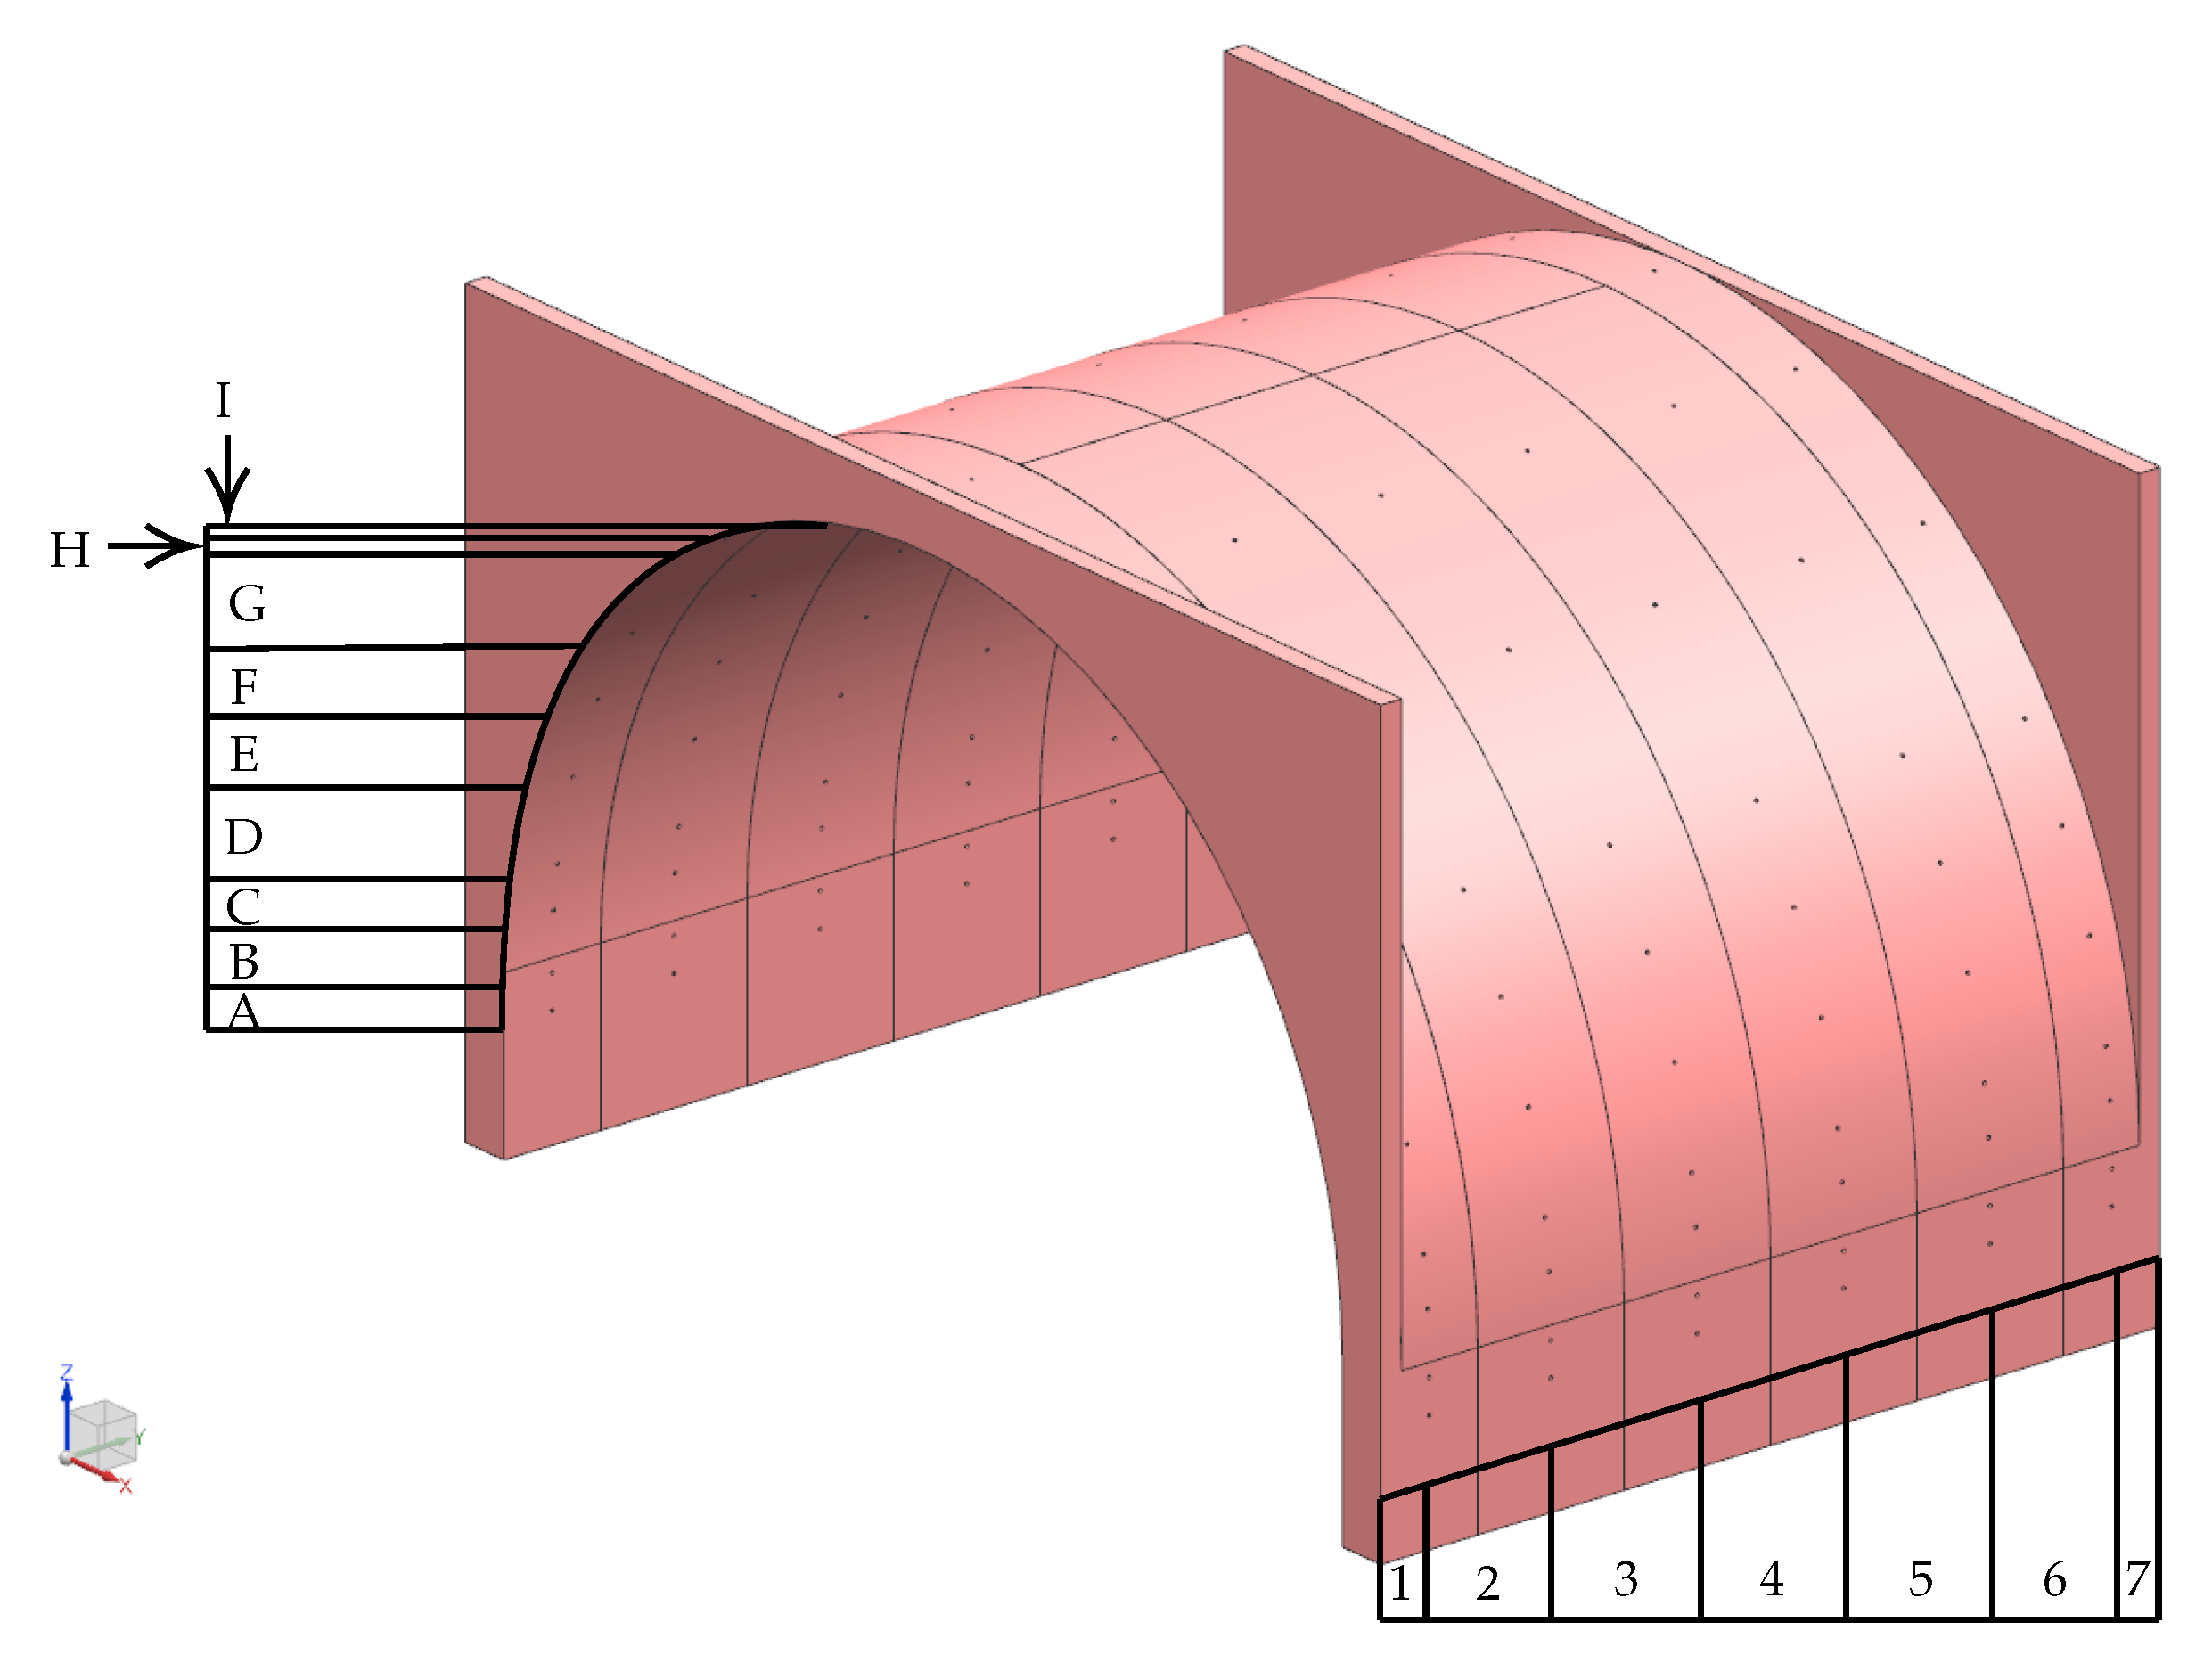
The model design, shown with the two separate components placed together and with relation to the wind tunnel floor, depicted in Figure 11, comprised a wheel with a diameter mm and width mm. When tested at 30 m/s, this gives a Reynolds number, () of , which is safely within the post-critical range. This ensures reliable acquisition of post-critical drag separation and thus, avoids any transitional effects. The wheel was driven by a rotating drum system, which was located beneath the wind tunnel floor, as shown in Figure 11, with 3D-printed inserts, coloured pink in the figure, manufactured to reduce the gaps around the contact patch of the wheel and drum greatly, minimizing as best as possible the suction effects through the floor. The majority of the wheelhouse structure was made from wire-cut panels of craft foam, which then were fixed onto an aluminium extrude internal frame. This was then supported with top and bottom aluminium sheet panels, which aided the access to the pressure scanners that were located inside the model. The wheel arch (Figure 12) was made from machined high-density Prolab, and this gave enough rigidity to allow for the 114 pressure taps to be installed. The distribution of the pressure taps is shown in Figure 12 with corresponding measurements in Table 1 and Table 2. All distances were normalised by the wheel diameter, .
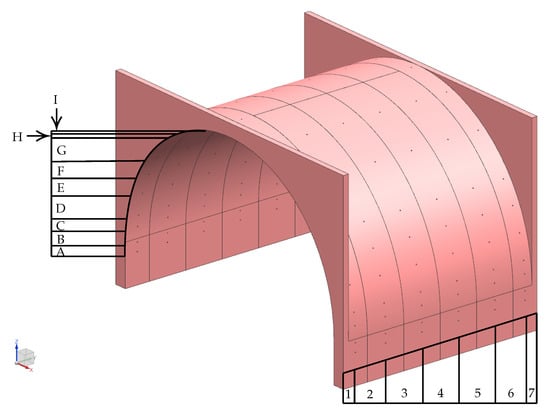
Figure 12.
Wheel arch pressure tappings.

Table 1.
Wheel arch pressure tappings: internal surface measured distances (half).
Table 2.
Wheel arch pressure tappings: lateral measured distances.
2.1.1. Balance Measurements
Only the wheelhouse was located live on the balance, so the experimental balance data regarded the wheelhouse forces exclusively. Balance data were sampled with a six-component balance for 300 s at a sampling rate of 300 Hz, which generated 90,000 data points per test. Balance measurements were repeatable to across two different test periods; however, all results presented in this study were obtained in one test period.
Wind tunnel speeds were corrected for blockage using the standard continuity-based MIRA blockage correction [28]:
where,
For the proceeding Results section, the following equation was applied when considering both computational and experimental wheelhouse forces:
where,
For the computational wheel displacement comparison, the following equations were applied to calculate the respective component force coefficients:
where,
This was done so that the contribution of individual model parts, for example wheelhouse, wheel and stand, could be analysed with more ease.
2.1.2. PIV Measurements
PIV images were obtained using two 5.5 megapixel dual-frame Imager sCMOS cameras with 16-bit pixel CCD sensors. A dual pulse 532-nm 200-mJ Nd:YAG laser was used to generate the light sheet, which was approximately 1 mm thick across the measurement plane. Diethylhexyl Sebacate, (DEHS) was used for seeding at the start of the contraction, as well as through the floor boundary layer at the leading edge of the working section. This generated particles with a mean diameter m.
PIV vectors were generated by defining the average particle displacement in an interrogation window by calculating the spatial correlation between the first and second frame of a raw image pair. Similarly to that performed by Rajaratnam and Walker [10], red filter material within the tunnel and geometric masking were utilised to reduce issues with glare and laser reflection. Starting with a 128 × 128 pixel reference vector interrogation field and then reducing down to a 24 × 24, a multi-pass processing approach was employed, as well as an overlap factor of 50%, which improved both data yield and the validation process. All time-averaged data were calculated from 1000 instantaneous vector fields at a sampling rate of 15 Hz.
2.1.3. Pressure Measurements
The wheel arch was fully-pressure tapped, as depicted in Figure 12. Tappings were grouped in such a way so that the density was higher in the areas with larger pressure gradients and fluctuations, as identified in CFD. These were mounted flush to the curvature of the wheel arch and connected via tubes to a pair of 64 channel pressure scanners that were stored within the hollow housing. The connecting wires and tubes were routed out down the bottom of the housing through an aluminium bottom plate and through the wind tunnel floor, in an effort to minimise the disturbance to the surrounding airflow. One hundred fourteen pressure taps were used for all experimental tests and sampled at a rate of 260 Hz for 300 s, generating 78,000 data points per tapping per test.
For all pressure plots, can be defined as follows:
where,
All results were also subject to the following correction:
where,
2.2. Numerical Methodology
CFD has become an integral tool for scientists and engineers for both research and design purposes, with accurate prediction of forces and flow fields essential for ensuring reliable CFD calculations. Methods of improving simulation accuracy can range from improving mesh resolution or using temporally-discretised turbulence solvers such as DES or LES. In this study, the STAR-CCM+ k- SST Improved Delayed Detached Eddy Simulation (IDDES) turbulence model was used for all numerical simulations with a time step of , which ensured satisfactory temporal discretisation. DES is a hybrid modelling method that for the majority uses the RANS closure model close to the wall within the boundary layer and in conservative vector flows. However, if the grid is of a fine enough resolution, the flow field will be resolved using an LES subgrid scale model in detached flow regions [10]. The time-dependent LES solver is utilised fully within the far-field, where unsteady equations are known to be best applied when unsteadiness is either imposed or inherent. This is usually defined by large separations, induced by high-resolution vortex shedding. Further information on both meshing and solver settings used can be found in Rajaratnam and Walker [10]. For all data points, forces and flow fields were averaged for s, after a settling time of s.
3. Results: Stationary and Rotating Wheel
3.1. Wheelhouse Forces and Flow Behaviour
Table 3 and Table 4 display both the experimentally and numerically obtained force data for the wheelhouse, normalised by the wheelhouse frontal area. To clarify, all rotating results have been subtracted from those attained from the stationary configuration. This shows that as expected, drag reduced upon rotation of wheels for the wheelhouse, as shown by Mercker et al. [13] and Wäschle et al. [29]. This decrease was larger by in magnitude for the experimental setup; however, for both experimental and computational results, for the rotating configuration. Lift was shown to be larger, producing less downforce for the stationary configuration, although in this instance the difference was more pronounced for the computational data, as presented in the percentage difference columns. It has been previously shown by Rajaratnam and Walker [10] that CFD consistently under-predicts both lift and drag coefficients for an isolated wheel configuration, where in that investigation, lift was underpredicted by approximately 50%, whereas drag was closer to 10%. For this study, maximum lift underprediction was at 60% and drag was at a maximum of 4%. This can once again be attributed to discrepancies with the experimental setup due to: (i) difficulties in meshing the contact patch between the wheel and the floor-mounted drum used to drive the rotation (it was omitted from the numerical model) and (ii) possible leakage in this region. Flow leakage via the gap around the driving drum can cause a reduction in the pressure close to the contact patch, creating a larger pressure difference top-to-bottom, equating to a higher overall lift. For isolated wheels, lift has been found to decrease with rotation, as the jetting effect altered the pressure distribution across the wheel surface, as shown by Fackrell and Harvey [16], Wäschle et al. [29] and Mears et al. [30]. As for shrouded wheels, Mercker et al. [13] and Wäschle [31] found that with rotation, the total lift (body and wheels) coefficient reduced for all configurations. Mean pressure measurements inside and around the wheel well in Fabijanic’s [14] study showed that the jetting from the front of the wheel was primarily responsible for the interference in the underbody flow, which resulted in a variation of lift. For this model, the opposite was found and the increase in downforce generated for the total lift is due to the reduction of positive lift created for the wheel and axle when rotating, . Thus, this opposite difference in lift variation can be attributed to the shape of the housing.
Table 3.
Experimental wheelhouse forces: stationary-rotating.
Table 4.
Computational wheelhouse forces: stationary-rotating.
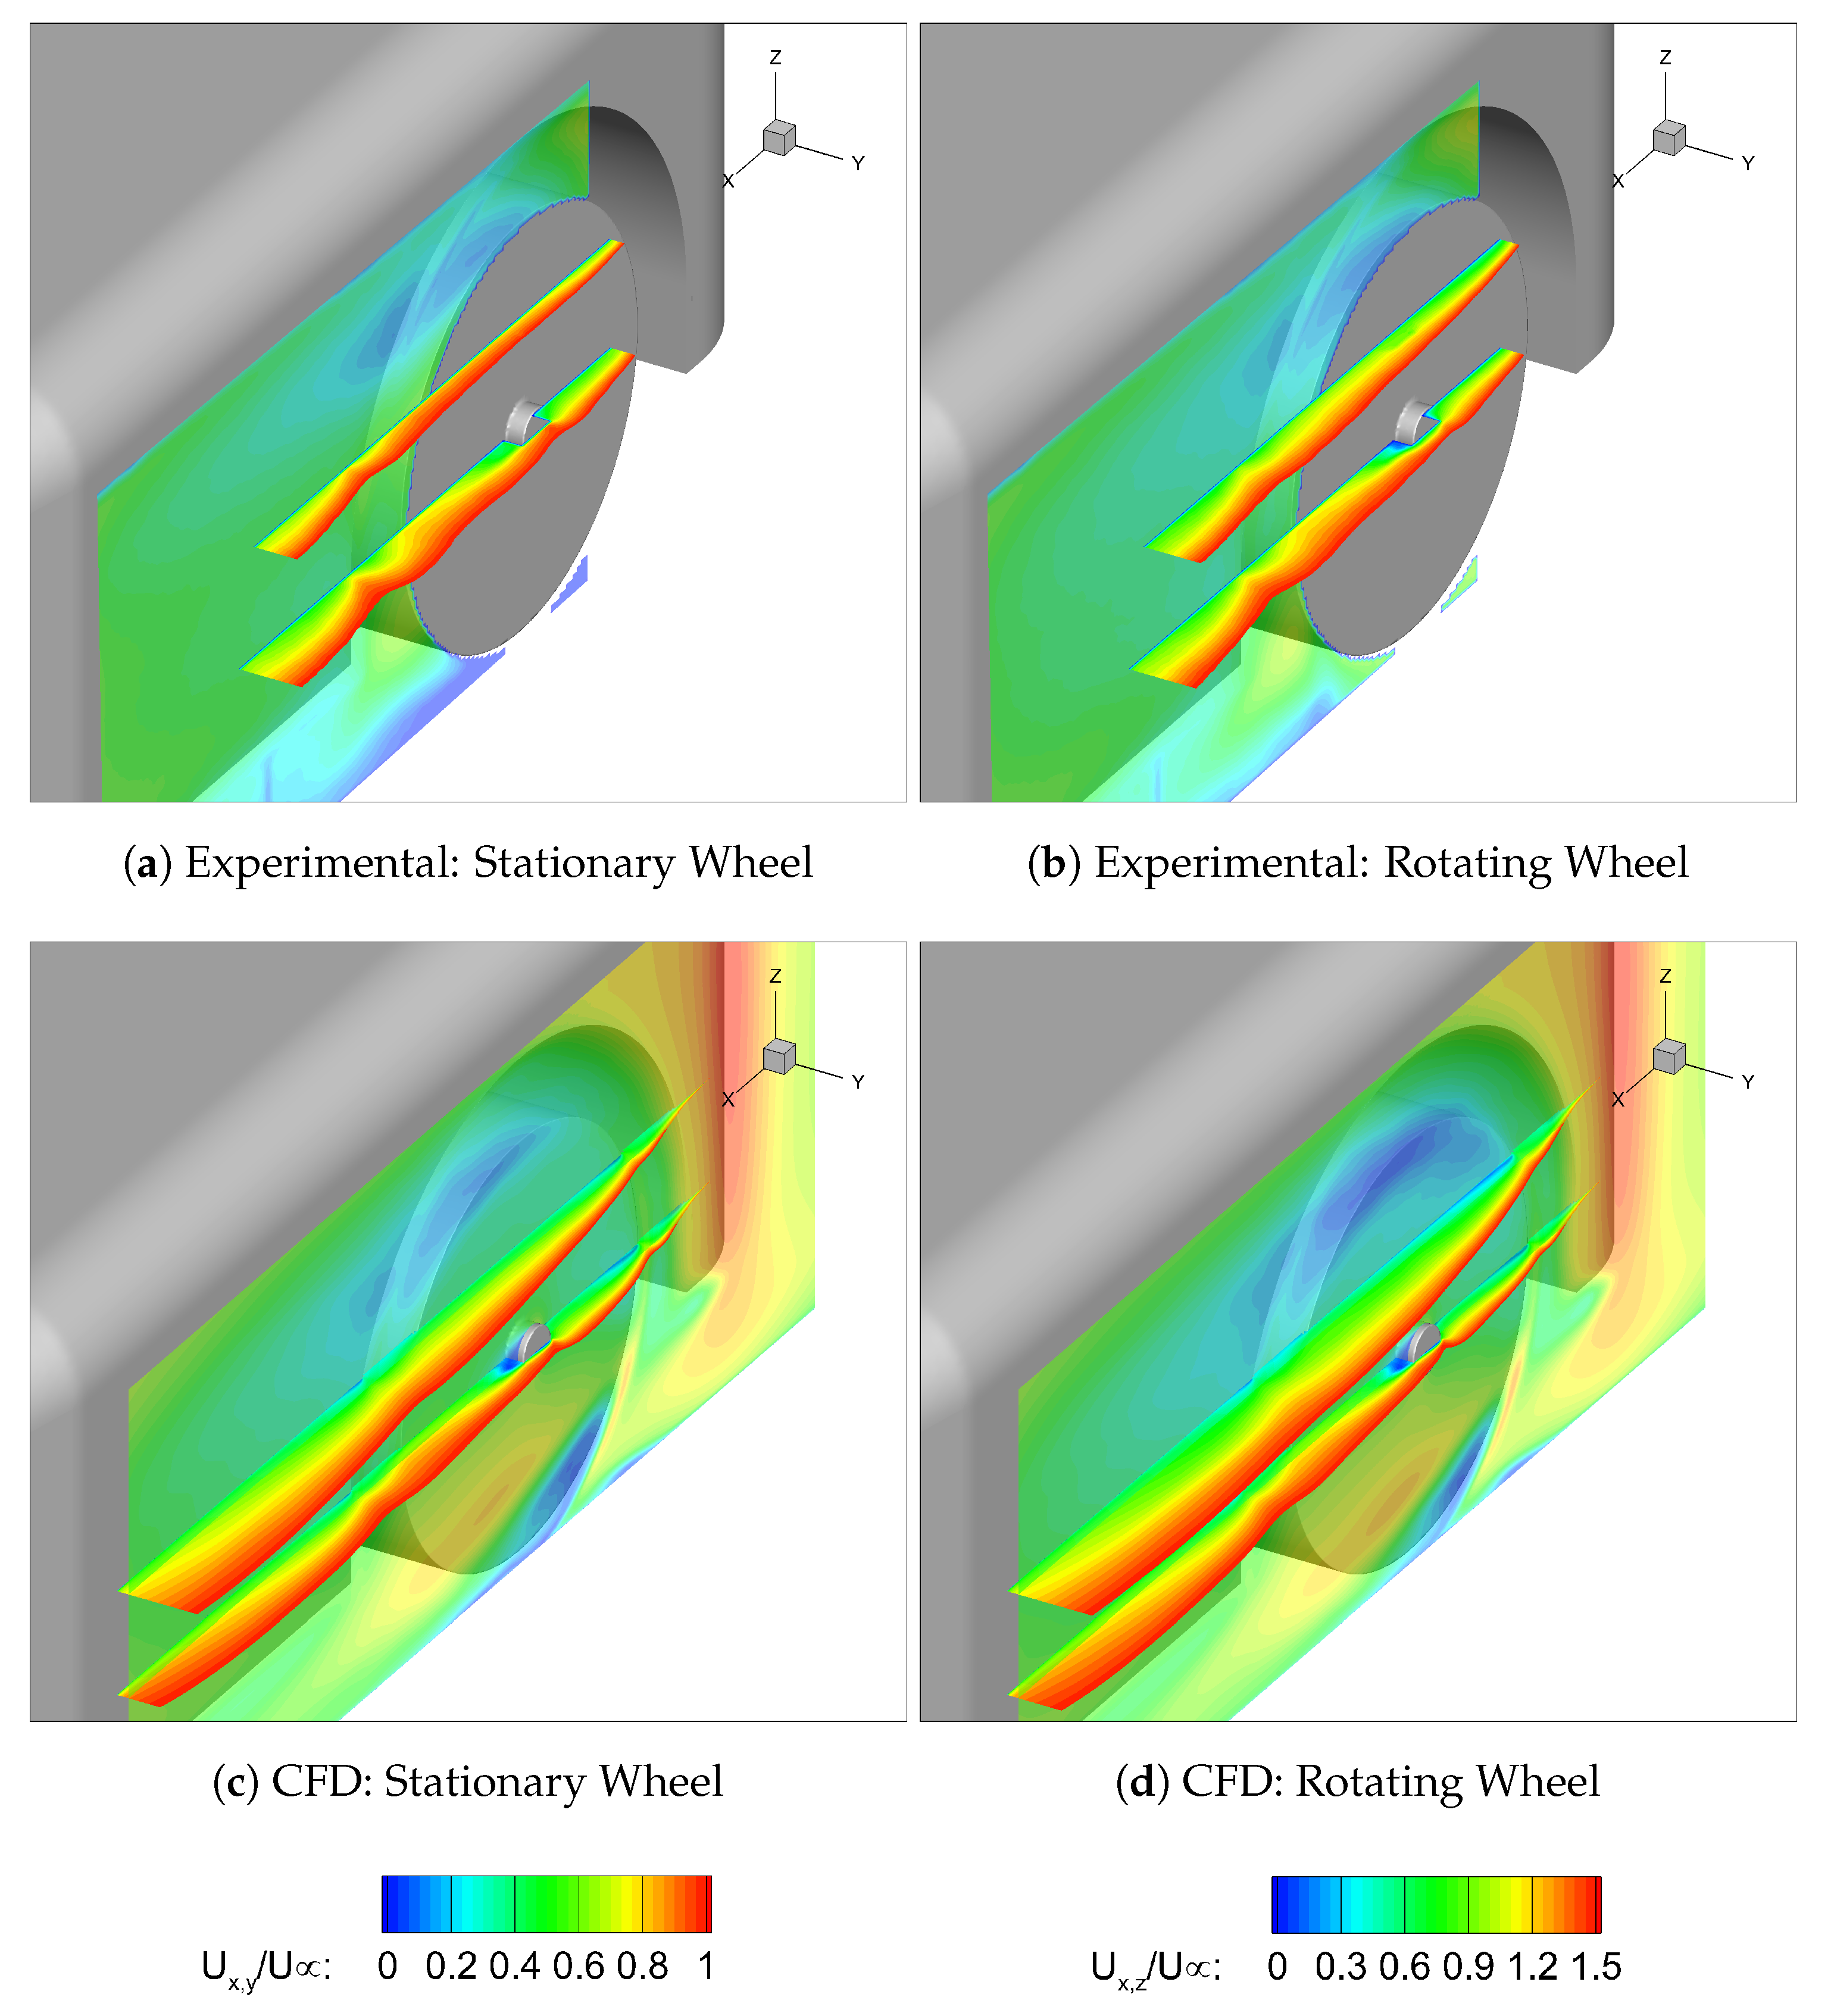
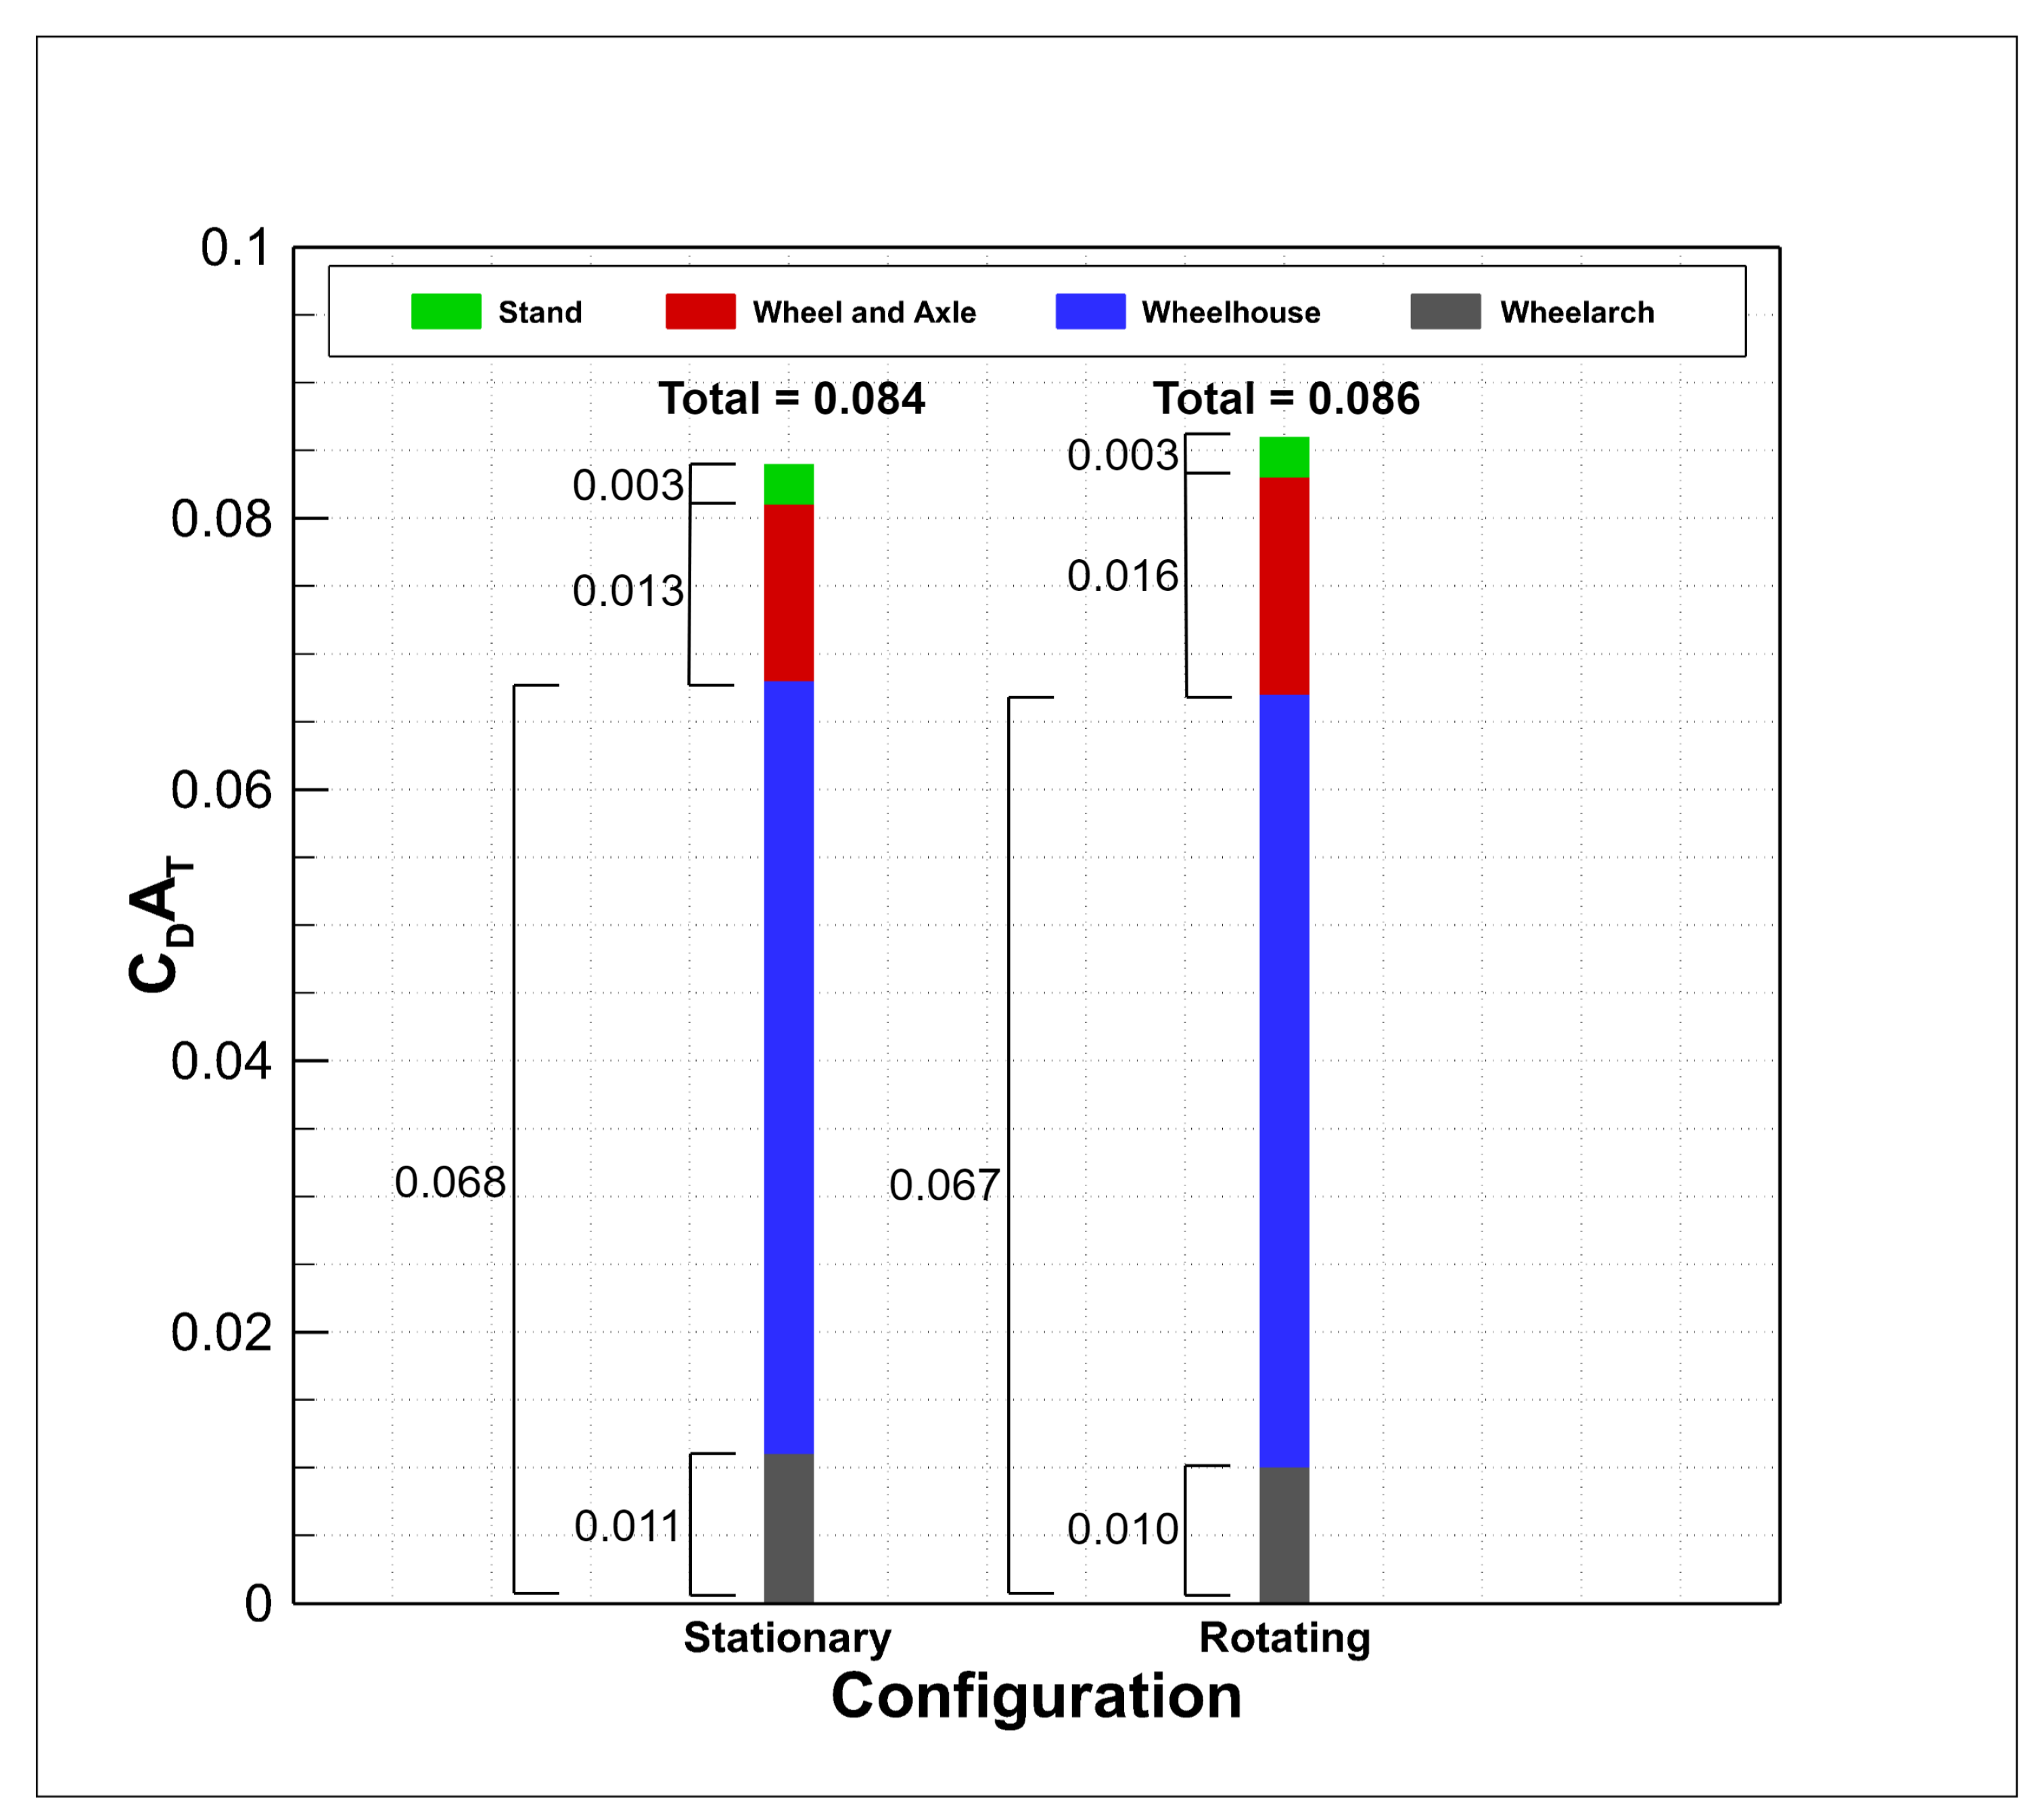
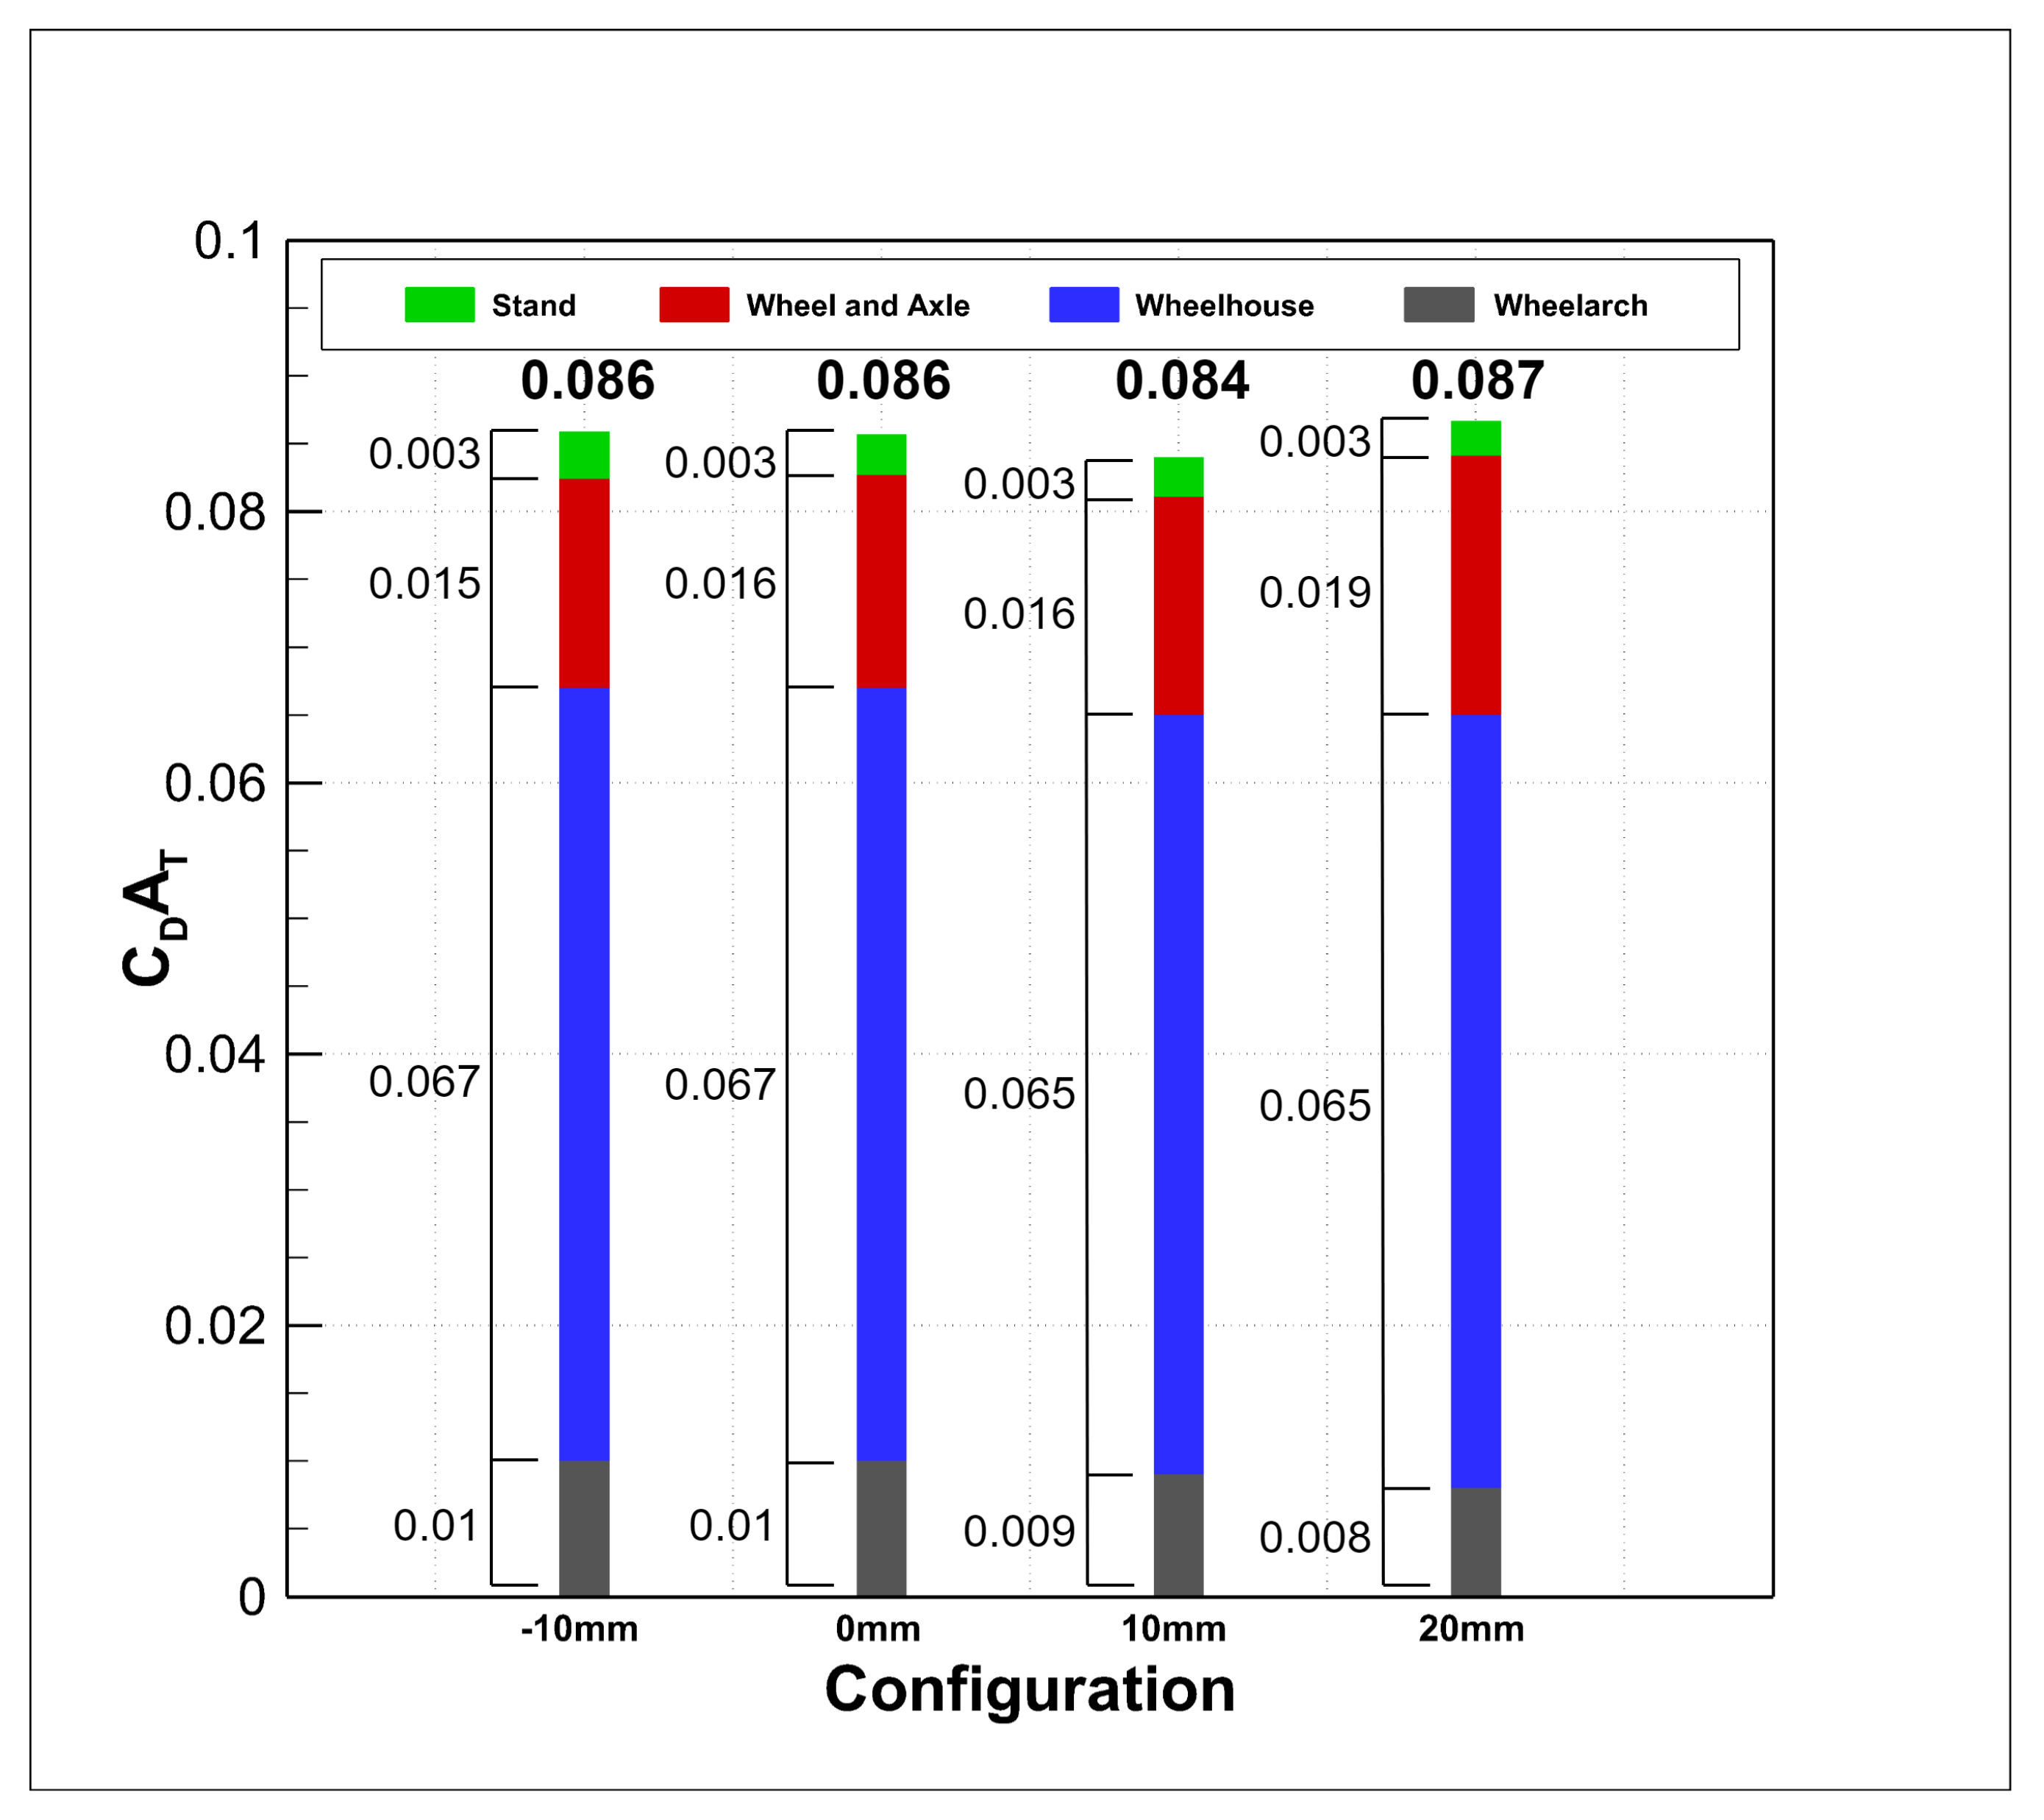
The PIV and CFD plane comparisons along the outboard (right-hand side) running edge of the wheel can be found in Figure 13a–d and the graph in Figure 14 displays the computational breakdown of , which illustrates the contribution of each component to the total . One must note that due to the total area of the model being less than 1 m, all values of are smaller than that of . This means that differences that appear small still have a large effect on the total force. Both sets of data can be used together to show that whilst the total drag does increase with rotation, , this is due to an increasing wheel and axle drag, , overcompensating for the reduction in wheelhouse drag. This is corroborated by Axon et al. [20] and fundamentally differs to the behaviour of isolated wheels.
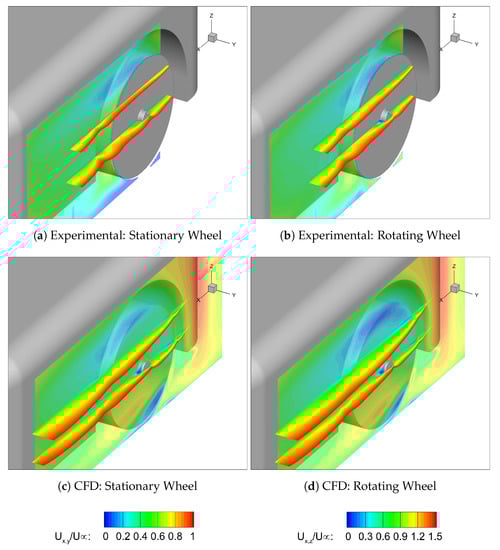
Figure 13.
PIV Planes.
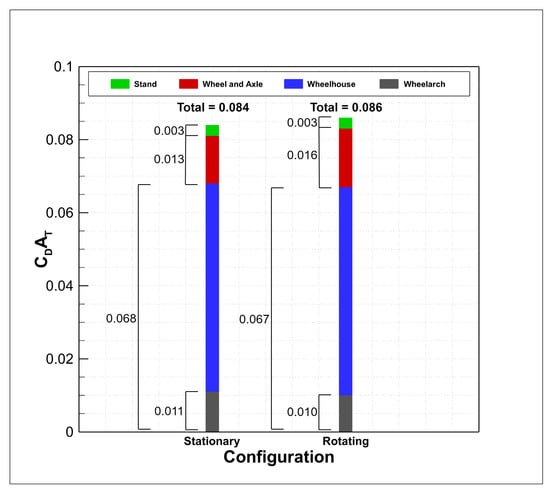
Figure 14.
CFD: Stationary and Rotating Wheel Drag Breakdown.
It is evident that for both experimental and computational rotating wheel configurations, the high velocity gradient shear layer region along the outboard side of the wheelhouse is larger in width, on both x-y planes, than the stationary wheel. For both techniques, the lateral difference between stationary and rotating shear layer thicknesses at the end of the horizontal centreline PIV plane is mm. For the plane mm, away from the ground plane, mm. However, one can also see that whilst this trend is validated, when comparing experimental against computational it is displayed that the general shear layer thicknesses are over-predicted for the numerical work. This can be ascribed to the SST k- model, where it has been found that the linear relation between the Reynolds stresses and the mean strain rate tends to under-predict the anisotropy of turbulence [32]. Turbulence is anisotropic in the most complex cases, such as in the shear or boundary layer that is found in this example. This also backs up the hypothesis that under-predicting the magnitude of the turbulent shear stress can be a reason for why points of reattachment are over-predicted compared to experimental positions [33,34]. Thus in this case, although the separation was over-predicted numerically, it is important that the trend between methodologies is the same.
The mentioned difference in shear layers, along with Figure 15, Figure 16a,b, Figure 17a,b aid in the explanation of the increased drag found for the rotating wheel.

Figure 15.
Wheel arch pressures: experimental and computational.
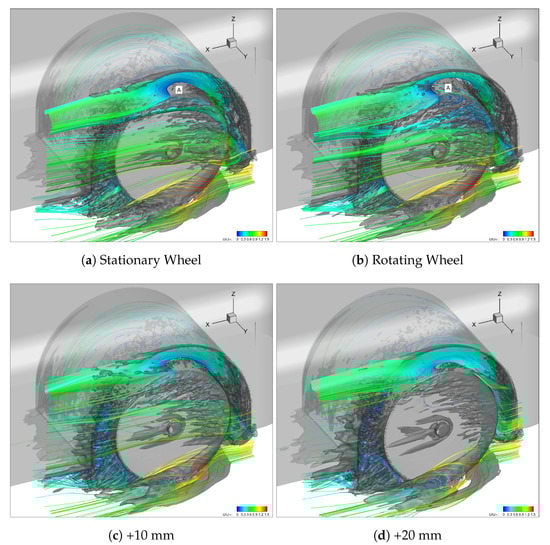
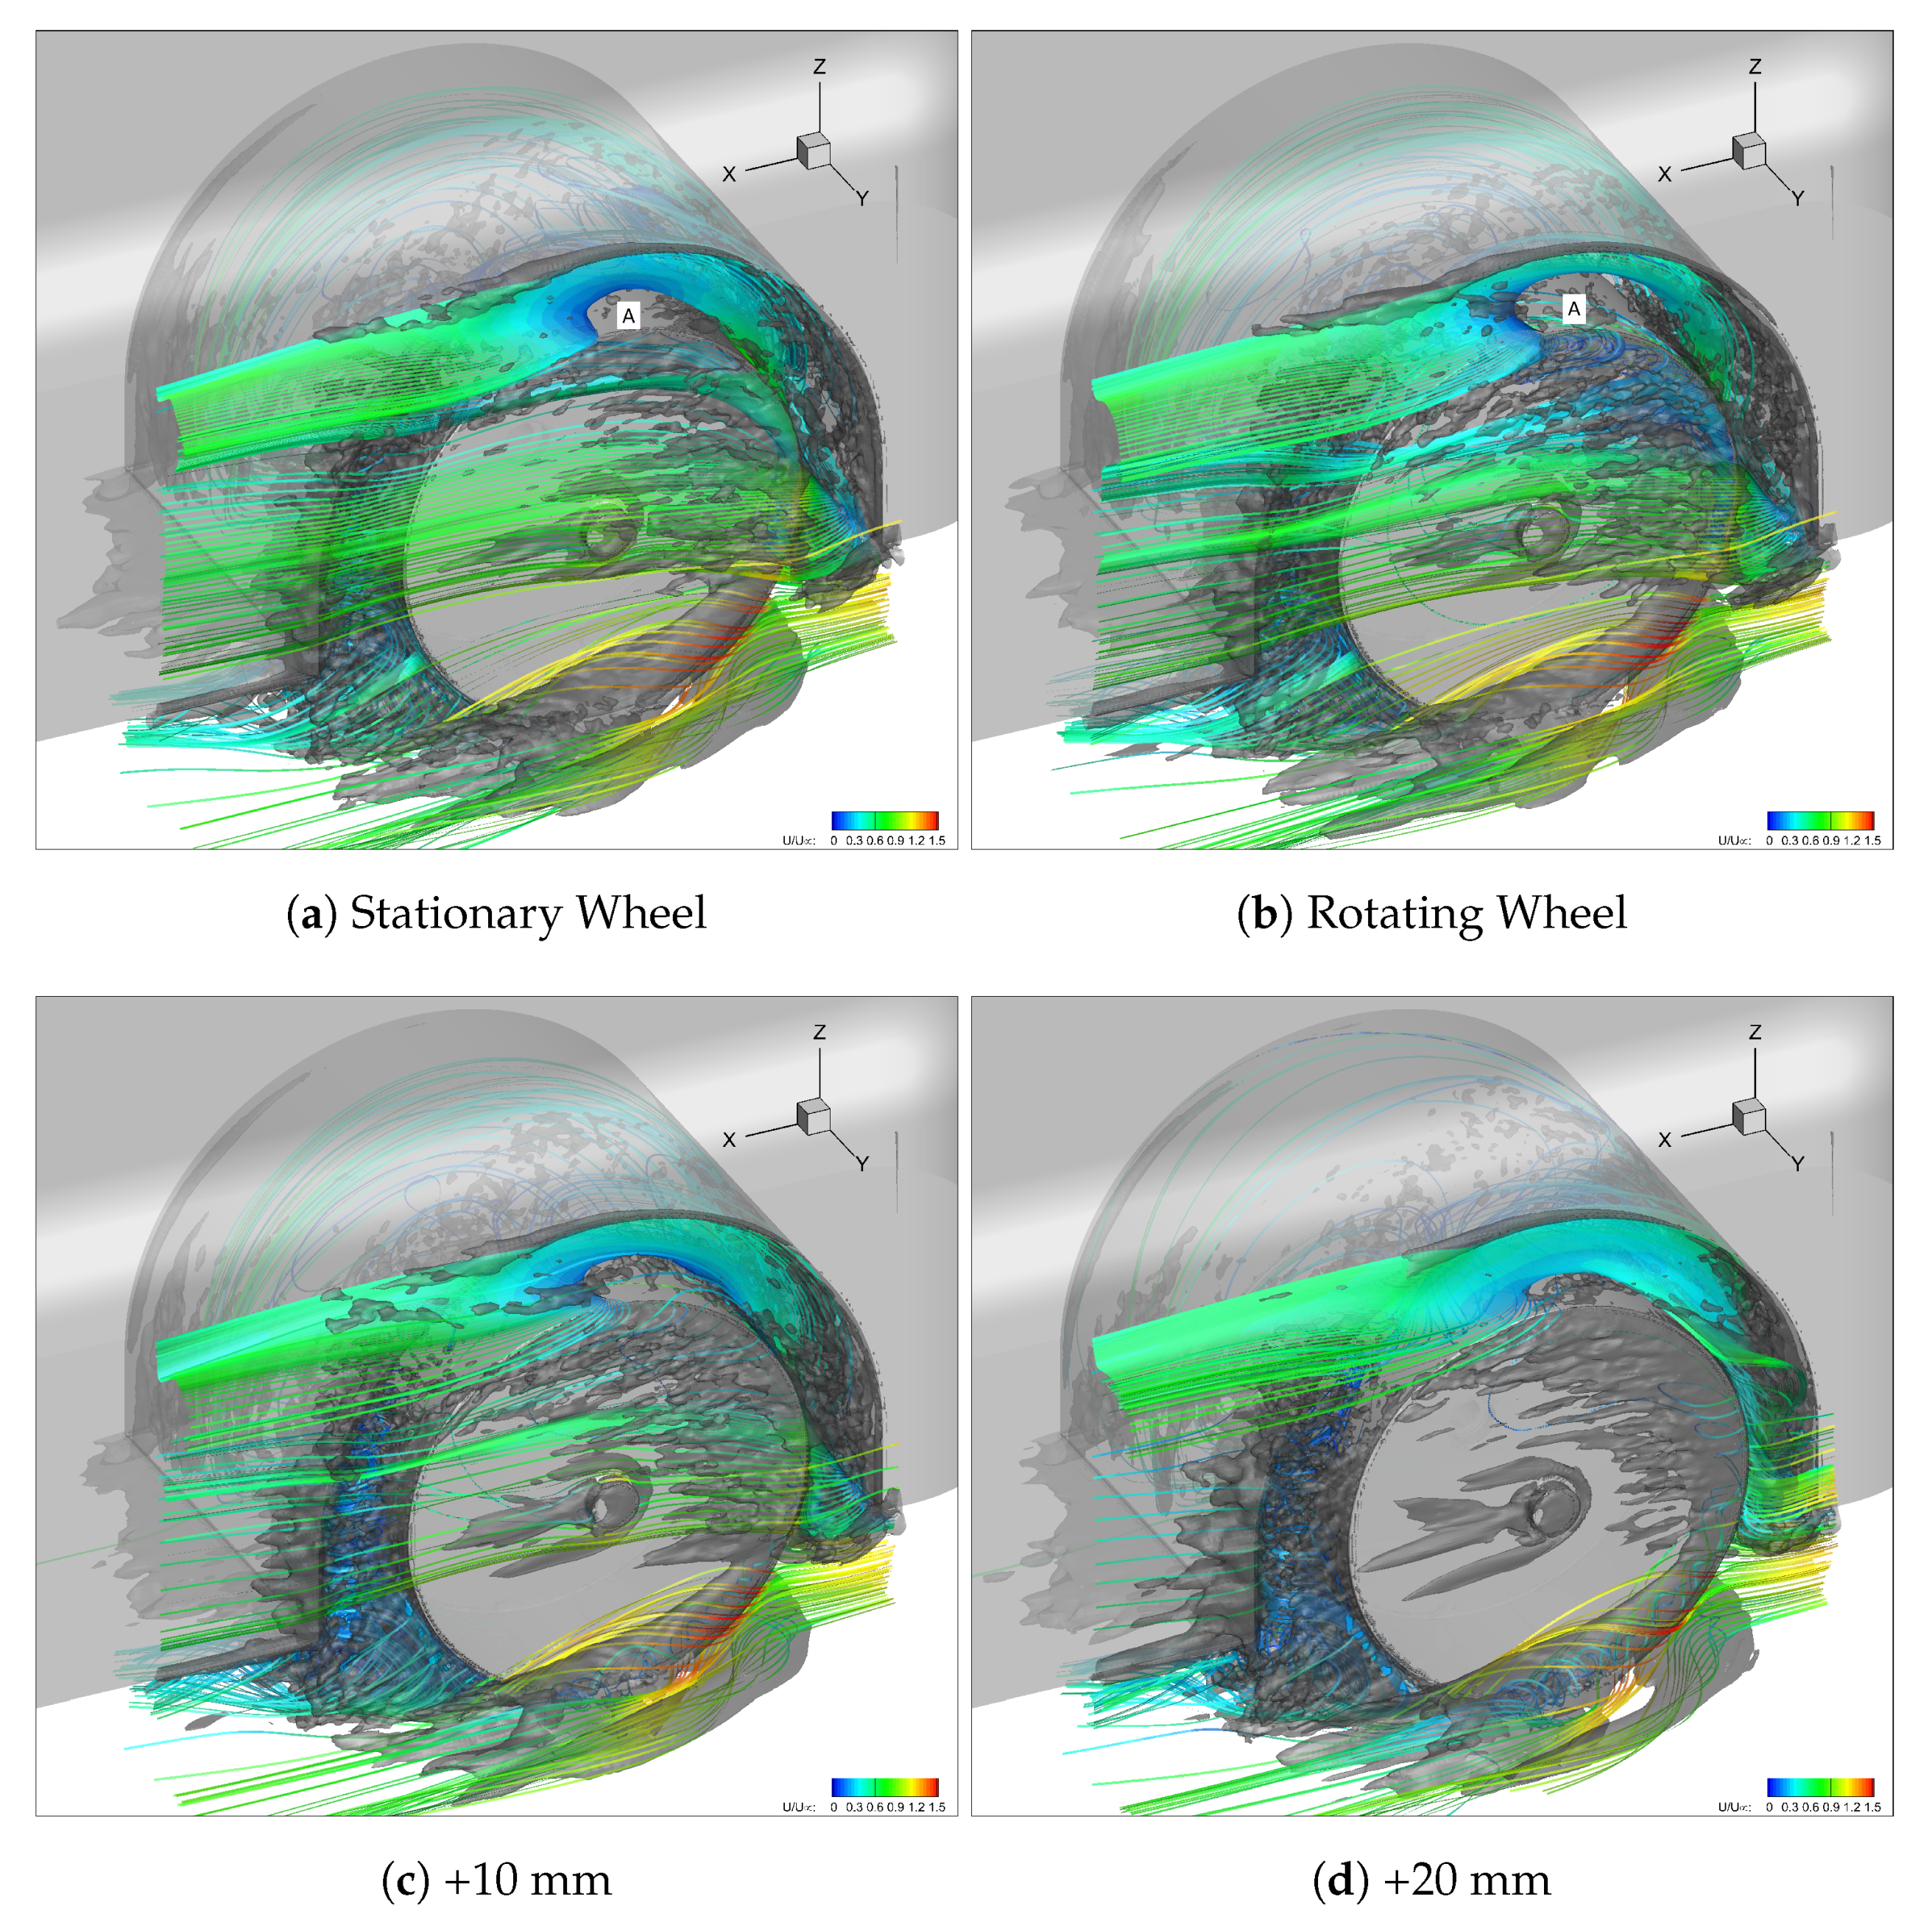
Figure 16.
CFD: Isosurface of QCriterion = 1 × 10⁵ s−1 and Streamtubes Coloured by Velocity Magnitude.
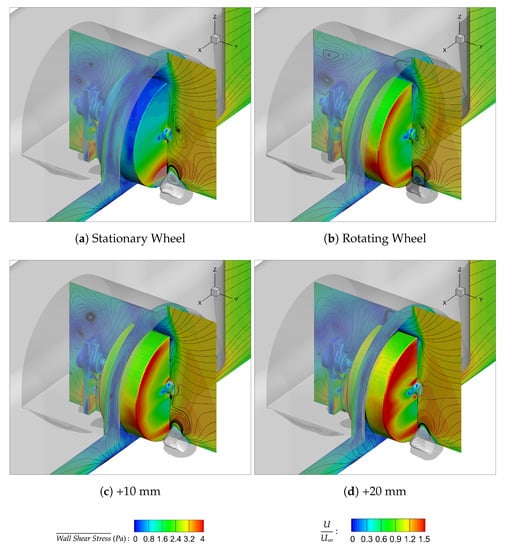
Figure 17.
CFD: Isosurface of PTot = −350 Pa, Mean Wheel Wall Shear Stress and Planes Coloured by Velocity Magnitude.
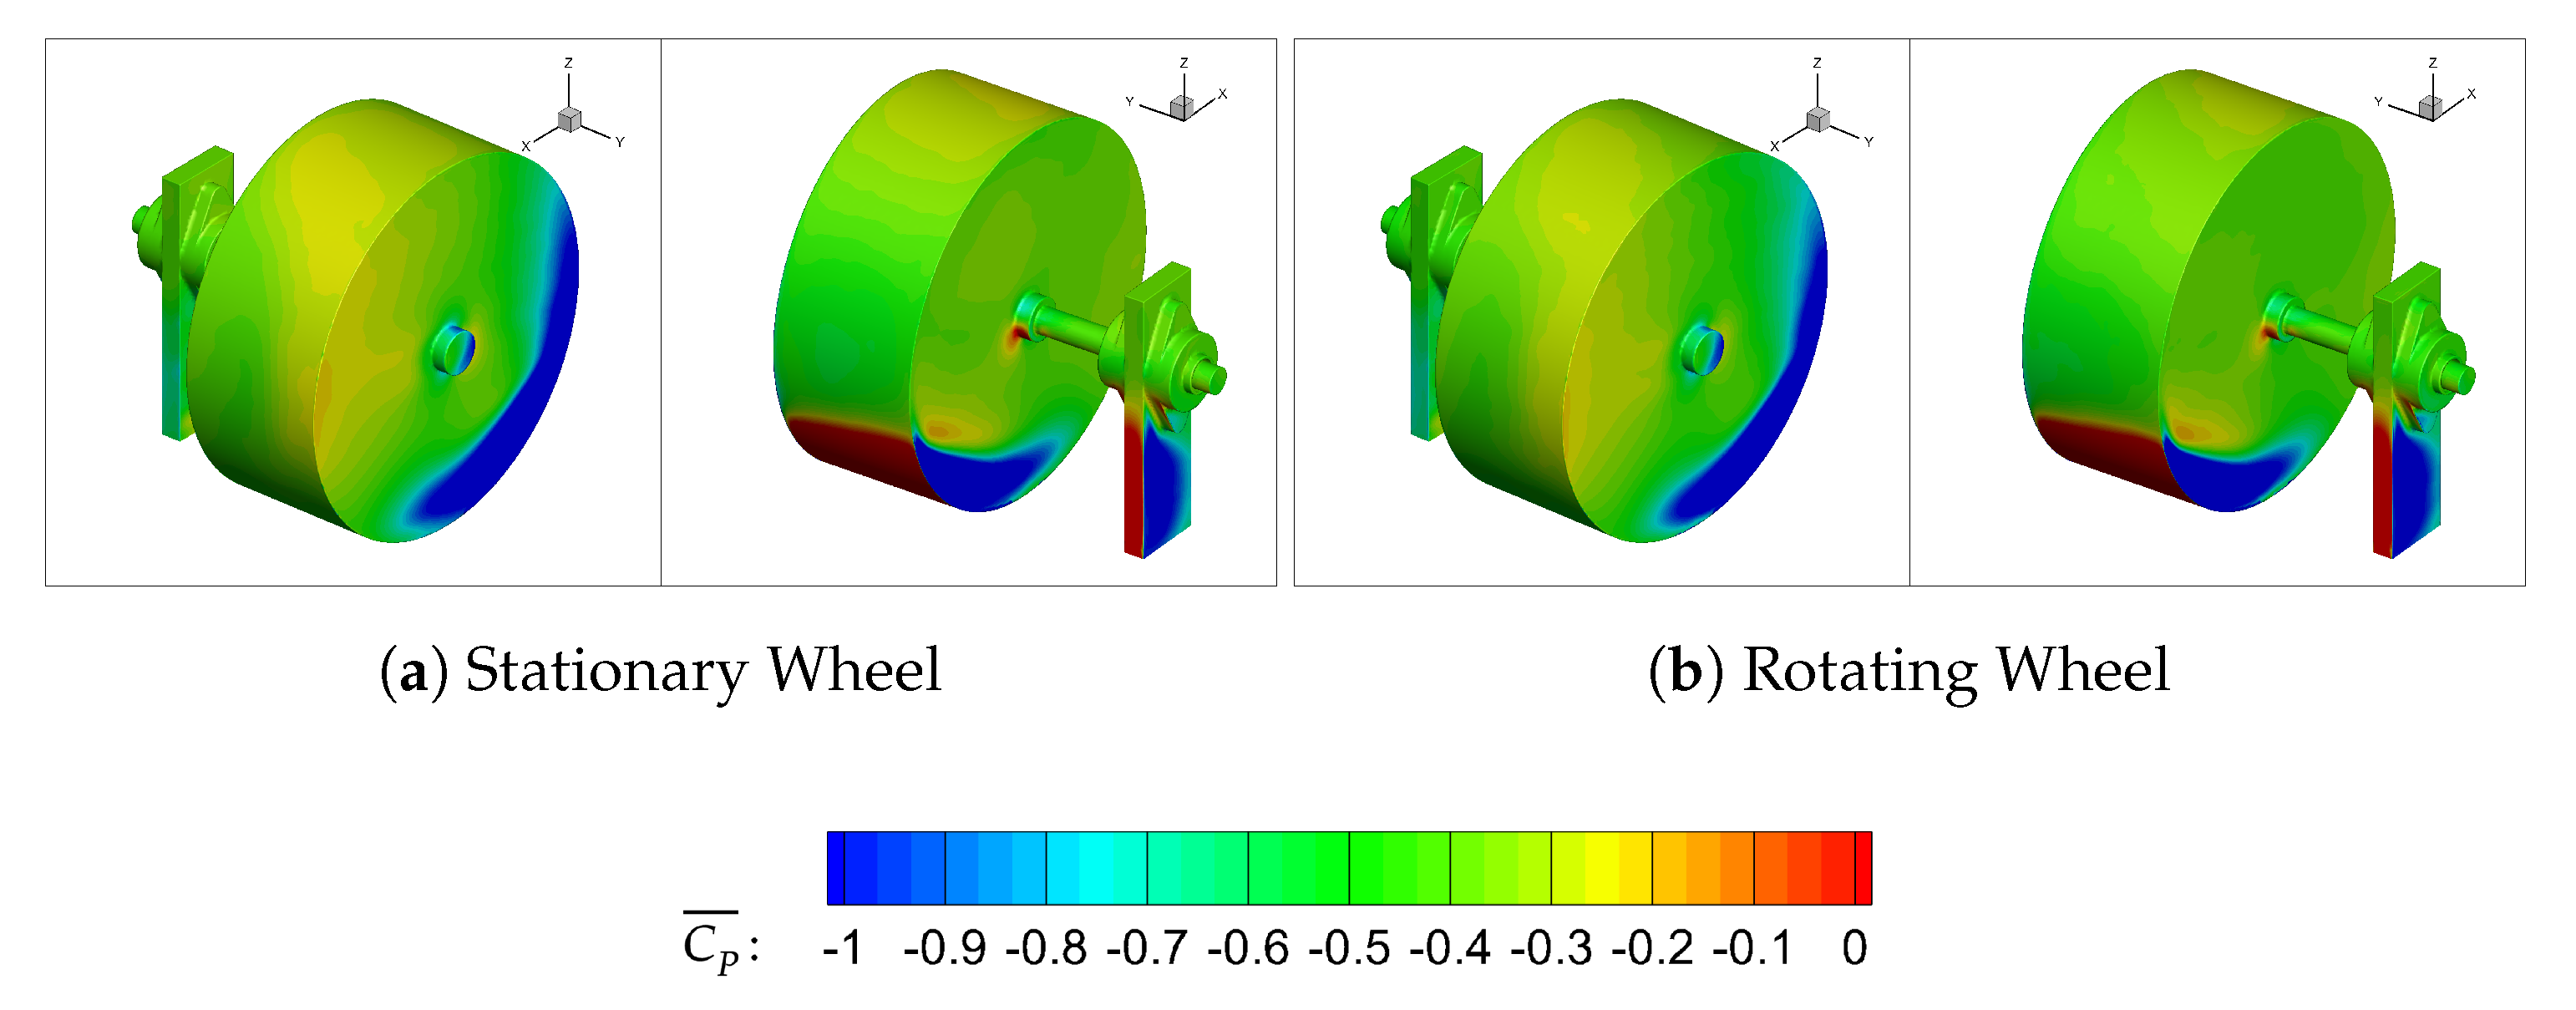
Rotation promotes earlier boundary layer separation over the top half of the wheel as shown originally by Regert and Lajos [18] and for this study in Figure 16b. This dominating separation bubble forms the core of Vortex A and once meeting the freestream flow on the outboard side of the model, is deflected along the model side and elongated downstream. Figure 17a,b illustrates that this vortex controls the upper separation on either side of the wheel and rotation is shown to sweep more air up from inside the wheel arch and across the crown of the wheel, in turn causing more outboard separation. The higher mean wall shear stress exhibited on the rotating wheel is evidence of the faster moving flow along the running surface of the wheel which travels in the direction of rotation, opposite to that of the freestream. The high stress section on the right of the model base is created by the fast recirculating flow aft of the model, illustrated by the tight corkscrew rear wake streamlines in Figure 16b. All of these factors, as well as the decreased mean base pressure coefficient found in Figure 18b compared to Figure 18a, are evidence for the increased drag for the shrouded rotating wheel. The mean pressure coefficient plots also exhibit how the low ground clearance ( mm) of the housing forces the stagnation point on the surface of the wheel to move lower, towards the ground plane. When comparing to the flow field around isolated wheels, rotation further moves the stagnation point down by around [15,30], however it is evident that for a shrouded wheel with a low ground clearance, this change in stagnation point is minimal.
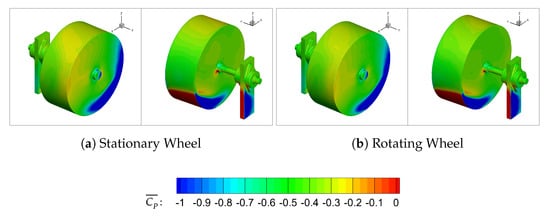
Figure 18.
CFD: Mean CP.
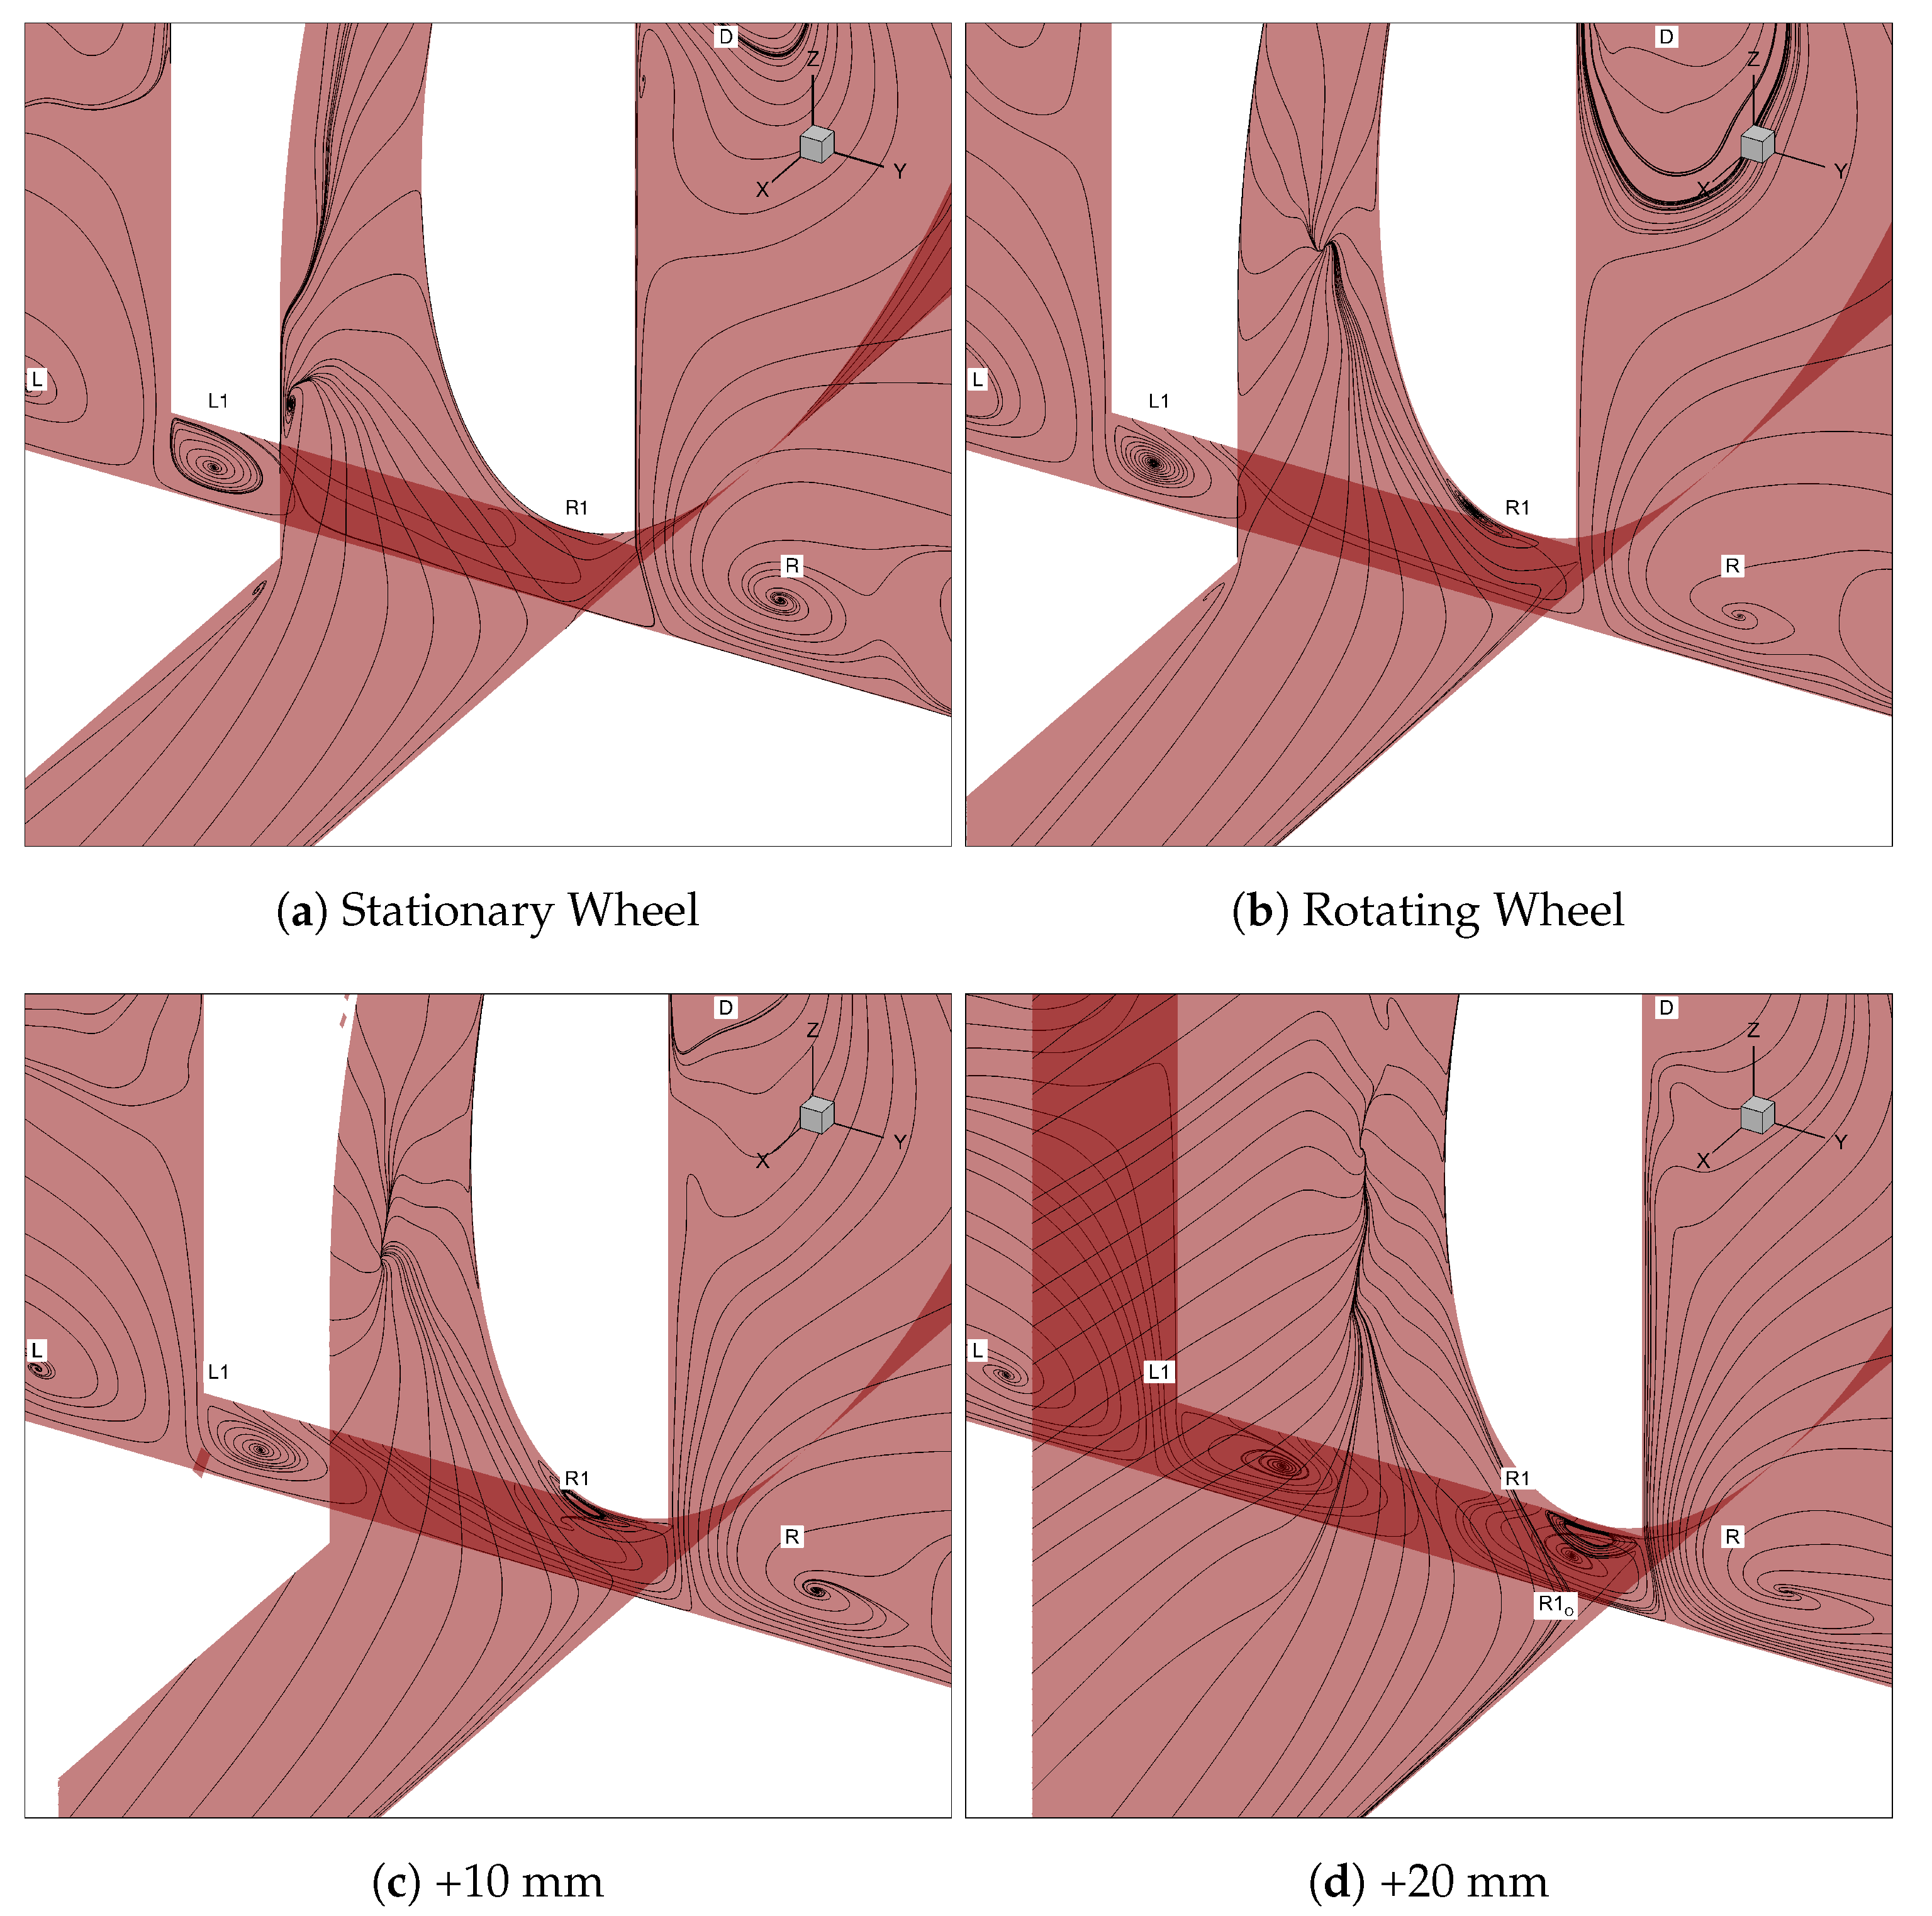
Figure 16a,b, Figure 17a,b, Figure 19a,b, Figure 20a,b have been used to analyse in close detail the vortex flow and differences between rotating and stationary wheel configurations. Due to the experimental set up, there are slight differences in vortex layout when comparing to previous theoretical models numerically obtained by Krajnovic [11] and Regert and Lajos [18]. It was shown in previous works that flow enters the cavity region along both the longitudinal and lateral leading edges of the wheel arch. Air entering along here moved upwards and was deflected out past the rear wheel edge, giving rise to Vortex B, as shown in Figure 8, which then escapes the cavity and dissipates along the housing side. This behaviour for Vortex B is not evident in the corresponding results shown for this study. It can be assumed that the location of the stand within the cavity causes enough blockage to be detrimental to the formation of this vortex, yet complicates the inner cavity flow tremendously, as shown in Figure 19a,b. Vortex B is shown more clearly for the stationary wheel case, to enter between the edge of the wheel and the wheelhouse longitudinal base, travel around the cavity in the space inboard of the wheel and around the stand until it gets pulled out across the back of the wheel by Vortex A and then forms a vortex with a core vertically aligned down the base of the wheel. This then directly feeds into Vortex E, exiting the cavity down past rear wake of the wheel. Vortex B and Vortex A are known to be dependent on the quantity of air entering the wheelhouse. If the yaw angle of the flow approaching the wheel was found to be small, thus inferring that the overhang length was long, the flow rate into A was larger, causing Vortex A to dominate the flow. Increasing yaw angle means the flow entering under the leading edge of the wheel arch and creating Vortex A decreases in flow rate so that the majority of the flow travels along the longitudinal edge of the wheel arch, magnifying vortex B [18].
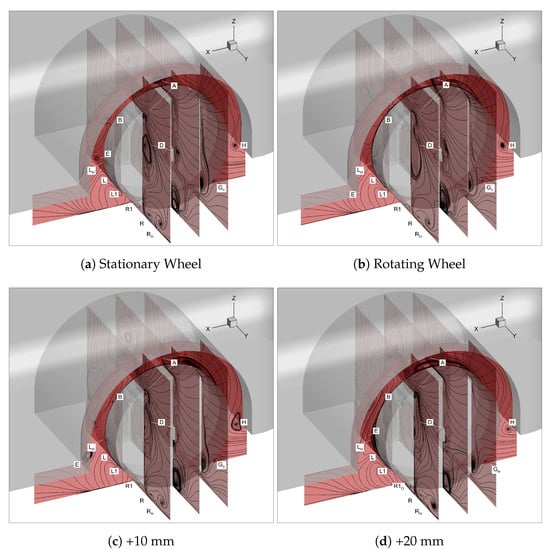
Figure 19.
CFD: 2D Plane Streamlines.
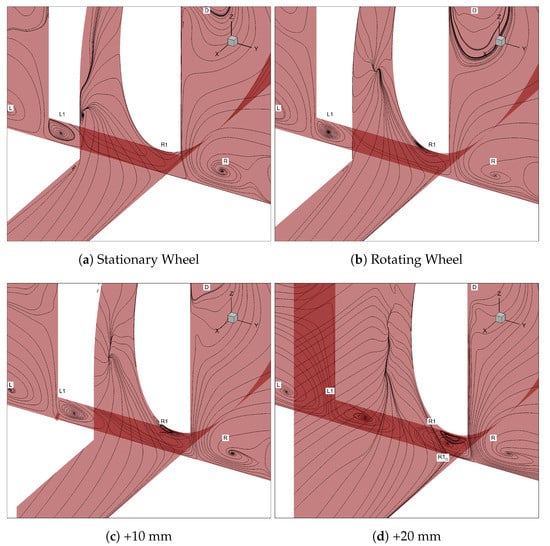
Figure 20.
CFD: 2D Plane Streamlines—Close Up.
Vortex A is created by flow entering at the lateral leading wheel arch edge and getting deflected upward by the wheel. It is then presented to interact with the running surface of the wheel which is moving in the opposite direction, thus causing boundary layer separation over the upper part of the wheel. This is shown with more clarity in Figure 16a,b.
Vortex D, another new feature fed from both the separation at the leading wheel arch edge (Vortex H) and from the recirculating internal cavity flow, is shown to travel up and across to the outboard side of the wheel, interact with the outer axle plug and merge with the freestream as it travels past the trailing edge of the cavity. This, similar to Vortex C although it does not travel up the vertical wheel arch edge as shown previously by Regert and Lajos [18], is a dominant wake feature for both stationary and rotating wheel and is shown to be caused by the lateral suction out into the freestream. The lack of underbody curvature in the geometry is also a reason for why the flow does not travel out from the underbody in the way depicted previously.
Due to the stationary ground plane, the main difference between the results and those found with a moving ground plane was the evidence of a horseshoe vortex that surrounds the wheel. It has been labelled at the upstream boundary layer roll as which then travels either side of the wheel as a counter vortex pair, and . However, the existence of this feature does not eliminate the other separation and jetting vortex pairs, and of which have been previously documented.
Figure 13a–d show both experimentally and computationally the exiting air from the wheel arch region in the x-z (vertical) plane. Gulyás et al. [24] showed via similarly located PIV images that the maximum outflow evident around a housing structure is through the upper gap between wheel and housing, this can be attributed to Vortex A and the separation bubble of this vortex is evident in this plane for all data points. For both experimental and numerical data, this bubble is shown to increase in both size and magnitude upon rotation. This phenomena has been justified as stated earlier; that the rotation of the wheel causes the conflicting flow directions to promote early boundary layer separation compared to when the wheel is stationary. This in turn forces more air out from the maximum outflow region.
The jetting effect aft of the contact patch was shown previously by Krajnovic [11]. As illustrated in Figure 9, it was confirmed that the pair counteracted the direction of the larger vortex pair. were shown to emulate from the fore of the wheel’s longitudinal edge due to the upwash from the suction between the wheel and the front overhang, these are eventually pushed further out away from the wheel as develop. This agrees with the results presented for the current study, as shown with the iso-surfaces of Q Criterion = 100,000 s in Figure 16a,b and a close-up of the growth is shown in Figure 20a,b. It was hypothesised that this pair moved in opposite directions [13], drawing flow away from the wheel and towards the ground. Krajnovic’s [11] results corroborated with Mercker et al. [13], which was more recently shown experimentally with LDA measurements obtained by Knowles et al. [22]. However, for this study it is displayed that the feature for the stationary wheel is both weak and small. This feature also seems to change upon rotation, where the vortex travels laterally instead of longitudinally, sweeping the majority of the jetting airflow inboard towards the cavity which is also compounded upon by the strong vortices due to the sharp edges of the model. , the inboard vortex was shown to be of a similar size, strength and swirl direction as found previously [11].
3.2. Wheel Arch Pressures
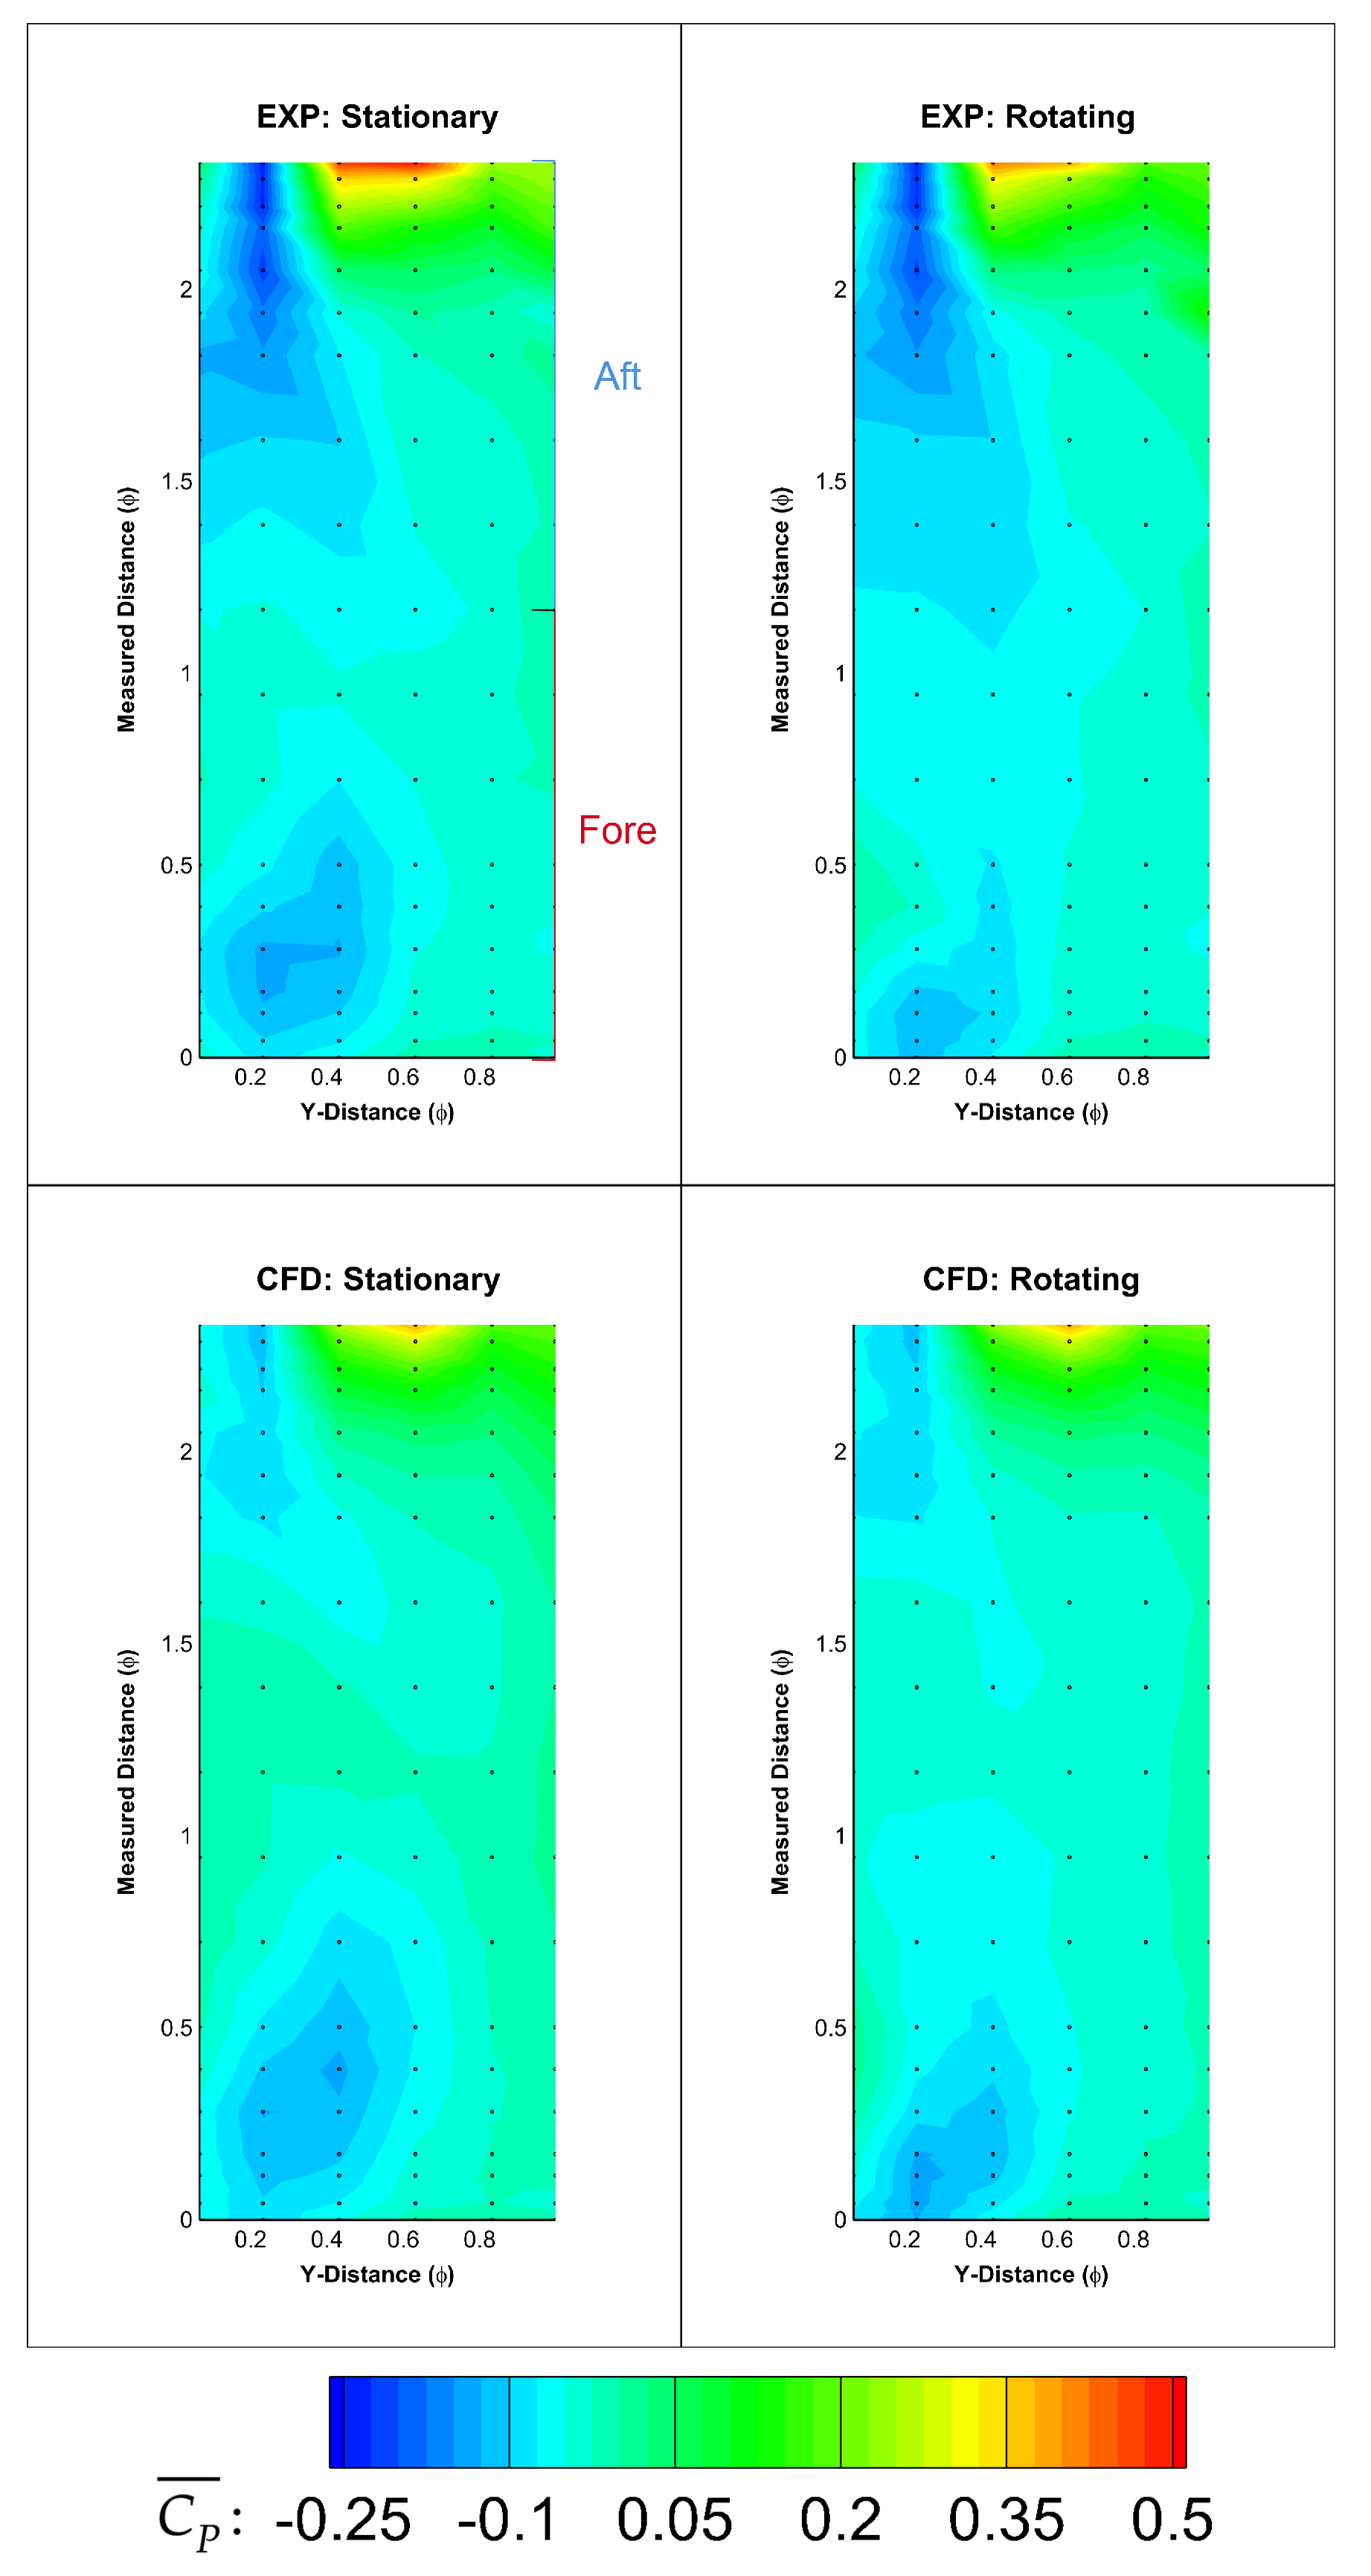
The wheel arch mean pressure coefficients, as shown in Figure 15, have been plotted with respect to position in y and the measured position in x, both of which have been normalised by the wheel diameter, m. This means that the plane viewed is not projected but in fact ”flattened”. It is evident from the plots that the pressure distributions are well represented by the CFD albeit with minor differences in the magnitude of the values.
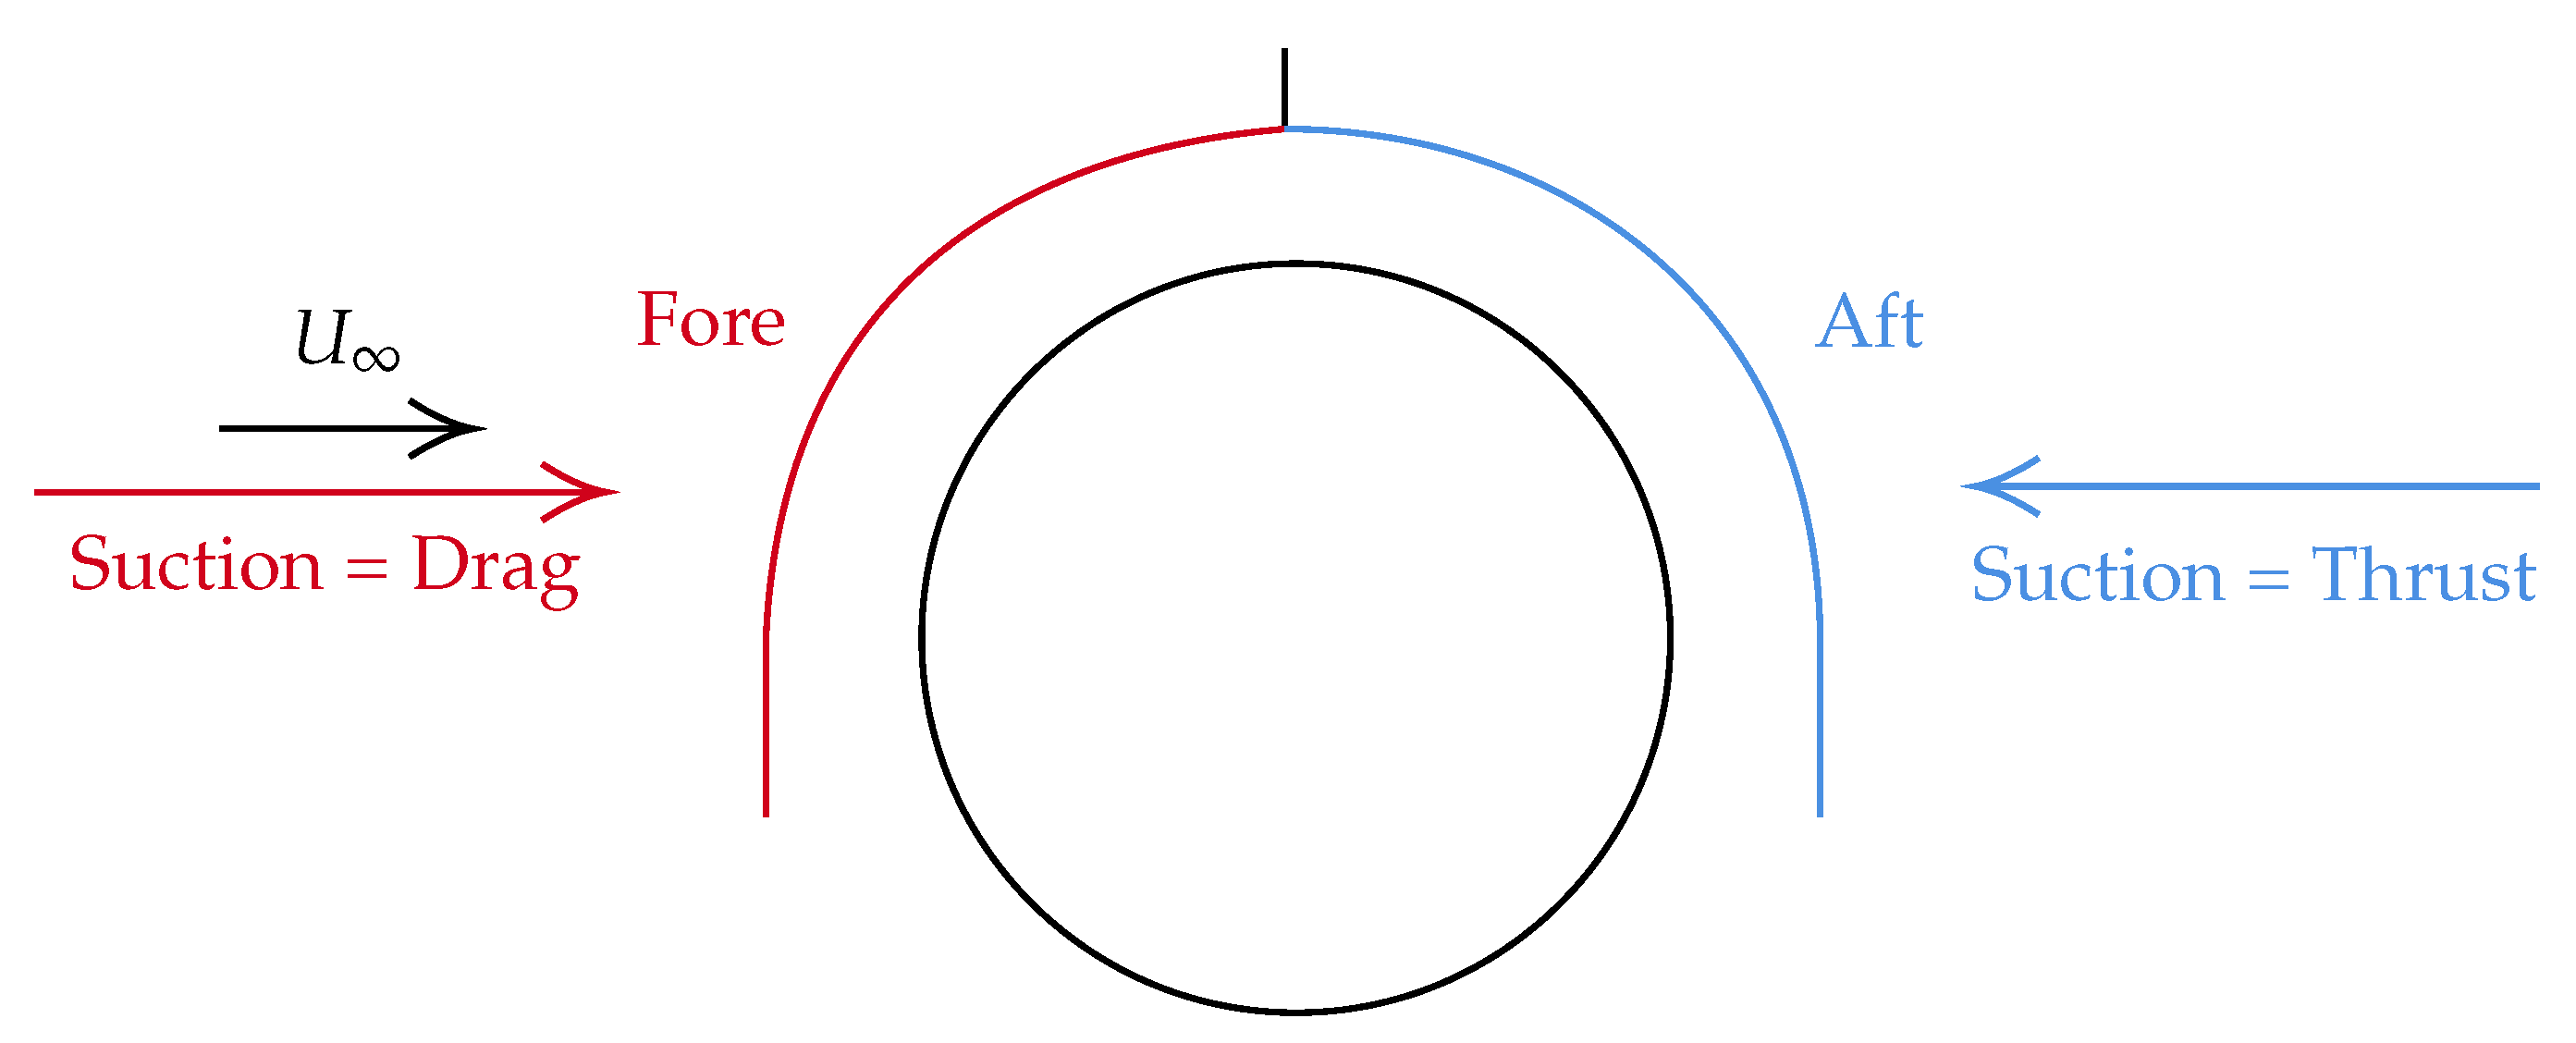
The breakdown of the drag computed from the CFD displayed that upon rotation, the wheel arch reduced from 0.011 to 0.010, whilst dropped from −0.025 to −0.031. More obvious in the CFD results, but also noticeable in the experimental data, the stationary plots are slightly lower overall in at the fore section and slightly higher in magnitude in the maximum region at the trailing edge. The broadly increasing pressure exhibited by the wheel arch with rotation can be used to show why the drag reduced and lift increased. Due to the curvature of the wheel arch, pressure effects such as suction have a different consequence depending on where it is acting. For example, a suction effect within the rear (aft) section of the wheel arch would provide an extra thrust to the system, whilst a suction at the front (fore section) would be detrimental, adding to the total drag; see Figure 21. Therefore, the main aim in reducing wheel arch drag would be to minimise the drag component differences of the exhibited pressure.
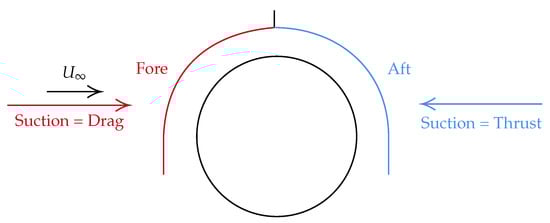
Figure 21.
Wheel arch pressure effect.
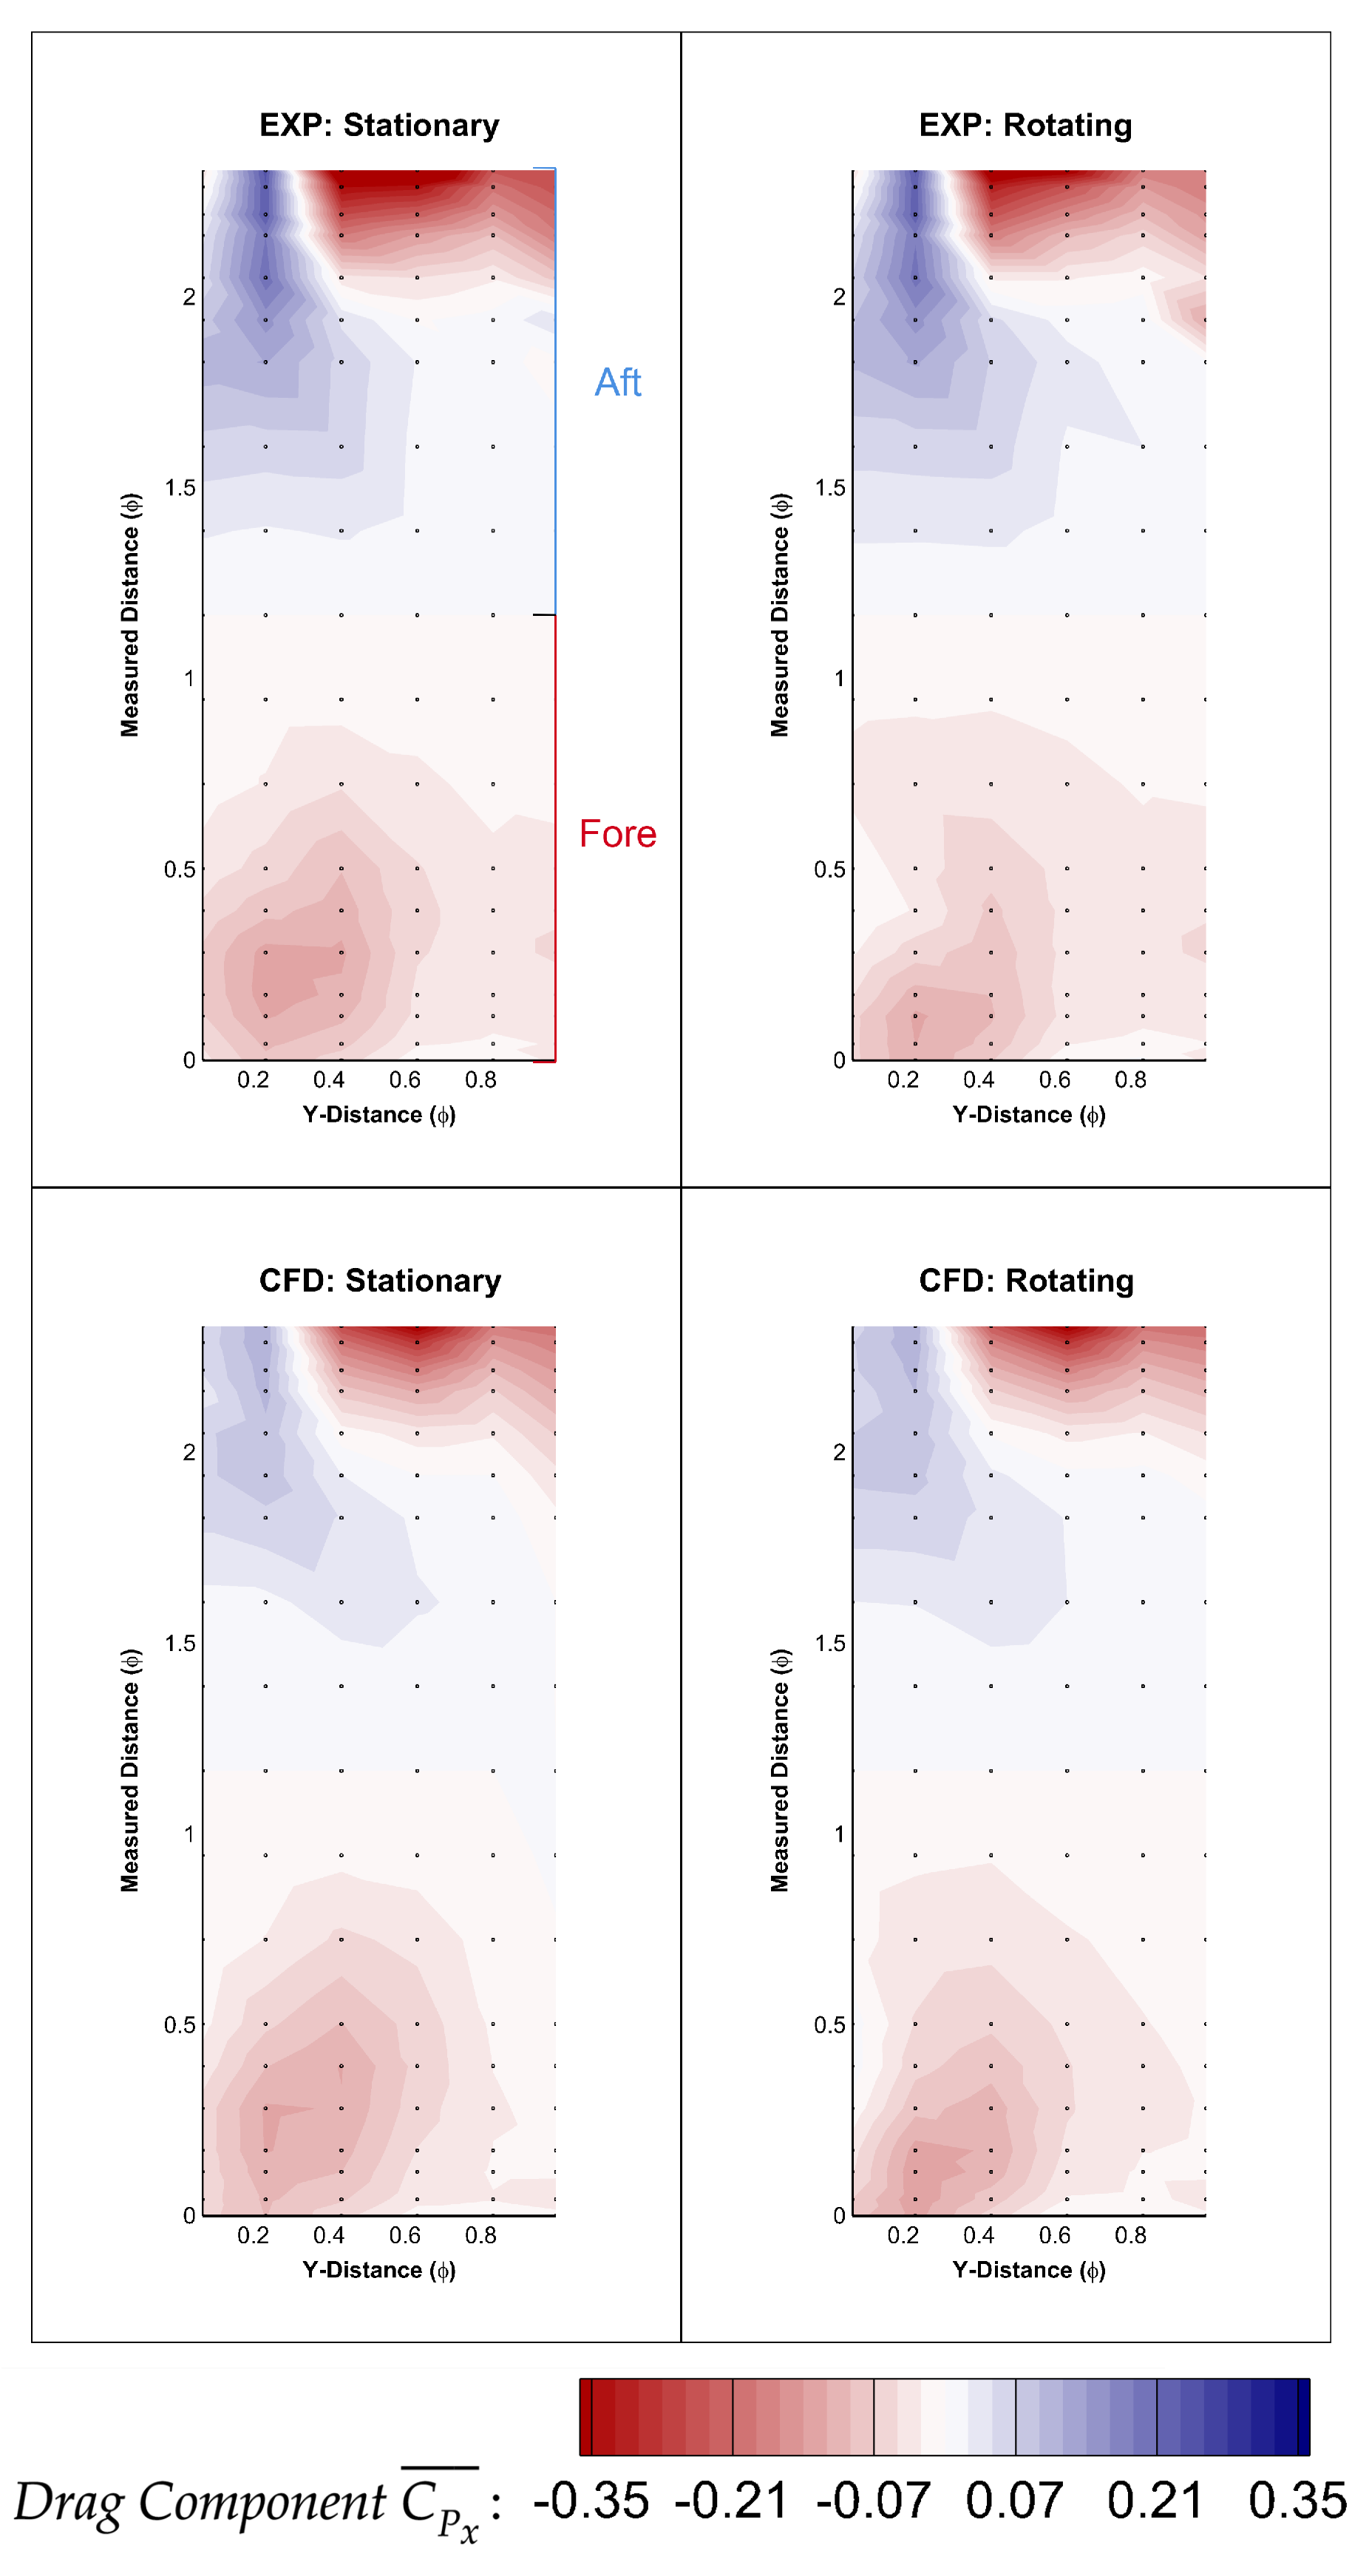
To show this comprehensively, wheelhouse pressures were converted to drag components of that pressure. This was done by setting a reference cylindrical coordinate system at the centre of the axle rod. The locations of the pressure tappings were exported as a function of radius and angle and the horizontal (drag) component of pressure was calculated using each point’s corresponding angle. The plots were then coloured so that red identified a region which was detrimental, adding to drag, and blue illustrated a beneficial thrust effect. These are displayed in Figure 22. One can see from these that the high pressure region at the trailing (aft) edge of the wheel arch is in fact detrimental to the reduction of drag and that the decreasing suction effect in the fore section when comparing the rotating to stationary wheel configuration could be determined as an explanation for the lower drag found. A decreased suction in this region can be attributed to the rotation of the wheel promoting earlier boundary layer separation on the wheel itself, creating the dominating Vortex A which contains the majority of outflow from the wheelhouse cavity. As Vortex A pulls more air out from the lower area of the cavity, the lower on the wheel arch the suction effects at the fore section occur.
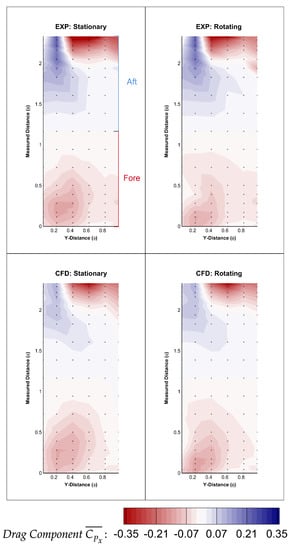
Figure 22.
Wheel arch pressures: experimental and computational, drag component.
It can thus be said, that from this initial validation case, the CFD showed good agreement with experimental data. This includes capturing the correct force and flow field trends, such as the reducing wheelhouse drag and increasing shear layer width upon rotation. The numerical calculations have been successfully used to aid in the understanding of the complex flow phenomena found within a wheel arch cavity complicated further by the rotation of the wheel. As this was the case, the following section looks at the effect of the wheel displacement on these particular factors.
4. Wheel Displacement
Wheelhouse Forces and Flow Behaviour
Table 5 and Table 6 display both the experimentally and computationally obtained force trends. Both stationary and rotating wheel configurations were tested experimentally with all data points in Table 5 compared against the flush (0 mm) rotating wheel; however, only a rotating wheel was simulated. Due to experimental geometry limitations but with confidence in the CFD output from the previous validation study, the +20 mm case was only tested numerically.
Table 5.
Experimental wheelhouse forces: rotating wheel displacement.
Table 6.
Computational wheelhouse forces: wheel displacement.
When comparing the experimental results, it is clear from Table 5 that the wheelhouse drag force reduces the further outboard the wheel moves. Rotation is also shown to reduce drag throughout the lateral sweep as expected. For the lift, a negative force was exhibited, and thus will be referred to as downforce. The wheelhouse downforce is shown to increase the further outboard the wheel is, this corroborates with the increasing volume and lift relationship found by Cogotti [9] and in part Fabijanic [14]. Fabijanic [14] found that lift decreased to a minimum the larger the wheelhouse depth, and then started to increase against when the depth of the wheelhouse to wheel ratio, , was more than 1.67. For this study the for the smallest (−10 mm) case is already 2.58, meaning that an extrapolation of the results in [14] would match those found in this study. Due to the different way the volume was changed in this work (wheel movement instead of cavity depth increase), increasing the depth and thus also the “free space” within the cavity, allows more of the underbody fluid jet to be pulled into the wheel arch area, where suction is clearly shown on the fore section of the wheel arch; see Figure 22 and Figure 23. However, as the wheel moves more outboard, the jetting effect on the outer edge becomes less suppressed, thus changing the interference effect with the underbody flow, explaining why there is a variation in lift. The changes in lift are less pronounced than those exhibited by the stationary wheel, this can also be ascribed to the underbody flow interacting with that of the jetting effect produced by the rotating wheel.
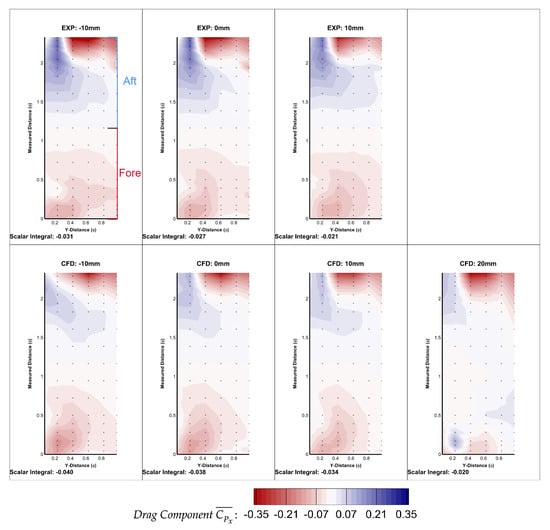
Figure 23.
Wheel displacement wheel arch pressures: experimental and computational, drag component.
Looking at the CFD results, shown in Table 6, one can see that the trend in for the wheelhouse matches well with the experiment. Both methodologies show a decreasing wheelhouse drag the further outboard the wheel moves. As explained previously, the +20 mm configuration was also tested numerically, but it is evident that the change in drag exhibited equates to only between this and the +10 mm point. As performed previously, the breakdown of drag contribution has been calculated and presented in Figure 16d. Between the best performing (+10 mm) and worst performing (+20 mm) cases, there is a total , . The increase in wheel and axle drag, , can be attributed to a larger amount of longitudinal airflow impinging on the fore wheel surface, this is shown in Figure 16d. This also affects the development of Vortex A, where the +20 mm configuration presents a later separation point and smaller separation bubble created over the wheel. This leads to a higher velocity outflow in the maximum outflow region, between the highest surface point of the wheel and wheel arch. The Q Criterion structure is also shown to extend further along the outboard side of the wheel, near the axle, illustrating more longitudinal separation originating from this point, albeit Figure 17c shows more separation down the entire vertical edge of the outboard side of the +10 mm wheel. The latter is also evident by the higher wall shear stress on the +20 mm wheel, Figure 17d, depicting more attached flow. However, with the +20 mm wheel situated further away from the +10 mm configuration outboard of the housing, it accounts for more general model separation, which equates to more total drag. This is also illustrated by the strengthening of the bottom ground plane vortex structures shown in Figure 19d. Both and R are stronger and larger by the furthest downstream plane, and a third vortex, has been identified. This is what was previously defined as the counter vortex to , by Krajnovic [11]. Therefore, as well as the through plane vortex, in Figure 20d, originates from the jetting vortices from the contact patch of the wheel. Figure 19d also better illustrates the deepening and strengthening of Vortex A over the top of the wheel.
When comparing the optimum +10 mm configuration with the baseline 0 mm, Figure 16c,d, respectively, it can be seen that the size of Vortex A is reduced. The lateral width of the shear layer is also smaller, even with taking into account the 10 mm displacement; see Figure 17c. This with Figure 19c illustrates the vast reduction of Vortex D to the right of the axle rod. In turn, this reduces the drag exhibited on the housing, .
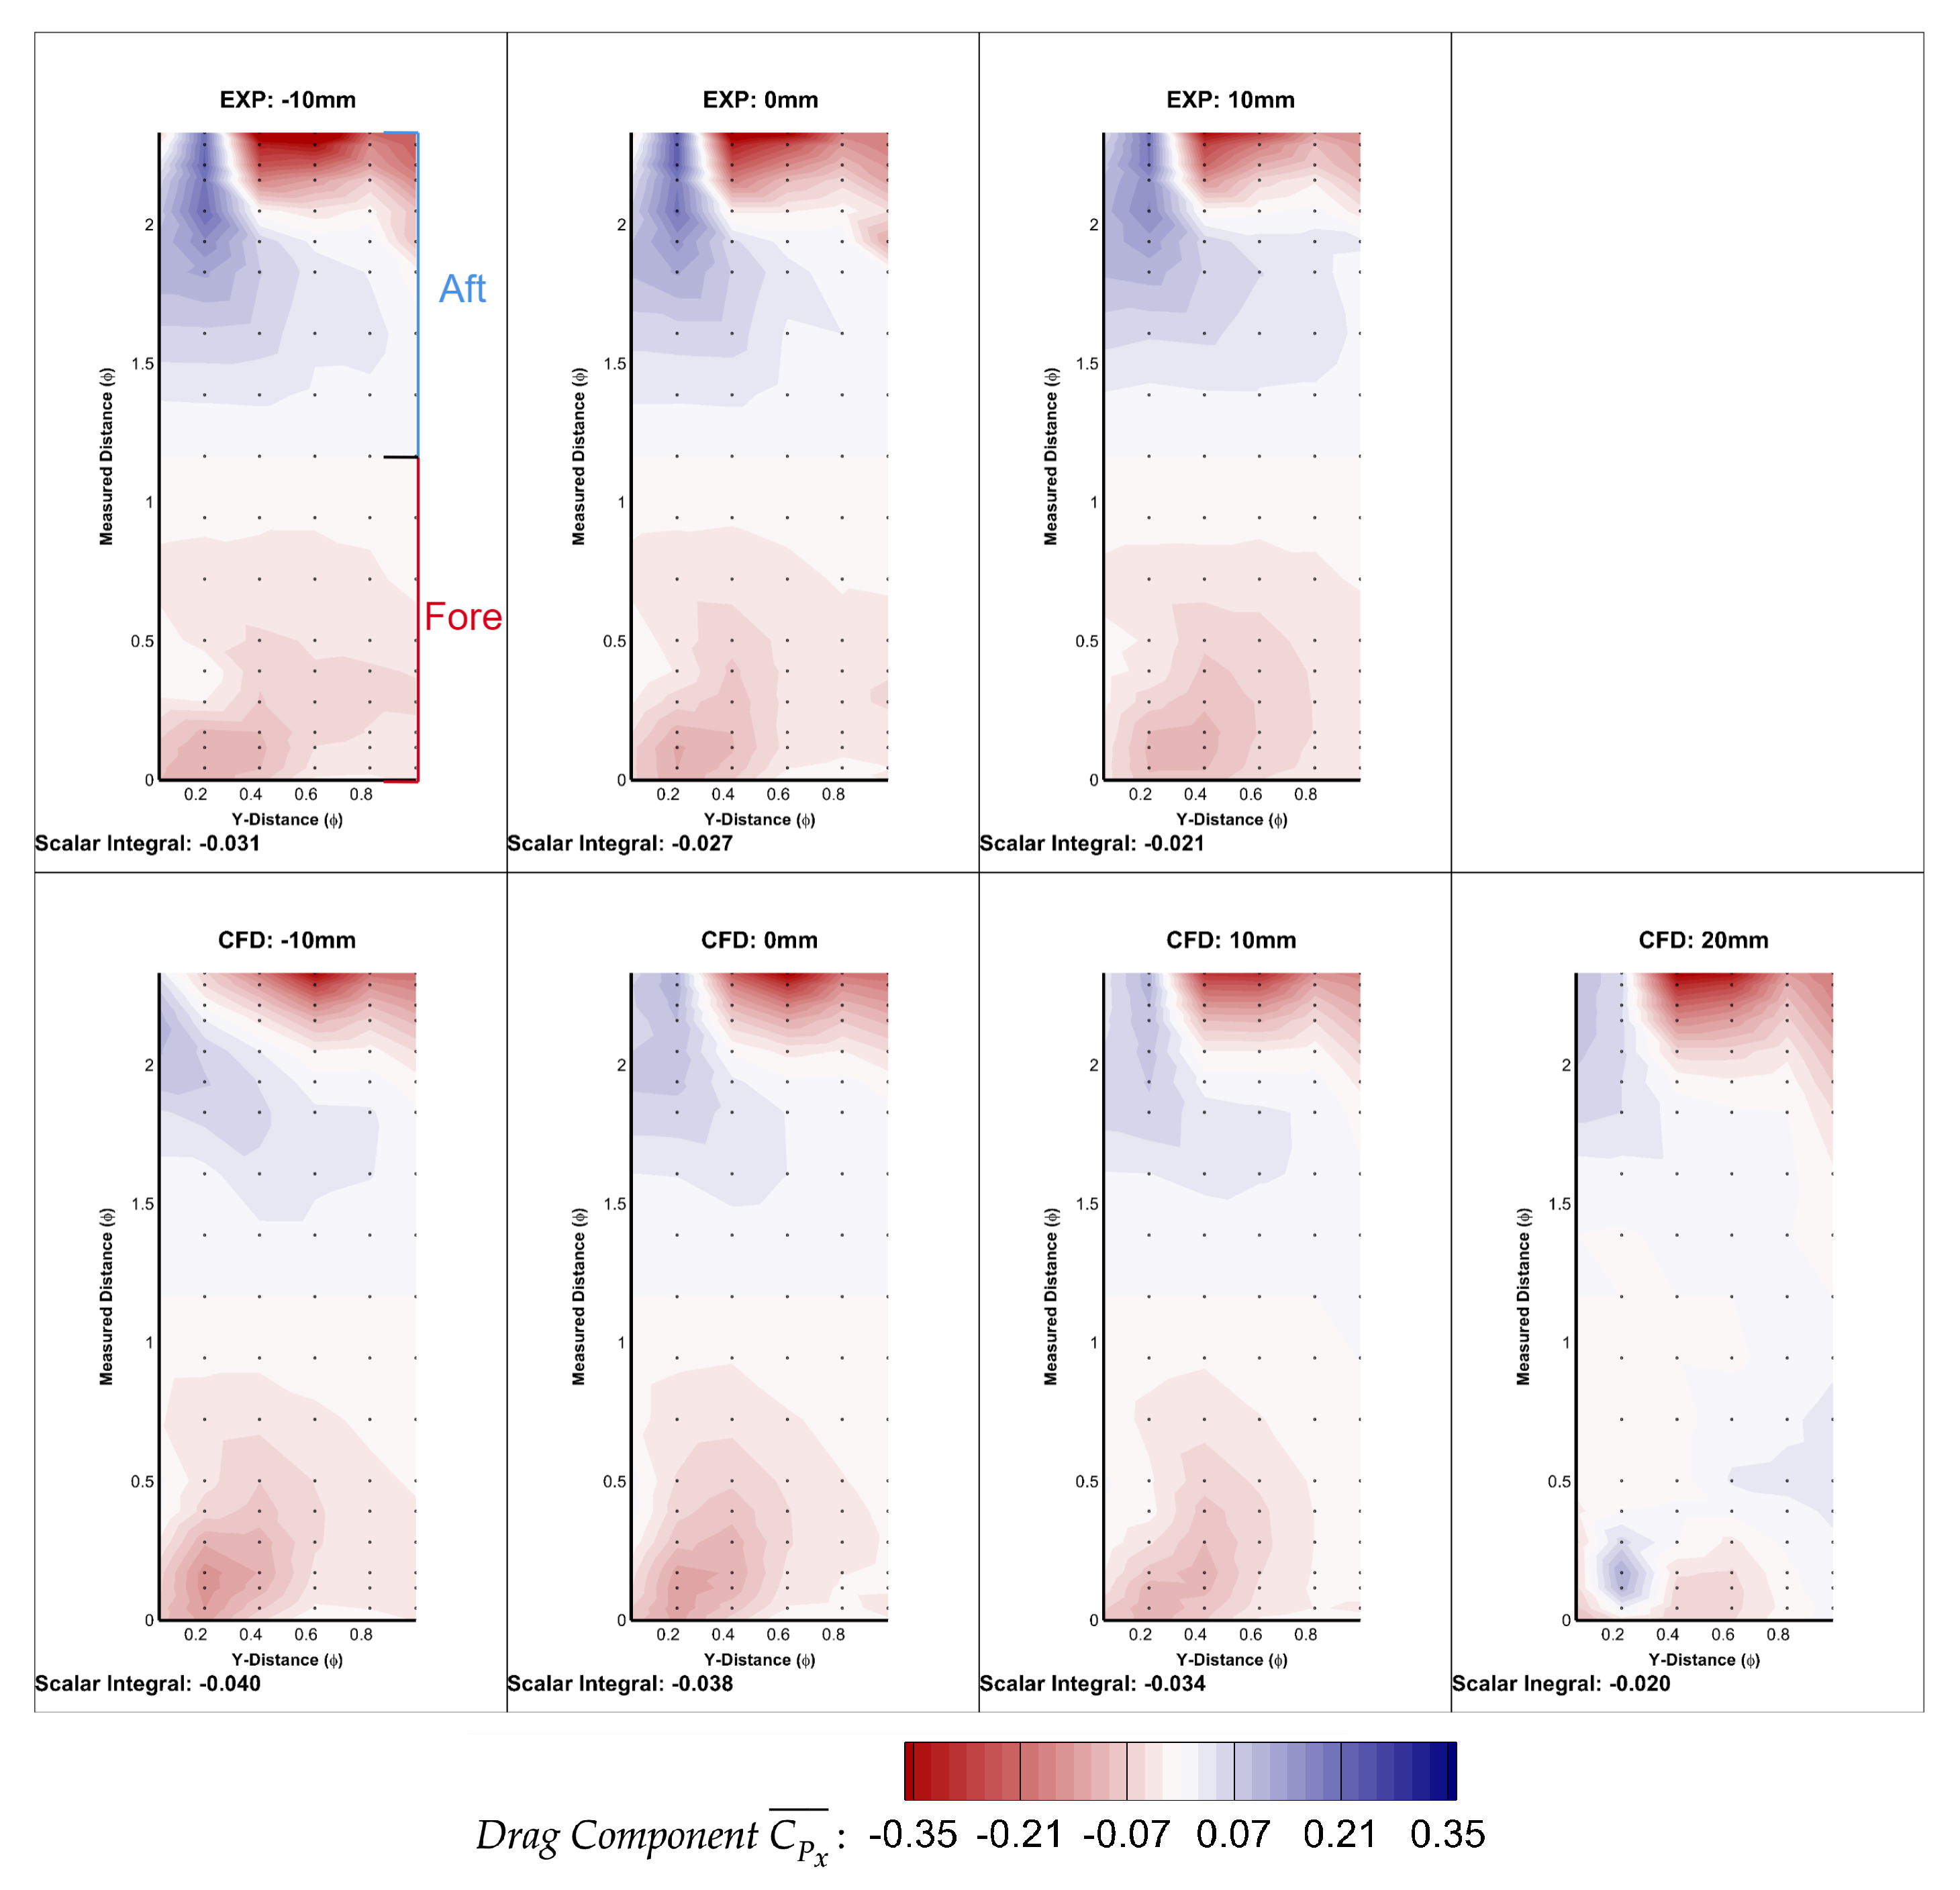
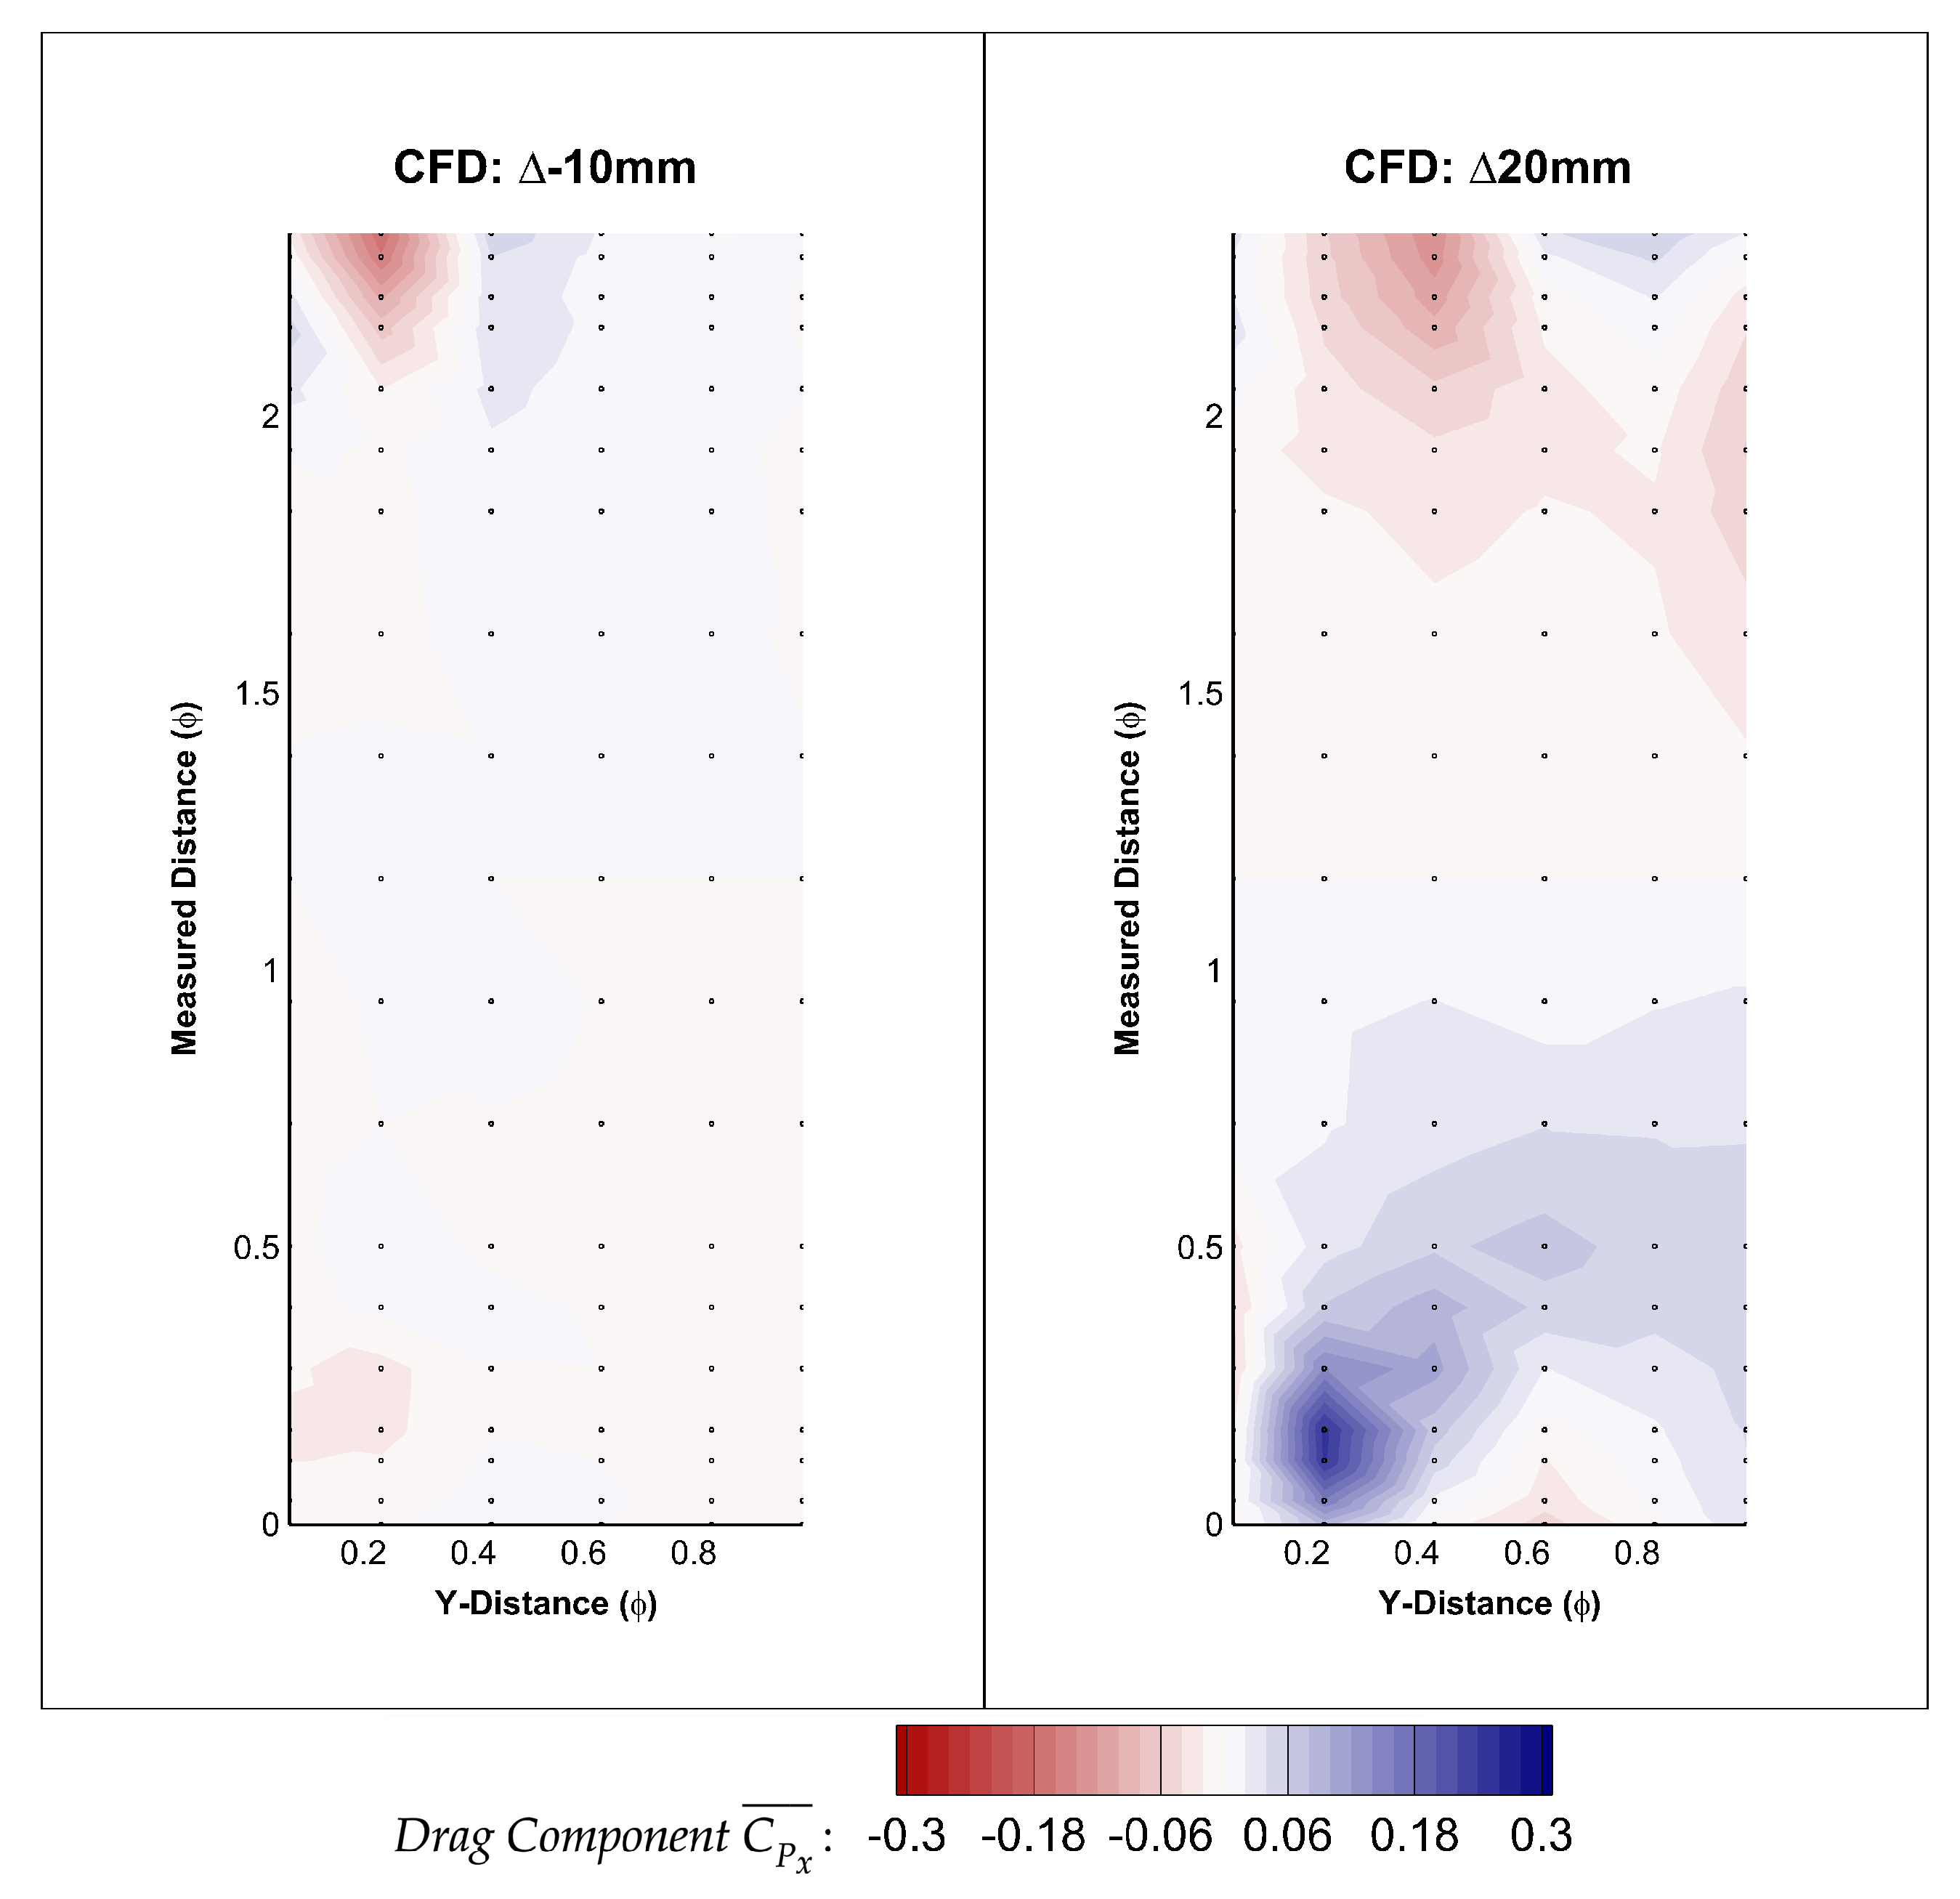
The graph in Figure 24 also shows the wheel arch drag reducing the further outboard the wheel was placed. Evidence of this is shown both experimentally and computationally in Figure 23. The difference between +20 mm and the baseline is displayed in Figure 25. The blue region on the fore section of the wheel arch equates to a reduction in the drag, enhancing suction found here; this, as well as the decrease of the thrust generating displayed towards the rear corresponds to a minimising of the general forces. Comparing this to +10 mm, more equalisation of the forces is evident.
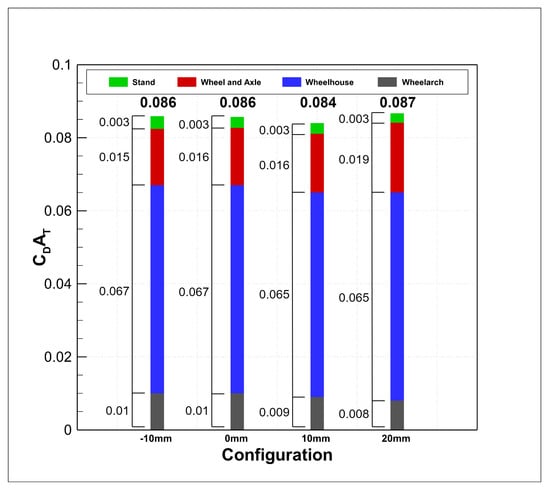
Figure 24.
CFD: rotating wheel displacement drag breakdown.
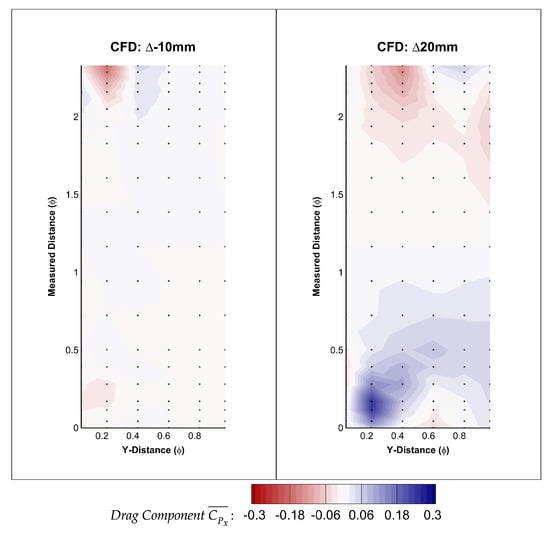
Figure 25.
Wheel displacement wheel arch pressures: CFD drag component.
5. Conclusions and Further Work
- The CFD showed good agreement with all trends of the experimental results, providing a validated numerical methodology.
- -
- These included balance, pressure and PIV comparisons.
- For both methodologies, a lower amount of wheelhouse drag was found generated when the wheel was rotating. However, the CFD showed that whilst this was the case, total drag increased. This was attributed to an increase of the wheel and axle drag, illustrated by the change in separation over the wheel itself when located within a wheelhouse and so overcompensating the reduction in body and stand drag.
- There are slight differences in vortex locations when comparing to previously-attained results. This is predominantly due to differences in geometry, such as blockage in the cavity or housing dimensions.
- Experimental and computational results showed that up to a 10 mm displacement outboard of the housing, overall drag decreased, implying that a minimum lies between 5 mm and 15 mm. The dominating reduction in housing drag was credited to the reduction of Vortices A and D. This causes the lateral width of the shear layer across the housing outboard side to be narrower.
- This has led to the conclusion that there are potential benefits to be gained when offsetting a solid wheel outboard of the longitudinal edge of a model housing.
- Beyond this critical point, drag begins to increase again due to the added detrimental contribution from flow impingement on the wheel, which overcomes the housing drag reduction.
- Whilst it is recognised that the presence of a moving ground plane minimally affects the global flow features of geometries such as a rotating isolated wheel [10], it is understood that other external features such as rounding of the square-edged wheels and ventilation from the inclusion of spokes would affect the flow field. Thus, the consequences of such factors will be examined in further research.
Author Contributions
Conceptualization, E.R. and D.W.; methodology, E.R.; software, E.R.; validation, E.R.; formal analysis, E.R.; investigation, E.R.; data curation, E.R.; writing, original draft preparation, E.R.; writing, review and editing, D.W.; visualization, E.R.; supervision, D.W.; project administration, D.W.
Funding
This research was funded by both Loughborough University and Jaguar Land Rover.
Acknowledgments
Both Martin Passmore and Jeff Howell must be acknowledged for their support and guidance from the beginning to the end of this piece of work.
Conflicts of Interest
The authors declare no conflict of interest. The funders had no role in the design of the study; in the collection, analyses, or interpretation of data; nor in the writing of the manuscript; but did have to approve the paper for publication.
References
- The European Parliament and the Council of the European Union. Regulation (EC) No 443/2009 of the European Parliament and of the Council; EU Regulation: Brussels, Belgium, 2009; pp. 1–15. [Google Scholar]
- Ahmed, S.R.; Ramm, G.; Faltin, G. Some Salient Features Of The Time-Averaged Ground Vehicle Wake. SAE Int. Congr. Expo. 1984. [Google Scholar] [CrossRef]
- Hucho, W.H. Aerodynamic Drag of Passenger Cars. In Aerodynamics of Road Vehicles; Butterworths: London, UK, 1987; pp. 106–213. [Google Scholar]
- Wickern, G.; Zwicker, K.; Pfadenhauer, M. Rotating Wheels—Their Impact on Wind Tunnel Test Techniques and on Vehicle Drag Results. SAE Tech. Pap. 1997. [Google Scholar] [CrossRef]
- Elofsson, P.; Bannister, M. Drag Reduction Mechanisms Due to Moving Ground and Wheel Rotation in Passenger Cars. SAE Trans. 2002, 111, 591–604. [Google Scholar]
- Morelli, A. Aerodynamic Effect on a Automobile Wheel. Tech. Rep. Trans. 1969, 47, 281–288. [Google Scholar]
- Croner, E.; Bézard, H.; Sicot, C.; Mothay, G. Aerodynamic Characterization of the Wake of an Isolated Rolling Wheel. Int. J. Heat Fluid Flow 2013, 43, 233–243. [Google Scholar] [CrossRef]
- Stapleford, W.R.; Carr, G.W. Aerodynamic Characteristics of Exposed Rotating Wheels. Tech. Rep. 1970, 2, 233–243. [Google Scholar] [CrossRef]
- Cogotti, A. Aerodynamic Characteristics of Car Wheels. Int. J. Veh. Des. 1983, 3, 173–196. [Google Scholar]
- Rajaratnam, E.; Walker, D. Experimental and Computational Study of the Flow around a Stationary and Rotating Isolated Wheel and the Influence of a Moving Ground Plane. SAE Int. 2019. [Google Scholar] [CrossRef]
- Krajnović, S.; Fernandes, J. Numerical Simulation of the Flow Around a Simplified Vehicle Model with Active Flow Control. Int. J. Heat Fluid Flow 2011, 32, 192–200. [Google Scholar] [CrossRef]
- Oswald, A.L.; Browne, L.J. The Airflow Field Around an Operating Tire and its Effect on Tire Power Loss. SAE Tech. Pap. 1981. [Google Scholar] [CrossRef]
- Mercker, E.; Breuer, N.; Berneburg, H.; Emmelmann, H.J. On the Aerodynamic Interference Due to the Rolling Wheels of Passenger Cars. SAE Trans. 1991, 100, 460–476. [Google Scholar] [CrossRef]
- Fabijanic, J. An Experimental Investigation of Wheel-Well Flows. SAE Tech. Pap. 1996. [Google Scholar] [CrossRef]
- Fackrell, J.E. The Aerodynamics of an Isolated Wheel Rotating in Contact with the Ground. Ph.D. Thesis, University of London, London, UK, 1974. [Google Scholar]
- Fackrell, J.E.; Harvey, J.K. The Aerodynamics of an Isolated Road Wheel. In Proceedings of the Second AIAA Symposium of Aerodynamics of Sports and Competition Automobiles; Pershing, B.: Los Angeles, CA, USA, 1975. [Google Scholar]
- Thivolle-Cazat, E.; Gilliéron, P. Flow Analysis Around a Rotating Wheel. In Proceedings of the 13th International Symposium on Applications of Laser Techniques to Fluid Mechanics, Lisbon, Portugal, 26–29 June 2006. [Google Scholar]
- Regert, T.; Lajos, T. Description of Flow Field in the Wheelhouses of Cars. Int. J. Heat Fluid Flow 2007, 2, 616–629. [Google Scholar] [CrossRef]
- Skea, A.F.; Bullen, P.R.; Qiao, J. CFD Simulations and Experimental Measurements of the Flow Over a Rotating Wheel in a Wheel Arch. SAE Tech. Pap. 2000. [Google Scholar] [CrossRef]
- Axon, L.; Garry, K.; Howell, J. The Influence of Ground Condition on the Flow Around a Wheel Located Within a Wheelhouse Cavity. SAE Tech. Pap. 1999. [Google Scholar] [CrossRef]
- Jeong, J.; Hussain, F. On the Identification of a Vortex. J. Fluid Mech. 1995, 285, 69–94. [Google Scholar] [CrossRef]
- Knowles, R.; Saddington, A.; Knowles, K. On the Near Wake of Rotating, 40%-Scale Champ Car Wheels. SAE Trans. 2002, 111, 2245–2253. [Google Scholar]
- McManus, J.; Zhang, X. A Computational Study of the Flow Around an Isolated Wheel in Contact with Ground. ASME J. Eng. 2006, 128, 520–530. [Google Scholar] [CrossRef]
- Gulyás, A.; Bodor, Á.; Regert, T.; Jánosi, I.M. PIV Measurement of the Flow Past a Generic Car Body with Wheels at LES Applicable Reynolds Number. Int. J. Heat Fluid Flow 2013, 43, 220–232. [Google Scholar] [CrossRef]
- Wittmeier, F.; Willey, P.; Kuthada, T.; Widdecke, N.; Wiedemann, J. Classification of Aerodynamic Tyre Characteristics. In Proceedings of the International Vehicle Aerodynamics Conference, Loughborough, UK, 14–15 October 2014; pp. 175–185. [Google Scholar] [CrossRef]
- Guilmineau, E.; Bo Deng, G.; Leroyer, A.; Queutey, P.; Visonneau, M.; Wackers, J. Assessment of RANS and DES Methds for the Ahmed Body. In Proceedings of the ECCOMAS Congress 2016, Crete Island, Greece, 5–10 June 2016; pp. 912–921. [Google Scholar] [CrossRef]
- Johl, G.S.; Passmore, M.A.; Render, P.M. Design Methodology and Performance of an Indraft Wind Tunnel. Aeronaut. J. 2004, 108, 465–473. [Google Scholar] [CrossRef]
- Newnham, P.S. The Influence of Turbulence on the Aerodynamic Optimisation of Bluff Body Road Vehicles. Ph.D. Thesis, Loughborough University, Loughborough, UK, 2007. [Google Scholar]
- Wäschle, A.; Cyr, S.; Kuthada, T.; Wiedemann, J. Flow around an Isolated Wheel - Experimental and Numerical Comparison of Two CFD Codes. SAE Int. 2004. [Google Scholar] [CrossRef]
- Mears, A.P.; Crossland, S.C.; Dominy, R.G. An Investigation into the Flow-Field About an Exposed Racing Wheel. SAE Int. 2004. [Google Scholar] [CrossRef]
- Wäschle, A. The Influence of Rotating Wheels on Vehicle Aerodynamics—Numerical and Experimental Investigations. SAE Int. 2007. [Google Scholar] [CrossRef]
- Siemens. STAR-CCM+: User Guide (Version 11.04). 2019. Available online: https://mdx.plm.automation.siemens.com/star-ccm-plus (accessed on 15 July 2019).
- Cappelli, D.; Mansour, N.N. Performance of Reynolds Averaged Navier-Stokes models in Predicting Separated Flows: Study of the Hump Flow Model Problem. In Proceedings of the 31st AIAA Applied Aerodynamics Conference, San Diego, CA, USA, 24–27 June 2013. [Google Scholar]
- Rumsey, C.; Gatski, T.; Sellers, W.; Vatsa, V.; Viken, S. Summary of the 2004 CFD Validation Workshop on Synthetic Jets and Turbulent Separation Control. In Proceedings of the 2nd AIAA Flow Control Conference, Portland, OR, USA, 28 June–1 July 2004. [Google Scholar]


© 2019 by the authors. Licensee MDPI, Basel, Switzerland. This article is an open access article distributed under the terms and conditions of the Creative Commons Attribution (CC BY) license (http://creativecommons.org/licenses/by/4.0/).