Article

Cranking Capability Estimation Algorithm Based on Modeling and Online Update of Model Parameters for Li-Ion SLI Batteries

1
Department of Electrical and Computer Engineering, Sungkyunkwan University, 2066, Seobu-ro, Jangan-gu, Suwon-si, Gyeonggi-do 16419, Korea
2
Energy Convergence Research Center, Korea Electronics Technology Institute (KETI), 226, Cheomdangwagi-ro, Buk-gu, Gwangju 61011, Korea
*
Author to whom correspondence should be addressed.
Energies 2019, 12(17), 3365; https://doi.org/10.3390/en12173365
Submission received: 2 August 2019 / Revised: 25 August 2019 / Accepted: 29 August 2019 / Published: 1 September 2019
(This article belongs to the Section D: Energy Storage and Application)

Abstract

:
The terminal voltage of a starting–lighting–ignition (SLI) battery can decrease to a value lower than the allowable voltage range because of the high discharge current required to crank the engine of a vehicle. To avoid the safety problems generated by this voltage drop, this paper proposes a cranking capability estimation algorithm. The proposed algorithm includes an equivalent circuit model for describing the instantaneous voltage response to the cranking current profile. This algorithm predicts the minimum value of the terminal voltage for the cranking transient period by analyzing the polarization voltage and dynamic characteristic of the equivalent circuit model. The estimation accuracy is adjusted by an online update for the parameters of the equivalent circuit model, which varies with temperature, aging, and other factors. The proposed algorithm was validated by experiments with a 60Ah LiFePO4-type SLI battery.

1. Introduction

A starting–lighting–ignition (SLI) battery is used to supply power to operate the electrical devices and implement the electrical loads of a vehicle. The rapid expansion of the electrical functions and devices in vehicles has accelerated the need for accurate state estimation algorithms for SLI batteries [1,2,3,4,5]. In particular, a state-of-function (SOF) algorithm that determines the cranking capability of the SLI battery is necessary because the steep voltage drop associated with an instantaneous discharge current can decrease the terminal voltage (vterminal) beyond the lower-limit voltage (Vlimit), as shown in Figure 1. Moreover, the reliable estimation of SOF is becoming more important because contemporary vehicles generate more frequent cranking by an idle stop and go (ISG) process, which automatically stops and recranks the engine to reduce the amount of time the engine spends idling [6,7].
SOF is defined as the minimum value of the terminal voltage reached for the cranking transient period. SOF can be calculated as follows:
S O F = V t 0 V drop
where Vt0 is the relaxation voltage immediately before cranking the engine, and Vdrop indicates the voltage drop when the engine is cranked, as shown in Figure 1. This SOF is compared with the lower limit voltage to determine that the engine is permitted to be stopped or keeps running to charge the SLI battery. Therefore, in order to estimate SOF, Vt0 and Vdrop should be predicted in real time.
Vt0 is associated with the polarization voltage that makes the relaxation voltage change although there is no current applied on the battery [8,9,10]. This polarization voltage causes SOF to vary according to when the driver attempts to crank the engine. Therefore, there is a need for a Vt0 prediction method to determine the cranking capability whenever the driver attempts to crank. The Vdrop in Equation (1) can be predicted by calculating the voltage induced at the internal impedance of an equivalent circuit model (ECM) when the cranking current profile is applied. Thus, the ECM and ECM parameters that can describe the instantaneous voltage response are required to accurately calculate Vdrop. Moreover, an online update process for ECM parameters is necessary because ECM parameters change nonlinearly according to operating conditions such as temperature and aging [11,12,13,14].
In conventional studies, many ECMs for Li-ion batteries and ECM parameter identification methods have been proposed for battery management system (BMS) applications: the high-order resistor–capacitor (RC)-ladder model, Randle model, Thevenin model, and partial differential equations model [15,16,17,18,19,20,21]. These models are sufficiently reliable for general state estimation algorithms, such as state-of-charge (SOC) and state-of-health (SOH), but not directly applicable to SOF, which is required to simulate the fast voltage response.
In [22,23,24], the characteristics of the cranking load were analyzed, and an ECM for simulating voltage during cranking transient was proposed. However, [22] analyzed just the cranking loads, and [23] and [24] focused on estimating SOH using the internal resistance extracted from the voltage drop measured during cranking transient, rather than SOF. Moreover, in [25], an online electrochemical impedance spectroscopy (EIS) technique to extract the parameters of the ECM was utilized, and the extracted parameters were used to estimate the voltage drop caused by cranking. However, this algorithm is inefficient because it requires analysis of the entire frequency range to identify all of the ECM parameters. In [26] and [27], a fractional model was used for battery modeling, and the terminal voltage during cranking transient was simulated with high accuracy. However, this method cannot predict SOF before cranking is attempted because the parameters for the fractional model are extracted based on the measured terminal current and voltage during the cranking transient period. Moreover, conventional studies of SOF algorithms are difficult to apply directly to Li-ion batteries, which have high energy and power density, because these methods have been designed for lead–acid batteries [28,29].
This paper proposes a SOF estimation algorithm for Li-ion batteries that predicts Vt0 and Vdrop in Equation (1) with an online update process for ECM parameters. The rest of the paper is structured as follows. In Section 2, a new ECM that can be used to accurately describe the instantaneous voltage response to the cranking current is presented. Section 3 proposes a prediction method for Vt0 in order to estimate SOF considering the polarization voltage response to the applied current. Additionally, Vdrop is calculated using the parameters of the proposed ECM with the cranking current profile. Moreover, an online update process for ECM parameters is suggested based on the analysis of dynamic characteristics of the proposed ECM. To validate the developed SOF estimation algorithm, experiments performed with a LiFePO4 (LFP)-type SLI battery installed on a vehicle are discussed in Section 4. Section 5 concludes the paper.

2. Equivalent Circuit Model for SOF Estimation

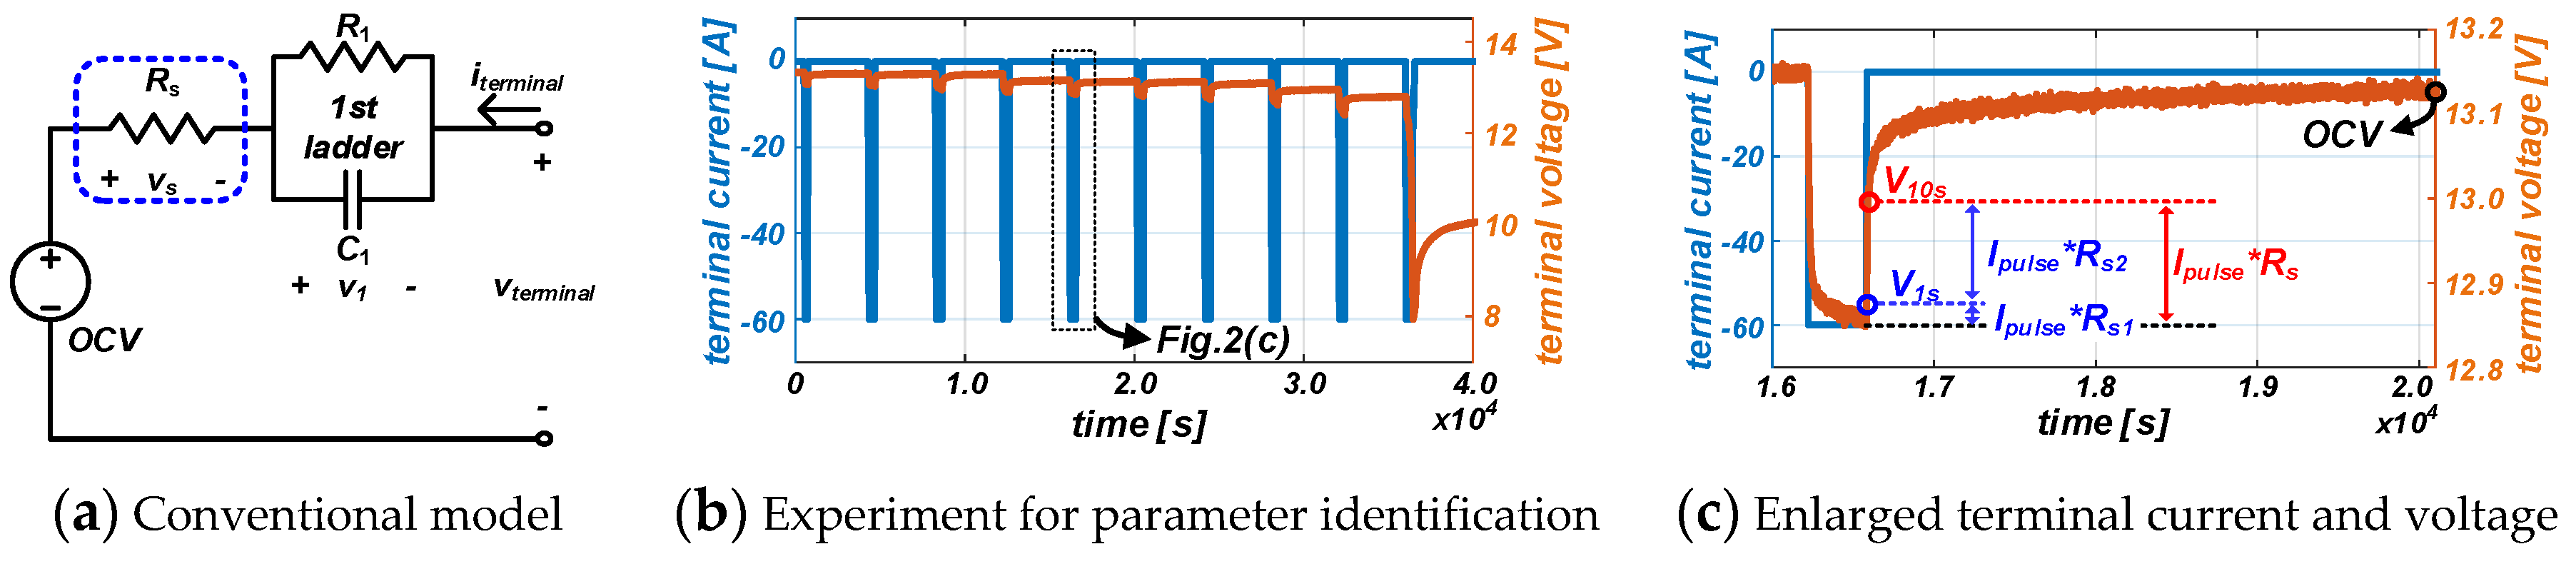
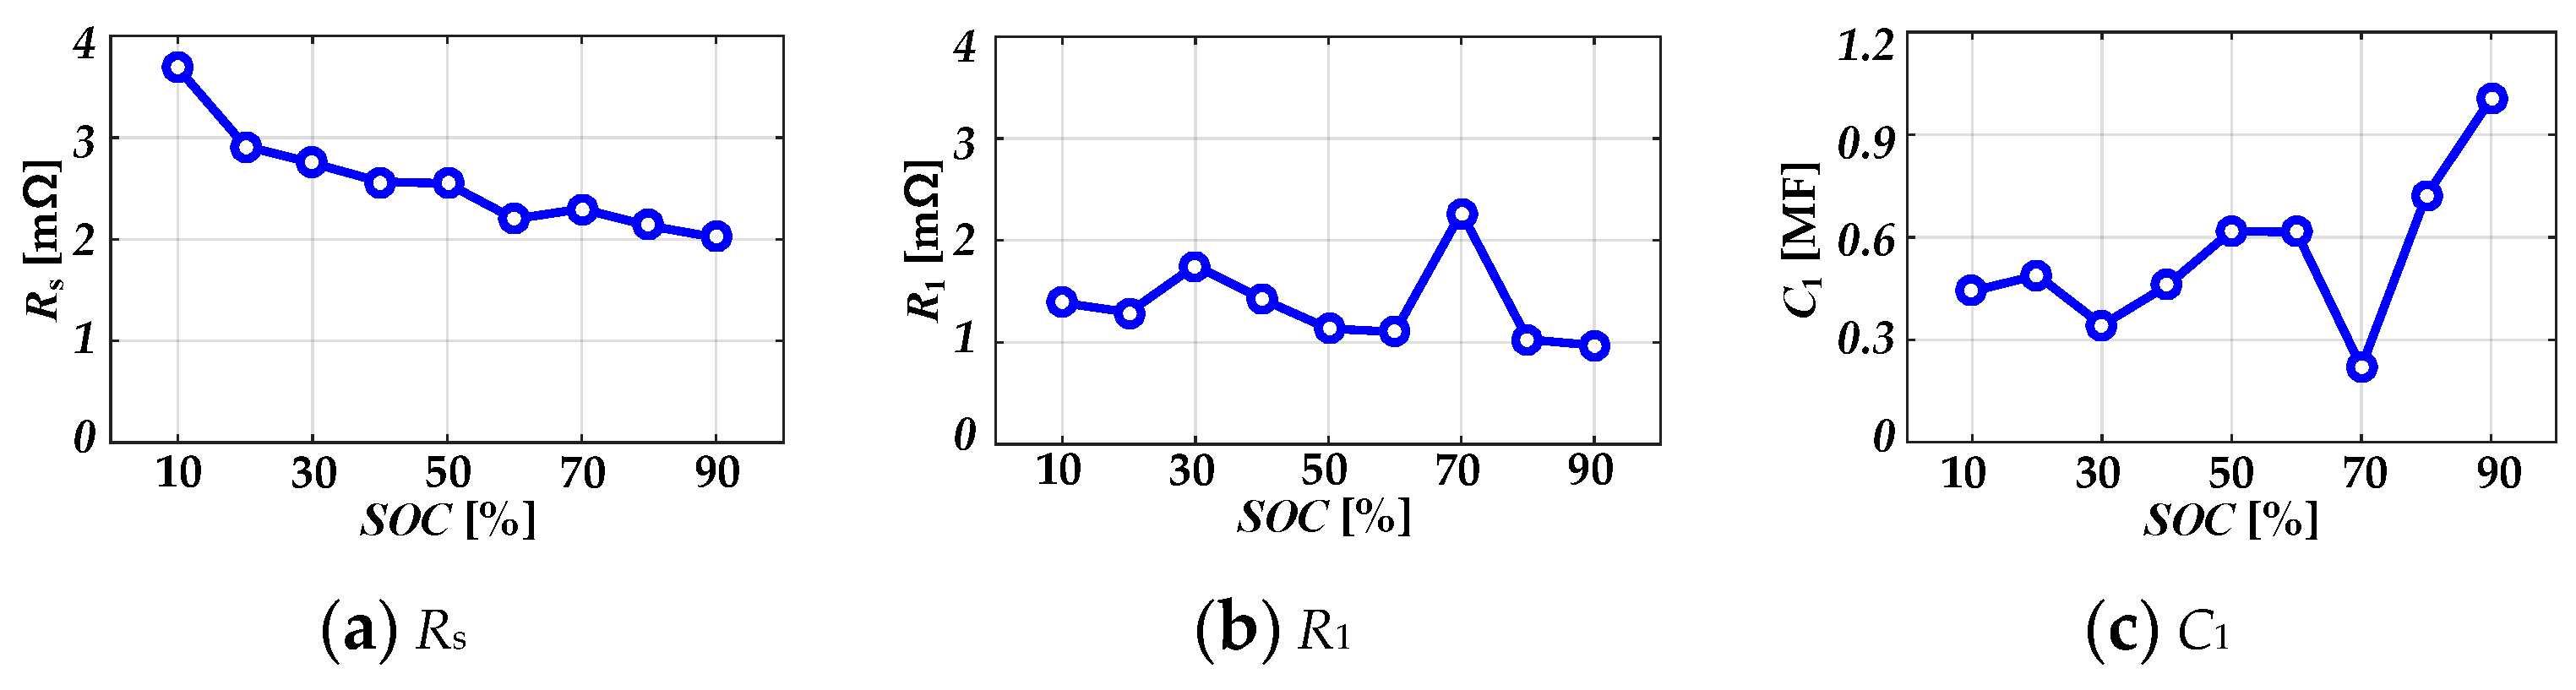
2.1. Conventional Model Based on 1st RC-Ladder

Figure 2a shows a conventional ECM based on the 1st RC-ladder, which consists of Rs, R1, and C1. Rs denotes the internal resistance of the battery and describes the ohmic voltage drop generated by an instantaneous change in the terminal current [15,16,17,18,19,20,21]. Moreover, the 1st RC-ladder simulates the polarization voltage as the curve of the exponential function, of which the time constant is determined by R1 and C1. The parameters are identified using the current profile shown in Figure 2b, which repeats a discharge with a pulsed current and relaxation for an hour until the battery is discharged from SOC 90% to 10%.
Rs is determined by Ohm’s law between the variation of the terminal voltage and current for 10 s after the SLI battery is allowed to relax, as follows:
R s   =   V 10 s V 0 s I pulse
where V0s and V10s indicate the terminal voltage immediately before starting the relaxation and after 10 s, respectively, and Ipulse represents the magnitude of the pulsed current used in the experiment, as shown in Figure 2c. This time condition, 10 s, is typically used to extract Rs under a hybrid pulse power characterization (HPPC) test, which identifies the power performance of batteries [30,31]. Open-circuit voltage (OCV), R1, and C1 can be identified by fitting the relaxation curve of the terminal voltage measured after 10 s to the voltage equation of ECM. Figure 3a–c shows Rs, R1, and C1 of the SLI battery, extracted by a charging and discharging test unit in Section 4.
This ECM is widely used for state estimation algorithms, such as SOC and SOH, because it can describe the voltage response with high accuracy when the SLI battery supplies the power to the general electrical devices and functions in a vehicle. However, this ECM has limited applicability to the SOF algorithm as the ECM for the SOF algorithm is required to describe an instantaneous voltage response that is generated for a much shorter period than the 10 s used to identify Rs and the time constant of the 1st RC-ladder.

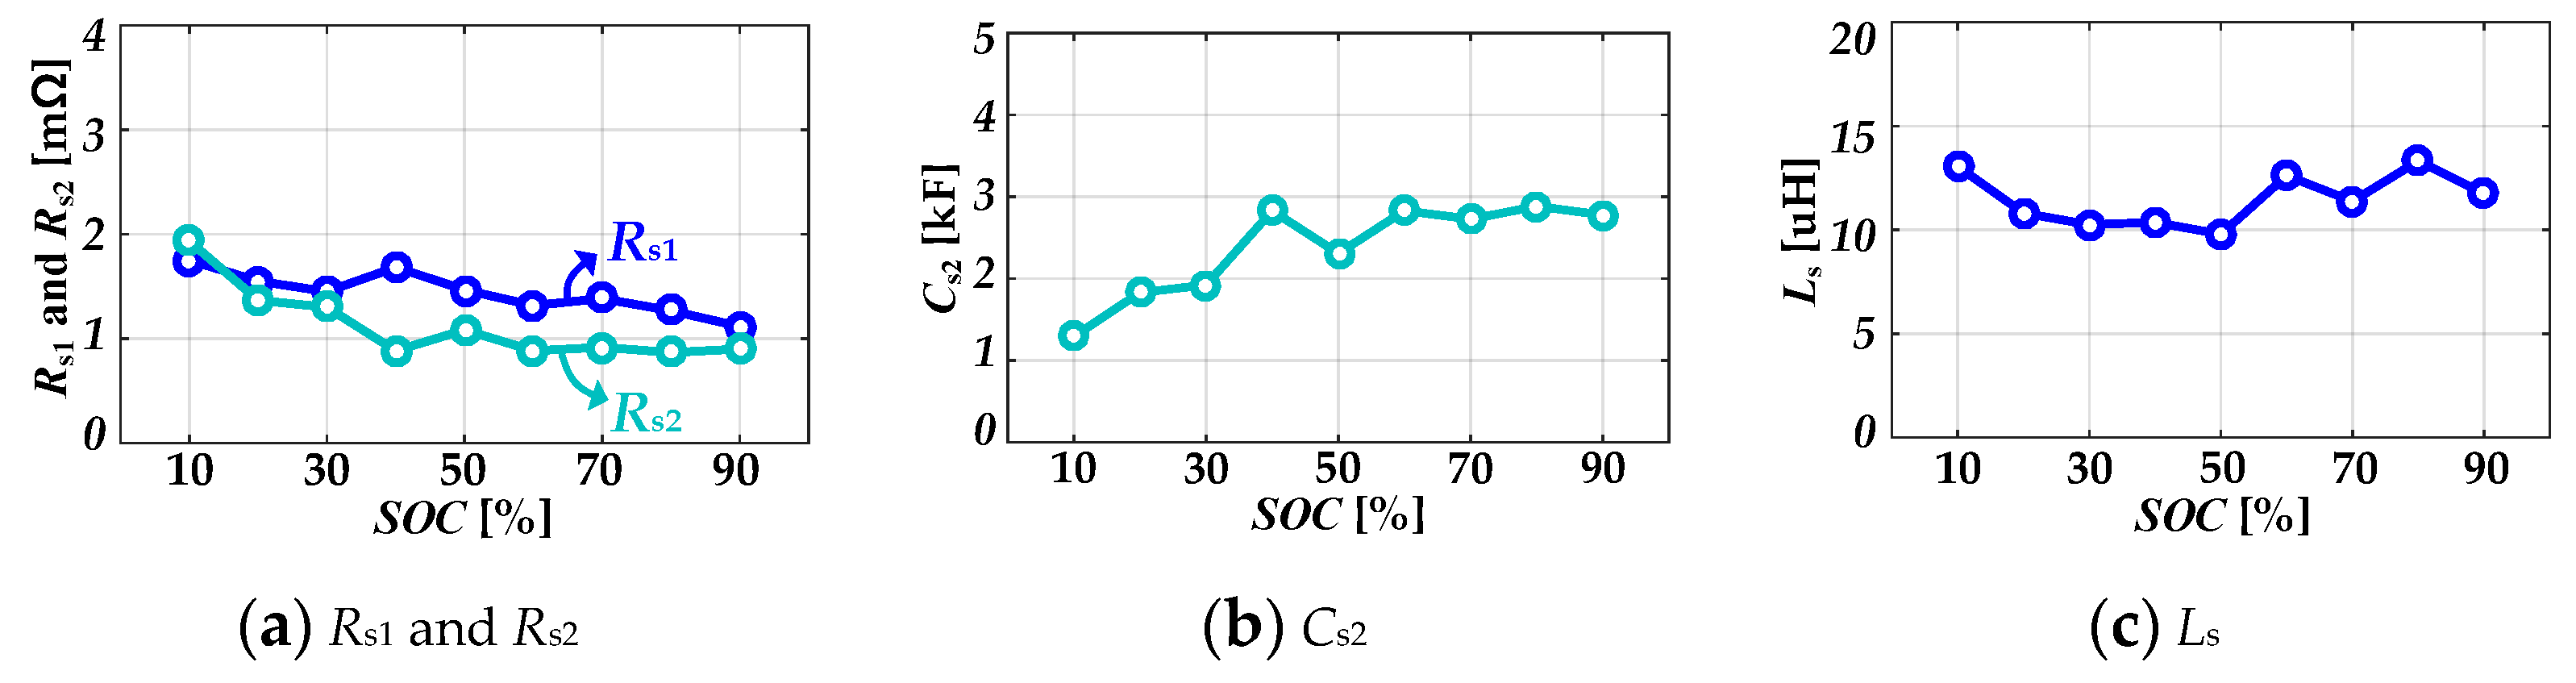
2.2. Proposed Equivalent Circuit Model for SOF Estimation

This paper proposes an ECM expanded on the basis of the conventional model to describe the fast voltage response for SOF estimation, as shown in Figure 4. The proposed model divides Rs in the conventional model into Rs1 and another RC-ladder consisting of Rs2 and Cs2 (s-ladder). Additionally, the stray inductance (Ls) is added to the ECM because the sharp slope of the cranking current profile can cause an additional voltage drop, which can be ignored in the general driving profile.
In order to describe instantaneous voltage changes, Rs1 is extracted using an ohmic drop for 1 s (V1s), the shortest sampling period of the charging and discharging test unit, as shown in Equation (3). Considering that Rs1 and the s-ladder are separated from Rs in the conventional model, the total resistance of Rs1 and Rs2 should be equal to Rs. Moreover, the time constant of the s-ladder (τs2) has to be determined as a quarter of 10 s to saturate the s-ladder 10 s after the pulsed current is applied, as shown in Equations (4) and (5):
R s 1   =   V 1 s V 0 s I pulse ,
R s 2 = R s R s 1 ,
and   C s 2 = τ s 2 R s 2 = 10 s × 1 4 R s 2 .
In order to identify Ls, the voltage induced at Ls (vLs) that is generated by the slope of the terminal current should be analyzed. vLs can be measured at the transient period when the terminal current decreases or increases with a slope caused by the settling time of the charging and discharging test unit. Figure 5a,b shows the conceptual figures of a part of the parameter identification experiment during the transient period when the terminal current changes from Ipulse to 0 A.
As shown in Figure 5b, vLs occurs only until the terminal current reaches 0 A, and OCV, v1, and vs2 can be assumed to be constant considering the brevity of this settling time. Thus, Ls can be calculated using the change in vLs (∆vLs) measured from the terminal voltage immediately before the terminal current becomes 0 A, as follows:
L s = Δ v L s d t d i terminal .
The parameter extraction results of the proposed model are shown in Figure 6a–c.
In order to verify the accuracy of ECMs, a cranking experiment was performed after the SLI battery was charged to SOC 70% at 20 °C, as shown in Figure 7a, and the measured terminal voltage was compared with the voltage simulated by the conventional and proposed ECM. Figure 7b shows that the proposed model had an accuracy of 96.73%, which is 23.56% higher than the conventional model for estimating SOF. Conversely, after the engine was cranked completely, the conventional model was more accurate than the proposed ECM, as shown in Figure 7c. Therefore, it is more suitable to apply the proposed model for SOF estimation, although the conventional model is used to estimate general state factors such as SOC and SOH.
Figure 8 shows the proportions of the voltages induced at each impedance component according to ECMs when Vdrop, 2.17 V, was simulated. In the proposed model, vs1 and vLs accounted for most of the Vdrop (98.9%). Conversely, the voltages induced at the s-ladder and 1st RC-ladder (vs2 and v1) occupied very small fractions of 1.1% because the time constant of each ladder was too large to generate a significant voltage response to the cranking current profile. Thus, the proposed model was simplified by neglecting the s-ladder and 1st RC-ladder, as shown in Figure 4, and the simplified model had an accuracy of 95.71%, similar to the expanded model, as shown in Figure 7b and Figure 8.

3. Proposed SOF Estimation Algorithm with Online Update of ECM Parameters

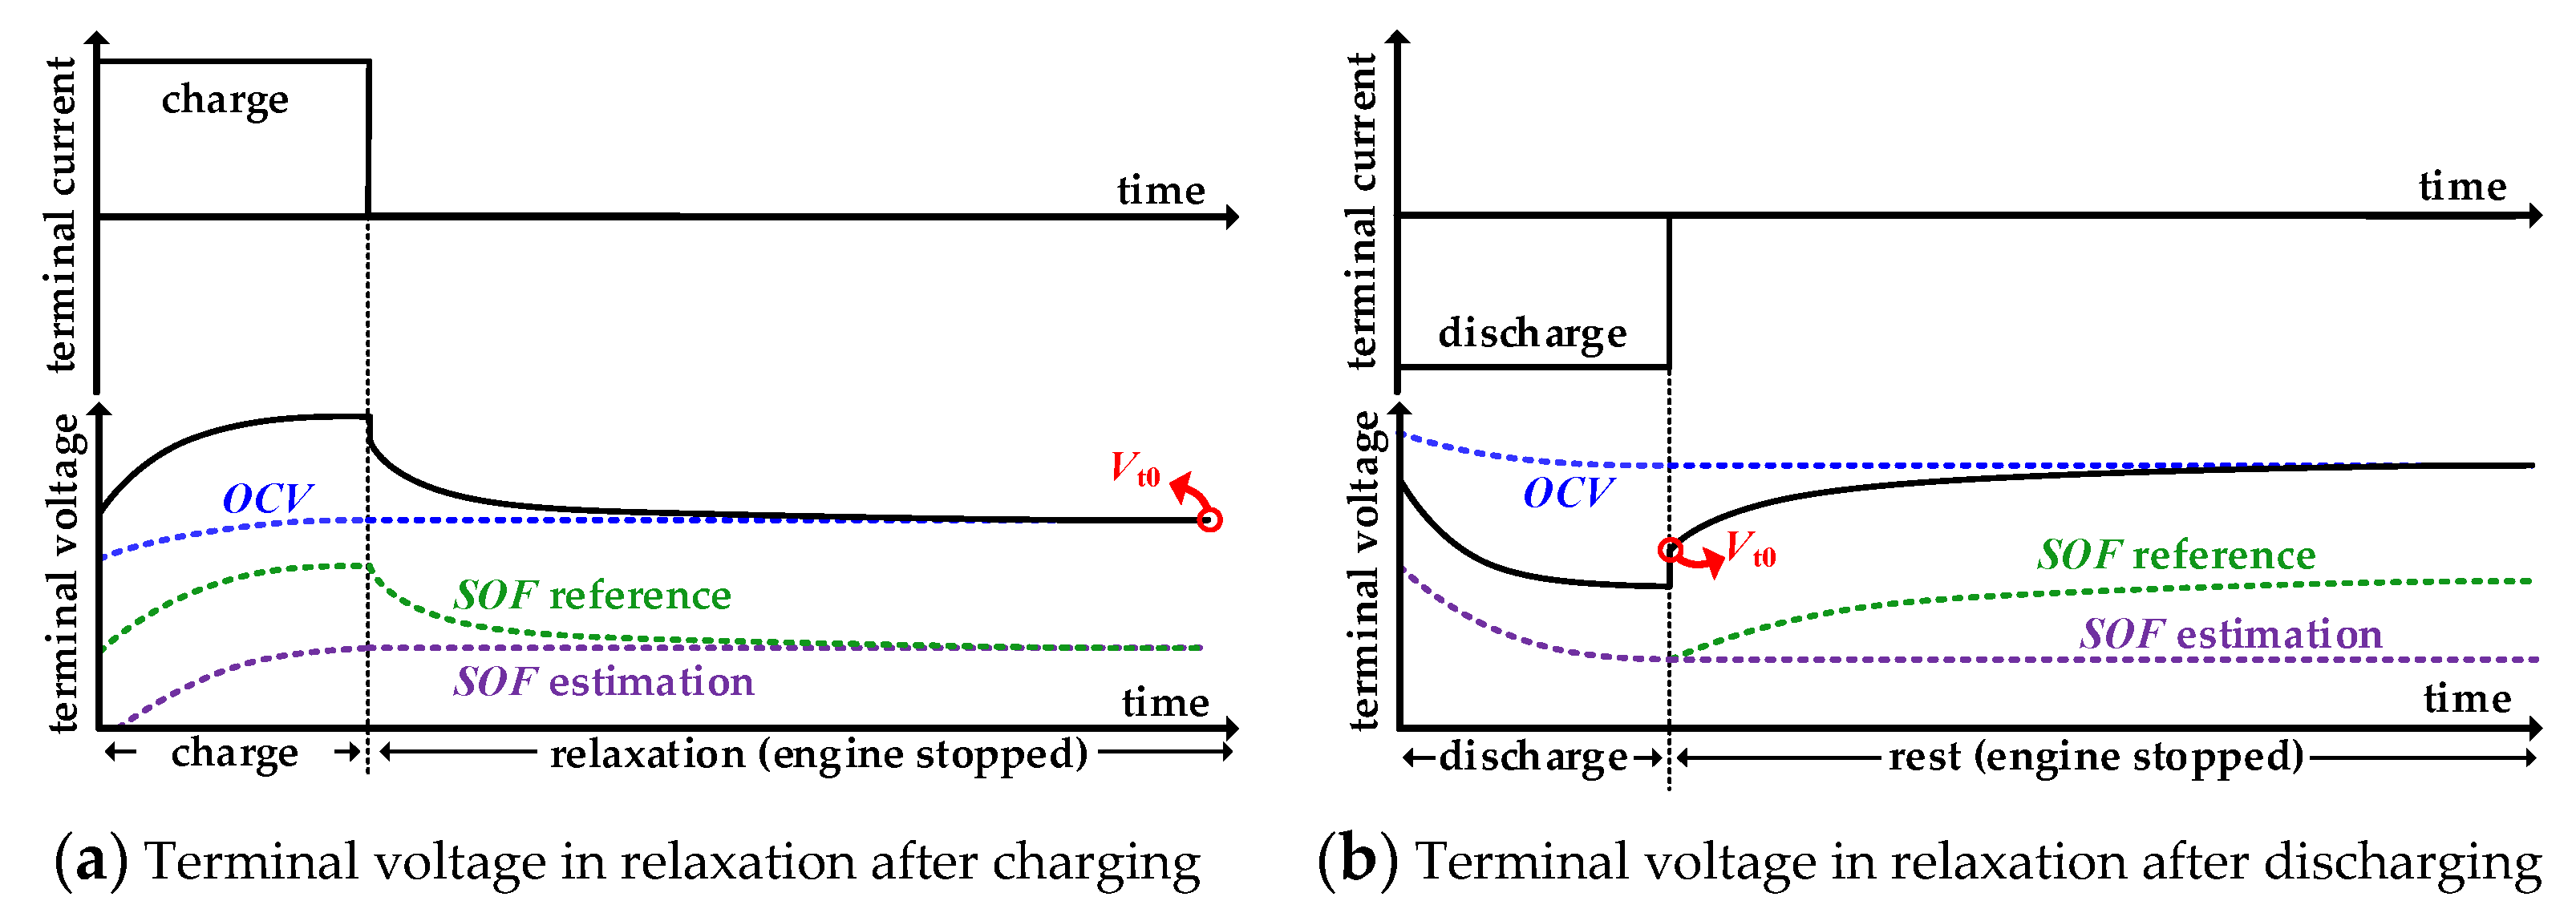
3.1. Prediction of Vt0 Considering Polarization Voltage

The terminal voltage after the engine is shut off changes over time because of the polarization voltage. This polarization voltage causes SOF to vary according to when the driver attempts to crank the engine, as shown in Figure 9a,b. Thus, it is necessary to determine Vt0 as the smallest relaxation voltage considering the polarization voltage to prevent the terminal voltage from exceeding the lower-limit voltage whenever a driver attempts cranking.
When the SLI battery is allowed to relax after charging, the relaxation voltage decreases to OCV exponentially, as shown in Figure 9a. Therefore, Vt0 should be determined as the OCV that minimizes SOF, as follows:
V t 0 = O C V       ( after   charge ) .
Conversely, Vt0 for the battery after discharge, as shown in Figure 9b, should be determined as the terminal voltage immediately after starting the relaxation, which minimizes SOF as follows:
V t 0 = v terminal i terminal R s 1       ( after   discharge ) .
Therefore, SOF in Equation (1) can be expressed using Equations (7) and (8) as follows:
S O F = { O C V V drop ( after   charge )   { v terminal i terminal R s 1 } V drop ( after   dischare ) .
This Vt0 makes it possible to estimate SOF before stopping the engine contrary to [26] and [27] because Vt0 is determined as one of the predicted relaxation voltages that causes the smallest SOF.

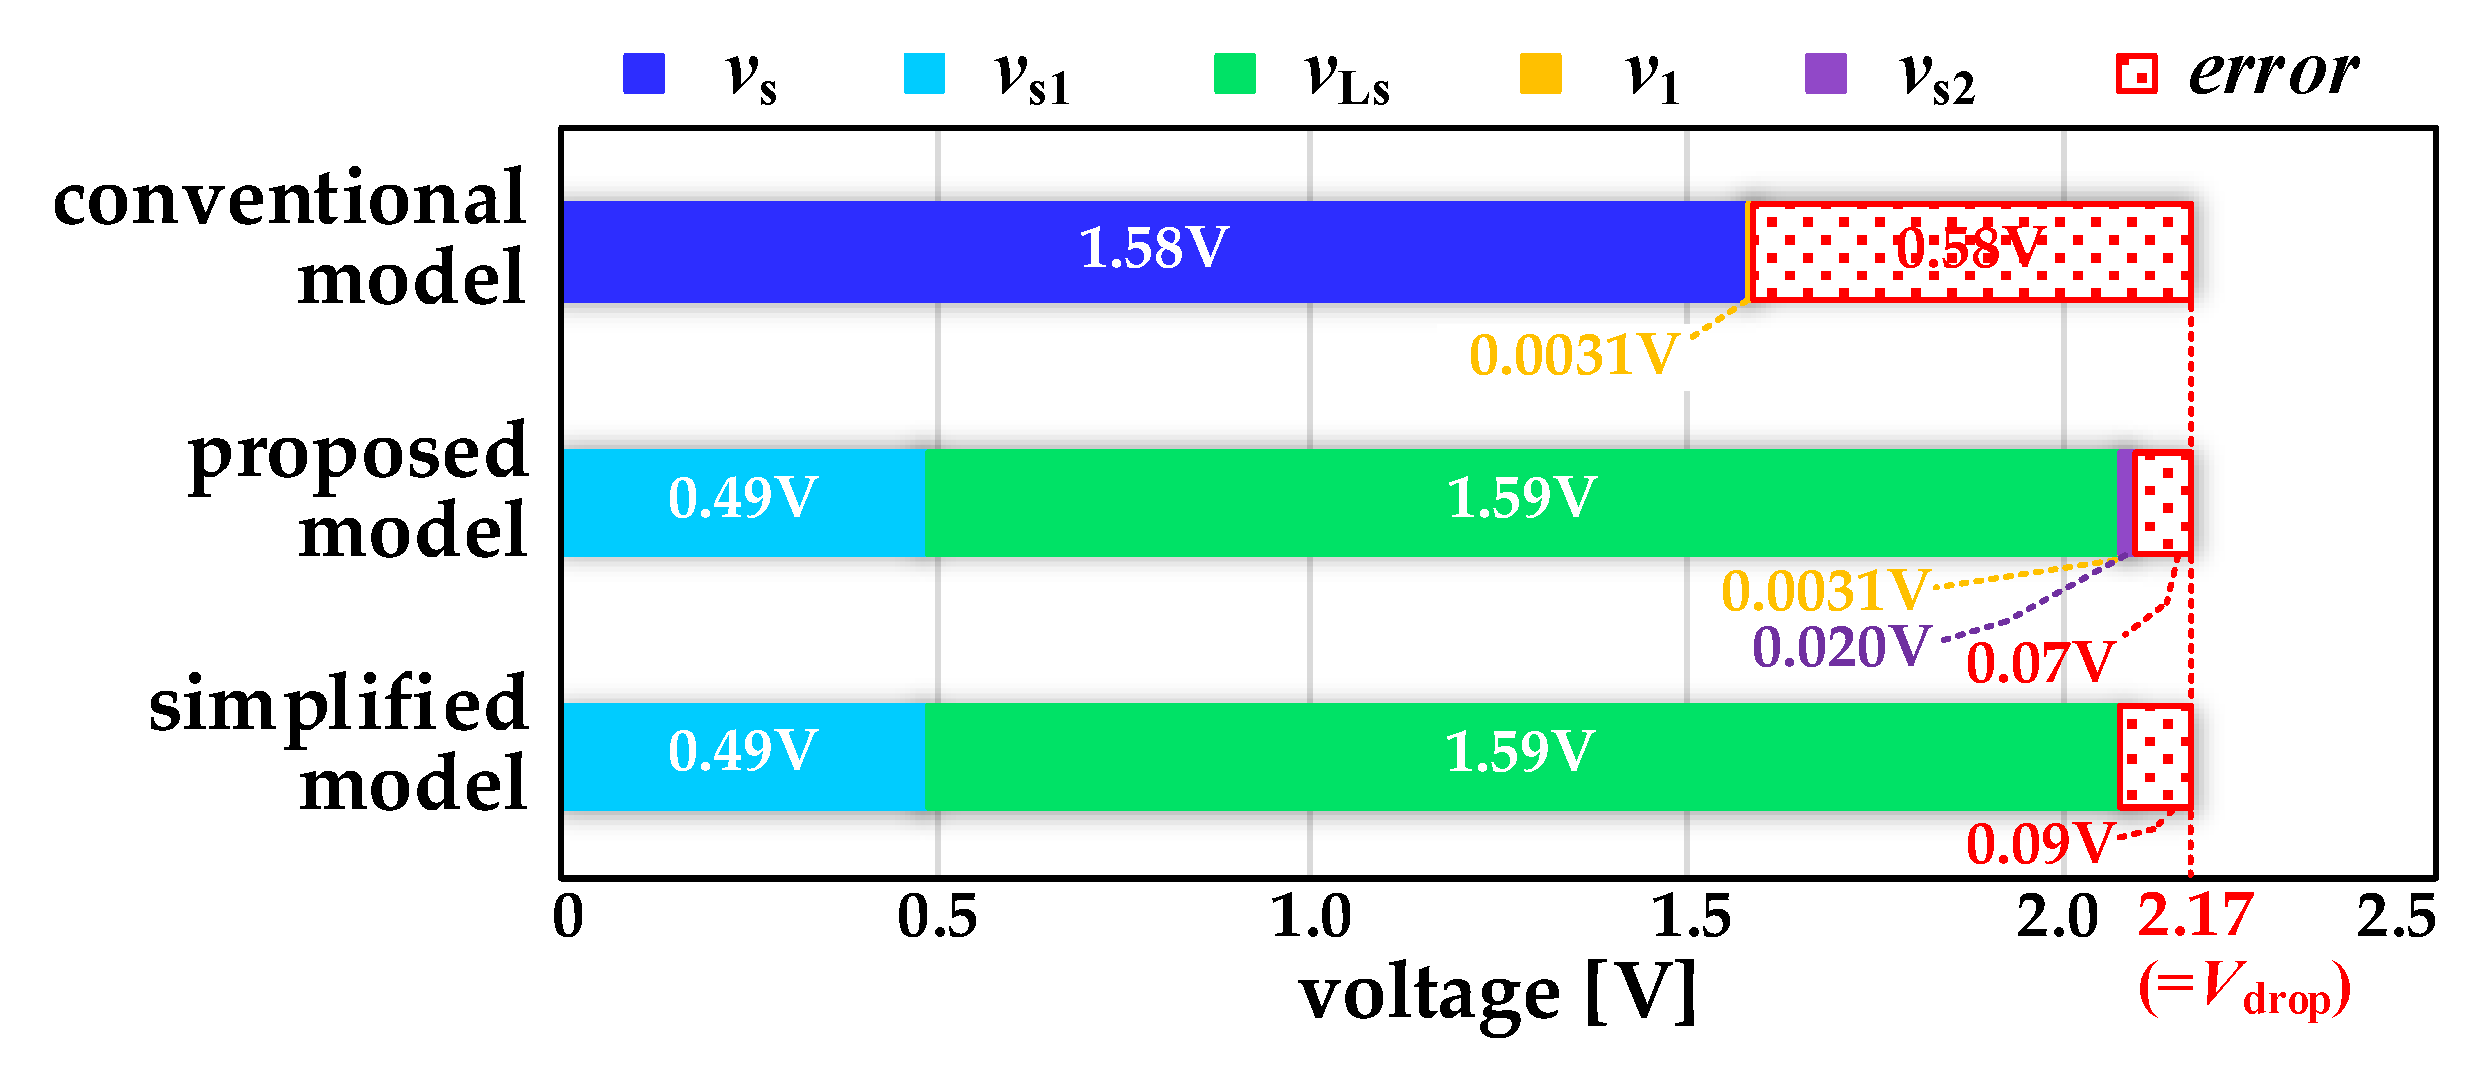
3.2. Vdrop Estimation Using ECM and Simplified Cranking Current Profile

Vdrop is equal to the sum of the voltage induced at the impedance components of the proposed ECM, Rs1 and Ls, when the cranking current is applied, as follows:
V drop = v s 1 ( t c ) + v L s ( t c ) = R s 1 i terminal ( t c ) L s d i terminal ( t c ) d t
where tc indicates the time when the cranking current attains the minimum value. Equation (10) shows that Vdrop is affected by only the magnitude and the slope of the cranking current at tc. Additionally, there is no need to consider the cranking current profile after tc because the terminal voltage has the smallest value at tc and then increases gradually, as shown in Figure 10a,b.
Therefore, the cranking current profile can be equalized as a ramp function (icrank_eq), as shown in Figure 10a, which contains only iterminal(tc) and the slope of the terminal current at tc, as follows:
i crank _ eq ( t ) = { 0 , ( t t c Δ t c ) i terminal ( t c ) Δ t c × ( t t c + Δ t c ) , ( t c Δ t c t < t c ) 0 , ( t c t )
where ∆tc indicates the time to reach iterminal(tc), as shown in Figure 10a. tc, ∆tc, and iterminal(tc) in Equation (11) are recorded at every cranking transient to predict Vdrop when the vehicle is cranked again. Using icrank_eq, Equation (10) can be expressed as
V drop = R s 1 i crank _ eq ( t c ) L s 1 i crank _ eq ( t c ) Δ t c ,
and Equation (8) can be substituted as follows:
S O F = { O C V { R s 1 i crank _ eq ( t c ) L s i crank _ eq ( t c ) Δ t c } ( after   charge ) { v terminal i terminal R s 1 }   { R s 1 i crank _ eq ( t c ) L s i crank _ eq ( t c ) Δ t c } ( after   discharge ) .
Figure 10b shows the SOF estimation result using Equation (13) when the cranking current in Figure 7a is applied to the SLI battery. The red mark indicates the SOF calculated by Equation (13), and the green circle indicates the simulated terminal voltage based on the proposed ECM in Figure 4. The accuracy of the SOF calculated by Equation (13) is 95.57%, which is similar to that of the simulated terminal voltage (95.71%).

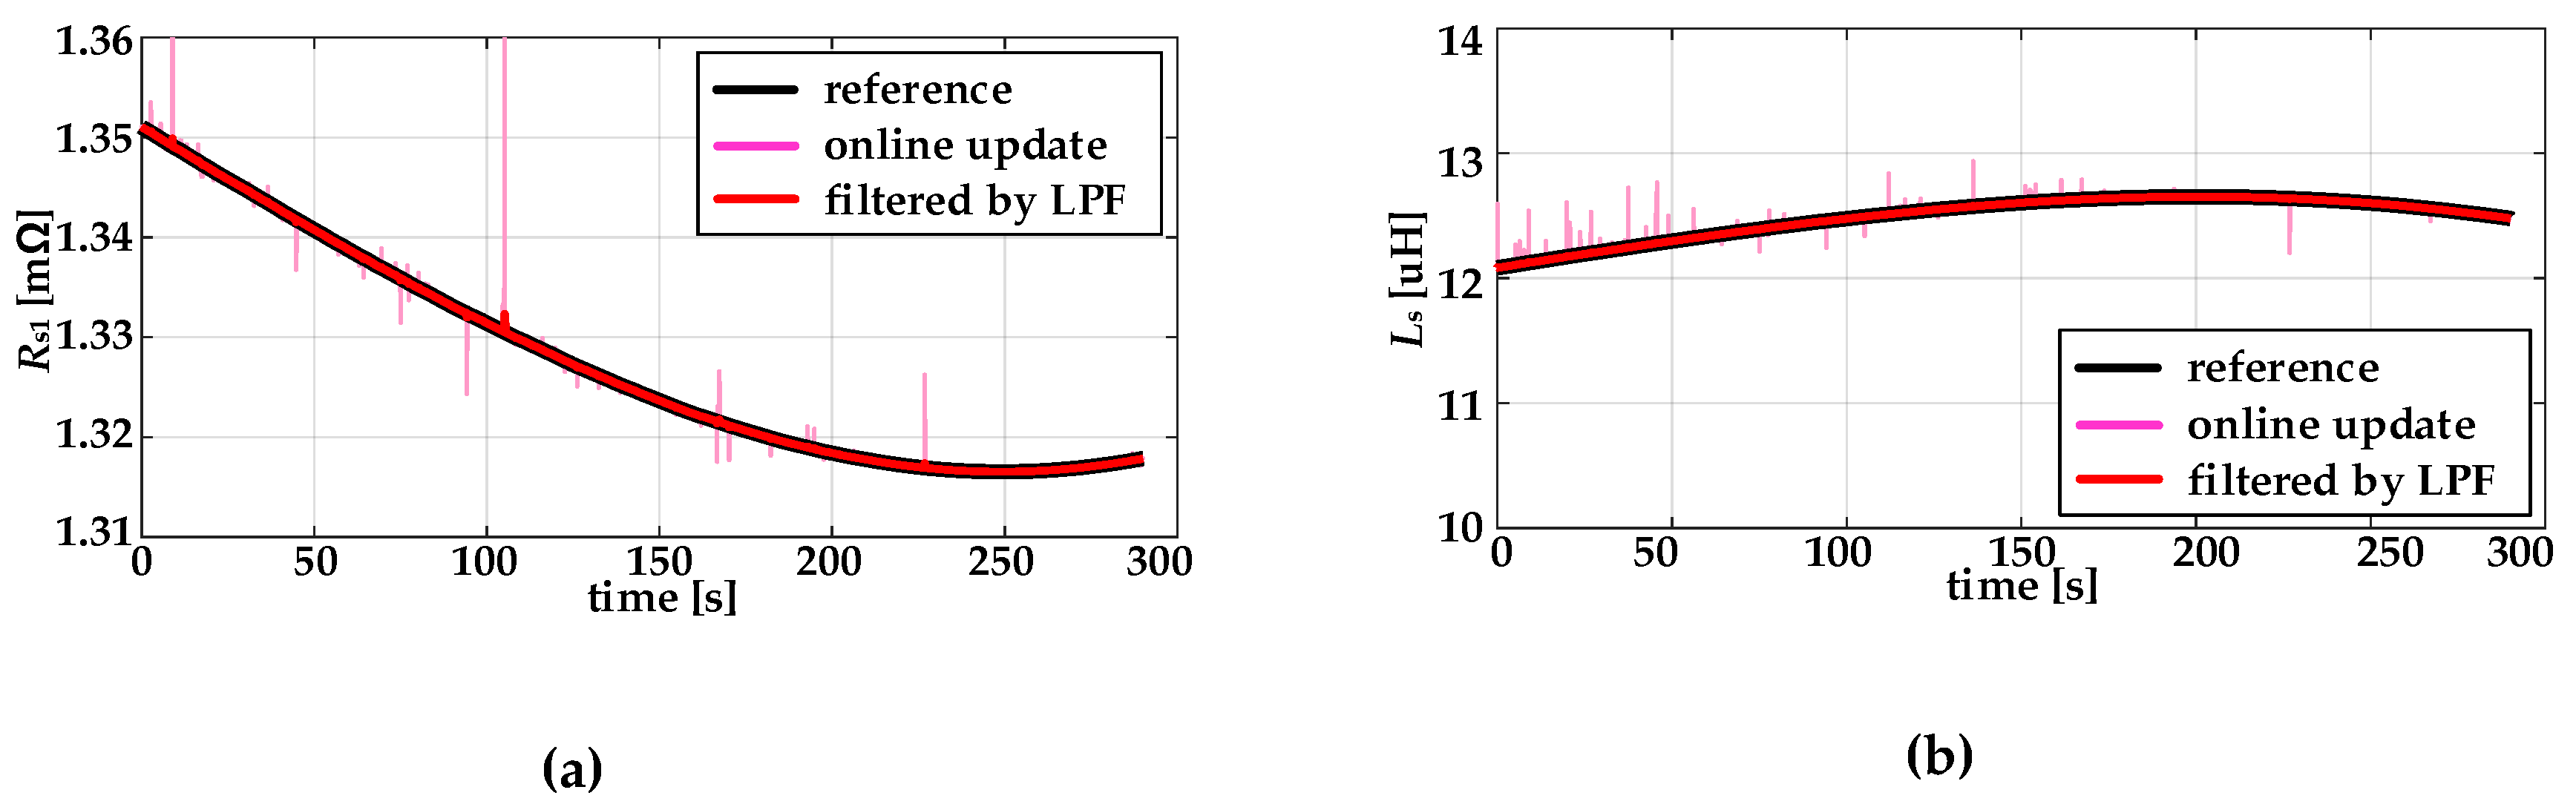
3.3. Online Update through Analysis of Dynamic Characteristic of ECM Parameters

The ECM parameters vary depending on operating conditions such as SOC, the temperature, the aging conditions, and C-rate. Therefore, if ECM parameters are not updated in real time, the accuracy of the SOF estimation can be reduced. Because Rs1 and Ls cannot be directly measured from the terminal voltage and current, the online update for Rs1 and Ls should utilize the dynamic characteristics of vs1 and vLs as follows:
R s 1 = Δ v s 1 Δ i terminal ,
L s = Δ v L s × Δ t s Δ i terminal
where ∆ts indicates the sampling period of the terminal current and voltage.
However, ∆vs1 and ∆vLs cannot be directly extracted from the terminal voltage because both occur simultaneously when iterminal changes (∆iterminal). Thus, the proposed online update process updates Rs1 and Ls through the following process:
(1)
Record iterminal, ∆iterminal, and vterminal during two consecutive sampling sequences, tk−1 and tk.
(2)
Assume that OCV is given, and the changes in Rs1 and Ls for these sequences (∆ts) are negligible.
(3)
Calculate the sum of vs1 and vLs at tk−1 and tk using
v s 1 ( t k 1 ) + v L s ( t k 1 ) = v terminal ( t k 1 ) O C V ( t k 1 ) ,
and
v s 1 ( t k ) + v L s ( t k ) = v terminal ( t k ) O C V ( t k ) .
(4)
Express Equations (16) and (17) through Rs1 and LS as follows:
v terminal ( t k 1 ) O C V ( t k 1 ) = R s 1 ( t k ) i terminal ( t k 1 ) L s ( t k ) Δ i terminal ( t k 1 ) Δ t s ,
and
v terminal ( t k 1 ) O C V ( t k 1 ) = R s 1 ( t k ) i terminal ( t k ) L s ( t k ) Δ i terminal ( t k ) Δ t s .
(5)
Calculate Rs1(tk) and Ls(tk) by solving a simultaneous equation between Equations (18) and (19).
The assumption in step 2 above is reasonable because ∆ts is short enough to neglect the changes in the ECM parameters caused by SOC, SOH, and temperature.

3.4. Verification of Online Update of ECM Parameters

In order to verify the proposed online update process, a simulation based on the battery model, consisting of look-up tables in Figure 5a,c, was performed. The parameters of ECM were set to change according to SOC variation when the battery was charged or discharged by the current profile. Figure 11a,b shows the current profile used to verify the proposed online update process and the simulated terminal voltage of ECM. This current profile was measured when the SLI battery was charged by an alternator and supplied the electrical loads of the vehicle.
As shown in Figure 12a,b, both Rs1 and Ls, which were updated based on the proposed online update process, had instantaneous errors because a few changes in Rs1 and Ls were caused by the small variation of SOC over ∆ts. Therefore, these updated results should be filtered through a low-pass filter (LPF), which improves both values to over 99.99% accuracy. This indicates that the proposed online update process can prevent misjudgments of SOF despite variations in ECM parameters due to the operating conditions. The proposed online update for the model parameters is more intuitive and requires smaller calculation than other mathematical methods, such as the adaptive filter and computational intelligence [32,33,34].

4. Experimental Verification

4.1. Experimental Setup

The SLI battery (12.0 V, 50 Ah) used in the experimental verification was connected with 2-parallel and 4-series LFP-type battery cells, as shown in Figure 13a,b; the specifications of the SLI battery pack are listed in Table 1. The battery was installed in a vehicle, specifically a Korando-C manufactured by SsangYong, with a battery management system (BMS) and voltage/current sensors, as shown in Figure 14. The BMS recorded the terminal current and voltage at measurement intervals for time, current, and voltage of 1 ms, 1 mA, and 1 mV, respectively.
Look-up tables of the ECM parameters in Figure 3 and Figure 5 were identified at 20 °C with the charging and discharging test unit in Figure 15. These look-up tables were utilized to verify the accuracy of the proposed online update by comparing the SOF estimation results based on the look-up tables and the updated parameters. Before the engine was cranked, the SLI battery was charged to SOC 80% (Experiment 1) and SOC 90% (Experiment 2); for further validation, each experiment was performed at different temperatures (20 °C and −25 °C). As shown in Figure 16a,b, when the SLI battery attempted to crank the engine at a lower temperature, the magnitude of iterminal(tc) increased from −703.32 to −907.29 A because more output power is required for cold cranking [35,36].

4.2. Cranking Experiment Results

Figure 16a,b shows the waveforms of the terminal current and voltage measured for Experiments 1 and 2. In section t1, the engine was running, and the SLI battery was charged by the alternator and supplied power to electrical devices and functions. The measured terminal current and voltage in t1 were utilized to update the ECM parameters in order to estimate SOF, and the updated parameters right before the engine was stopped are shown in Table 2. In Figure 16a,b, the estimation results based on the updated parameters are indicated by a red line, and a blue line represents the SOF estimated using look-up tables in Figure 5a,c. Because the estimated SOFs were higher than the lower limit voltage, the engine was stopped in both Experiments 1 and 2.
After section t2, when the SLI battery was allowed to relax, cranking the engine was attempted, as shown in section t3. The minimum terminal voltages in the cranking transient period were compared with the estimated SOF, as summarized in Table 2. Because Experiment 1 was performed under the same temperature in which the look-up tables were composed, the SOF estimated through the look-up tables was 1.34%, similar to the SOF with online update (0.87%). This result verifies the accuracy of the SOF calculation using Vt0 and Vdrop. Conversely, because Experiment 2 was proceeded at a low temperature, −25 °C, the SOF estimation based on the look-up tables had an average error (−17.99%) that was higher than Experiment 1. These estimation errors tended to increase as the operating conditions differed from the conditions used to extract the look-up tables of the ECM parameters. With the online update, the estimation errors in Experiment 2 decreased to 1.40%, confirming that the proposed online update is sufficiently accurate for correct estimation and can prevent the safety risks caused by inaccurate judgment of the cranking capability. The engine was stopped after being completely cranked, as shown in section t4.

5. Conclusions

In this paper, a SOF estimation algorithm is proposed to determine the cranking capability of a Li-ion SLI battery. In order to accurately estimate SOF, an ECM suitable for describing the instantaneous voltage response to the cranking current profile is also proposed. On the basis of the parameters of the proposed ECM, the SOF is estimated by predicting the terminal voltage after the battery starts the relaxation and the voltage drop caused by cranking. In addition, to correct the variation of ECM parameters with operating conditions such as temperature and aging, an online update process based on the dynamic characteristics of the proposed ECM is presented. This algorithm can prevent the BMS from inaccurately estimating SOF, thereby eliminating the possibility of the occurrence of related safety problems. The accuracy of the proposed SOF algorithm was validated experimentally using a vehicle fitted with an LFP-type SLI battery. In future works, the proposed algorithm will be validated in various operating conditions, such as SOC, SOH, and temperature. Moreover, the applicability of the high-performance computing and computational intelligence will be reviewed and researched to improve the accuracy and calculation burden.

Author Contributions

Conceptualization, B.K.L., J.-H.A. and T.-W.N.; Data curation J.-H.A. and T.-W.N.; Formal analysis, J.-H.A. and T.-W.N.; Investigation, J.-H.A. and T.-W.N.; Project administration, B.K.L.; Software, T.-W.N.; Supervision, B.K.L.; Validation, T.-W.N.; Visualization, T.-W.N.; Writing–original draft, J.-H.A. and B.K.L.; Writing–review & editing, T.-W.N. and B.K.L.

Funding

This work was supported by “Human Resources Program in Energy Technology” of the Korea Institute of Energy Technology Evaluation and Planning (KETEP), granted financial resource from the Ministry of Trade, Industry & Energy, Korea. (No. 20184030202190); This work was supported by the Korea Institute of Energy.

Conflicts of Interest

The authors declare no conflict of interest.

References

  1. Electric Motors: Working Behind the Scenes for Better Fuel Economy. Available online: http://www.global.tdk.com/techmag/topics/vol1.htm (accessed on 30 August 2019).
  2. Berecibar, M.; Garmendia, M.; Gandiaga, I.; Crego, J.; Villarreal, I. State of health estimation algorithm of LiFePO4 battery packs based on differential voltage curves for battery management system application. Energy 2016, 103, 784–796. [Google Scholar] [CrossRef]
  3. Chaoui, H.; Golbon, N.; Hmouz, I.; Souissi, R.; Tahar, S. High-performance battery-pack power estimation using a dynamic cell model. IEEE Trans. Ind. Electron. 2015, 62, 1610–1618. [Google Scholar] [CrossRef]
  4. Li, J.; Barillas, J.K.; Guenther, C.; Danzer, M.A. A comparative study of state of charge estimation algorithms for LiFePO4 batteries used in electric vehicles. J. Power Sources 2013, 230, 244–250. [Google Scholar] [CrossRef]
  5. Hu, X.; Jiang, J.; Cao, D.; Egardt, B. Battery health prognosis for electric vehicles using sample entropy and sparse Bayesian predictive modeling. IEEE Trans. Ind. Electron. 2016, 63, 2645–2656. [Google Scholar] [CrossRef]
  6. Dong, C.; Zeng, H.; Chen, M. Online Algorithms for Automotive Idling Reduction with Effective Statistics. IEEE Trans. Comput. Des. Integr. Circuits Syst. 2015, 34, 1742–1755. [Google Scholar] [CrossRef]
  7. Sawai, K.; Ohmae, T.; Suwaki, H.; Shiomi, M.; Osumi, S. Idling-stop vehicle road tests of advanced valve-regulated lead-acid (VRLA) battery. J. Power Sources 2007, 174, 54–60. [Google Scholar] [CrossRef]
  8. Motapon, S.N.; Dessaint, A.; Lu, L.A.; Fortin-Blanchette, H.; L-Haddad, K.A. A generic electro-thermal Li-Ion battery model for rapid evaluation of cell temperature temporal evolution. IEEE Trans. Ind. Electron. 2017, 64, 998–1008. [Google Scholar] [CrossRef]
  9. Wang, Q.; Kang, J.; Tan, Z.; Luo, M. An online method to simultaneously identify the parameters and estimate states for lithium ion batteries. Electrochim. Acta 2018, 289, 376–388. [Google Scholar] [CrossRef]
  10. Xiong, R.; Li, L.; Tian, J. Towards a smarter battery management system: A critical review on battery state of health monitoring methods. J. Power Sources 2018, 405, 18–29. [Google Scholar] [CrossRef]
  11. Jaguemont, J.; Boulon, L.; Dube, Y. Characterization and Modeling of a Hybrid-Electric-Vehicle Lithium-Ion Battery Pack at Low Temperatures. IEEE Trans. Veh. Technol. 2016, 65, 1–14. [Google Scholar] [CrossRef]
  12. Li, K.; Wei, F.; Tseng, K.J.; Soong, B.H. A practical Lithium-ion battery model for state of energy and voltage responses prediction incorporating temperature and ageing effects. IEEE Trans. Ind. Electron. 2016, 65, 6696–6708. [Google Scholar] [CrossRef]
  13. Lee, K.-T.; Dai, M.-J.; Chuang, C.-C. Temperature-Compensated Model for Lithium-Ion Polymer Batteries with Extended Kalman Filter State-of-Charge Estimation for an Implantable Charger. IEEE Trans. Ind. Electron. 2018, 65, 589–596. [Google Scholar] [CrossRef]
  14. Wang, K.; Gao, F.; Zhu, Y.; Liu, H.; Qi, C.; Yang, K.; Jiao, Q. Internal resistance and heat generation of soft package Li4Ti5O12 battery during charge and discharge. Energy 2018, 149, 364–374. [Google Scholar] [CrossRef]
  15. Yang, J.; Xia, B.; Shang, Y.; Huang, W.; Mi, C.C. Adaptive State-of-Charge Estimation Based on a Split Battery Model for Electric Vehicle Applications. IEEE Trans. Veh. Technol. 2017, 66, 10889–10898. [Google Scholar] [CrossRef]
  16. Tang, X.; Wang, Y.; Zou, C.; Yao, K.; Xia, Y.; Gao, F. A novel framework for Lithium-ion battery modeling considering uncertainties of temperature and aging. Energy Convers. Manag. 2019, 180, 162–170. [Google Scholar] [CrossRef]
  17. He, H.; Xiong, R.; Guo, H.; Li, S. Comparison study on the battery models used for the energy management of batteries in electric vehicles. Energy Convers. Manag. 2012, 64, 113–121. [Google Scholar] [CrossRef]
  18. Farmann, A.; Sauer, D.U. Comparative study of reduced order equivalent circuit models for on-board state-of-available-power prediction of lithium-ion batteries in electric vehicles. Appl. Energy 2018, 225, 1102–1122. [Google Scholar] [CrossRef]
  19. Abdollahi, A.; Han, X.; Raghunathan, N.; Pattipati, B.; Balasingam, B.; Pattipati, K.; Bar-Shalom, Y.; Card, B. Optimal charging for general equivalent electrical battery model, and battery life management. J. Energy Storage 2017, 9, 47–58. [Google Scholar] [CrossRef]
  20. Abdollahi, A.; Han, X.; Raghunathan, N.; Pattipati, B.; Balasingam, B.; Pattipati, K.R.; Bar-Shalom, Y.; Card, B. Optimal charging for general equivalent electrical battery model, and battery life management. J. Energy Storage 2017, 9, 47–58. [Google Scholar]
  21. Seaman, A.; Dao, T.-S.; McPhee, J. A survey of mathematics-based equivalent-circuit and electrochemical battery models for hybrid and electric vehicle simulation. J. Power Sources 2014, 256, 410–423. [Google Scholar] [CrossRef] [Green Version]
  22. Gou, J.; Lee, A.; Pyko, J. Modeling of the cranking and charging processes of conventional valve regulated lead acid (VRLA) batteries in micro-hybrid applications. J. Power Sources 2014, 263, 186–194. [Google Scholar] [CrossRef]
  23. Zhang, X.; Grube, R.; Shin, K.-K.; Salman, M.; Conell, R.S. Parity-relation-based state-of-health monitoring of lead acid batteries for automotive applications. Control Eng. Pract. 2011, 19, 555–563. [Google Scholar] [CrossRef]
  24. Kerley, R.; Hyun, J.H.; Ha, D.S. Automotive lead-acid battery state-of-health monitoring system. In Proceedings of the IECON 2015–41st Annual Conference of the IEEE Industrial Society, Yokohama, Japan, 9–12 November 2015. [Google Scholar]
  25. Blanke, H.; Bohlen, O.; Buller, S.; De Doncker, R.W.; Fricke, B.; Hammouche, A.; Linzen, D.; Thele, M.; Sauer, D.U. Impedance measurements on lead–acid batteries for state-of-charge, state-of-health and cranking capability prognosis in electric and hybrid electric vehicles. J. Power Sources 2005, 144, 418–425. [Google Scholar] [CrossRef]
  26. Sabatier, J.; Cugnet, M.; Laruelle, S.; Grugeon, S.; Sahut, B.; Oustaloup, A.; Tarascon, J. A fractional order model for lead-acid battery crankability estimation. Commun. Nonlinear Sci. Numer. Simul. 2010, 15, 1308–1317. [Google Scholar] [CrossRef]
  27. Cugnet, M.; Sabatier, J.; Laruelle, S.; Grugeon, S.; Sahut, B.; Oustaloup, A.; Tarascon, J.-M. On Lead-Acid-Battery Resistance and Cranking-Capability Estimation. IEEE Trans. Ind. Electron. 2010, 57, 909–917. [Google Scholar] [CrossRef]
  28. Hou, Z.Y.; Lou, P.Y.; Wang, C.C. State of charge, state of health, and state of function monitoring for EV BMS. In Proceedings of the 2017 IEEE International Conference on Consumer Electronics, Las Vegas, NV, USA, 8–10 January 2017. [Google Scholar]
  29. Shen, P.; Ouyang, M.; Lu, L.; Li, J.; Feng, X. The Co-estimation of State of Charge, State of Health, and State of Function for Lithium-Ion Batteries in Electric Vehicles. IEEE Trans. Veh. Technol. 2018, 67, 92–103. [Google Scholar] [CrossRef]
  30. FreedomCAR Battery Test Manual for Power—Assist Hybrid Electric Vehicles. Available online: https://avt.inl.gov/sites/default/files/pdf/battery/freedomcar_manual_04_15_03.pdf (accessed on 30 August 2019).
  31. Giordano, G.; Klass, V.; Behm, M.; Lindbergh, G.; Sjoberg, J. Model-Based Lithium-Ion Battery Resistance Estimation from Electric Vehicle Operating Data. IEEE Trans. Veh. Technol. 2018, 67, 3720–3728. [Google Scholar] [CrossRef]
  32. Zhang, L.; Wang, Z.; Sun, F.; Dorrell, D.G. Online Parameter Identification of Ultracapacitor Models Using the Extended Kalman Filter. Energies 2014, 7, 3204–3217. [Google Scholar] [CrossRef]
  33. Partovibakhsh, M.; Liu, G. An Adaptive Unscented Kalman Filtering Approach for Online Estimation of Model Parameters and State-of-Charge of Lithium-Ion Batteries for Autonomous Mobile Robots. IEEE Trans. Control Syst. Technol. 2015, 23, 357–363. [Google Scholar] [CrossRef]
  34. Capizzi, G.; Bonanno, F.; Tina, G.M. Recurrent Neural Network-Based Modeling and Simulation of Lead-Acid Batteries Charge–Discharge. IEEE Trans. Energy Convers. 2011, 26, 435–443. [Google Scholar] [CrossRef]
  35. Karami, H.; Karimi, M.A.; Mahdipour, M. ANN modeling of cold cranking test for sealed lead-acid batteries. J. Power Sources 2006, 158, 936–943. [Google Scholar] [CrossRef]
  36. Liu, H.; Wang, Z.; Cheng, J.; Maly, D. Improvement on the Cold Cranking Capacity of Commercial Vehicle by Using Supercapacitor and Lead-Acid Battery Hybrid. IEEE Trans. Veh. Technol. 2009, 58, 1097–1105. [Google Scholar]
Figure 1. Conceptual figure of terminal current and voltage during cranking transient period.
Energies 12 03365 g001
Figure 2. Equivalent circuit model and experiment profile for parameter identification.
Energies 12 03365 g002
Figure 3. Parameter identification results of conventional model in Figure 2a.
Energies 12 03365 g003
Figure 4. Proposed equivalent circuit model for state-of-function (SOF) estimation.
Energies 12 03365 g004
Figure 5. Conceptual figure of strategy for identification of Ls.
Energies 12 03365 g005
Figure 6. Parameter identification results of proposed model in Figure 4.
Energies 12 03365 g006
Figure 7. Verification results of proposed equivalent circuit model (ECM).
Energies 12 03365 g007
Figure 8. Impedance voltage ratio of voltage drop according to equivalent circuit models.
Energies 12 03365 g008
Figure 9. Effects of polarization voltage for terminal voltage and Vt0 according to applied terminal current.
Energies 12 03365 g009
Figure 10. Equalization of cranking current profile.
Energies 12 03365 g010
Figure 11. Measured current and voltage as starting–lighting–ignition (SLI) battery is discharged.
Energies 12 03365 g011
Figure 12. Simulation verification of online update process: (a) Update results of Rs1; (b) Update results of Ls1.
Energies 12 03365 g012
Figure 13. SLI battery used in experimental verifications: (a) SLI battery pack; (b) Internal structure and BMS board.
Energies 12 03365 g013
Figure 14. Setup for cranking experiments.
Energies 12 03365 g014
Figure 15. Charging/discharging test unit.
Energies 12 03365 g015
Figure 16. Experimental verification results.
Energies 12 03365 g016
Table 1. Specification of battery pack.
ParameterValue
Battery typeLiFePO4 (LFP)
ManufacturerTop Battery
Current density50 [Ah]
Voltage range8.0–14.4 [V]
Nominal voltage12.0 [V]
Table 2. Cranking experiments and SOF estimation results.
PurposeExperiment 1Experiment 2
SOC of SLI battery80%90%
Temperature20 [°C]−25 [°C]
iterminal(tc)/∆tc−703.32 [A]/4 [ms]−907.29 [A]/5 [ms]
Updated parametersRs11.09 [mΩ]2.02 [mΩ]
Ls13.55 [μH]16.70 [μH]
Estimation error with look-up table1.34%−17.99%
Estimation error with online update0.87%1.40%

