Abstract
This review takes into account articles and standards published in recent years concerning the application of the Pulsed Electro Acoustic (PEA) method for space charge measurement on High Voltage Direct Current (HVDC) cables and mini-cables. Since the 80s, the PEA method has been implemented for space charge measurements on flat specimens in order to investigate space charge phenomena and to evaluate the ageing of dielectrics. In recent years, this technique has been adapted to cylindrical geometry. Several studies and experiments have been carried out on the use of the PEA method for full size cables and HVDC cable models. The experiments have been conducted using different arrangements of the measurement setup and focusing attention on different aspects of space charge phenomena. In this work, the importance of space charge measurement is highlighted and the state-of-the-art PEA method application to full size cables and mini-cables is described. The main aim of this paper is to offer a complete and current review of this technique. In addition, limits on the use of PEA method are examined and main possible directions of research are proposed in order to improve the applicability, reliability, and replicability of this method.
1. Introduction
During the last decades, the interest on DC transmissions has grown. This is due to the need of increasing the transnational exchange of electrical power, strictly related to the increase of the availability of energy produced by renewable randomly distributed sources, installed offshore and/or at long distances from the users. For several reasons, High Voltage Direct Current (HVDC) lines are the best solution for long distances and the unique solution for undersea applications [1]. The use of extruded cables for HVDC transmission has shown the onset of premature aging due to space charge accumulation phenomena in the bulk of the dielectric and near the electrodes.
In recent years, many research groups have developed different techniques useful for detecting space charges accumulation in dielectric materials. Most of these techniques can be grouped as acoustic and thermal methods [2]. Thanks to a relatively simple measurement system and a good spatial resolution, the Pulsed Electro Acoustic (PEA) method is currently the most reliable way to detect space charge accumulation into the dielectric material of HVDC cables [3]. Since 1985, the year in which the group of Professor Tatsuo Takada demonstrated the possibility of measuring space charge accumulation with a non-destructive method, the scientific community has made important progress in the use of the PEA method [4].
The presence of space charge in the dielectric is a typical phenomenon occurring in HVDC cables. This is due to the DC high voltage supply of the cable line, which determines the application of an electric field for a long time in the dielectric region: this enables space charge accumulation phenomena to be established, as will be discussed in the next sections. Since the time constants of most space charge phenomena have a minimum order of magnitude equal to several dozen seconds, their manifestation in HVAC application is negligible.
Many researchers have used the PEA method to carry out space charge measurements on flat samples of dielectric materials and more recently on HVDC mini and full size cables. Much progress has been made in the knowledge of performance and applicability of the PEA method. In addition, this technique has shown the occurrence of new phenomena observed for the first time in recent years and it has been used to evaluate the ageing of cables. However, further improvements to the PEA method are needed to obtain a universally accepted measurement protocol and to achieve the possibility of measuring on-site the aging of HVDC cables during their lifetime.
To date, a protocol for the space charge measurements on cables has been proposed by IEEE Std 1732TM-2017 entitled “IEEE Recommended Practice for Space Charge Measurements on High Voltage Direct-Current Extruded Cables for Rated Voltages up to 550 kV” [5]. This standard recalls the contents reported in [6] and assumes that PEA method is suitable for its use for long term pre-qualification test and type test of HVDC extruded cables.
2. Space Charge Injection, Formation, and Accumulation Phenomena in HVDC Cables
Space charge formation and accumulation is one of the most important causes of faults in HVDC cable transmission lines. This phenomenon is essentially due to the following reasons [1]: due to their dependence on the temperature, a spatial gradient both of conductivity and permittivity occurs in loaded HVDC cables. This leads to the establishment of space charge in the bulk of dielectric; in presence of high electric field discontinuity, an injection of charges from electrodes occurs; these phenomena are amplified by the presence of imperfections at the interfaces between different materials; thermal ionization leads to the formation of space charge inside the insulation; the charge carriers injected by the electrodes can remain in proximity of these ones, or can migrate leading to a hetero charge accumulation in the proximity of the opposite electrode or remain in the bulk of the insulation in traps due to the inhomogeneity of the material itself.
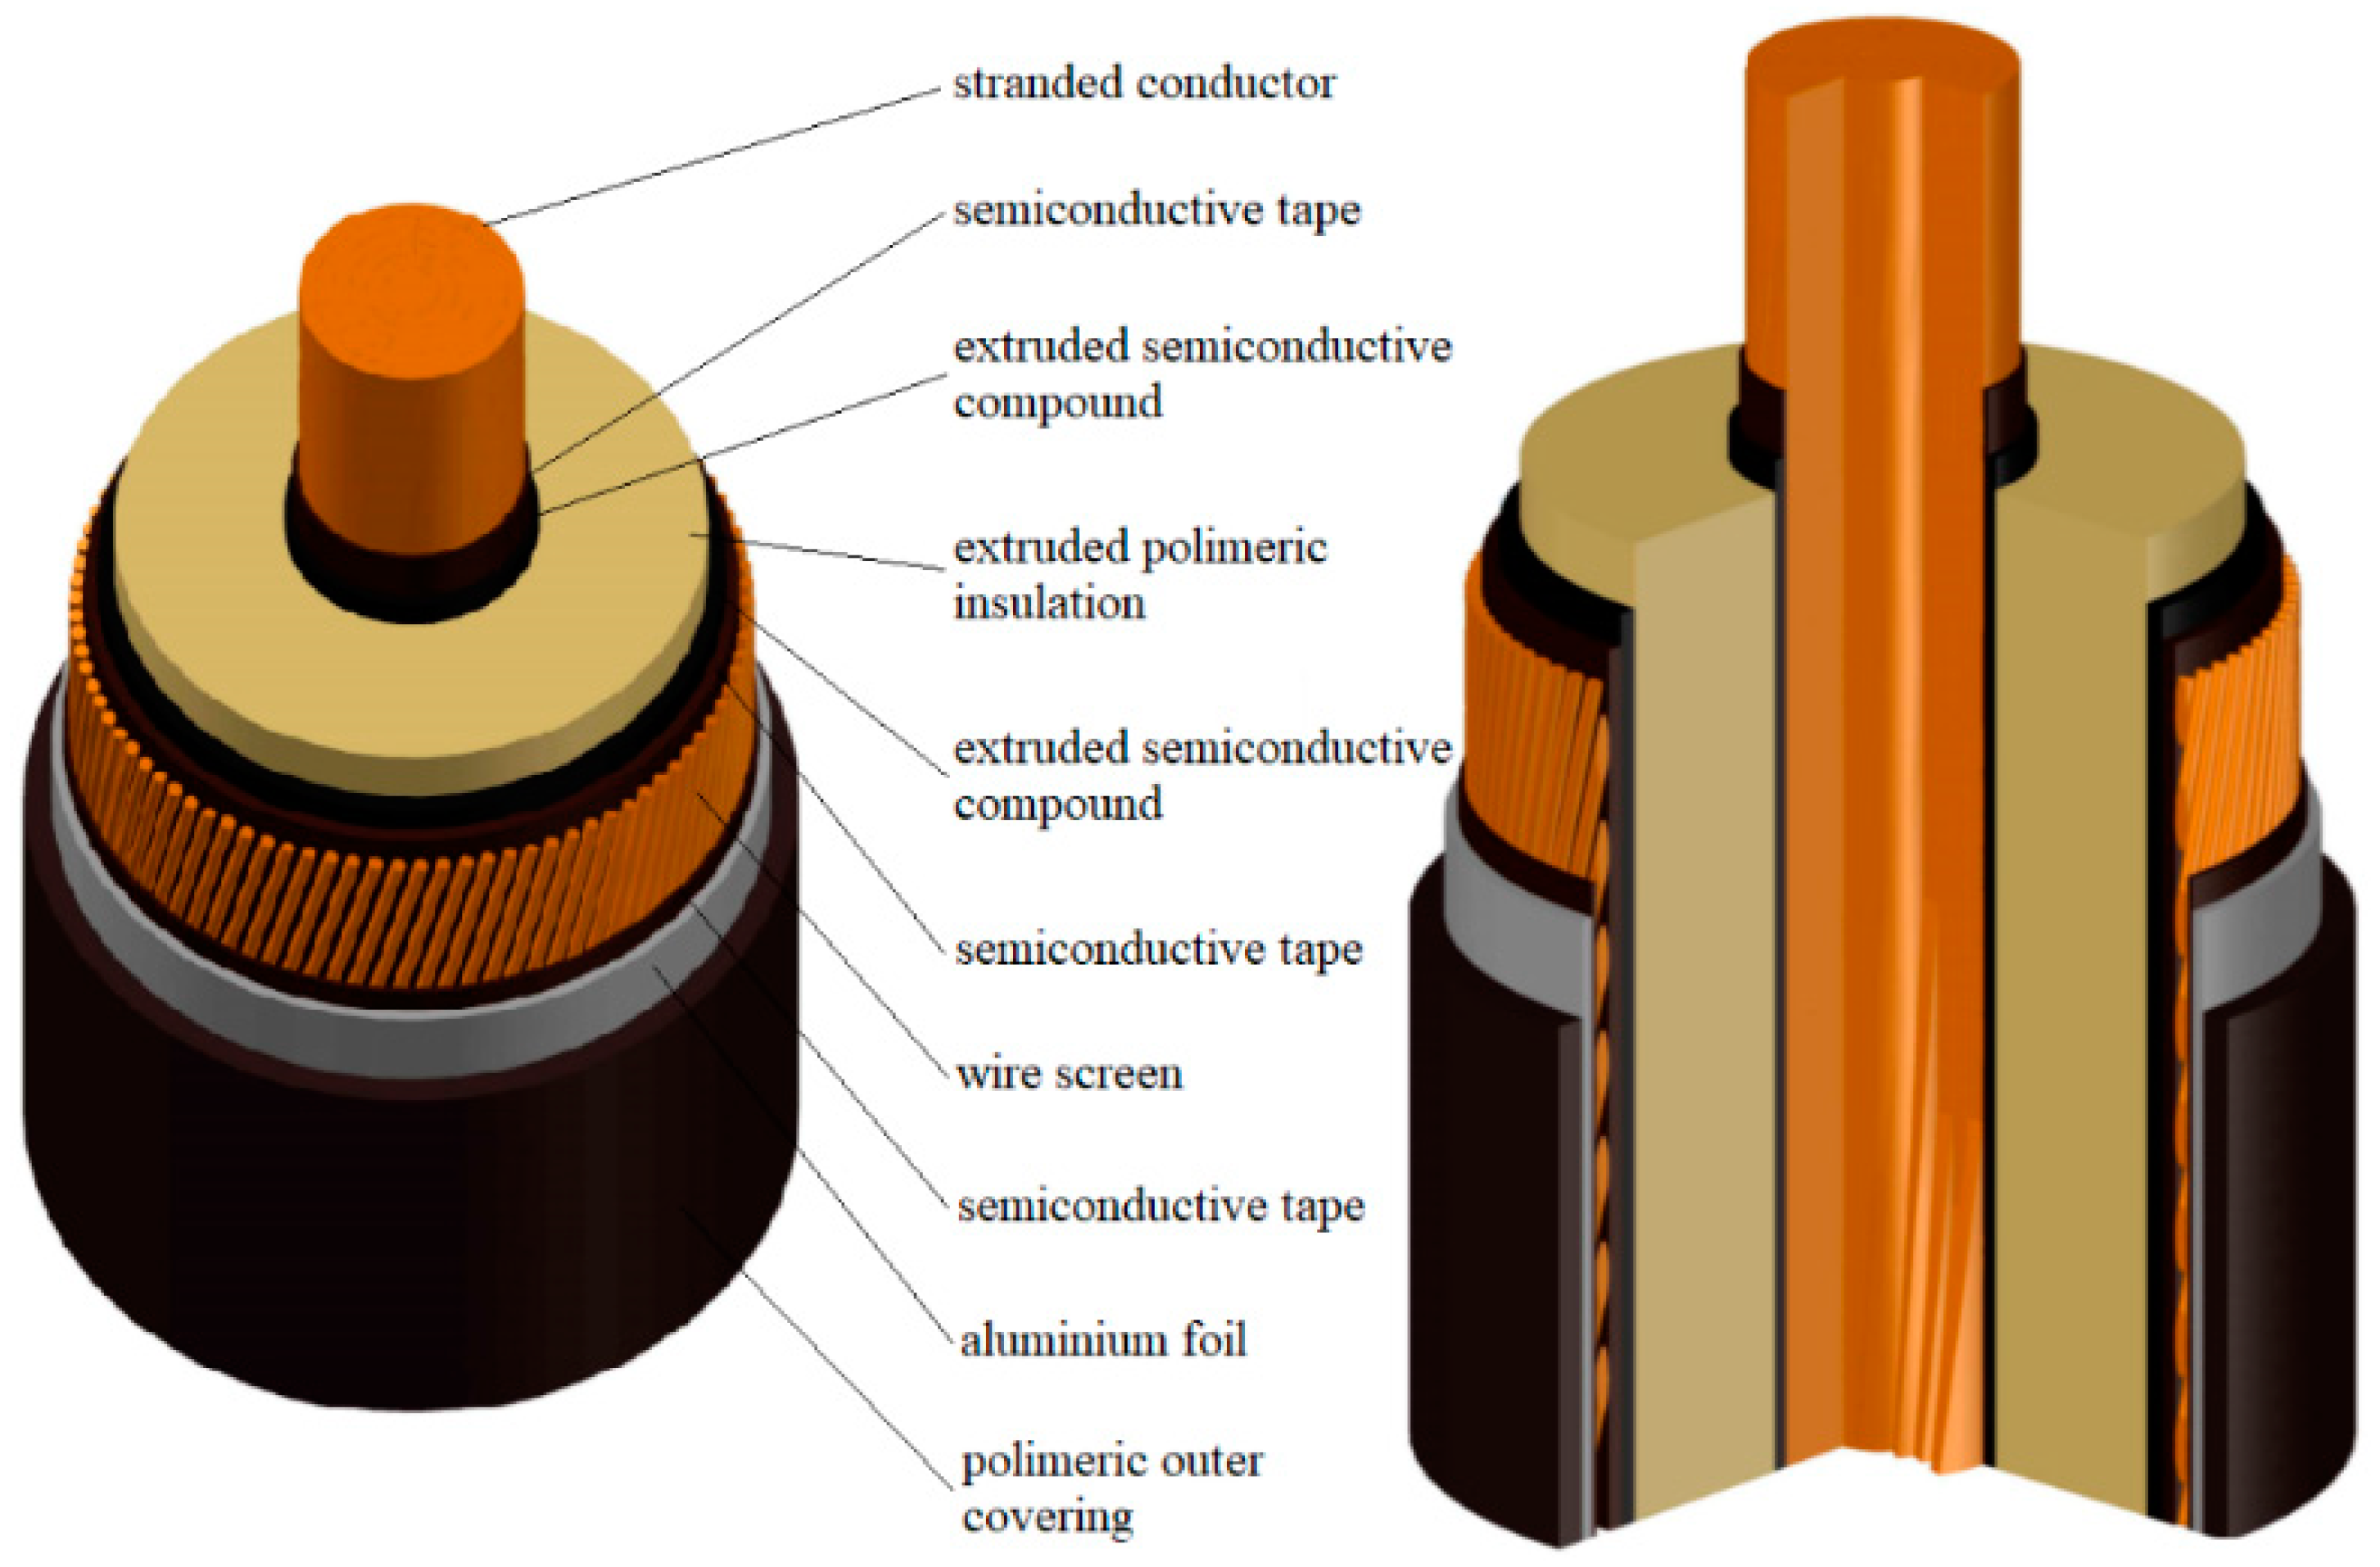
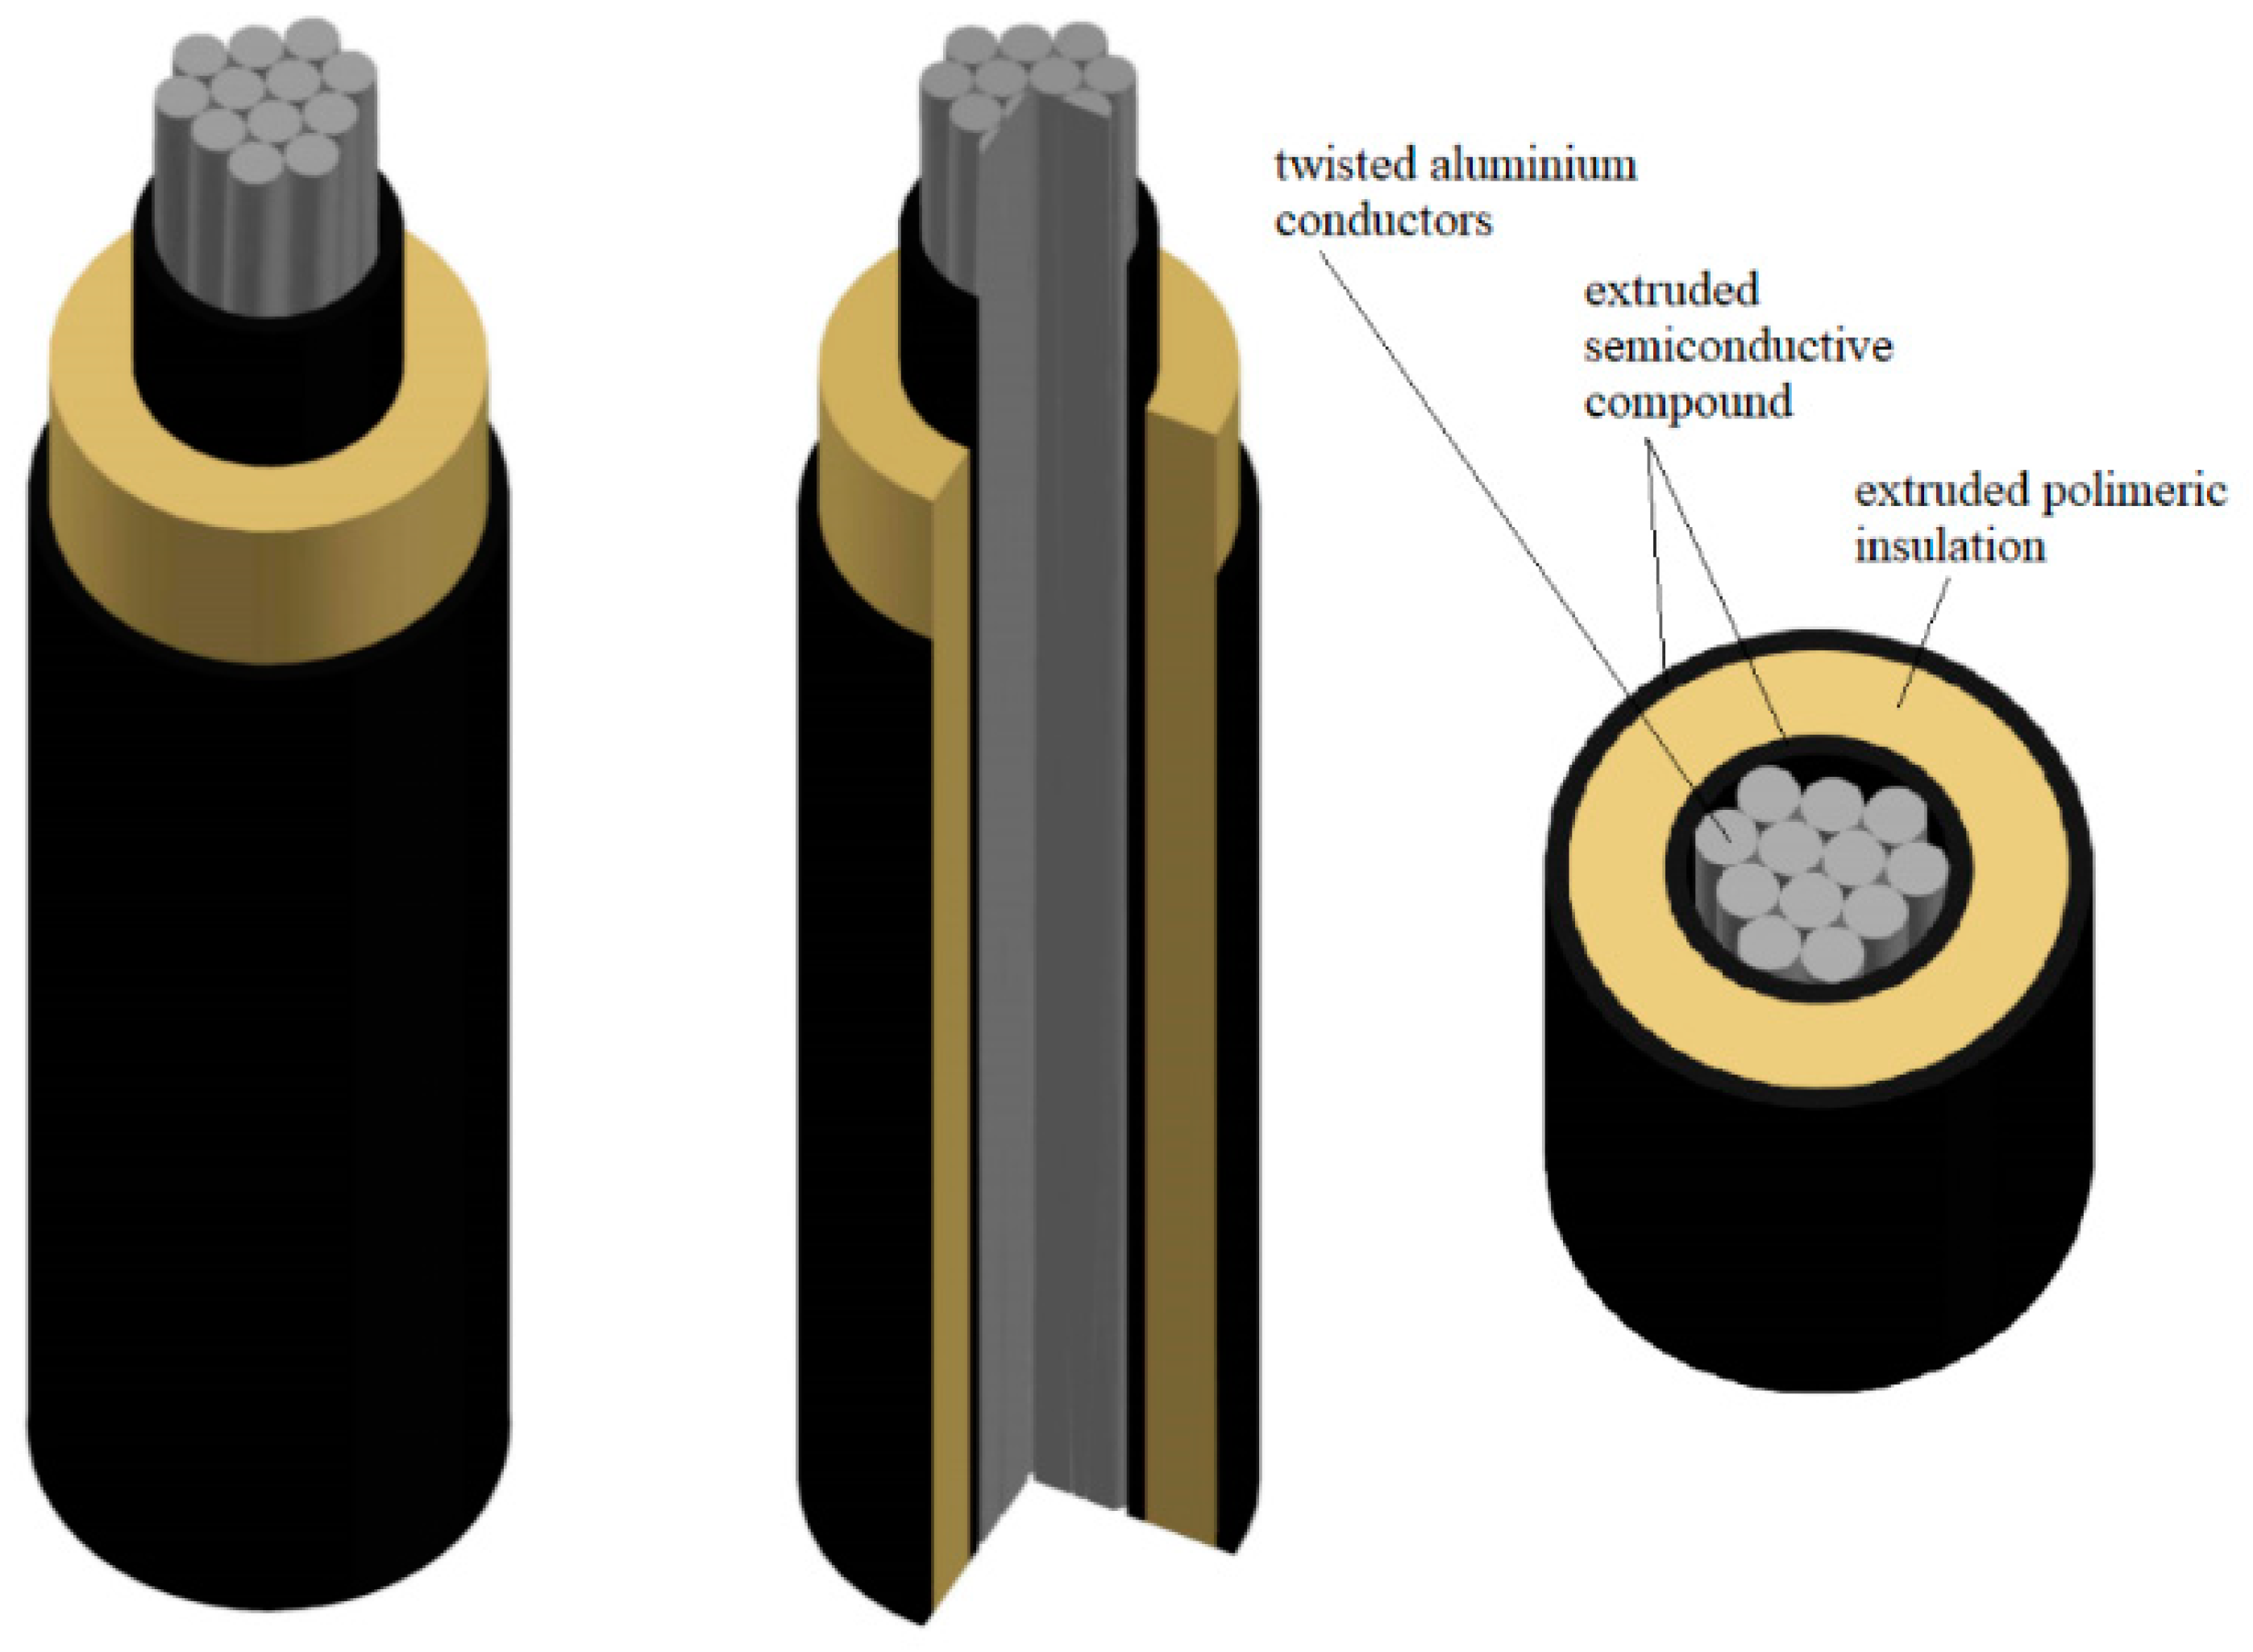
In Figure 1, the typical stratigraphic distribution of materials in an HVDC cable for land application is shown while, in Figure 2, a mini-cable is shown. The latter is typically devoid of the outer layers of the external semiconductor in order to easily perform space charge measurements. This is commonly considered a good solution for the qualification of semicon-dielectric-semicon compounds [7,8].
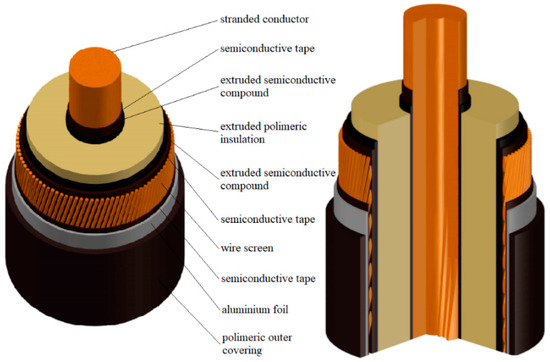
Figure 1.
Typical on High Voltage Direct Current (HVDC) full size cable.

Figure 2.
Typical HVDC mini-cable.
It has been demonstrated that, in the presence of a radial thermal gradient, the pattern of the electric field over the insulation layer of HVDC cables is strongly influenced by the current field over the insulation layer [1].
Combining the current continuity equation, the Ohm’s law for current density and the Gauss law for spatial charge, it has been shown that if there is a permittivity and conductivity gradient, there is a space charge density in accordance with the following Equation:
where σ is the electric conductivity, E is the electric field, ε0 is the vacuum permittivity, εr is the relative permittivity, and ρ is the free charge volume density.
Within the operating temperature range, the conductivity of existing insulating materials can vary up to three orders of magnitude, therefore, the distribution of electric field is heavily influenced by thermal gradient [1]. The thermal profile inside the dielectric of a cable typically follows a logarithmic law and depends on the conductive losses, the external surface heat exchange conditions, the material properties, and cable’s geometry.
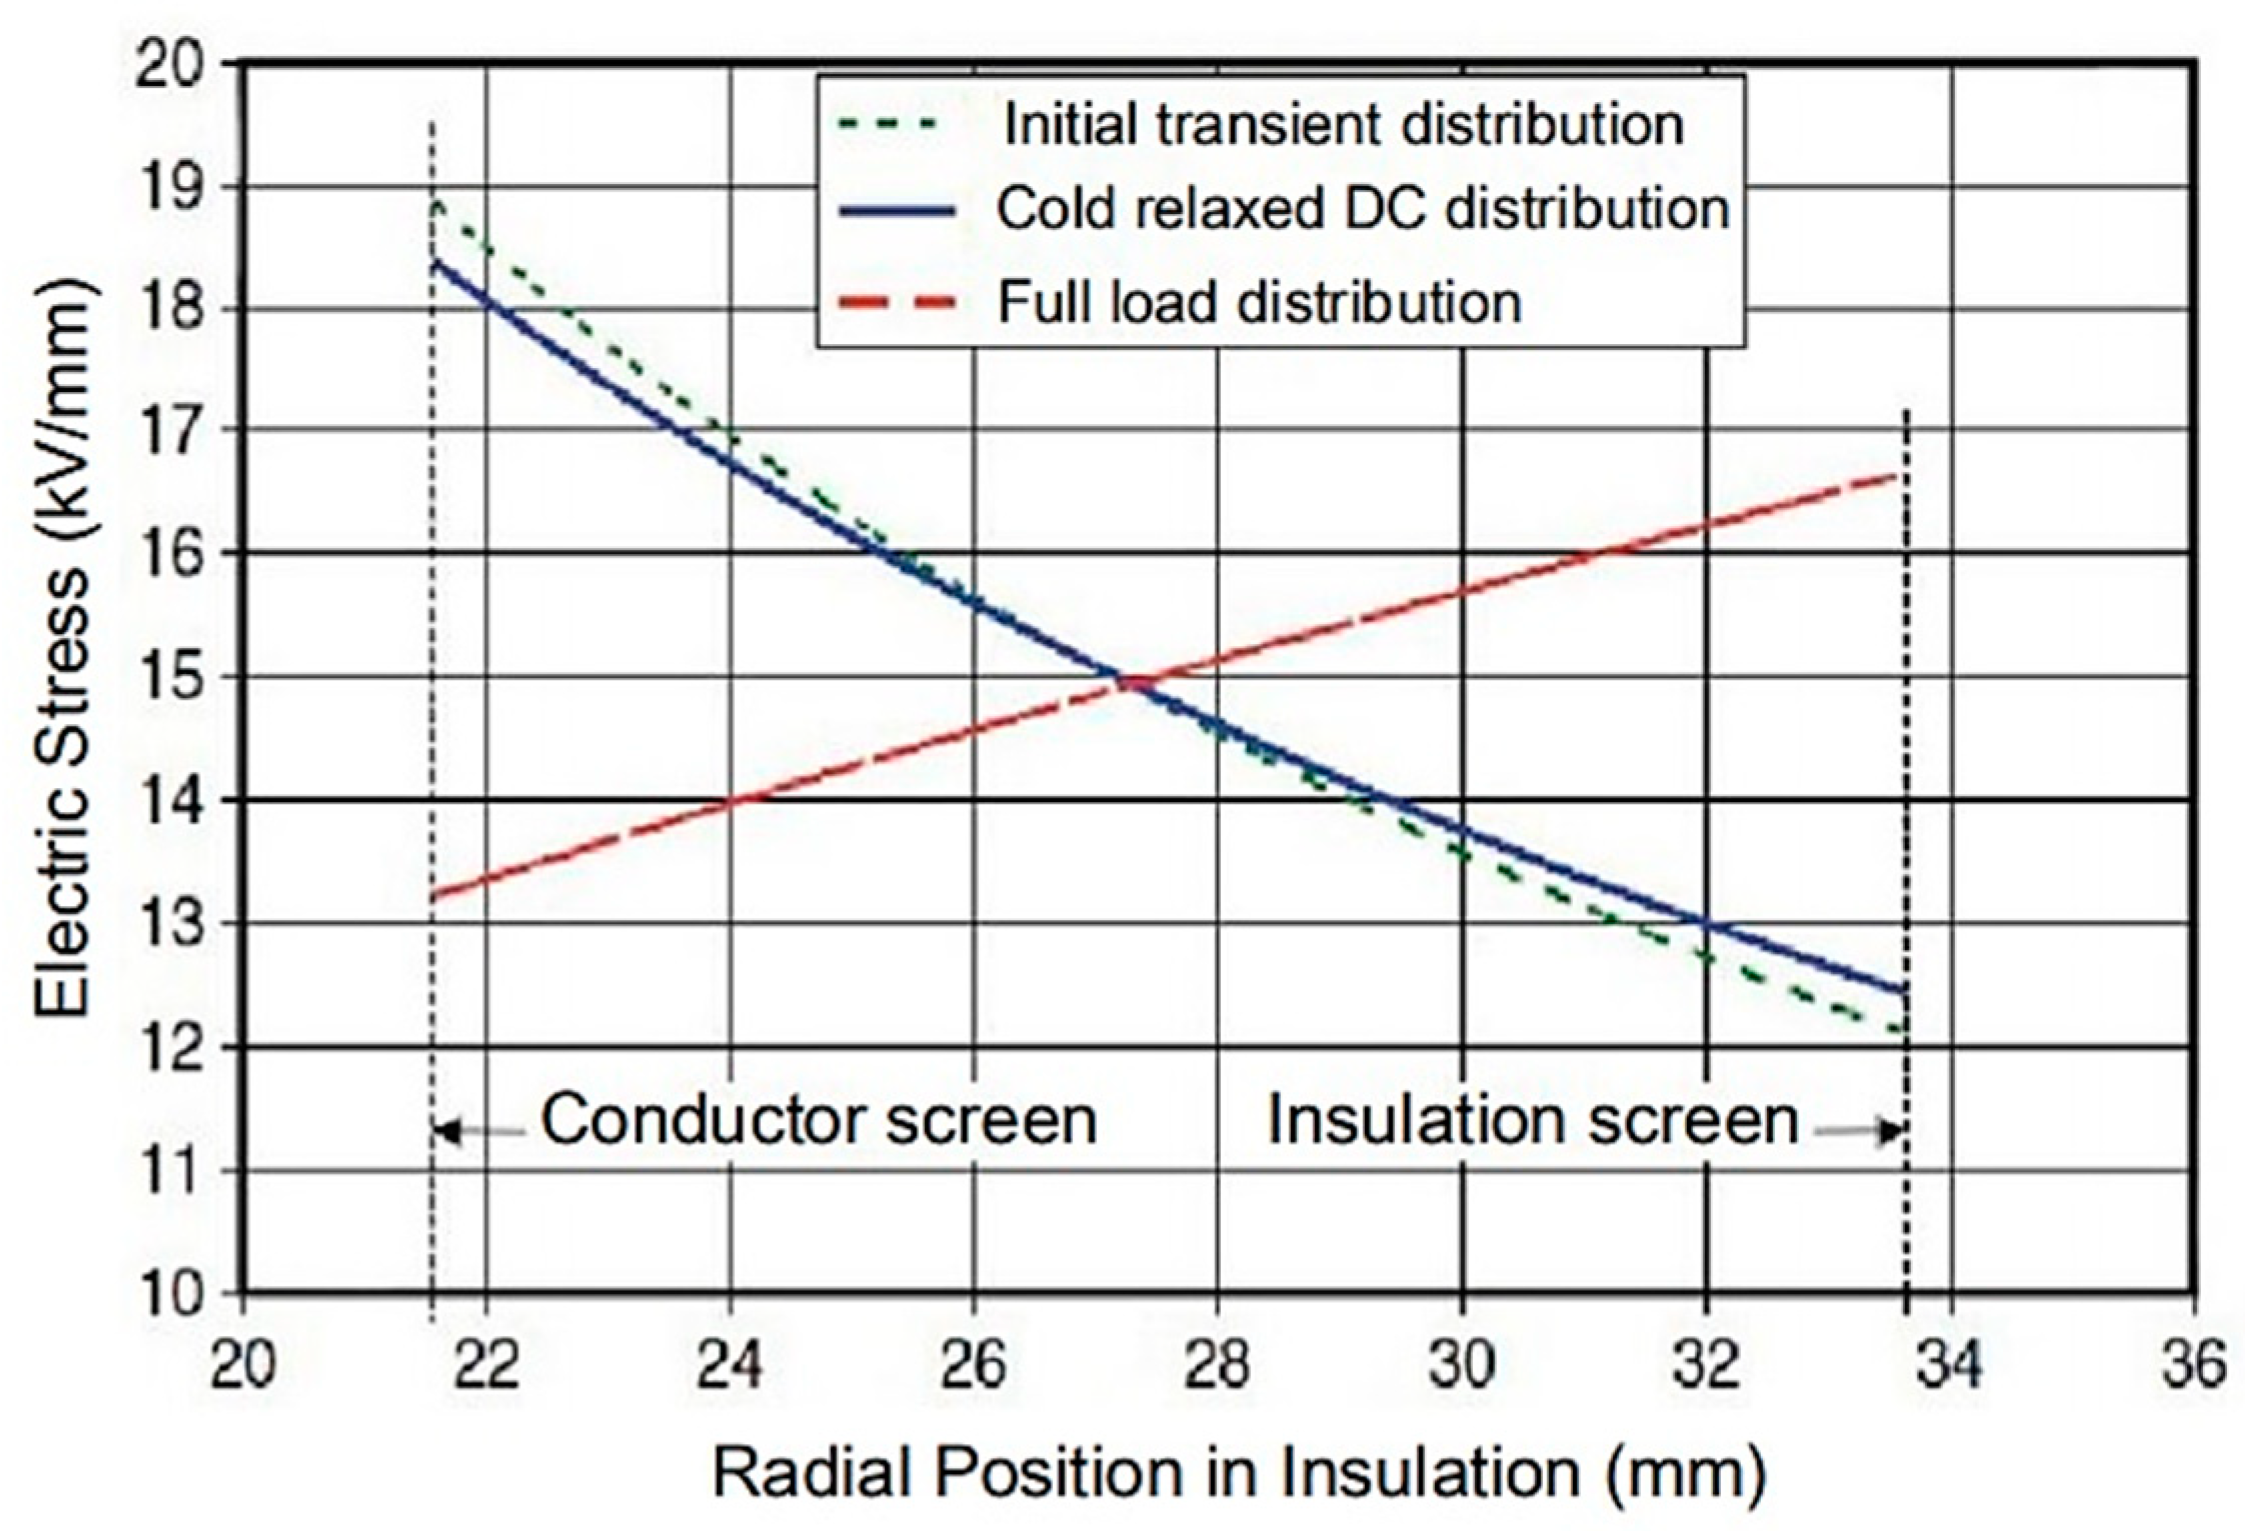
A high thermal gradient leads to a high conductivity gradient in the insulation until it causes a reversal of the radial electric field profile. For this reason, during recent years, new insulating materials have been developed in order to achieve high thermal conductivity and less dependence of the dielectric properties on temperature [9]. As shown in Figure 3, with typical operating temperature gradients for the HVDC cables, the radial component of the electric field at the external semiconductor layer can reach values close to the initial ones at the internal semiconductor layer.
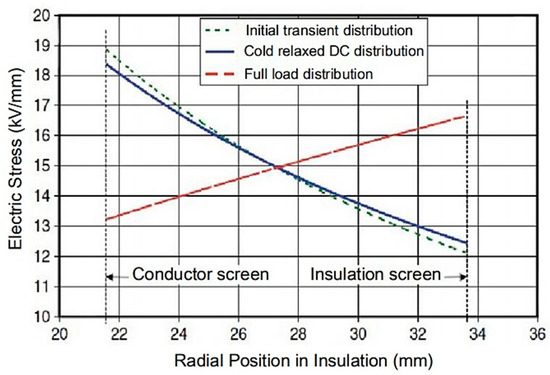
Figure 3.
Example of no-load and full load electric field distribution in HVDC cable—figure reproduced from [9].
The profiles shown in Figure 3 can be found through a semi-empirical expression useful to calculate the electric field across the dielectric EDC of an HVDC cable under thermal and electrical stress, as is reported in Equation (2) [1]:
where:
and ΔT is the temperature difference between the inner and the outer radius of the dielectric, a and b are, respectively, the temperature coefficient and the electrical stress coefficient of electrical conductivity, r0 and ri are, respectively, the outer and the inner radius of the cable insulation, and U0 is the voltage across the dielectric.
Equation (2) can be used to evaluate the electric field in a DC cable under thermal and electrical stress without considering other space charge formation and accumulation phenomena, strictly related to the interface quality, the material properties, and the presence of defects or traps. In real applications, other phenomena lead to the establishment of space charge in the dielectric such as the injection of charge carriers by the electrodes or their forming by means of thermal ionization effects as well as their trapping in the bulk due to the presence of defects, discontinuities, additives, etc. [1].
The typical crosslinking by-products of XLPE (cross-linked polyethylene) insulated cables are one of the main types of defects that enhance the accumulation of space charge. The degassing of the insulation material is a good solution to reduce the presence of crosslinking by-products [10]. Trap depths can be estimated by applying the PEA method for space charge measurements in different scenarios: equilibrium, charging, and discharging [11]. The sum of the aforementioned phenomena leads to a not negligible modification of the radial electric field distribution inside the insulation of a HVDC cable, with respect to the ideal one. These phenomena play an important role during some transient scenarios that occur during the lifetime of an HVDC cable, such as fast polarity inversion and transient over voltages.
At the beginning of a fast polarity inversion transient, the inverted electric field profile due to the thermal gradient and to the other above-mentioned phenomena, is added to the new conditions related to the polarity inversion. Under certain conditions depending on thermal gradient, age level, and characteristics of the cable, the maximum local electric stress could significantly exceed the rated value leading to the ageing of the cable. This, in the presence of defects, such as crosslinking by-products, could lead to partial discharge phenomena and to the aging of the cable’s insulation, causing its breakdown [12].
3. Principles of the Pulsed Electro Acoustic (PEA) Method—Application on Flat Specimens
The Pulsed Electro Acoustic (PEA) method is currently the most used technique for the space charge accumulation measurements into dielectric materials. As already underlined, the widespread use of the PEA method in detecting space charge phenomena in HVDC cables and mini-cables has led to the development of international standard and protocols for its implementation in Prequalification (PQ) tests, Type Tests (TT) [5,6], and ageing programs [13].
This section briefly explains the principles of the PEA method through the description of its application on flat specimens.
The PEA method is physically based on the measurement of the acoustic waves generated by the vibrations of charge carriers, laying into the dielectric material, by means of a superimposed pulsed voltage applied between the electrodes.
In Figure 4, the path of the pressure waves generated by the vibration of the charge carriers within the dielectric is illustrated. After having reached one of the specimen interfaces, the pressure waves propagate toward a metallic grounded electrode and are converted into an electric signal by a piezoelectric membrane. Downstream of the latter, an absorbent material avoids the reflection of the pressure waves.
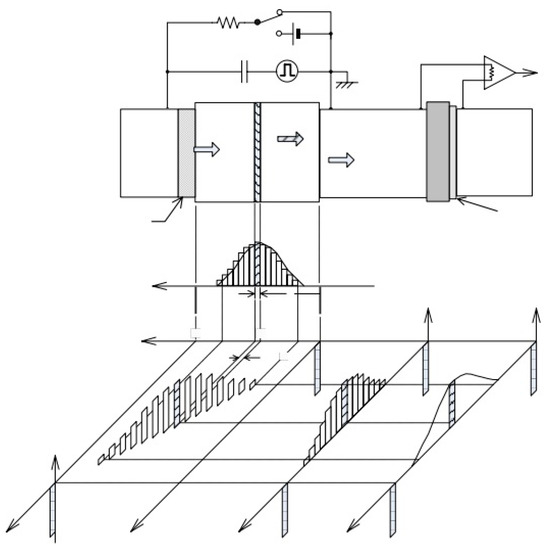
Figure 4.
Pressure wave propagation into a flat specimen of dielectric material—figure reproduced from [17].
In order to minimize the pressure waves reflection before their detection with the piezoelectric sensor, the adherence of the contact surfaces between the crossed materials should be optimized.
In Figure 5, a schematic of the measurement setup for flat specimens is shown. On the left-hand side, the high voltage aluminum electrode is connected with the output of the DC voltage source VDC and with the pulse generator Vp(t). A bias resistor RDC and a decoupling capacitor CC are inserted between the high voltage electrode and the VDC source and the pulse generator, respectively, in order to correctly superimpose the pulses on the DC voltage. A backing material is interposed between the high voltage electrode and the dielectric sample in order to optimize the interface from the point of view of the electrical and acoustic characteristics. On the right-hand side of the sample, a grounded aluminum electrode is crossed by the pressure waves generated by the vibration of charges and is linked to the piezoelectric transducer. The latter is linked to another aluminum electrode by means of a backing material.
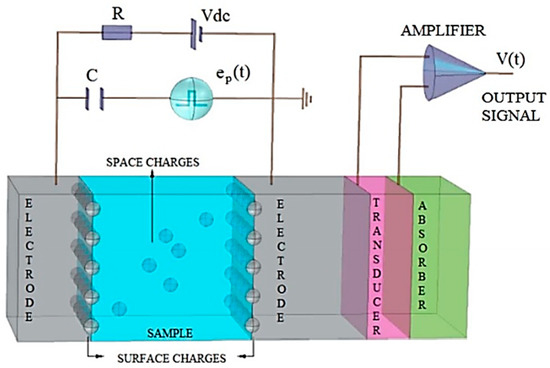
Figure 5.
Measurement setup scheme for flat specimens—figure reproduced from [18].
The electric signal produced by the interaction of the pressure waves with the piezoelectric membrane is measured between the grounded and the extreme right-hand side electrodes, and it is amplified in order to allow the measurement by the oscilloscope. The value of RDC is typically much larger than the impedance of the sample capacity at the frequencies of the pulse generator. A semiconductor is used as backing material due to its acoustic impedance value which is similar to that of the dielectric material. A thin polivinylidene difluoride (PVDF) film is used widespread as a piezoelectric transducer when the measurements are carried out at environmental temperature [14]. If higher temperatures are reached, a crystal sensor of Lithium Niobate is more reliable due to its stability in the presence of temperature changes [15].
The thickness of the piezoelectric membrane plays an important role for the goodness of the measurement since the wave crossing time through the film is proportional to the spatial resolution of the results [16]. On the other hand, a thin film generates a small signal amplitude. A compromise must be therefore reached between the need for a satisfactory spatial resolution and a sufficient signal amplitude output from the piezoelectric.
The spatial resolution of the PEA setup may be defined as the minimum distance z over which a volumetric charge density variation can be measured. The spatial resolution is related to the pulse width ΔTp, to the sample thickness d, and to the sound velocity in the sample, about 2000 m/s in polyethylene, as follows [16,17]:
Usually, the value is in the range between 0.02 and 0.05. The spatial resolution of the PVDF film is calculated by the time necessary for the pressure wave to cross the piezoelectric membrane with the time necessary to cross the sample [16]:
where b and up are the piezoelectric film thickness (with an order of magnitude of about 50–500 μm) and sound speed within 2600 m/s for PVDF film, respectively. Nonetheless, the ratio b/up has to be much smaller than ΔTp in order to accurately transform the measured pulse by the means of signal deconvolution.
As mentioned above, the presence of material interfaces along the path of the pressure waves leads to reflections depending on the change of the acoustic impedances. Multiple reflections of the generated waves cause the distortion of the measurement output pattern. In particular, with reference to Figure 5, the high value of the sound velocity in the aluminum grounded electrode (about equal to 6400 m/s) could lead to the superimposing of the doubly reflected waves generated at the closer sample interface with the direct wave started at the farthest one [18]. In order to avoid the above-mentioned waveform distortion, the thicknesses of the layers of different materials of the PEA cell have to be calibrated, taking into account the multiple reflections. Nevertheless, since the acoustic impedances depend on the temperature and on the mechanical stress of the materials (a clamping force generates a variation of density), the status of the sample has to be well known before the beginning of the PEA measurements.
Again with reference to Figure 5, the voltage signal existing between the grounded and the extreme right hand side electrodes, after the conversion of a pressure wave pulse, has an order of magnitude of some millivolts. The signal is then amplified and sent to the oscilloscope with a time resolution sufficiently smaller than the measurement resolution in time domain.
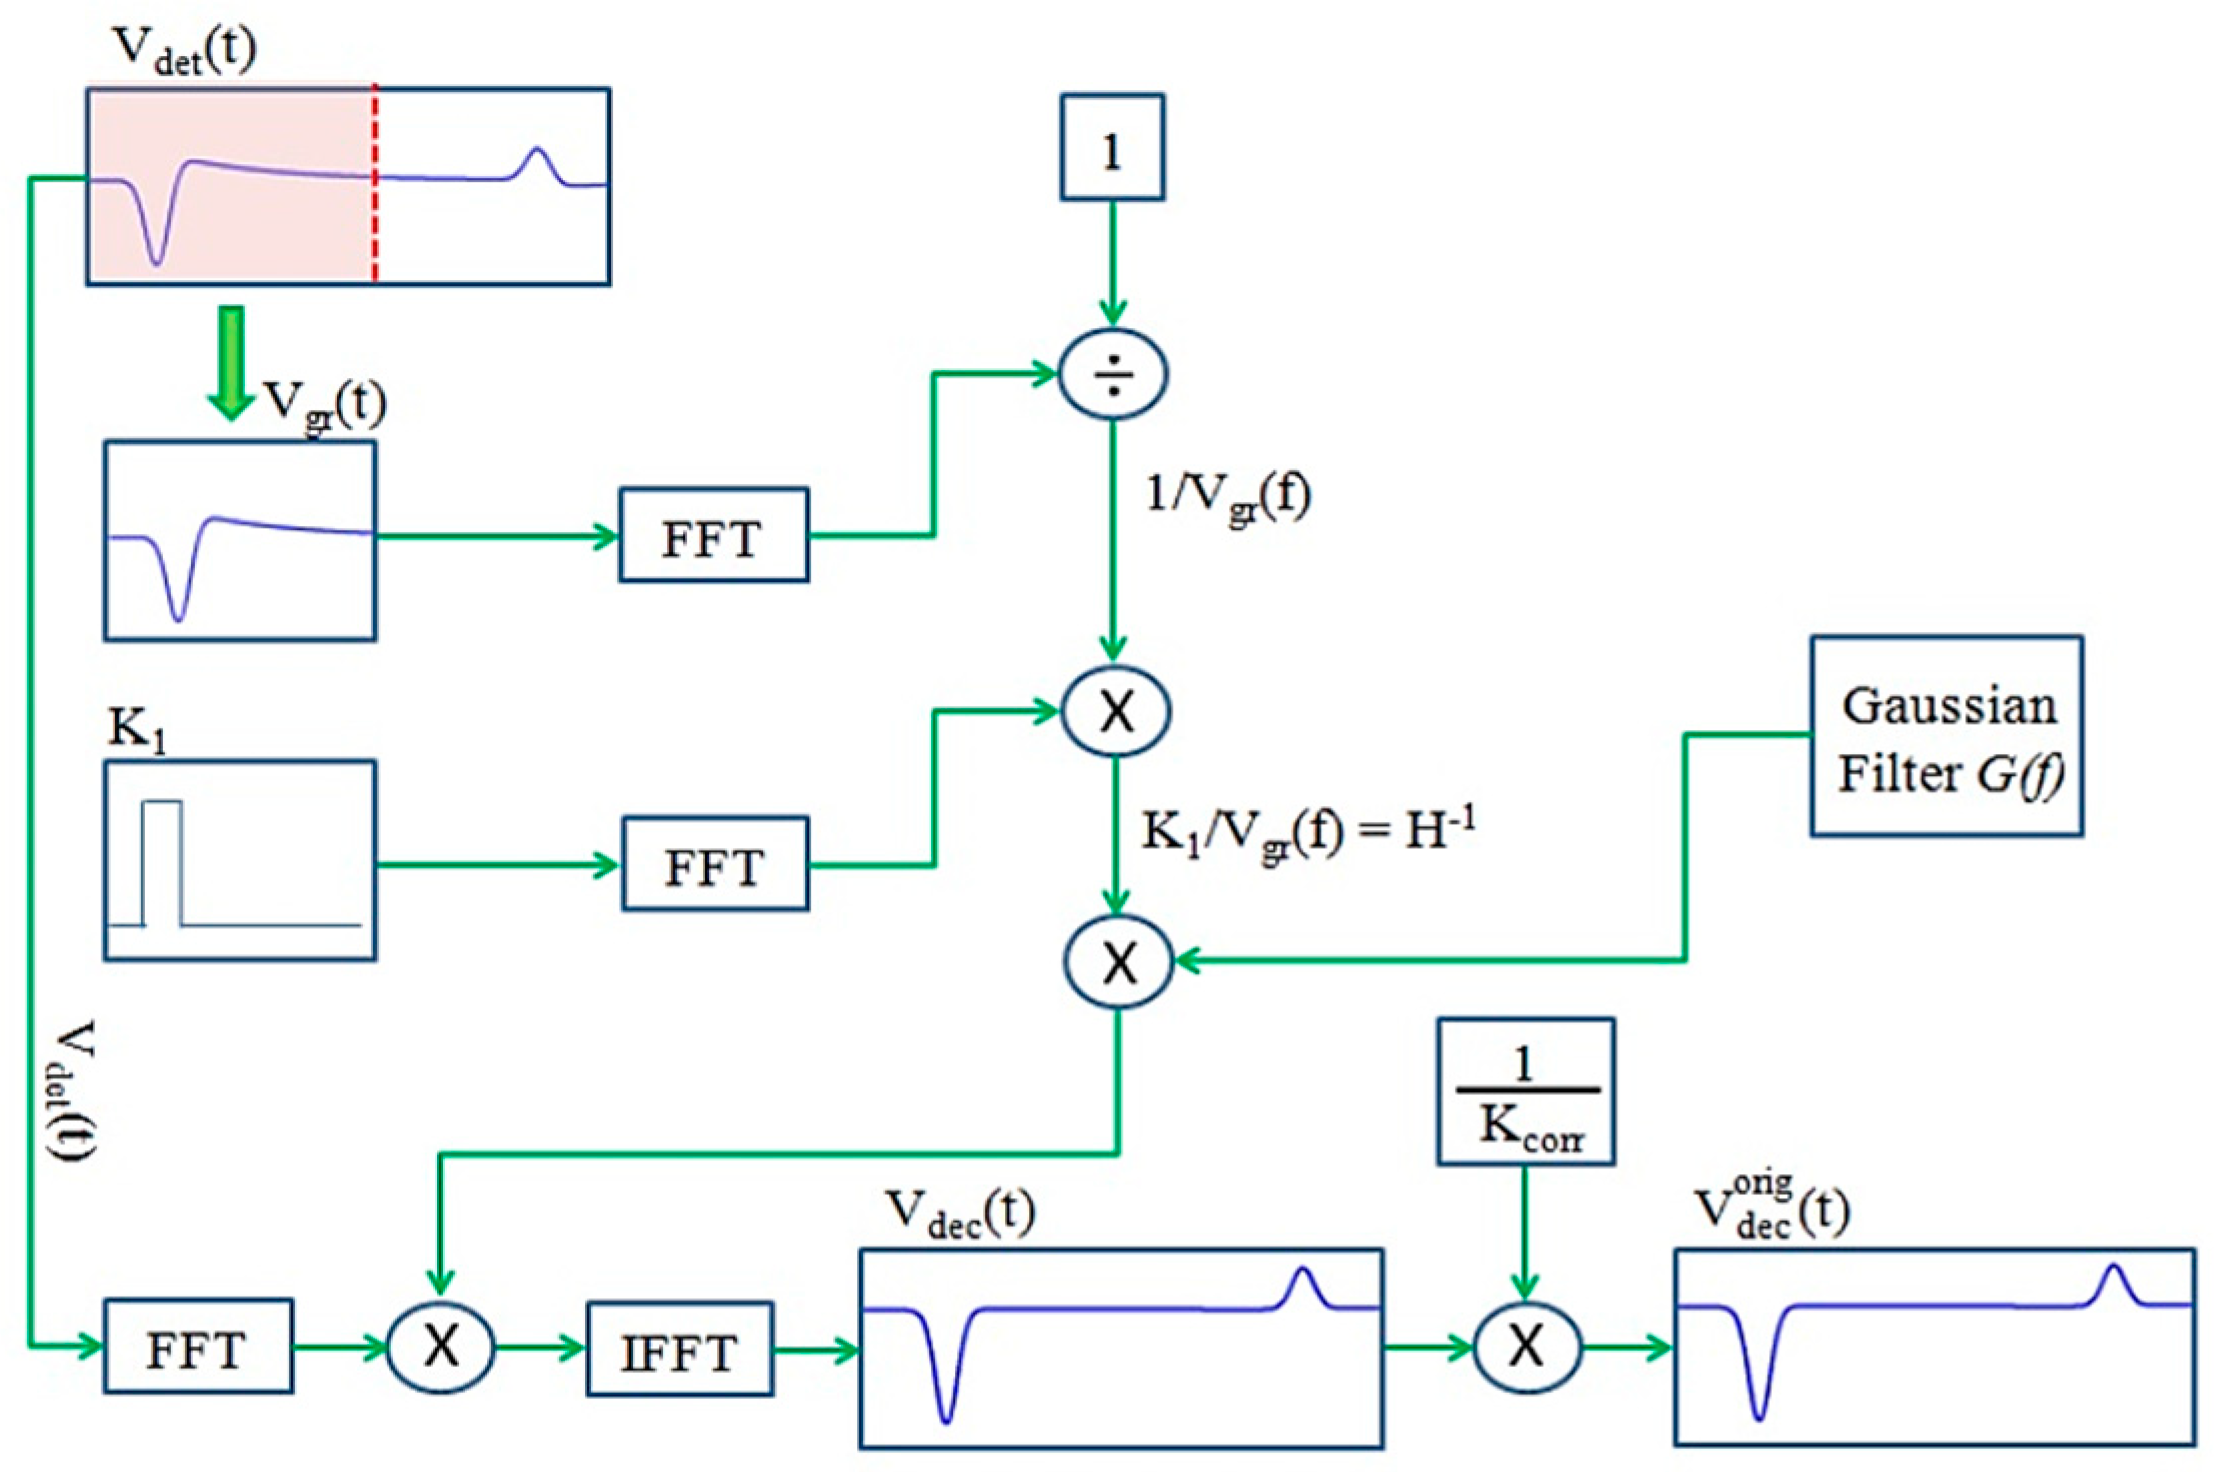
In order to obtain a reliable space charge pattern at the output of the PEA setup, the outgoing signal of the amplifier, measured by the oscilloscope, has to be deconvoluted and calibrated [17]. The signal at the amplifier is affected by distortion because of the acoustic reflection and due to characteristic nature of the detection circuit. A deconvolution technique is therefore applied in order to obtain the waveform with two peaks shown in Figure 6 [19]. Since the aforementioned distortion can be considered as a systematic error, the deconvolution can be based on the signal obtained by applying a small electric field at the sample. In this condition, it can be assumed that the charges lay exclusively at the electrode interfaces while no charge is in the bulk of the dielectric. With this assumption, the surface charge density at the electrode σ0 can be calculated as:
where VDC is the applied voltage, τS is the sampling time due to the resolution of the oscilloscope, and usa is the sound speed into the sample. The space charge at the electrode surface is detected as a volumetric density due to the non-zero spatial resolution of the oscilloscope equal to τS usa.

Figure 6.
Example of deconvolution.
The measurement output in the above described conditions involves two peaks with different heights due to the partial absorption of the pulse generated at the farthest electrode. The higher peak measured at the oscilloscope can be compared with the calculated value of in order to evaluate the transfer function. The deconvolution process in PEA measurements, schematized in Figure 6, is extensively described in [19].
Once the output deconvoluted signal is obtained in millivolts, a further operation is necessary in order to calculate the value of volume density charge. By assuming that the pulsed voltage is square shaped, the following expression can be used in order to convert the output deconvoluted signal in space charge [20]:
where K is calculated on the basis of a comparison with the signal obtained from a known value of space charge [20].
The above described principles are the basis for using the PEA method on flat specimens. The measurement setup shown in Figure 5 can be used for single or multiple dielectric layers [2,19]. In the case of space charge measurements on multilayer flat specimens, particular attention must be paid to take into account the different permittivities and acoustic properties of the layers [21,22]. The pressure distribution at the piezoelectric membrane depends on the acoustic impedances (Z) of the crossed materials, defined as the product between the acoustic velocity and the mass density. When the acoustic wave passes from a material with acoustic impedance Z1 to a material with acoustic impedance Z2, the ratio of the transmitted pressure amplitude T can be calculated as follows:
On the other hand, the ratio of the reflected pressure amplitude is calculable by the following:
From the above Equations, it can be deduced that high differences in acoustic impedances of the crossed layers lead to high reflection ratios. Multiple reflections can distort the measurements as shown in Figure 7 [23]. In addition, for the aforementioned reasons, it is necessary to optimize the continuity between the piezoelectric sensor and the sample in order to avoid the presence of gas. The acoustic impedance of the latter is several orders of magnitude lower than that of the solid materials, therefore, high values of reflection factors could be reached shielding a portion of the sample.
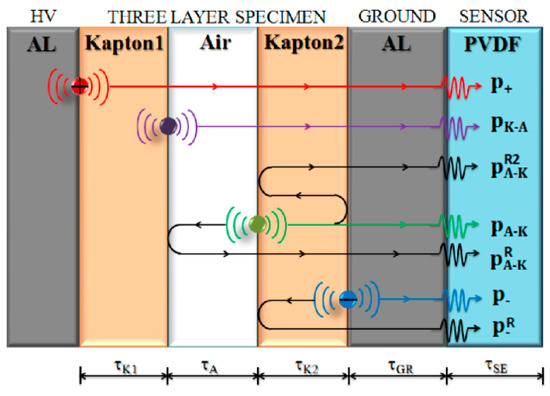
Figure 7.
Acoustic wave multiple reflections within a multilayer flat specimen—figure reproduced from [22].
4. Measurements of Space Charge on Cables and Mini-Cables with the PEA Method
In 1990, K. Fukunaga and their group developed for the first time the application of the PEA method to cables [24].
The space charge measurement by the PEA method in cables and mini-cables is a reproduction of the above described principles on cylindrical geometry. With reference to Figure 5, the upper and lower electrodes are substituted by the inner and outer semicon layers. The pulsed voltage generating the pressure waves is therefore applied between the cable conductor and an external flat or rounded electrode adjacent to the outer semicon layer. With reference to Figure 8, the space charge distribution can be measured in a portion of cable having sizes depending on the extensions of piezoelectric membrane and the contact surface between the cable outer and the bottom electrode. Unlike the application of PEA method to flat specimens, in cable systems, one of the two electrodes is not directly accessible. For this reason, various measurement setups have been developed in the last decades for the application of the PEA method on cables and mini-cables.
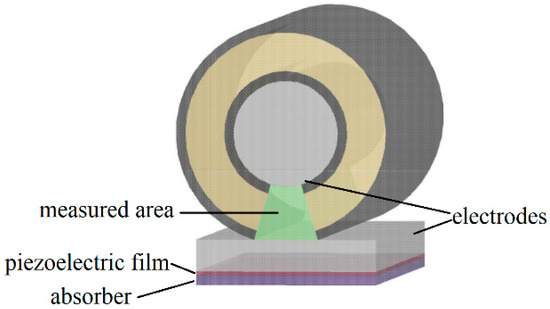
Figure 8.
Space charge measurement on a cable portion by the Pulsed Electro Acoustic (PEA) method.
In all setups described below, the pulse generator output is indirectly connected to electrodes of the measurement area. This leads to obtain a deformed and delayed waveform at the interfaces of the dielectric portion in which the space charge has to be measured. The main purpose of the different approaches is to find an optimized solution to apply the pulsed electric field to the measured area based on the cable thickness and length.
4.1. SETUP 1—Pulsed Voltage Applied to the Cable Conductor
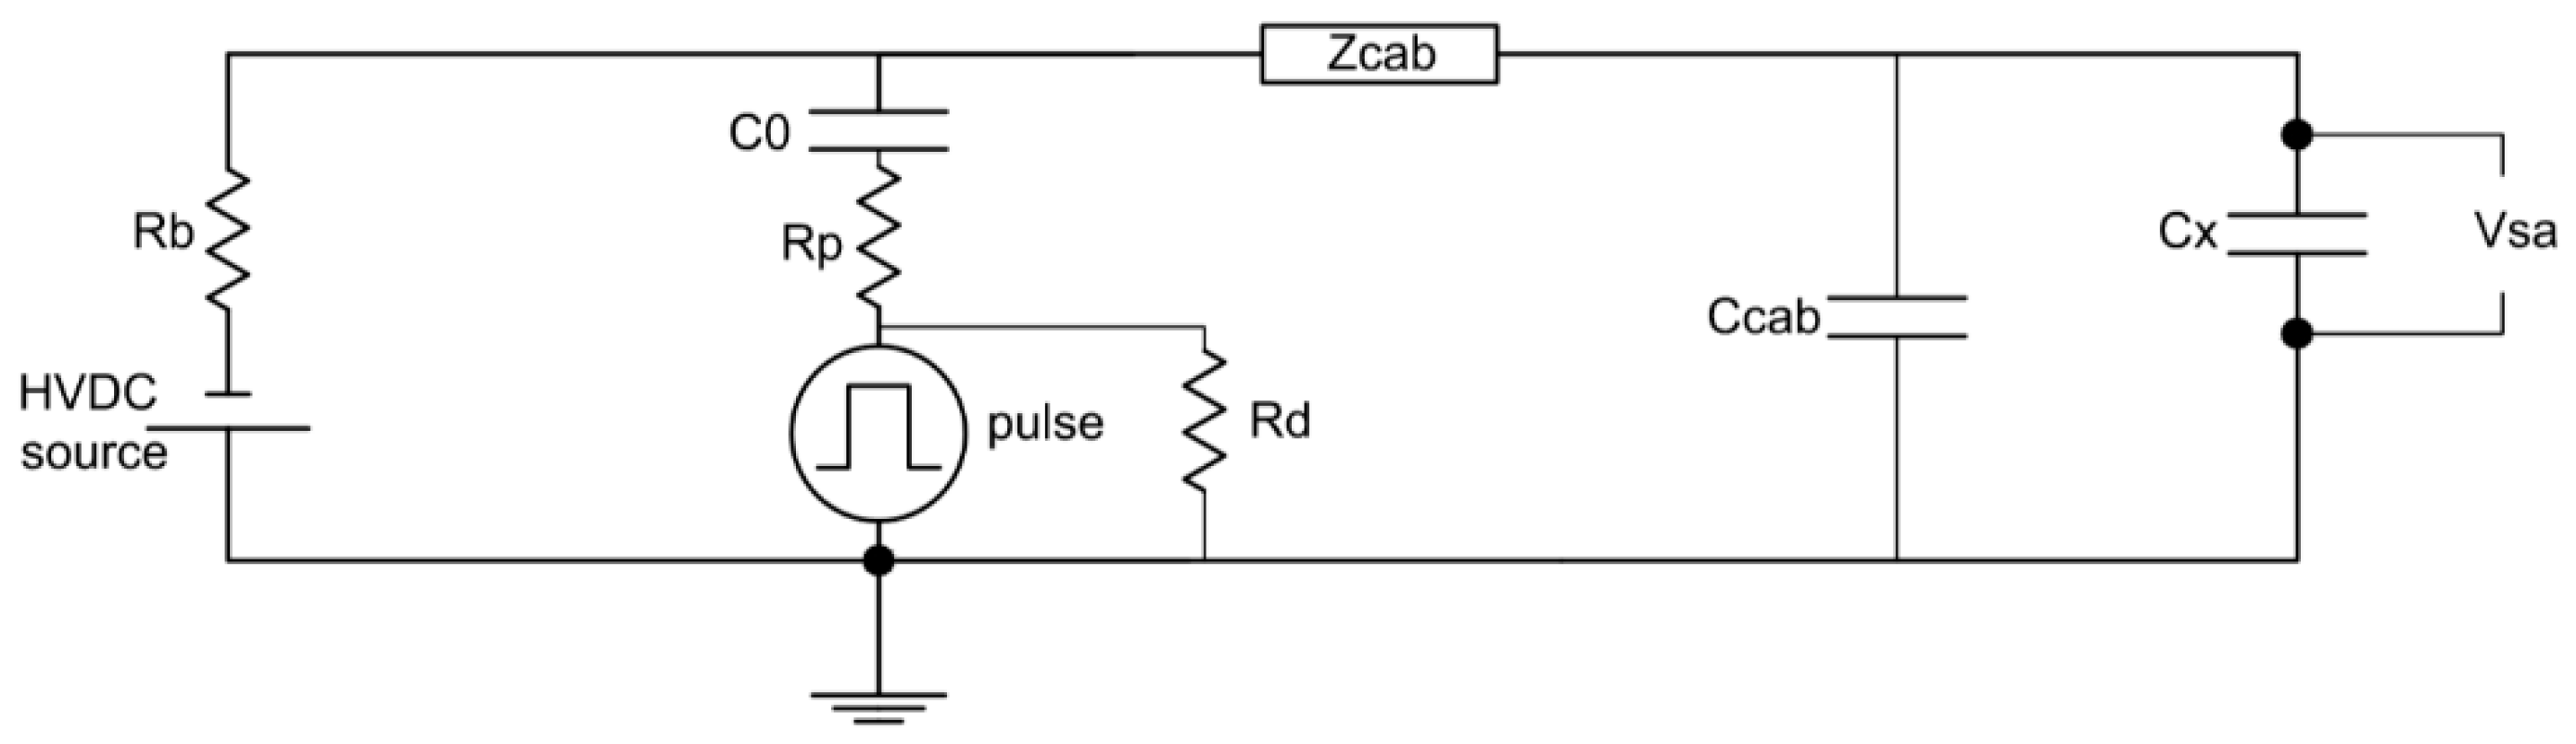
The first PEA measurement setup described in this review and here called Setup 1 is illustrated in Figure 9. It was proposed for the first time by K. Fukunaga et al. [24] and derives directly from the configuration adopted in the case of flat specimens shown in Figure 5. In this approach, the HVDC supply and the pulsed voltage are both applied to the cable conductor. In Figure 10 a schematic of the Setup 1 is shown where a bias resistor Rb is interposed between the HVDC source and the cable conductor while a capacitor C0 decouples the latter from the pulse generator output. The sizes of the cable are taken into account through the impedance Zcab and the capacitance Ccab. In order to maximize the amplitude of Vsa, the impedance of Cx has to be much higher than that of C0. The schematic shown in Figure 10 is valid if the cable specimen is short enough to be treated as a lumped capacitance within the frequency region of the pulsed voltage [25]. For long cables it has to be taken into account that the pulses are reflected at the terminals due to the impedance mismatch. For this reason, the Setup 1 is inapplicable to cables with length greater than 0.5 m. In the first version of Setup 1, a round PEA cell electrode was faced to a sector of the outer semicon layer of the cable specimen [26,27]. In this way, the curvatures of the ground electrode and cable external surface must be the same, therefore a certain PEA cell is usable just for a certain cable size. Moreover, the impossibility of obtaining in practice a perfect contact of the facing surfaces leads to the presence of air gaps responsible of reflection of a part of the pressure waves. In order to overcome the aforementioned disadvantages, the configuration of the Setup 1 illustrated in Figure 8 was proposed by M. Fu et al. in 2000 [28]. In this case, the absence of air gaps in the contact surface between the semicon layer and the ground electrode is guaranteed by a clamping force applied to the cable.
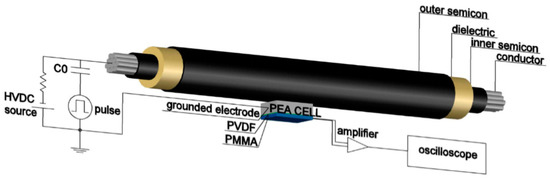
Figure 9.
Setup 1: pulsed voltage applied to the cable conductor.
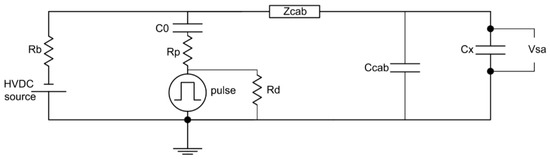
Figure 10.
Schematic of Setup 1.
4.2. SETUP 2—Pulsed Voltage Applied to the Outer Semicon Layer at the Sides of the Measurement Point
In Figure 11 the PEA measurement configuration here named Setup 2 is shown. This measurement configuration, extensively described in [29], involves in the application of the pulsed voltage to two symmetric conductive tapes wound around the outer semicon layer at the sides of the measurement region. The pulsed voltage is transmitted to the cable conductor by means of the dielectric layer, therefore, the decoupling capacitor needed in Setup 1 is not necessary in this configuration. The semicon layer is partially stripped as shown in Figure 11 so that the total capacitance between the lateral conductive tapes and the conductor is twice the capacitance at the measurement point. With reference to the diagram illustrated in Figure 12, the pulsed voltage is applied at the cable conductor by the means of two equivalent capacitances C1. The regions between the lateral tapes and the measurement point can be modelled as a mainly capacitive impedance Zg. The Setup 2 can be considered as a semi-destructive method because a mechanical action on the outer semicon layer is necessary. For this reason, the Setup 2 is mainly applicable on mini-cables. Nevertheless, the partial stripping of the external semiconductive layer induces a floating voltage on the surface adjacent the grounded electrode of the PEA cell which is no longer uniformly grounded. For this reason, this measurement setup is not applicable for long cables [17].
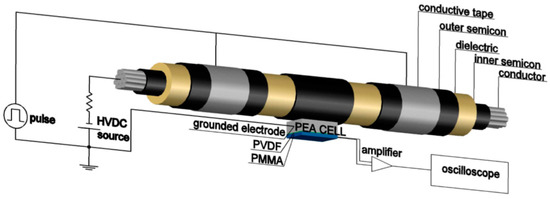
Figure 11.
Setup 2: pulsed voltage applied to the partially stripped outer semiconductor.
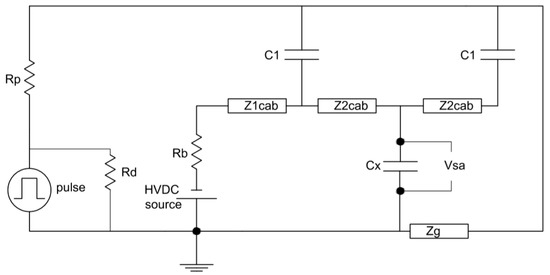
Figure 12.
Schematic of Setup 2.
4.3. SETUP 3—Pulsed Voltage Applied to the Outer Semicon Layer at the Measurement Point
In Figure 13, the measurement configuration here called Setup 3 is shown, where the pulsed voltage is applied directly to the outer layer of the measuring region by the means of a conductive film coiled around the cable. In the first version proposed by N. Hozumi et al. [25], a PET film was interposed between the aforementioned conductive layer and the aluminum block of the PEA cell in order to decouple the measurement devices from the high voltage. Compared to the other setups, in this case, the pressure waves have to cross two additional layers before reaching the piezoelectric membrane. An improved version of Setup 3, proposed by N. Hozumi et al. in 1994, consists of the application of the pulsed voltage to the PEA cell electrode and in the decoupling of the amplifier from the oscilloscope by means of an optical fiber [30].

Figure 13.
Setup 3: pulsed voltage applied to the PEA cell’s electrode.
The use of this method requires the insulation of the PEA cell and of the amplifier from the ground. On the measurement region sides, beyond a stretch of cable with the outer semicon layer exposed, the remaining external surface is grounded by the means of a conductive tape. With reference to Figure 13 and Figure 14, the impedance Zg is, in this case, mainly resistive. Since the pulsed voltage is directly applied to the measurement region, this setup is less influenced by reflection and attenuation of the HV signal than the other methods described above [25]. This makes this method applicable for long, full size cables as proposed by N. Hozumi et al. in 1998 [31]. In this configuration, the PVC jacket and the screen are removed near the measurement point, positioned at the center of the exposed semicon region. The pulsed voltage is applied between the PEA cell electrode and the wire screen of the cable. The amplitude of the pulsed voltage is proportional to the ratio between the impedance of the capacitance at the measurement point and the characteristic impedance of the cable. This makes this method also applicable to thick insulations because the amplitude of the pressure waves generated at the farthest electrode is proportional to the amplitude of the voltage pulses.

Figure 14.
Schematic of Setup 3.
The properties of the E/O and O/E converters, particularly in terms of sampling rate, has to be taken into account in order to avoid cutting high frequency contributions. For this purpose, an improved version of Setup 3 is proposed in [16] and it consists of the direct connection between the amplifier and the oscilloscope. The latter is therefore insulated from the ground and connected to a PC by means of optical fiber.
Thanks to its applicability to long and thick specimens, Setup 3 is mentioned by the standard [5] which recommends carrying out PEA measurements before and after PQ (Pre-Qualification) and TT (Type Test) on full size cables. As specified by this protocol, the PEA cell has to be adjacent to the outer semi conductive layer, therefore the removal of the external shield is necessary. Since a different degassing could occur to the cable section with or without the external coating during the load cycle, two different procedures could be carried out.
The first of them consists of PEA measurements performed before and after PQ test or TT on a secondary virgin cable sample identical to that subjected to the load cycles. In this case, the secondary sample is subjected to the same load cycles as the primary one. This procedure can be used if the humidity of the laboratory is carefully controlled and the effect of crosslinking by-products on space charge phenomena are not predominant. Indeed, the degassing effect of load cycles leads to a reduction of crosslinking by-products and consequently the tendency to accumulate space charge. An alternative to the above procedure is the implementation of the PEA measurements on the primary cable sample near one of the terminals in order to enable the removal of the region altered by the exposure of the outer semicon. As it can be deduced from the above described measurement setups, several parameters have a relevant influence on the results of a space charge measurement in a cable carried out with the PEA method. For the sake of simplicity, the following is a brief list of the most relevant aspects to consider when preparing a PEA measurement setup on cables or mini-cables in order to perform replicable and reliable measures.
Electrical stress application. Different levels of electric field are related to different space charge formation and accumulation phenomena, therefore, several electrical stresses should be tested in the range of the typical working conditions (10–30 kV/mm).
Thermal conditions. The presence of a thermal gradient leads to the establishment of space charge within the dielectric due to the dependence on the temperature of the material conductivity. Nevertheless, electric and acoustic impedances of the sample and of the measurement setup can vary with the temperature. In light of the above, the environmental and sample temperature should be monitored in order to carry out replicable measurements. In addition, the temperature at the piezoelectric film should be compared with its tolerability. The output signals generated with piezoelectric films in PVDF are stable up to 70 °C whilst, at 100 °C, the intensity decreases to halve the value at 27 °C. Piezoelectric films in LiNb03 give a stable signal until 100 °C [15]. In order to carry out measurements at high temperatures, a short-circuited HVDC sample cable is passed inside the primary of a transformer and becomes its secondary. The primary induces a current in the conductor, which then heats it up [32]. An example of the aforementioned setup is shown in Figure 15. In this example, a current of 32 A passes through a mini-cable with an external radius of 3.05 mm to reach an outer temperature of 60 °C and an inner temperature of 70 °C [33]. The induced current has to be calibrated in order to generate the necessary thermal power density inside the cable conductor to reach the desired thermal gradient over the insulation.

Figure 15.
Example of PEA setup for measurements at high temperatures—figure reproduced from [33].
Spatial resolution. As specified in Section 2, the spatial resolution of a PEA measurement system depends on the relation between the width of the voltage pulse at the measurement point and the thickness of the components crossed by the acoustic wave generated in the sample. Compared to the original signal, the width of the voltage pulse at the measurement point could be enlarged and/or deformed by the aforementioned reflection phenomena. Nonetheless, other parameters can have a relevant role in the definition of the spatial resolution such as the sampling rate of the oscilloscope or of the E/O converter, the bandwidth of the amplifier, and the deconvolution process.
Sensitivity. The minimum amount of space charge expressed in C/m3 which is detectable with a PEA system essentially depends on the thickness of the sample and the noise level. The latter can be reduced averaging over time the system output. The typically reached sensitivity has an order of magnitude of 1–10 C/m3.
Cable clamping. The cable has to adhere perfectly to the PEA cell electrode in order to avoid the presence of air at the interface, therefore, a clamping force should be applied to the sample. The establishment of mechanical stresses, especially into the cable, induces a variation of the sound velocity within. In light of the above, the clamping force has to be carefully monitored in order to carry out replicable measurements.
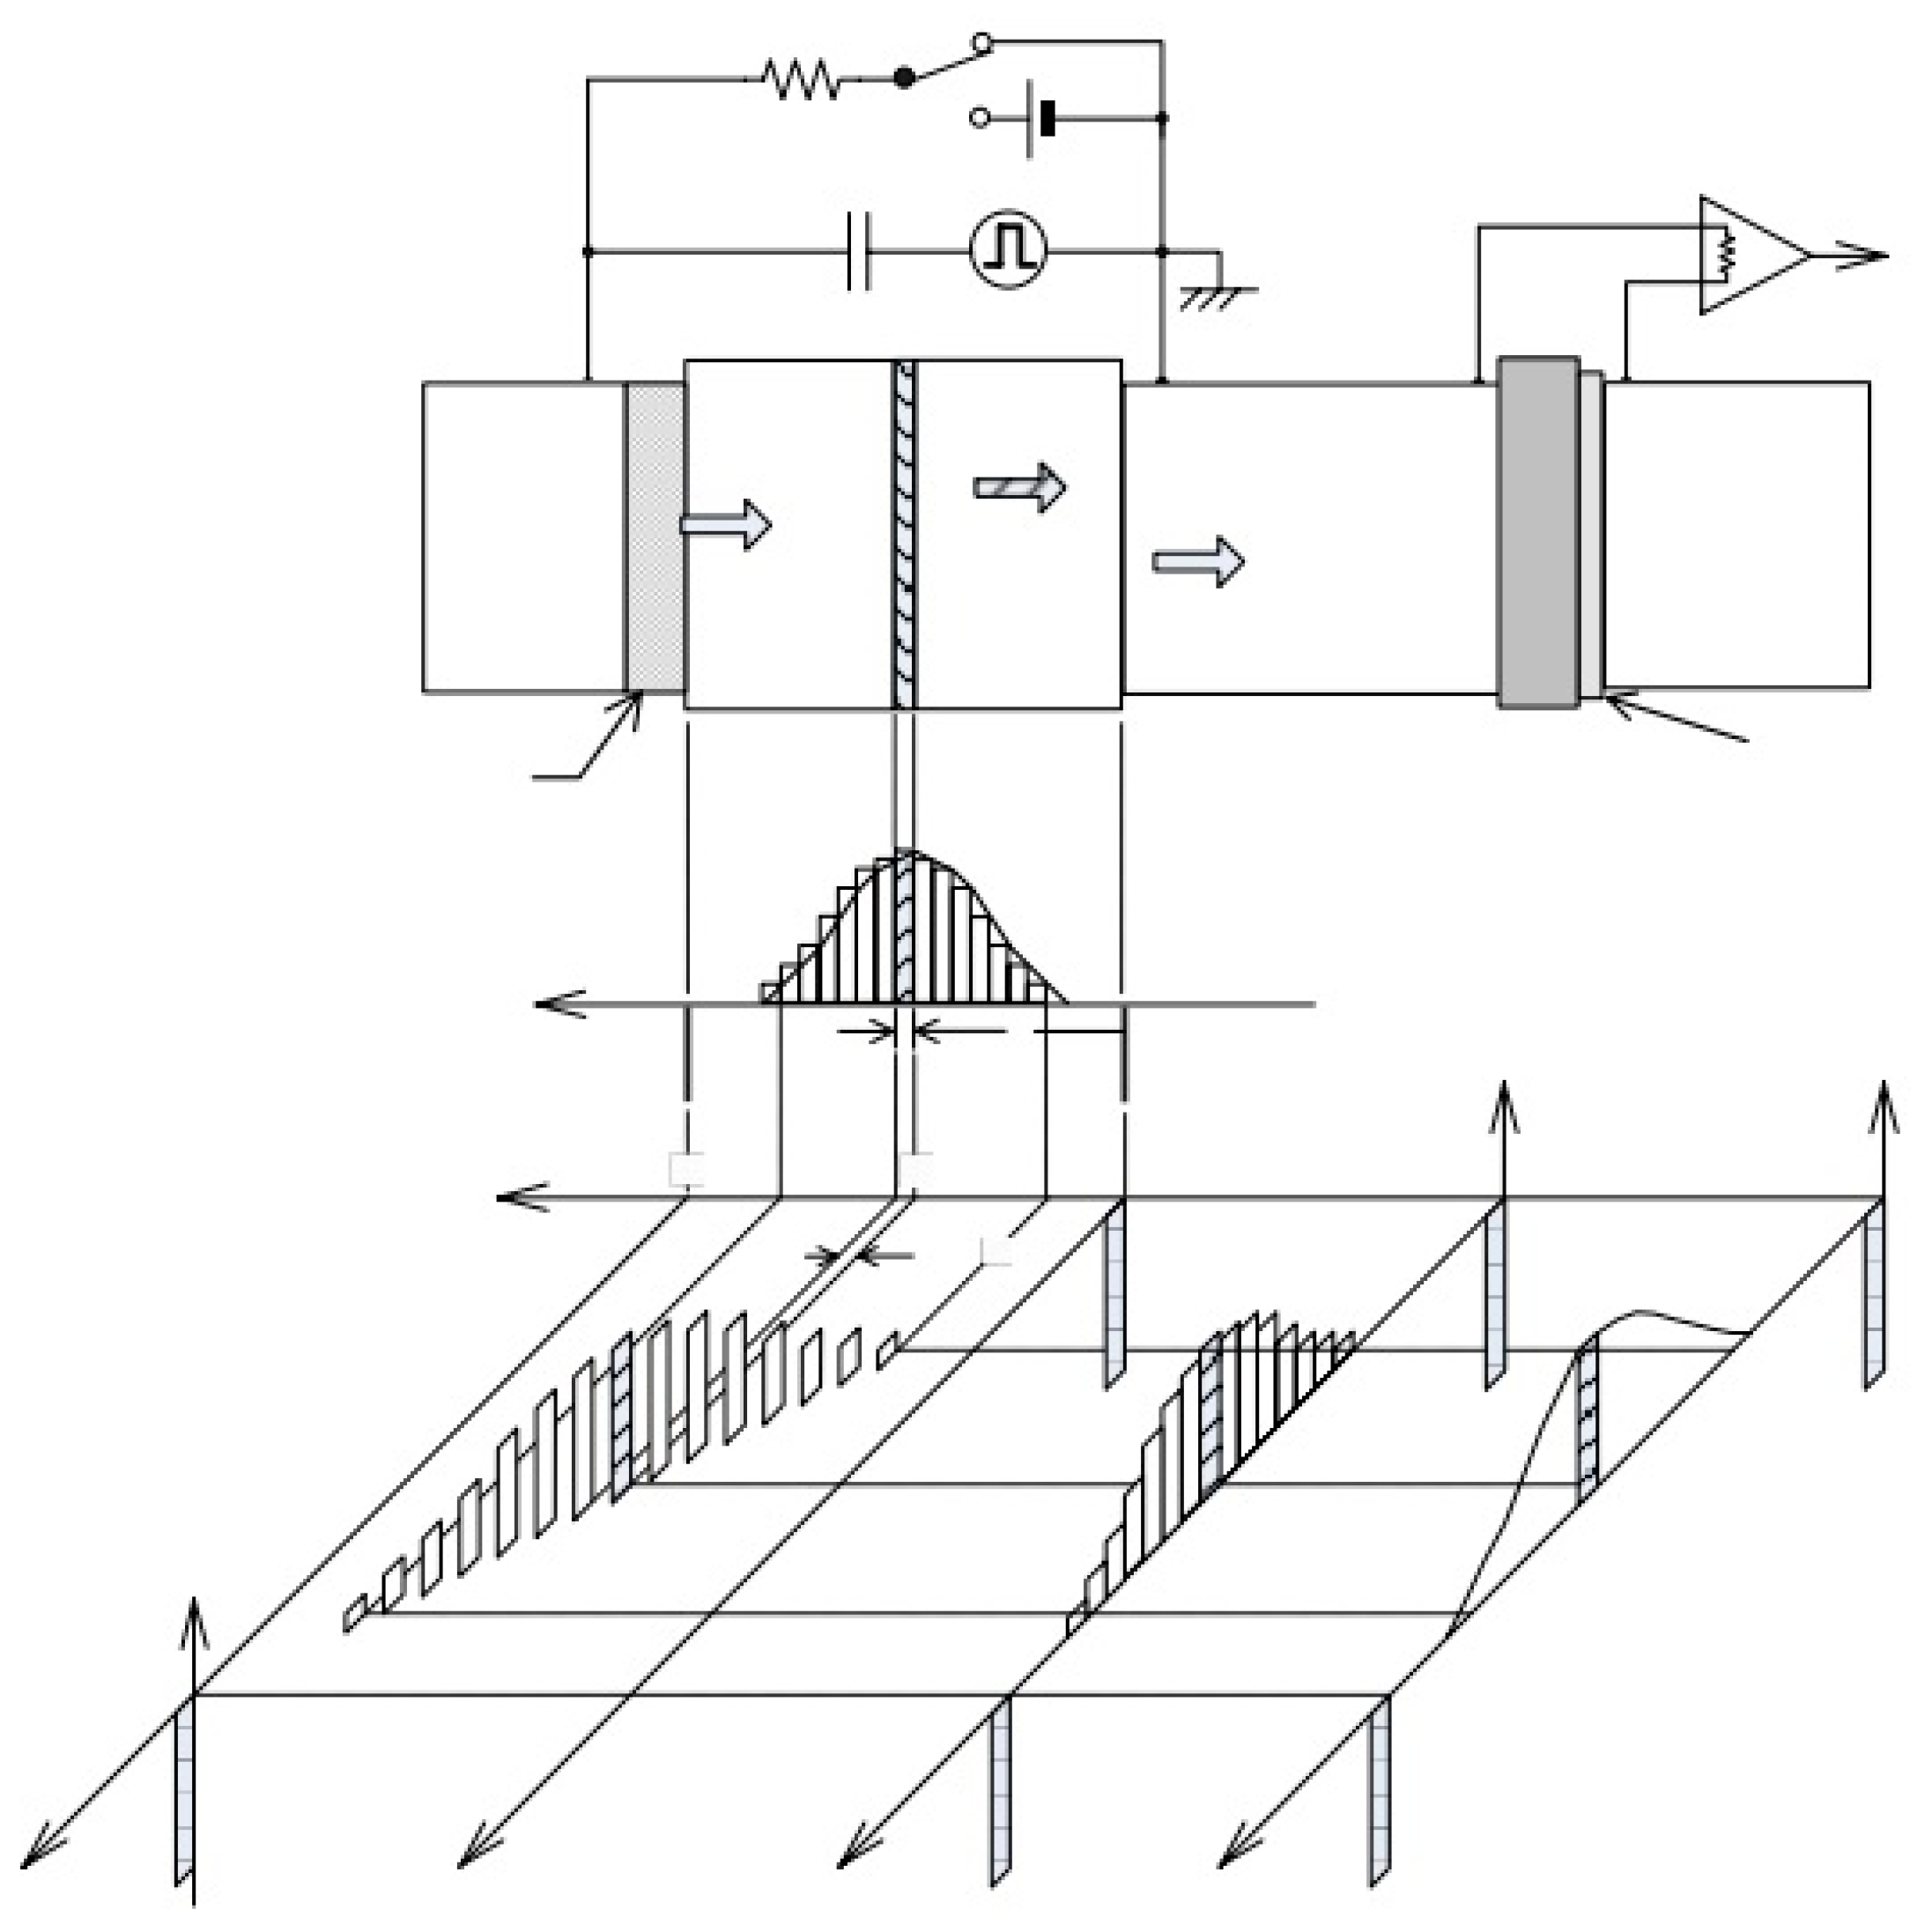
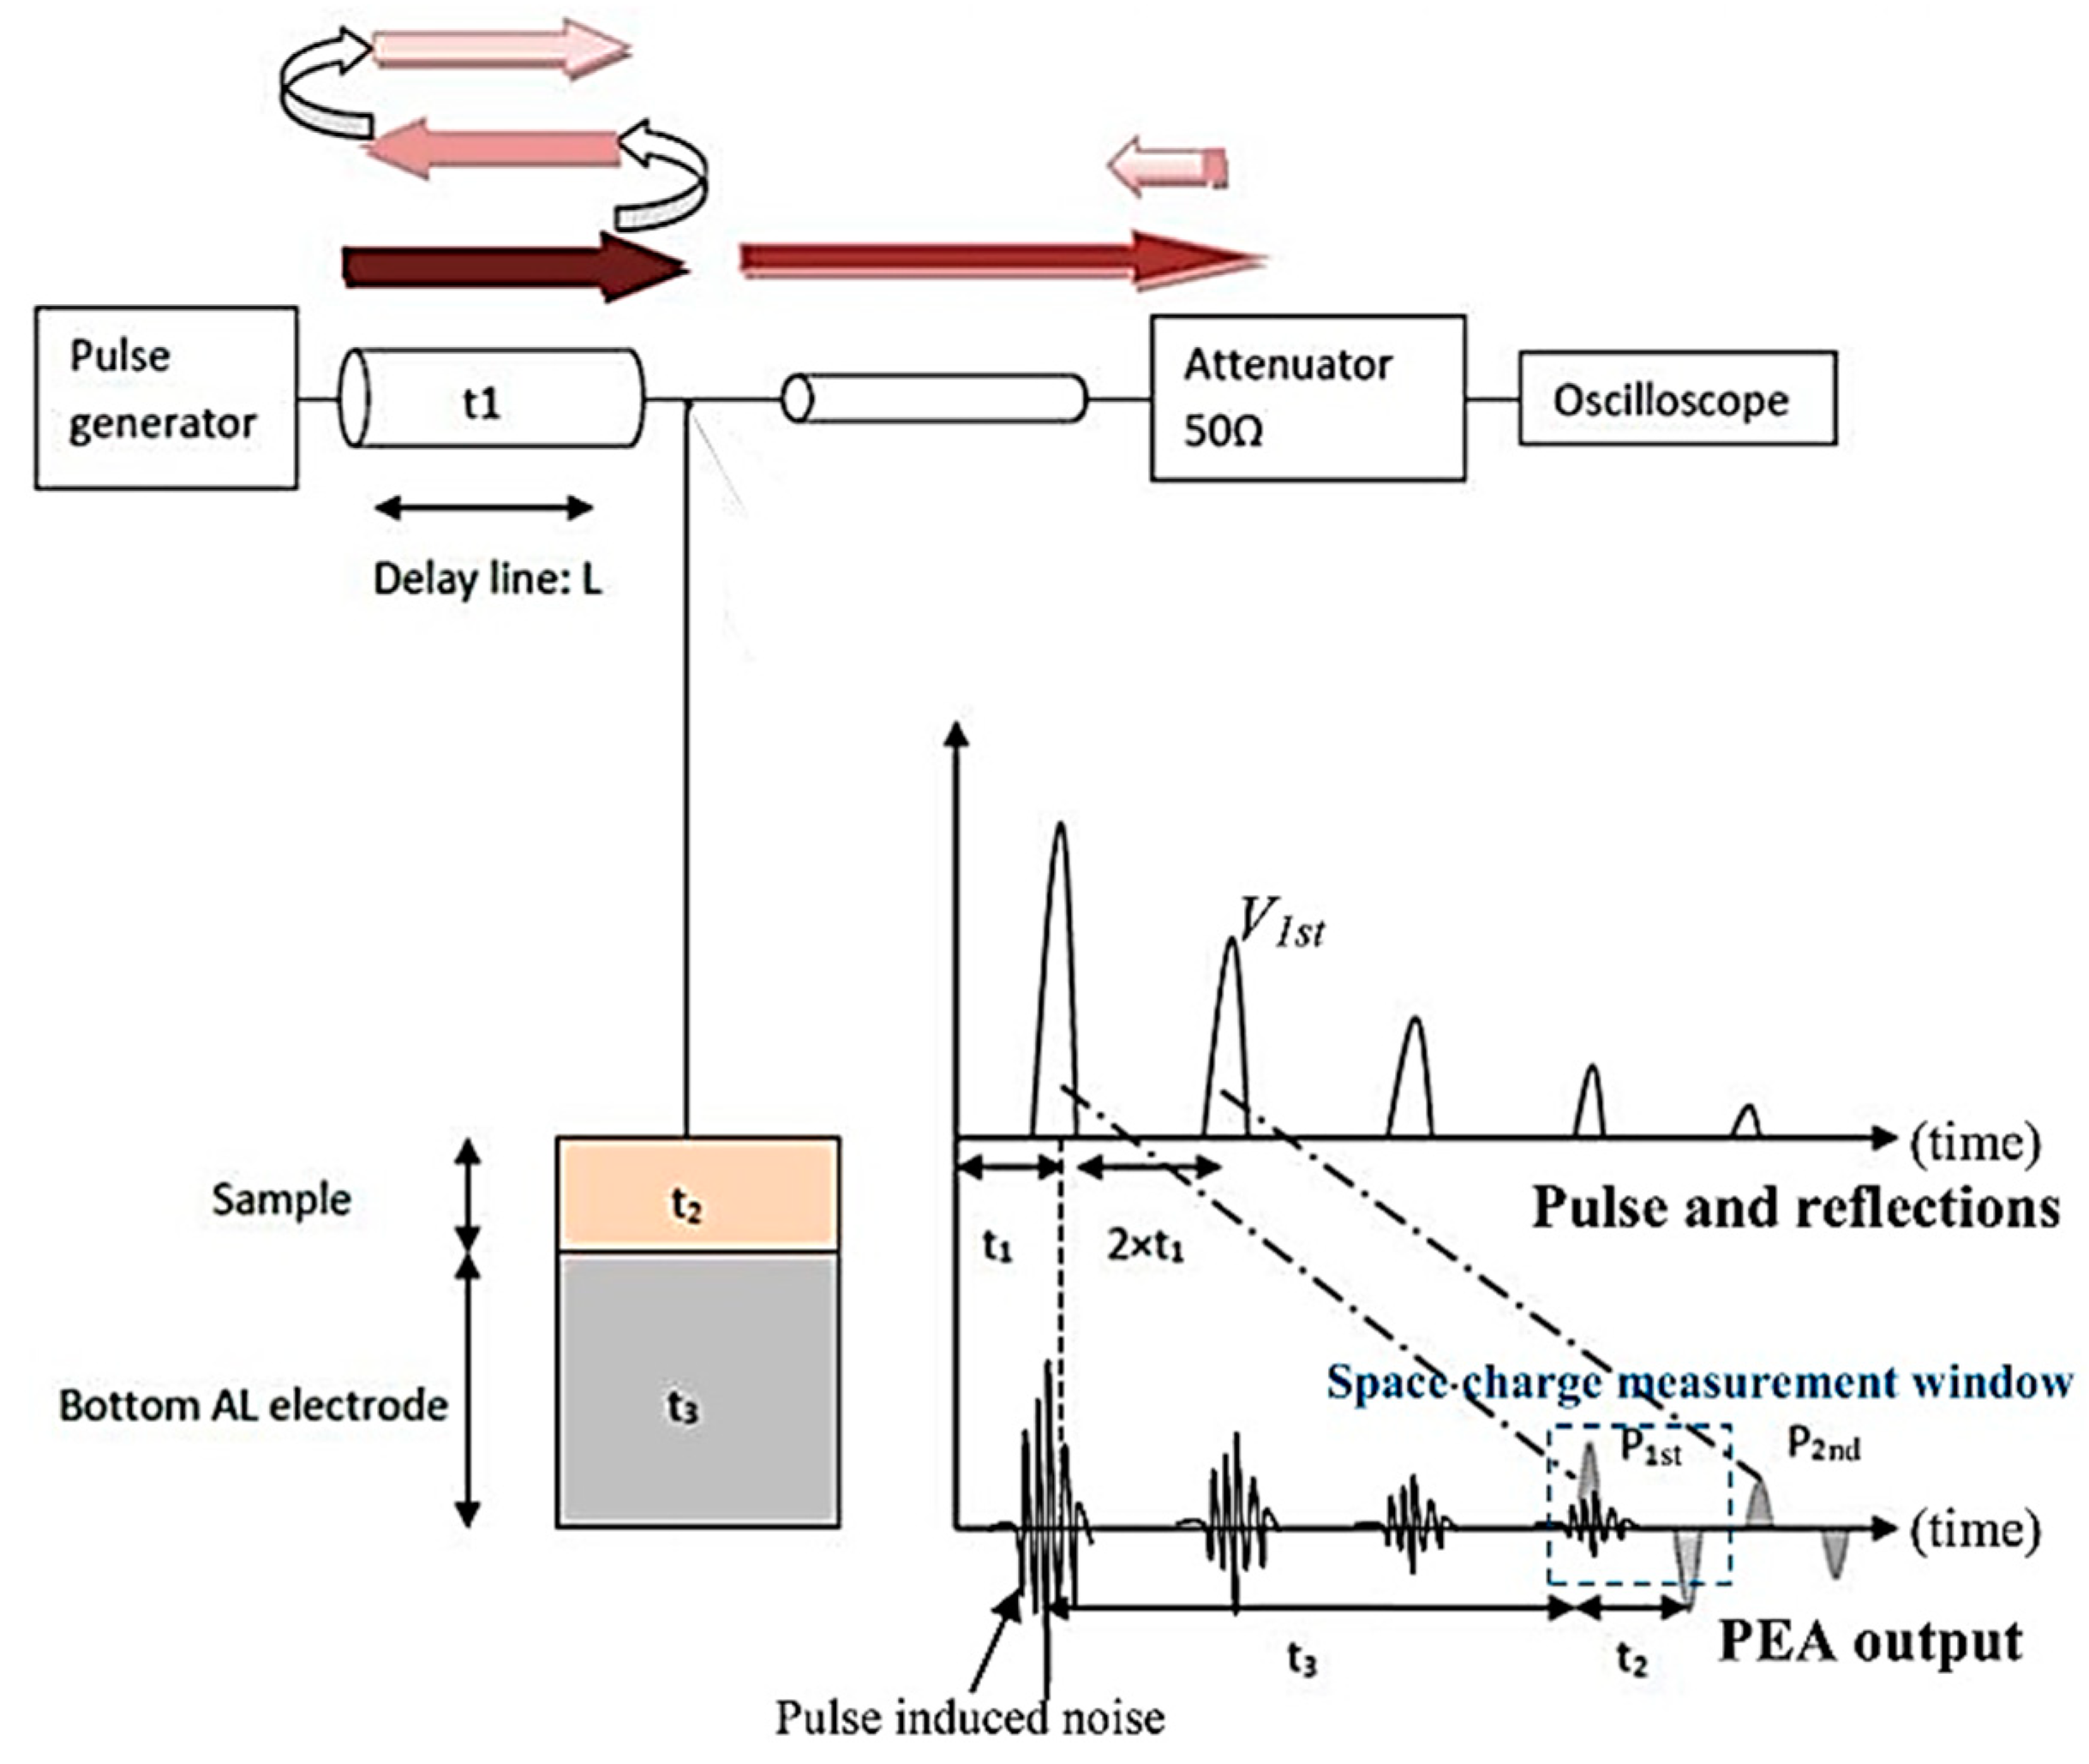
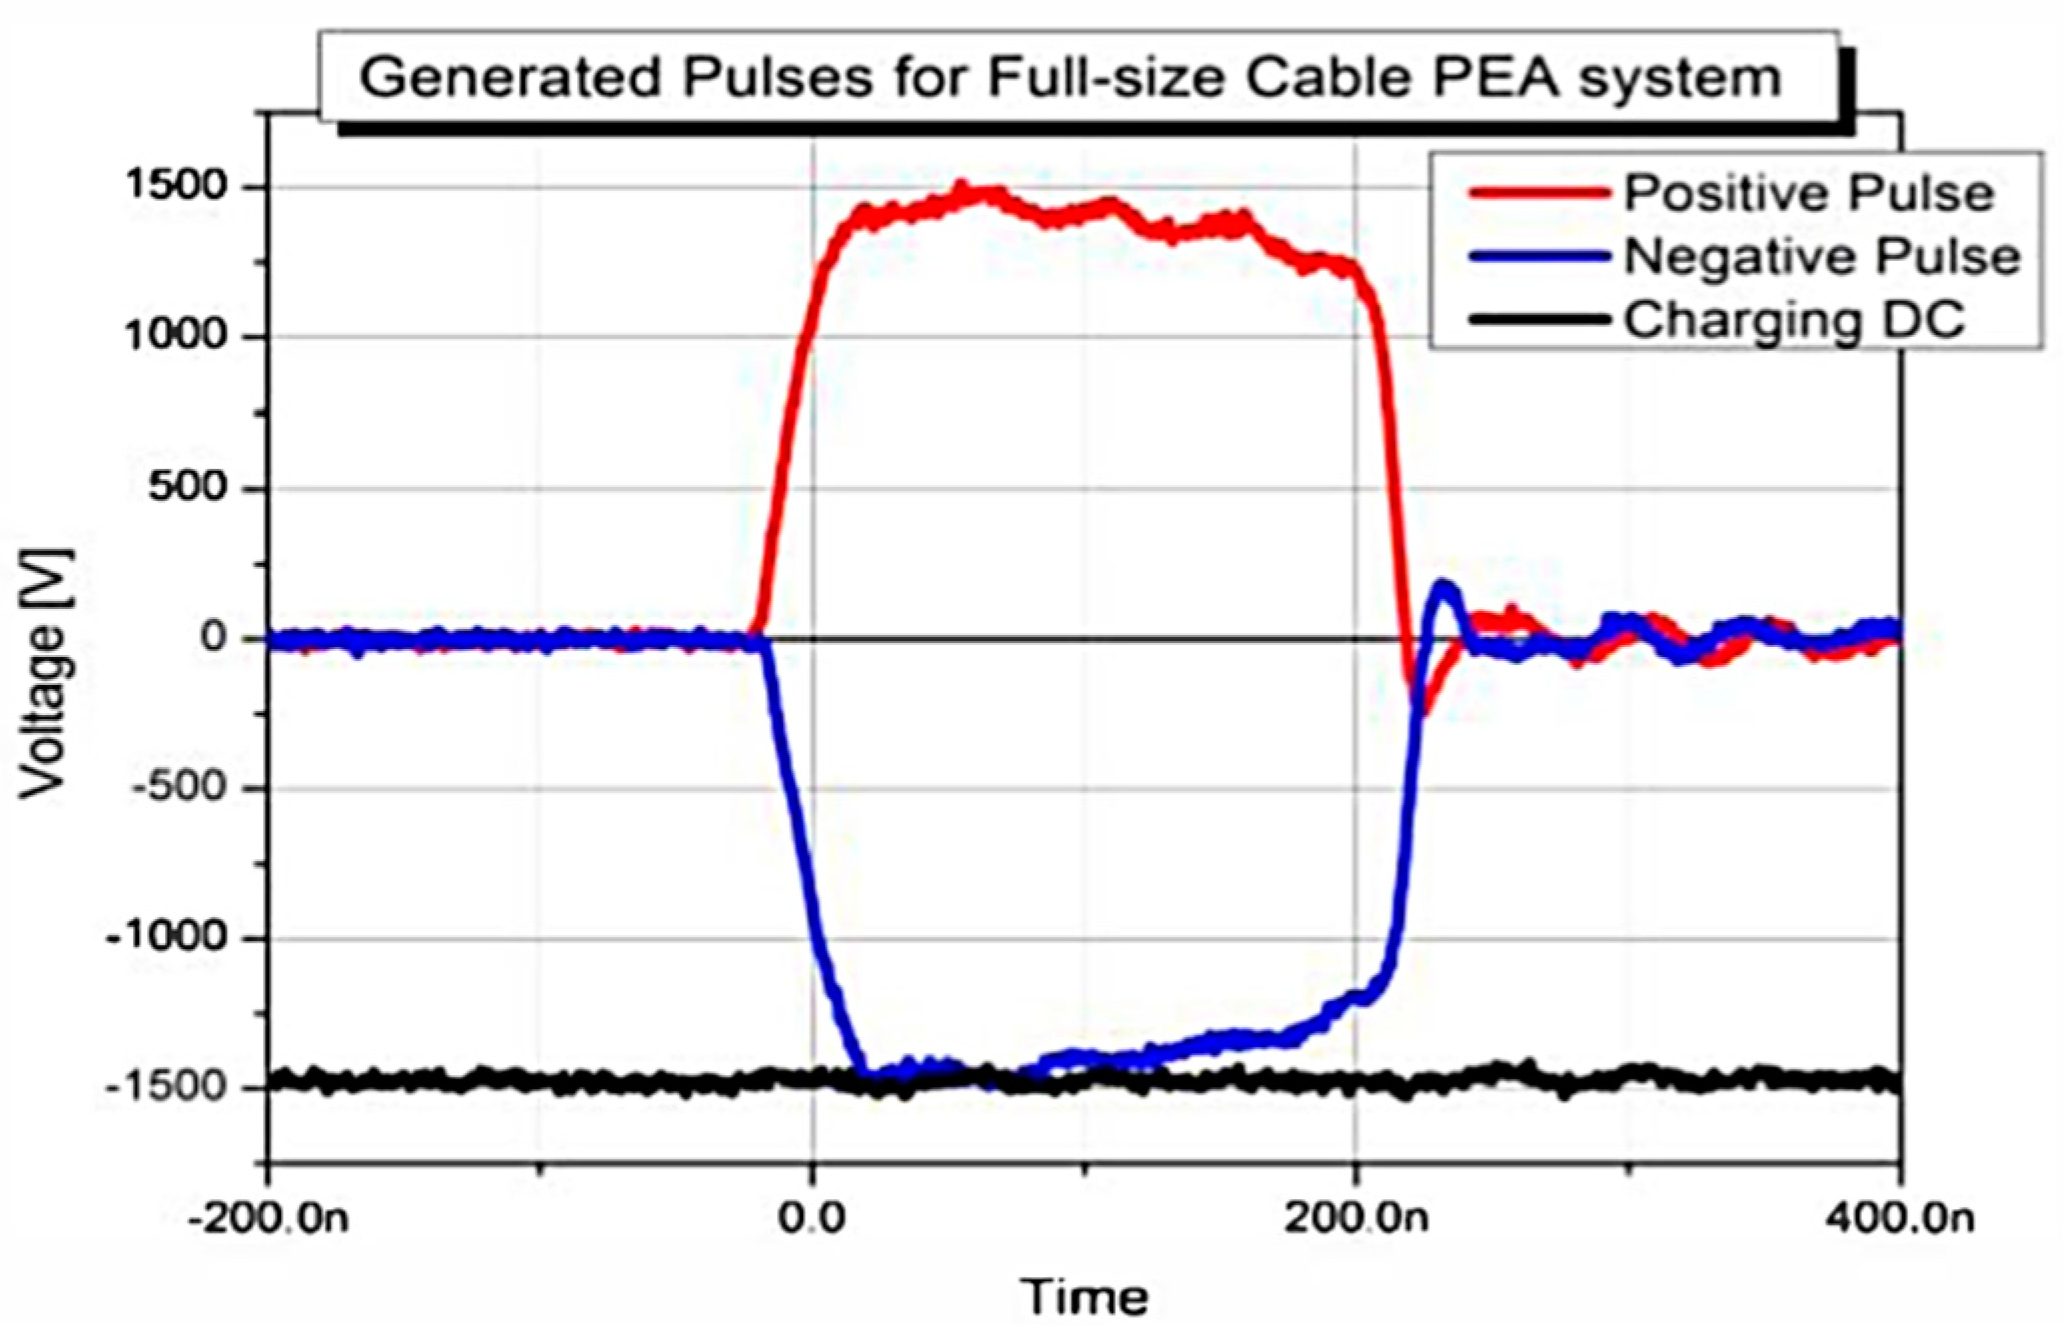
Pulse application. As specified above, the choice of the measurement setup for a certain sample should be done in order to apply an appropriate pulse at the measurement point. For this purpose, absorptions, reflections, and delays of the electric pulse should be taken into account. The impedance mismatch at the interface between the pulse generator output coaxial cable and the sample lead to the partial reflection of the pulsed voltage. An attenuator is typically connected to the coaxial cable output terminal as a matched load, in parallel with the cable that is effectively equivalent to a capacitor. This connection makes it practically difficult to match the impedance of the coaxial cable at high frequencies. In addition, the switching frequency of the pulse generator is typically between 100 and 200 Hz, therefore the switch remains open for 5–10 ms after sending out each pulse. During this time, the pulse generator is an open circuit for the reflected pulses that oscillate forwards and backwards along the coaxial cable with a decreasing amplitude, as shown in Figure 16. On the other hand, the distortion of the effective pulse output from a perfect square pulse has to be taken into account. An example of effective shape of the pulse generator output signal is illustrated in Figure 17.
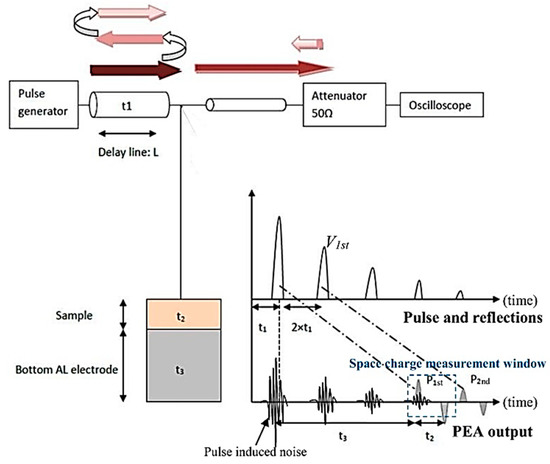
Figure 16.
Effect of the pulse generator output delay line—figure reproduced from [14].

Figure 17.
Example of shape of a real pulse generator output—figure is reproduced from [34].
The extent of this phenomenon depends on the length of the cable, impedances mismatch, and circuital schematic. For these reasons, some researchers have carried out sensibility analysis varying the pulse generator’s output cable length in order to minimize the disturbances related to these phenomena that reach the measurement region. Since the pulse propagation speed is close to light speed while the pressure waves are propagated across the measurement region and the PEA cell with the sound velocity within the crossed materials, the length of the pulse generator’s output cable should be optimized in function of the sample geometry. It has been found that a pulse generator’s output cable a few hundred meters long should be suitable for PEA measurements on full size cables [14].
In addition, it is advisable that the cable subjected to measurement is closed as a ring in order to avoid complete reflection of the pulse at the air-terminal interface. Nonetheless, it is inevitable that the cable coupled to the capacitor constituted by its coupling with the PEA cell acts as a resonator disturbing the pulsed voltage across the insulation [35].
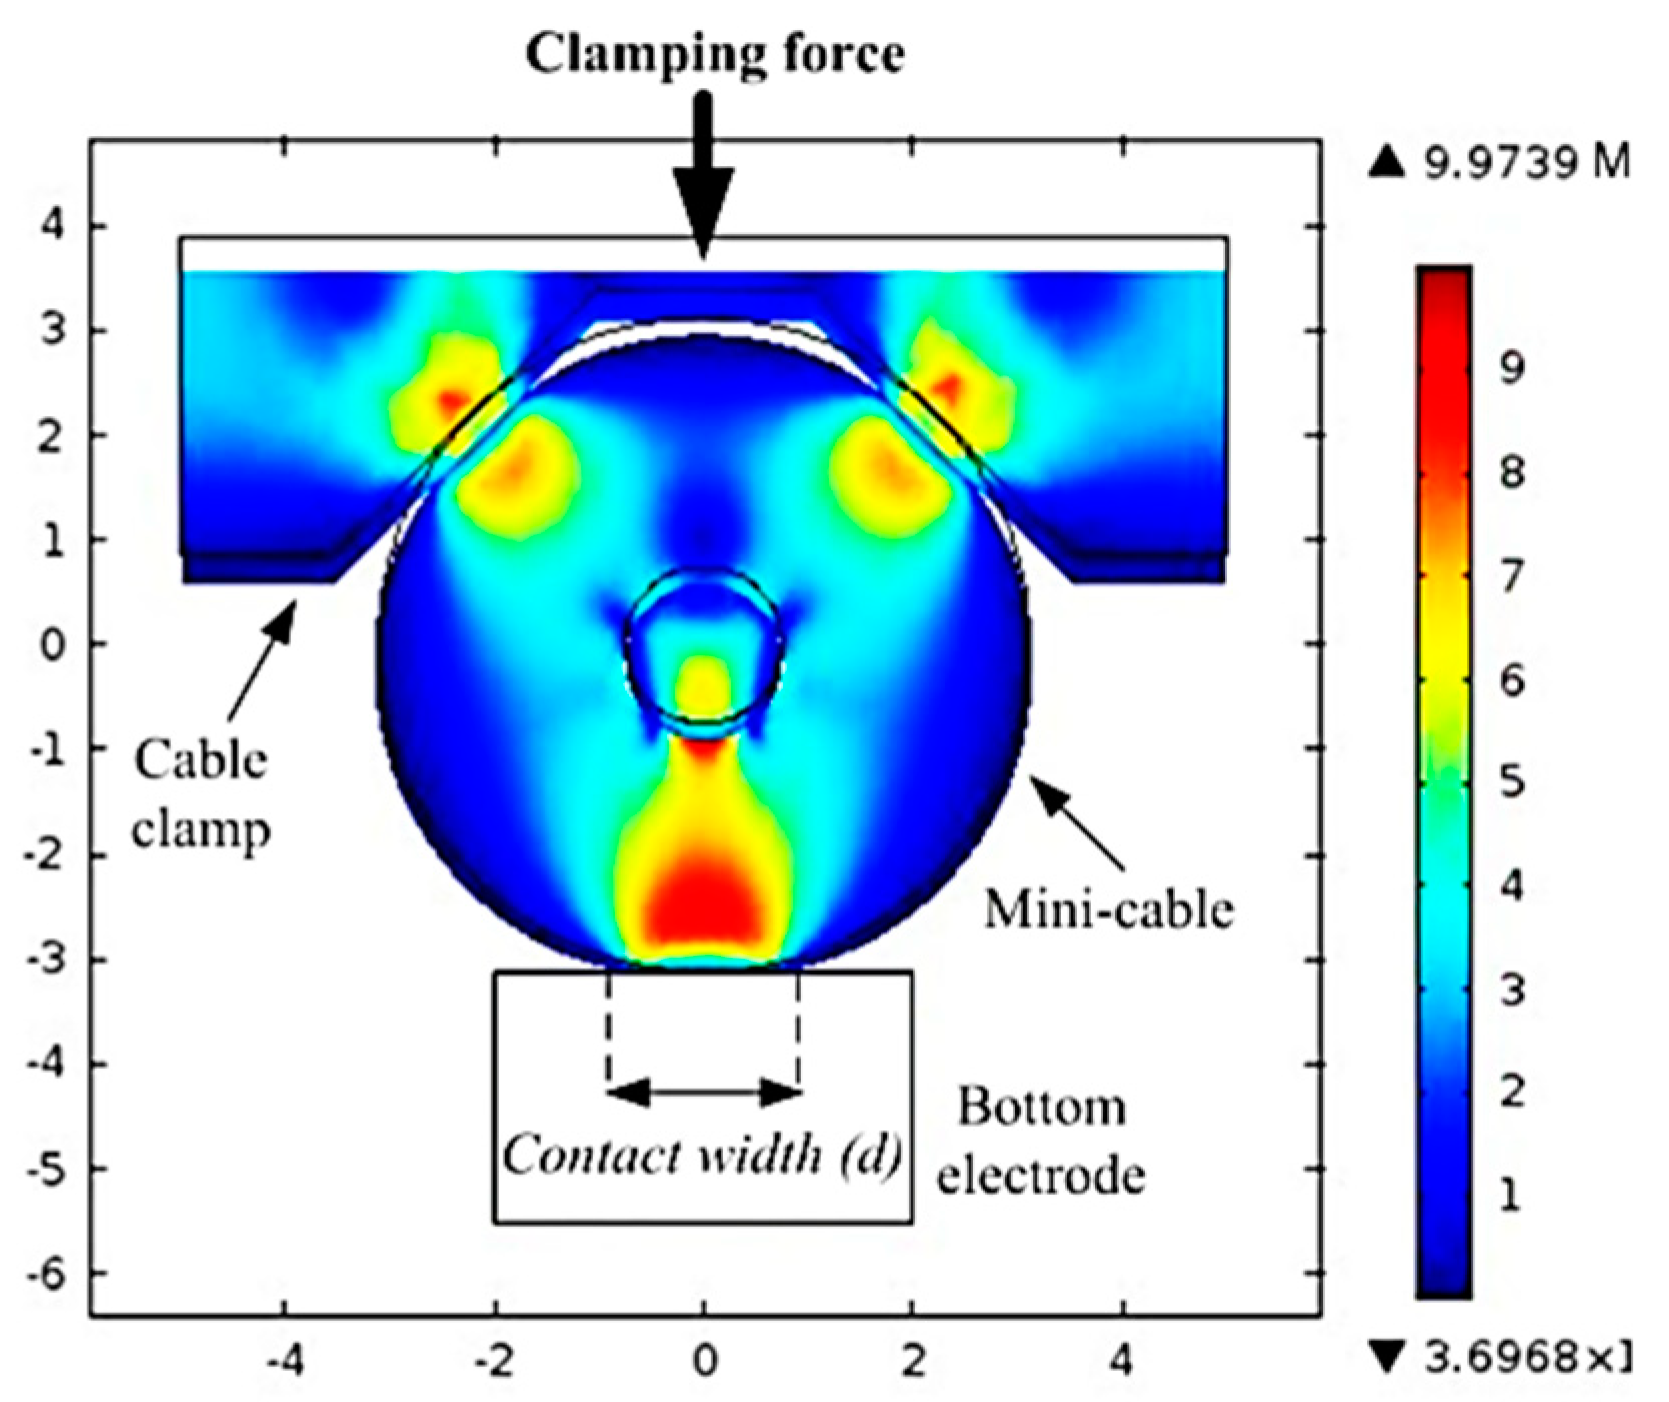
Bottom PEA cell electrode. Mainly two different types of bottom electrodes have been used by researchers: flat and round electrodes. The use of a flat bottom electrode involves the establishment of a contact surface with the cable depending on the clamping force. An illustration of the stress distribution in a section of a clamped cable is shown in Figure 18. As the temperature rises, the polymeric material of the insulation subjected to a mechanical stress could undergo plastic deformation as well as the softening of the material at high temperature could lead to an intolerable amplification of the contact area between the cable and the electrode. Nevertheless, an increasing deformation with the temperature leads to a progressive reduction and displacement of the measured radius as well as to a loss of time-spatial correspondence. Indeed, permanent deformation prevents the replicability of the measurements. For these reasons, particularly careful attention has to be paid to the behavior of the cable under mechanical stress depending on the temperature to be reached. For example, a thermal cycle before the beginning of a test could stabilize the material [36].

Figure 18.
Example of distribution of Von Mises equivalent stress under the application of a clamping force—figure reproduced from [37].
A larger contact surface with the cable with a weaker clamping force can be obtained thanks to the use of a round bottom electrode. This solution is therefore suitable for measurements carried out at high temperatures. Nonetheless, if the contact surface is relatively large, pressure waves propagated in a non-radial direction could reach the piezoelectric film increasing the noise level and reducing the spatial resolution [37]. In addition, as mentioned above, a round bottom electrode can only be used for a certain cable diameter and particularly careful attention has to be paid to the imperfect cohesion between the contact surfaces.
5. Boundary Conditions for PEA Measurements
After appropriate calibration and deconvolution of the output signals of PEA measurement setup, obtained results are typically expressed as charge density vs. radius and electric field vs. radius. The application of the PEA method shows several phenomena occurring by varying the following boundary conditions:
- Electric stress value;
- Temperature;
- Thermal radial gradient;
- Fast and long-term measurement;
- HVDC constant application or voltage transient (over voltage, polarity inversion, etc.).
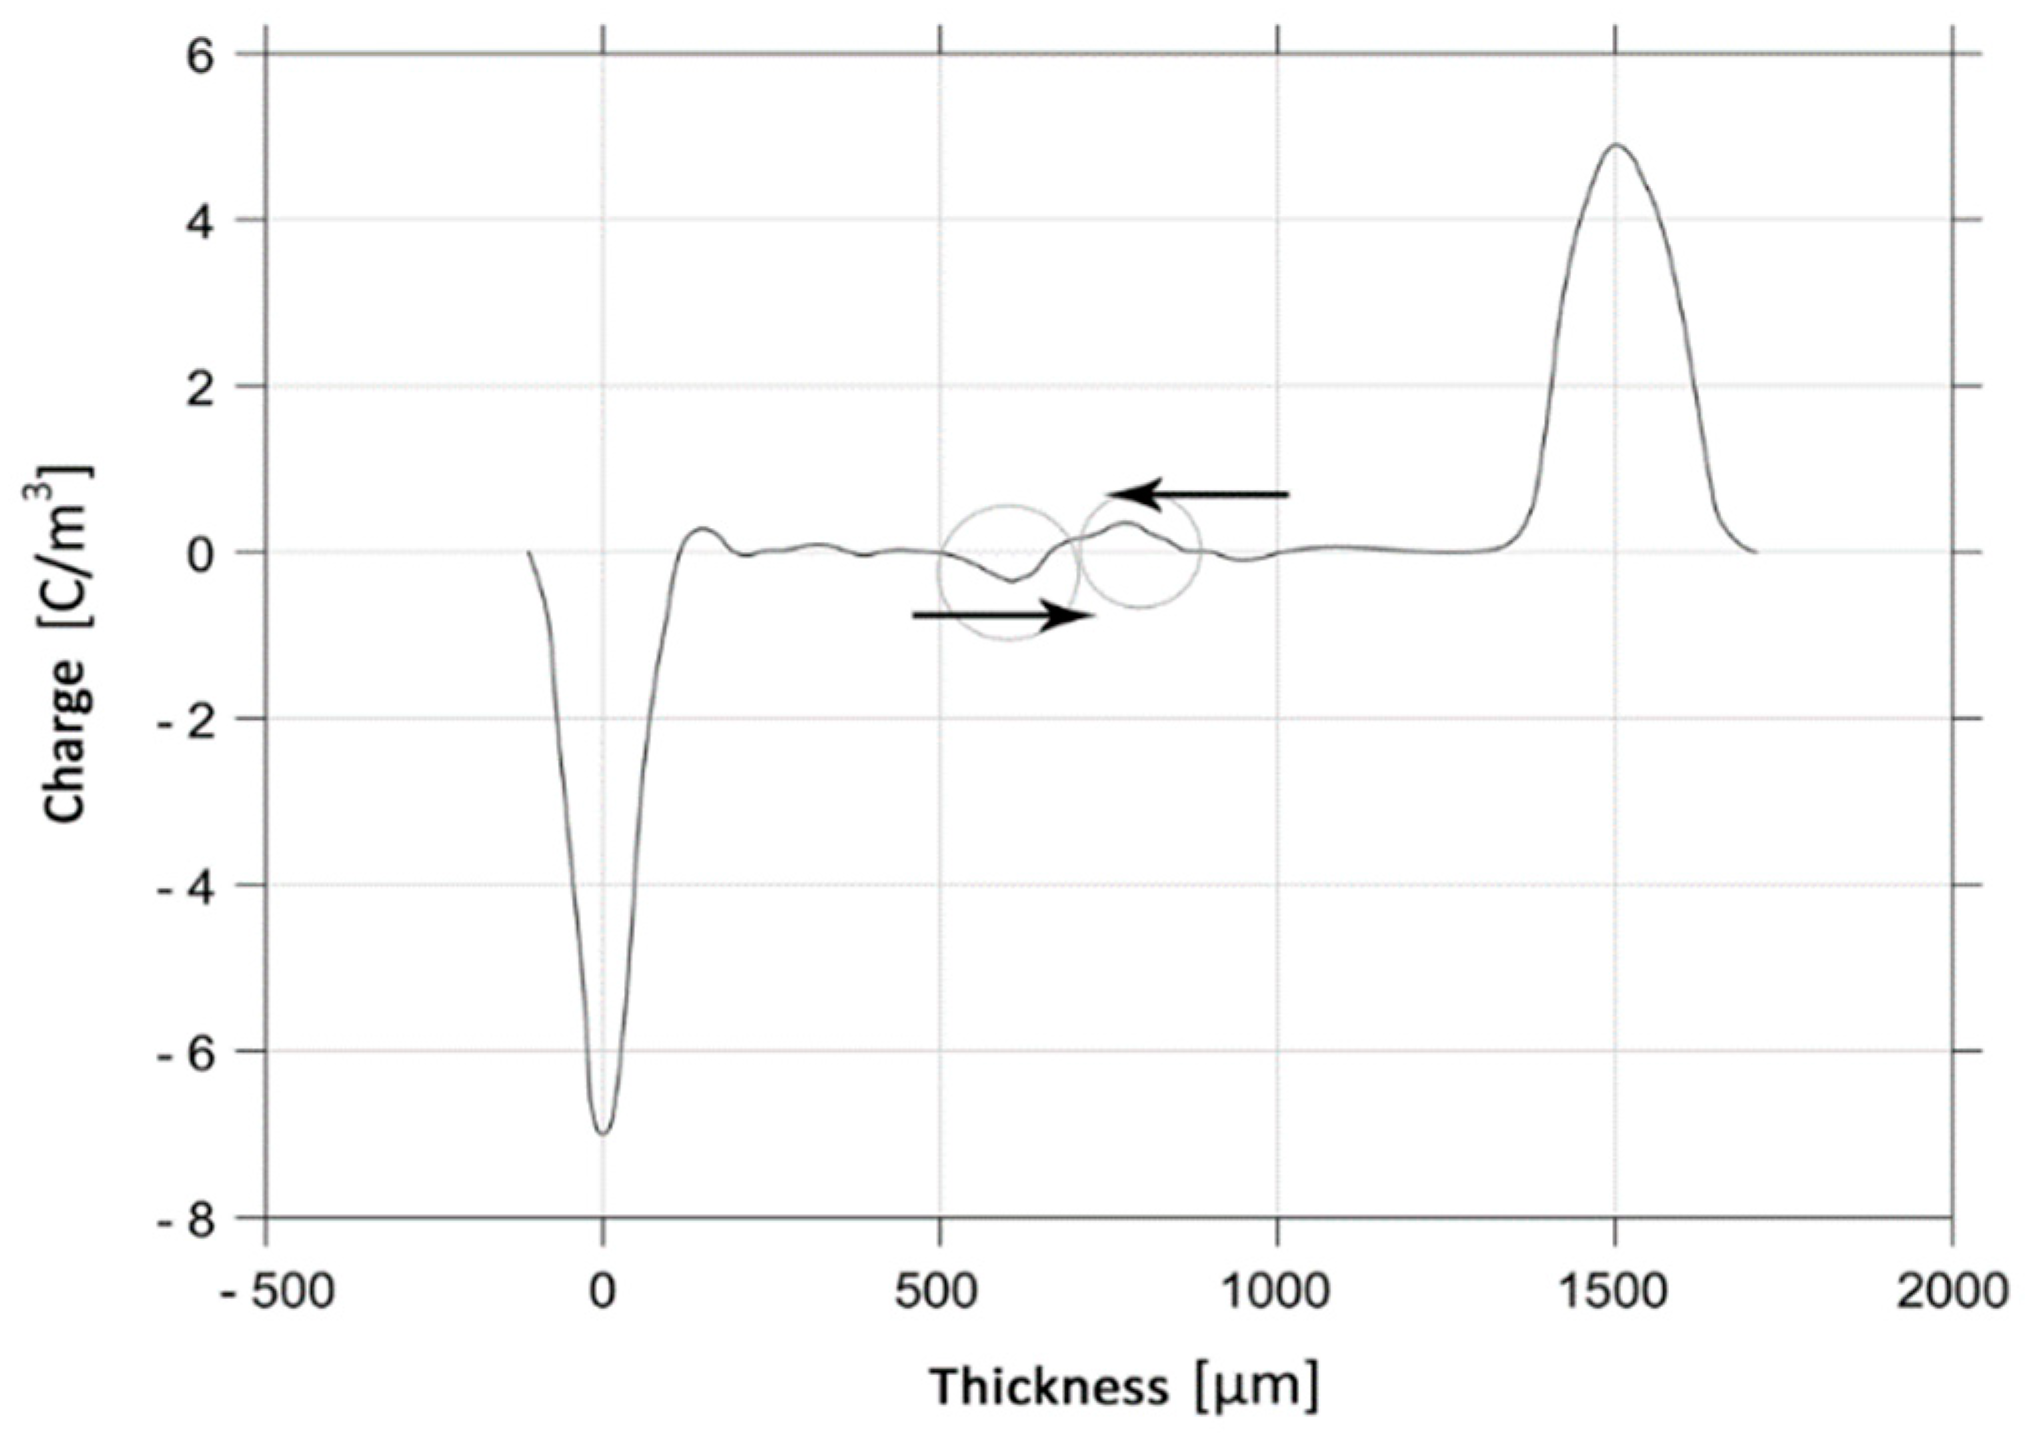
Electric stress value. As mentioned above, a low applied electric field to the sample leads to the accumulation of charges at electrodes but not into the bulk of the dielectric. The PEA output results obtained at low electric field are used for calibration and as reference for the deconvolution process. At high electric field, as described above, several phenomena of injection, forming, and accumulation of space charge could occur. A phenomenon of formation of hetero charges near the electrodes has been recently observed at low electric field suddenly after the application of a DC source [38,39]. In Figure 18 the behavior of a “fast charge pulse” is graphically illustrated. The charge carriers’ mobility observed in this phenomenon is 4–5 orders of magnitude higher than the one occurring during conventional conduction processes [40]. The occurring of fast charge pulses at design values of applied electric field can lead to the aging of the insulation material also if no overvoltage transient happens during the cable lifetime. In order to observe this phenomenon with a sufficient spatial resolution, a small width of voltage pulses (<10 ns) is required to carry out the PEA measurements [41].
Temperature. It has been demonstrated that the temperature has an important role in the injection, transport, and recombination of charges in the insulation of a HVDC cable. A higher temperature particularly enhances the injection process from the inner electrode, and it leads to an increasing mobility of charge carriers [42]. The temperature at the electrodes of a cable has to be carefully taken into account for the replicability of PEA measurements.
Thermal radial gradient. As described in Section 1, the establishment of thermal gradient across the radius of the dielectric of HVDC cable leads to an inversion of the electric field as shown in Figure 3. Since this behavior can be calculated and accurately predicted, the PEA measurement results can be divided into a contribution due to thermal gradient and another due to other phenomena.
“Instantaneous” and long-term measurement. The output pattern of an “instantaneous” PEA measurement is the result of time averaging, deconvolution, and calibration of the amplifier output signal. In Figure 19 an example of instantaneous space charge measurements is illustrated. As mentioned in Section 1, most of the space charge injection, formation, and accumulation phenomena have characteristic time with an order of magnitude between a few minutes and few hours. In order to carry out the assessment of slow space charge phenomena, a long-term analysis is indispensable. The Figure 20 shows an example of long-term measurement graphic representation obtained by the collection of several “instantaneous” measurements. In this way, placing the time on the abscissa and the radius on the ordinate, thanks to the use of a chromatic scale for the charge density, long-term transient phenomena are illustrated.

Figure 19.
Example of fast charge pulses observed detecting the PEA measurements output each 50 ms—figure reproduced from [38].
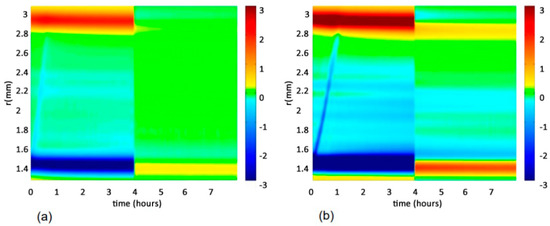
Figure 20.
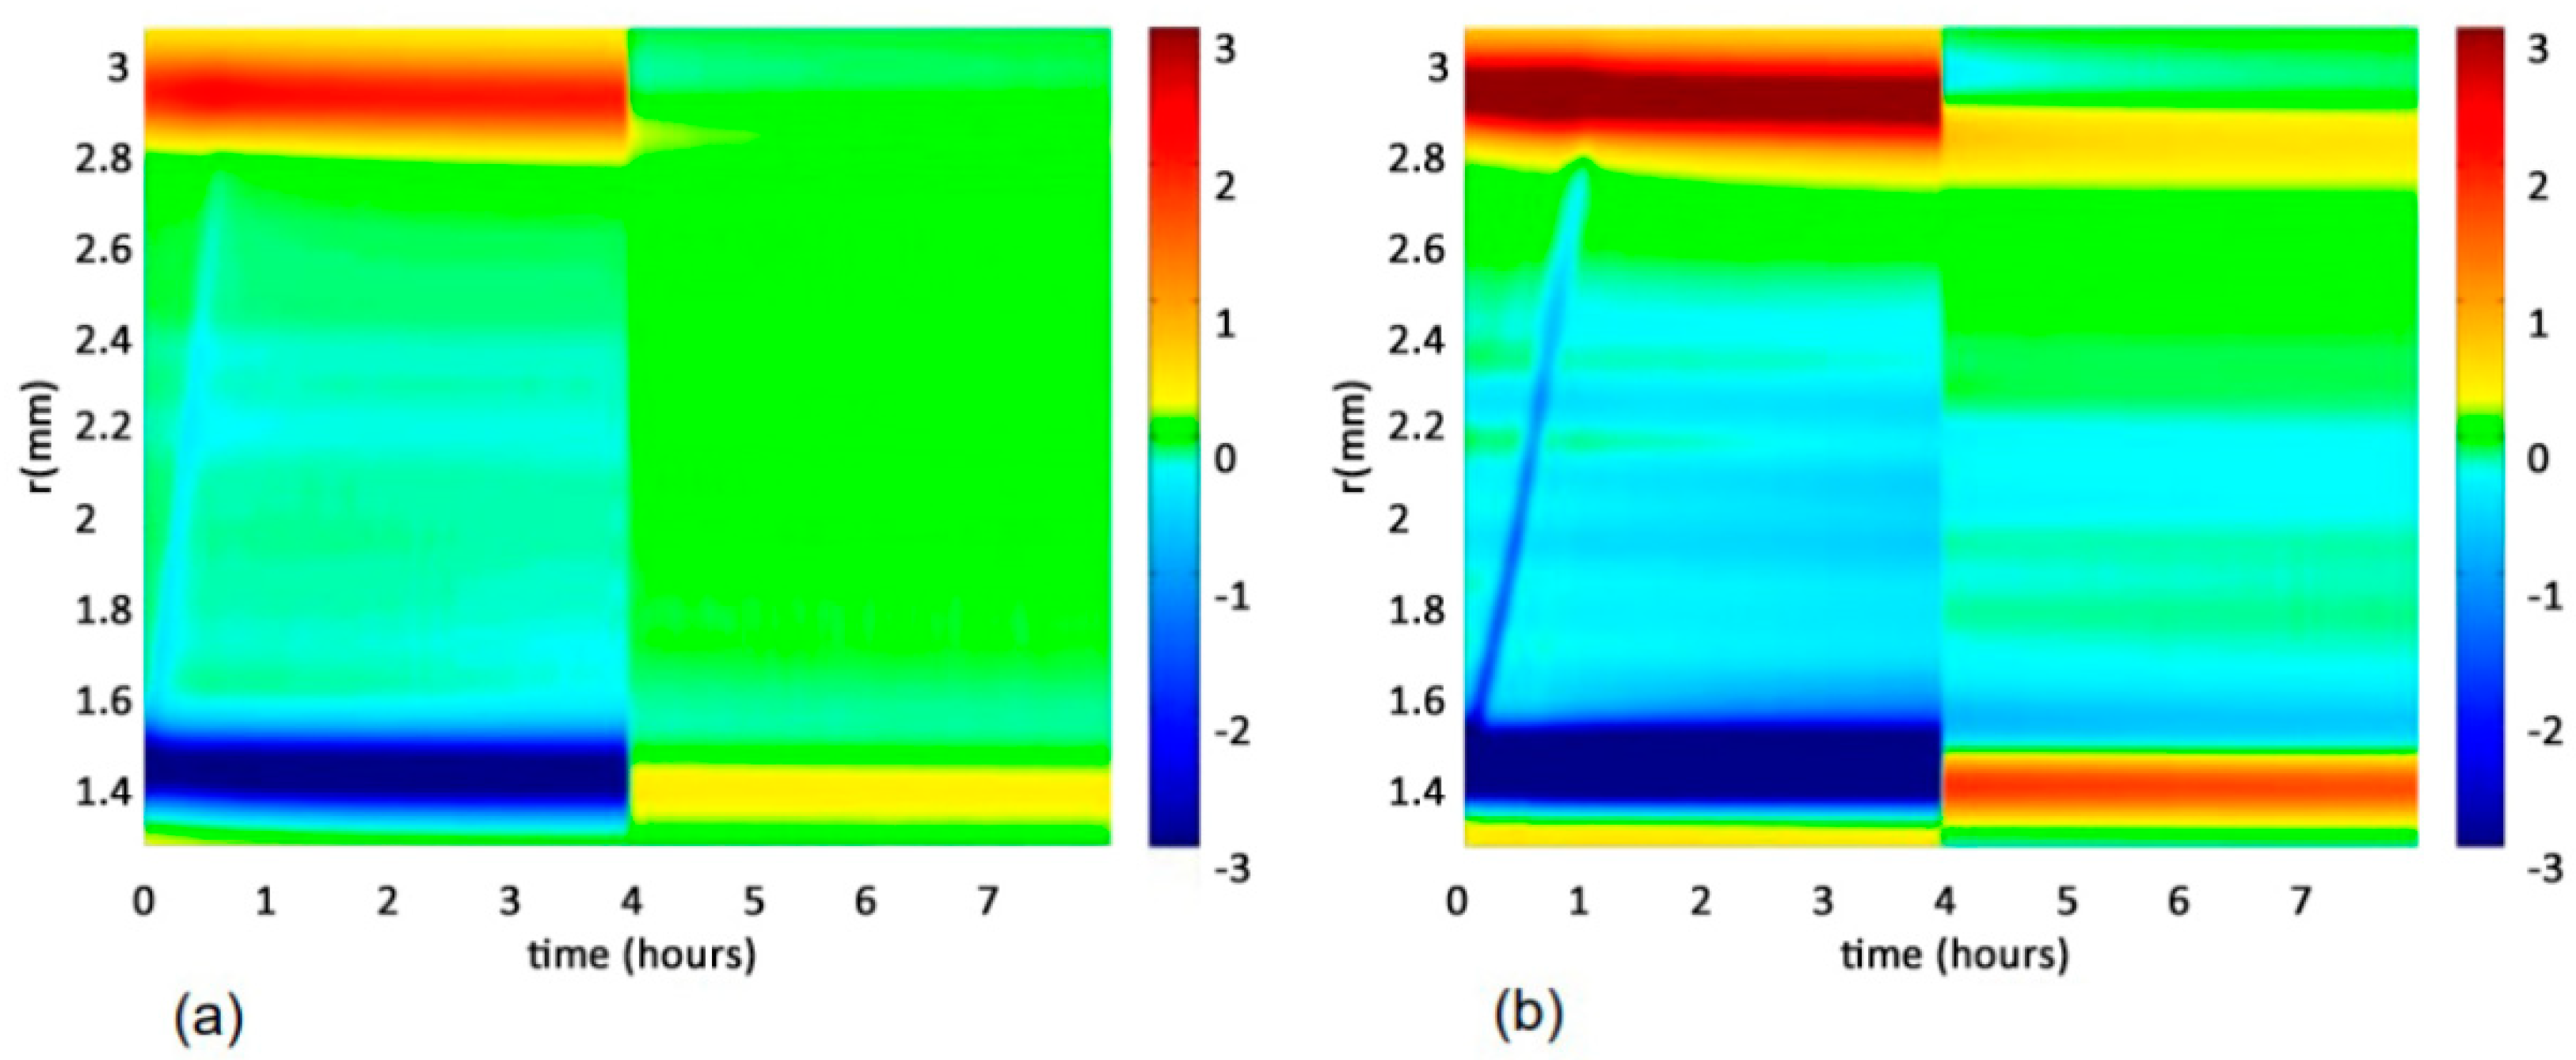
Example of migration of negative charges at −30 kV (a) and −55 kW (b) during charging (left side) and discharging (right side)—figure reproduced from [33].
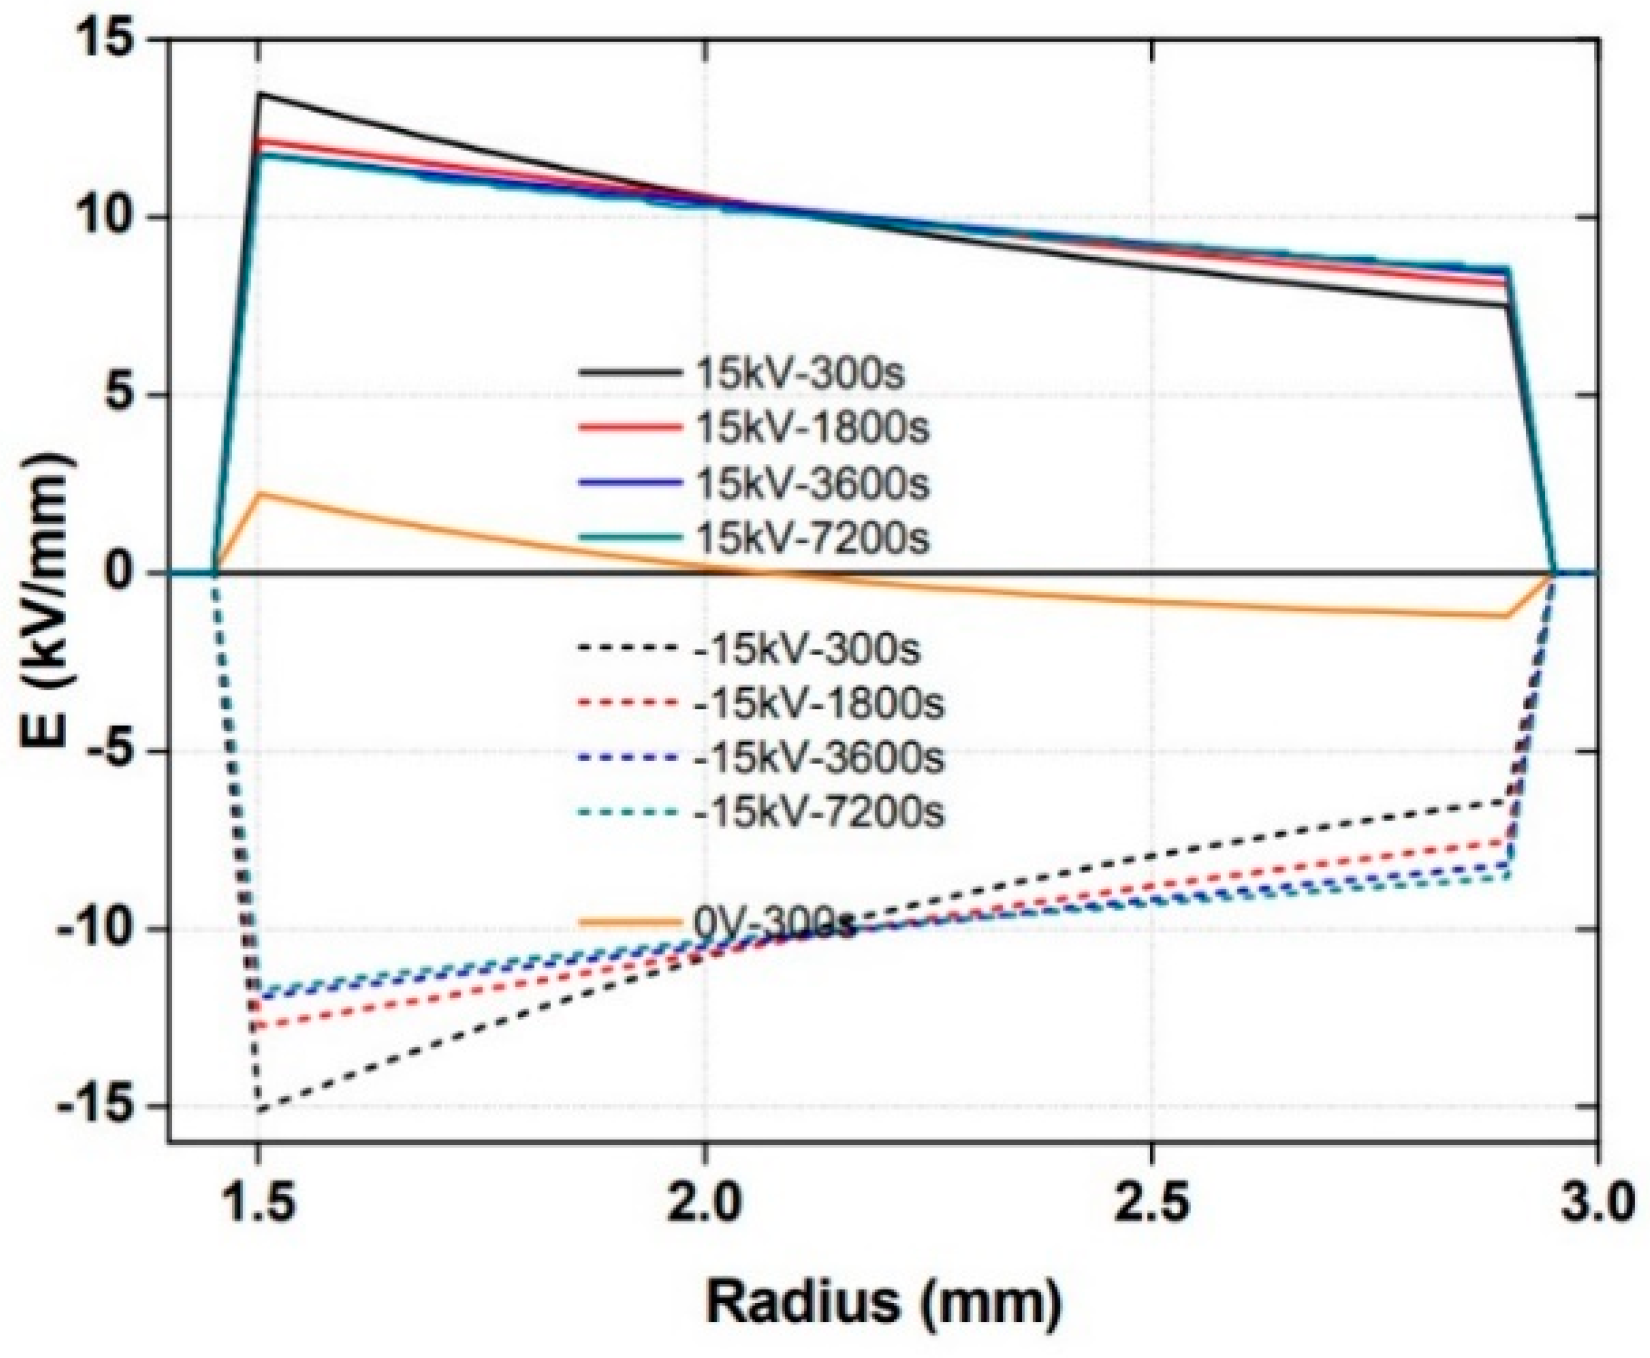
HVDC constant application or voltage transient. Long term measurements show the establishment of several phenomena such as the migration of charges from an electrode to another or the accumulation of charges near physical or chemical defects. On the other hand, space charge accumulation is particularly dangerous during fast voltage transient such as the polarity inversion or overvoltage transient due to a fault. Indeed, the experimental evaluation of the evolution of the electric field distribution into the dielectric of a HVDC cable during a fast voltage transient appears particularly interesting. In Figure 21, a graphical illustration shows the results of a simulation of polarity inversion occurring in a cable in the presence of a thermal gradient. The simulation demonstrates that the most severe condition is reached immediately after the polarity reversal near the inner electrode [43,44].
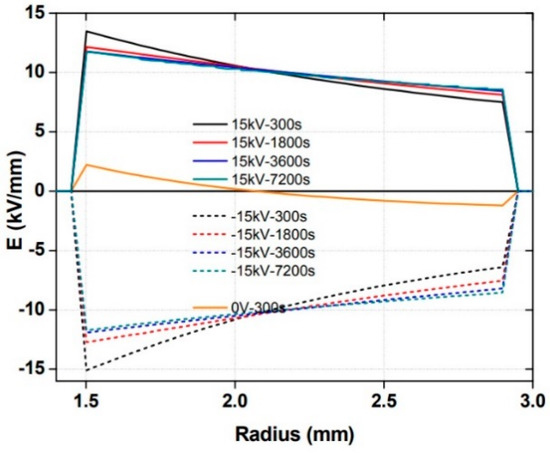
Figure 21.
Simulation results of polarity inversion +/−15 kV at temperature gradient of 10 °C—figure reproduced from [44].
6. Limits of the PEA Method
Despite the growing demand of extruded HVDC cables, and the recent publication of an international standard [5], there is still no universally accepted protocol for the execution of PEA measurements [13]. As mentioned above and experimented by many researchers, several parameters have an important role in the quality of PEA measurements. In particular, the cable length, the cell arrangement, the equivalent capacitances, and impedances of the measurement setup (see Figure 9, Figure 10, Figure 11, Figure 12, Figure 13 and Figure 14) should be optimized for a certain cable [45]. For example, a special apparatus with low pass filters at the oscilloscope input, high voltage pulse generator and an appropriate thickness of the PEA cell electrode should be implemented for measurements on thick cable insulations [46]. Indeed, the compatibility of a commercial PEA apparatus should be carefully evaluated on the basis of the characteristics of the specific cable on which space charge measurements should be done. In addition, a physical model of the measurement region of the cable and of the PEA cell should be implemented in order to correctly evaluate the superposition of reflected signals on the direct ones that reach the piezoelectric film [47].
To date, the PEA method is not considered a non-destructive measurement on laying cables since a partial stripping of the outer layers is necessary.
7. Comparison between the PEA and Thermal Step Method (TSM)
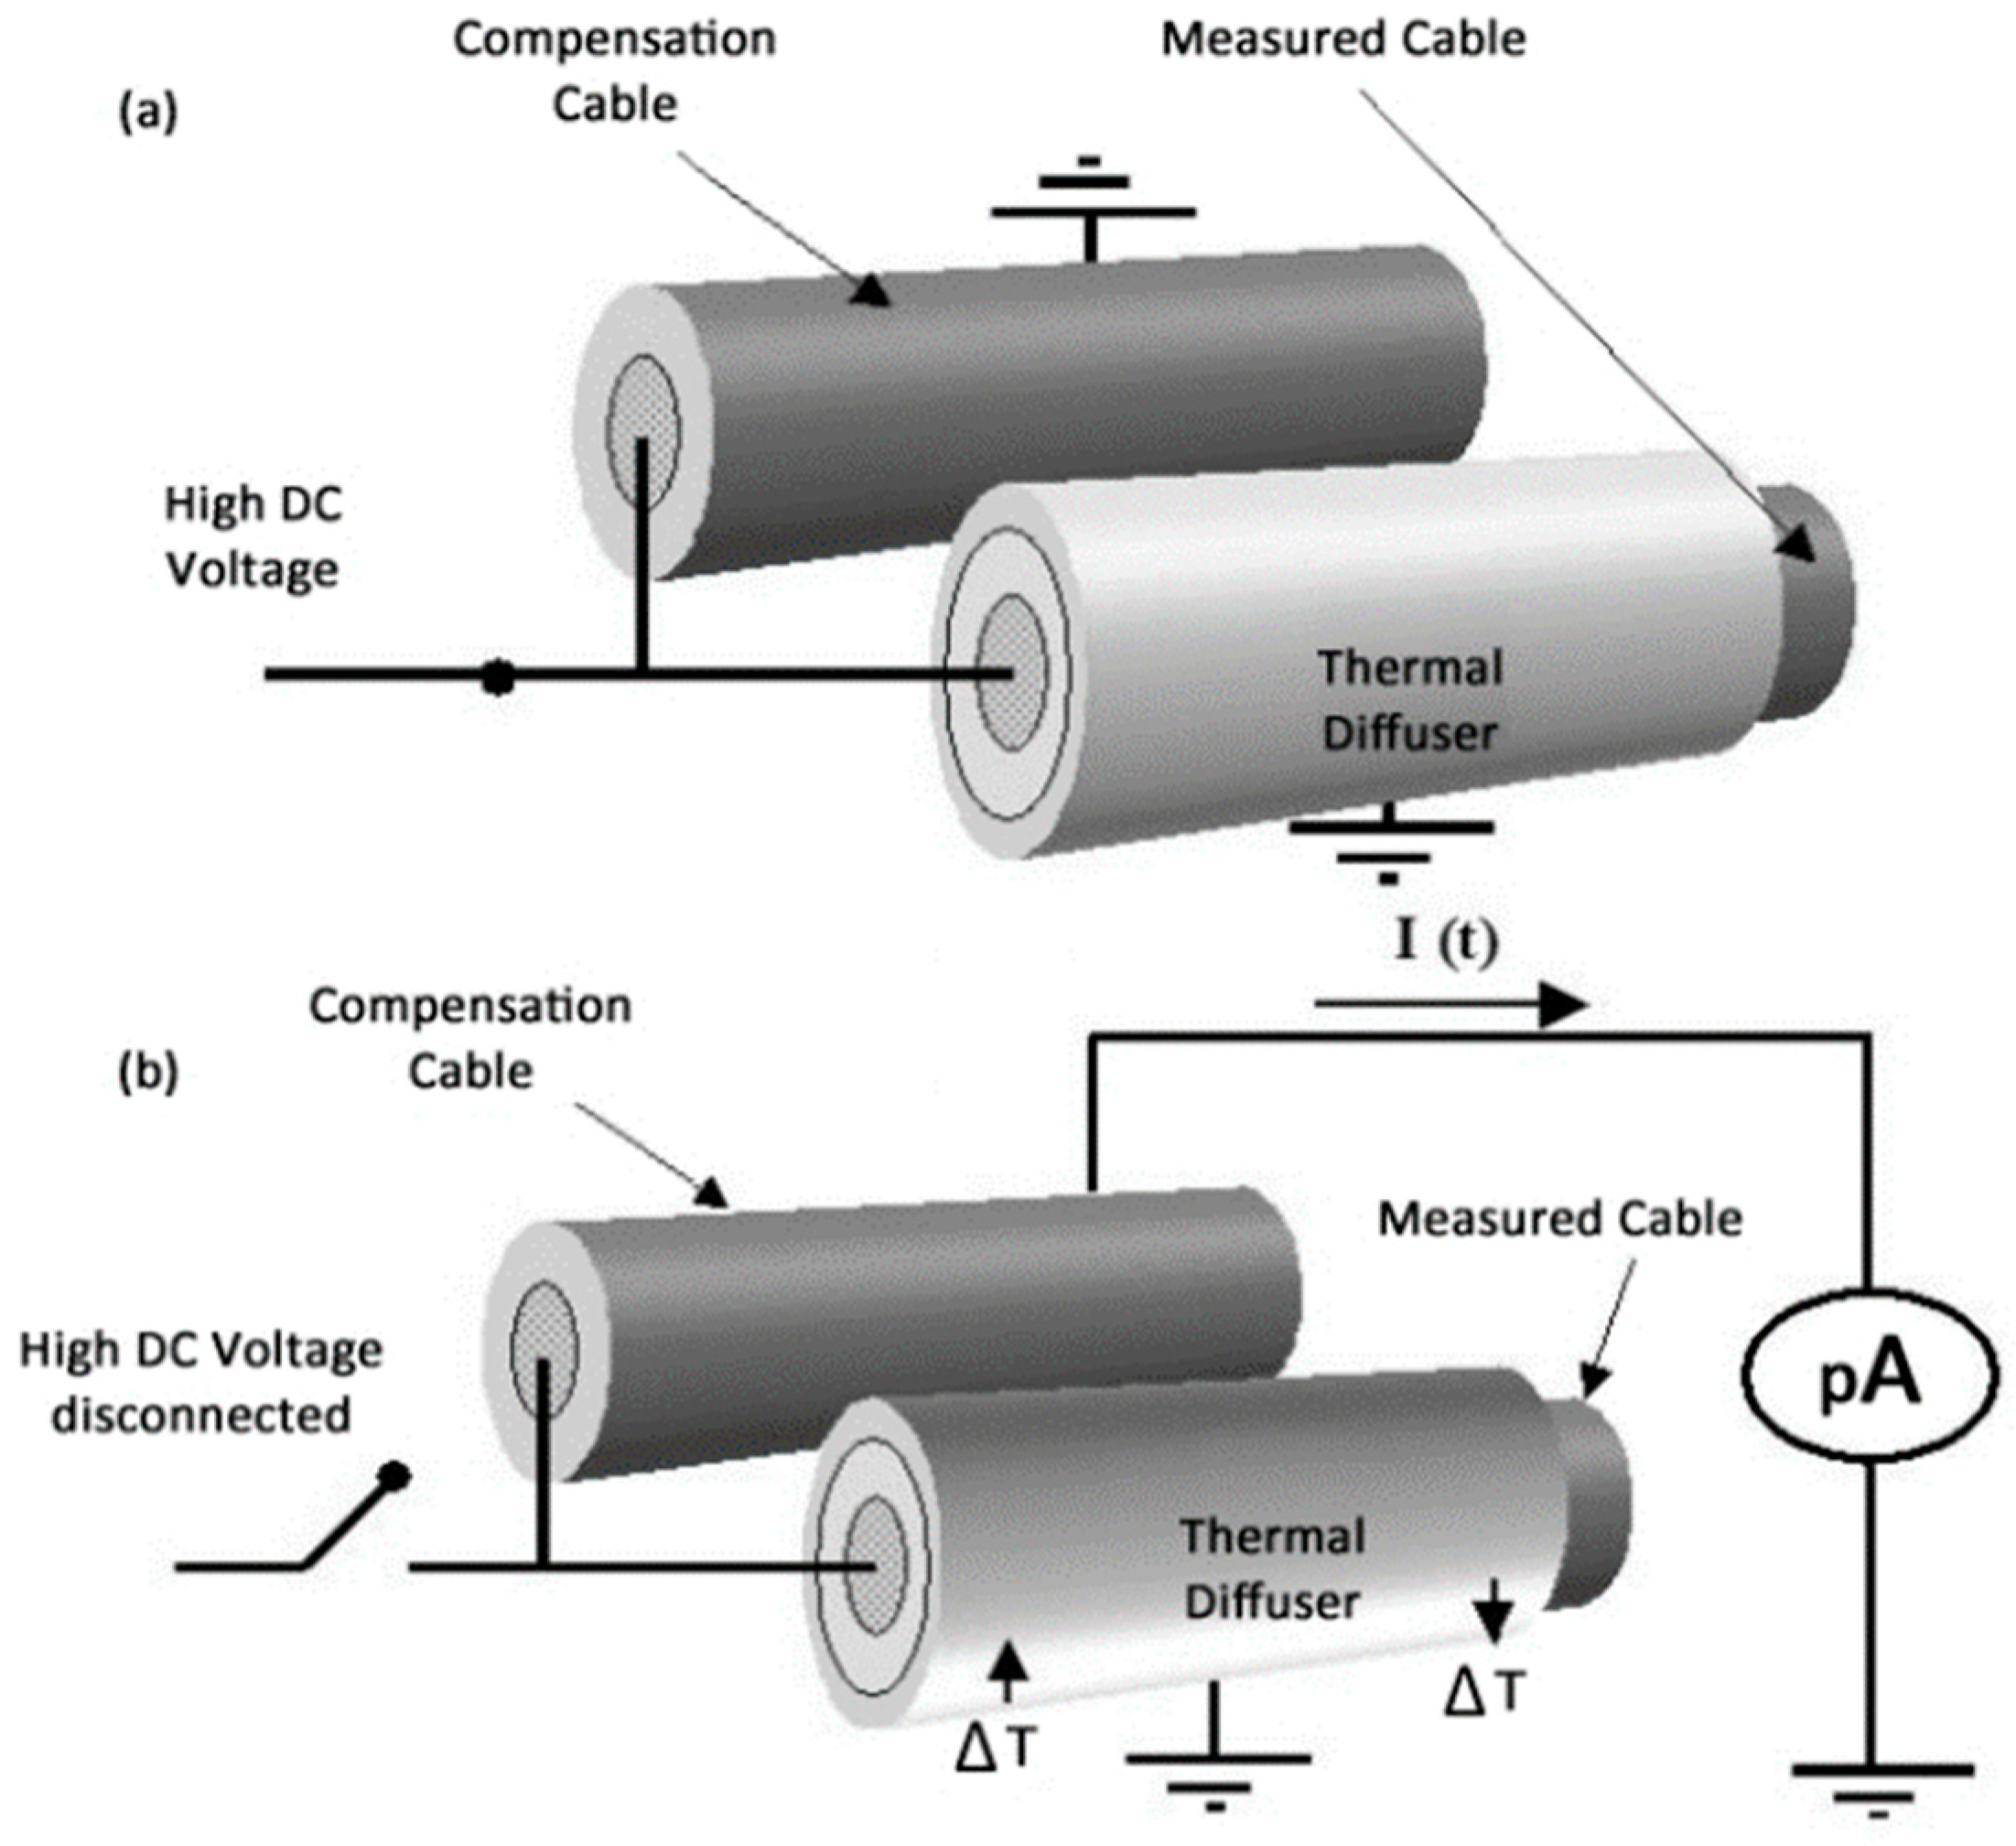
In addition to the PEA, the Thermal Step Method (TSM) is a recognized method for space charge measurements on full sized cables also mentioned by the standard IEEE Std 1732TM-2017. In Figure 22 a schematic of the TSM method as described by the aforementioned standard is shown. This method was invented by Tourielle in 1987 [48] and it relies on the application of a thermal step across the insulation in order to generate a temporary displacement of the charges within. This influences the amount of charges at the interfaces generating a current with a typical order of magnitude of pA if the dielectric is short-circuited. The generated current signal is then amplified, deconvoluted, and calibrated in order to obtain the relation between the charge density and the radial coordinate. The thermal step can be generated heating the conductor or cooling the outer surface. In the first case, the short-circuited cable works as the secondary of a transformer and it is crossed by a current of several kA. Alternatively, the cooling of the outer surface is carried out by means of a cylindrical thermal diffuser crossed by a cold fluid and adjacent to the cable surface. While the inner heating method provides information about the whole cable, the outer cooling is used to get space charge measurements in a small portion of the sample (20–40 cm) [6]. The outer cooling method is the one recommended by the above cited standard.
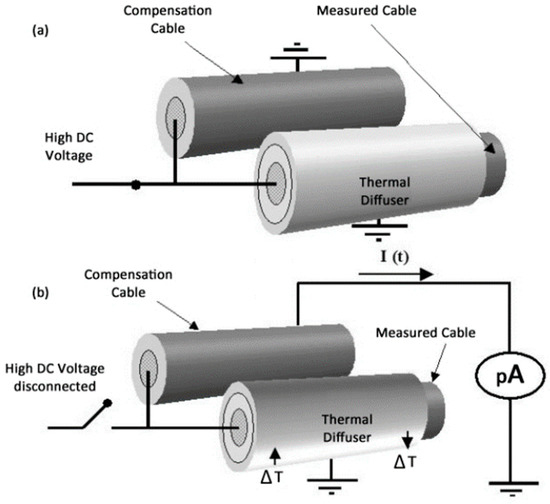
Figure 22.
Thermal Step Method (TSM) for cables, (a) conditioning phase, (b) measurement phase—figure reproduced from [6].
The current amplifier cannot be in contact with high voltage as well as the conduction and polarization current could mask the TS signal. For these reasons, the protocol described in [6] proposes a “double capacitor” configuration whereby a compensation cable identical to that under measurement is inserted into the setup. During the first step of the proposed TSM measurement procedure, both the cable conductors are connected to the HV source whilst the outer semiconductor layer is grounded. After an appropriate conditioning time, the HVDC generator is disconnected, the thermal step is applied to the cable under measurement, and the current amplifier is connected to the compensation cable. In other words, the two cables are in parallel during the conditioning phase and in series during the measurement phase.
Unlike the PEA, the TSM provides information about space charge averaged among a cable segment and it is suitable for thick cables. The TSM measurement setup is typically bulkier than the PEA one due to the necessity to use a compensation cable. Moreover, with respect to the latter, the former requires a significantly greater measuring time due to the necessity to also perform a conditioning phase. Like the PEA, the TSM is also a partially destructive method [2].
8. Possible Direction of Research on the Use of the PEA Method for HVDC Cables
Recently, the demand of HVDC extruded cables is rapidly increasing especially thanks to the growing preference for the use of underground links and the increasing amount of energy produced by off-shore wind farms. In this context, the development of an online, embedded, and automatic PEA device would enable an optimized use of the cable system by the point of view of both electrical and thermal stresses [49]. A first step in this direction has been taken with the implementation of an automatic PEA setup developed by Jongmin Kan et al. at the Honam University, Gwangju Korea [50].
The PEA method can be applied to oil-paper insulation, although further aspects such as the environmental conditions and the acoustic wave recovery need to be addressed to acquire more accurate results [51,52].
An improvement of the existing commercial PEA cells is desirable in order to allow their adoptability in different conditions. A more versatile PEA apparatus would be more easily used in the PQ tests and in the TT of different cables.
In order to enable the use of the PEA method for online applications, the measurement device should be integrated within the cable structure. A new embedded PEA measurement setup should be developed for this purpose.
Finally, the simultaneous measurements of space charge and partial discharge on samples could improve the knowledge of the phenomena responsible for ageing in HVDC cables [53]. Some first experiments were carried out on flat specimens by means of a PEA cell and a wireless sensor system for partial discharges detection. The development of this technique and its application on cables could provide more information about the correlation between these phenomena.
9. Conclusions
The extruded HVDC cables’ demand has grown in recent years due to their increasing use for new underground and undersea lines as well as the replacement of existing Mass Impregnated HVDC cables. The initial installation of extruded HVDC cables manufactured with the same insulating materials used for HVAC application has highlighted the occurrence of premature ageing of cables due to the injection, formation, and accumulation of space charge within the insulation layer.
In order to investigate these phenomena, several non-destructive techniques for space charge measurement within insulating materials have been developed by researchers. Hitherto, the most widespread used technique is the Pulsed Electro Acoustic (PEA) method. This method is based on the detection, by means of a piezoelectric membrane, of the pressure waves generated from the interaction of a pulsed voltage with charges inside the lattice of the dielectric. During the last decades, the PEA method has been implemented for space charge measurements on cables and mini-cables with satisfactory results in terms of reliability and replicability. To date, the PEA technique is used for space charge phenomena characterized by a time scale ranging from fraction of a second to several hours. Different research groups in the world have developed different measurement setups in order to correct apply the voltage pulse to the insulation in the measurement region. The optimal choice of setup and of electrical parameters depends on the cable sizes.
In 2017, a published standard [5] included the use of the PEA and TSM methods in the context of PQ tests and TT provided for HVDC extruded cables. Nevertheless, further improvements are needed to obtain a PEA measurement procedure universally accepted and adaptable to different types of cable. Indeed, commercial PEA cells currently available on the market are optimized for a limited combination of measurement parameters as above specified. The development of a more versatile PEA device is therefore desirable in order to spread the use of this measurement method in the industrial field.
In addition, more studies should be carried out in order to evaluate the behavior of the cable’s insulation during fast transients such as polarity inversion and overvoltage. In this way, the use of the HVDC grid could be optimized taking into account the damage occurred to the cable due to the frequency and the extent of such transient phenomena [9].
In conclusion, the development of an “online” PEA system could lead to an optimization of the use of the cables by the point of view of electric and thermal stresses.
Author Contributions
Conceptualization, G.R. and P.R.; validation, A.I., P.R. and G.A.; formal analysis, G.R., A.I. and P.R.; investigation, G.R. and A.I.; writing—original draft preparation, G.R.; writing—review and editing, P.R. and G.R.; supervision, G.A.
Funding
This research received no external funding.
Conflicts of Interest
The authors declare no conflict of interest.
References
- Mazzanti, G.; Marzinotto, M. Extruded Cables for High-Voltage Direct-Current Transmission—Advances in Research and Development; IEEE Press Series on Power Engineering; John Wiley & Sons: Hoboken, NJ, USA, 2013. [Google Scholar]
- Imburgia, A.; Miceli, R.; Sanseverino, E.R.; Romano, P.; Viola, F. Review of space charge measurement systems: Acoustic, thermal and optical methods. IEEE Trans. Dielectr. Electr. Insul. 2016, 23, 3126–3142. [Google Scholar] [CrossRef]
- Hussaini, H.; Adam, A.A.; Susan, A.A. Review of Space-charge Measurement using Pulsed Electro-Acoustic Method, Advantages and Limitations. Int. J. Eng. Res. Appl. 2015, 5, 90–95. [Google Scholar]
- Maeno, T.; Kushibe, H.; Takada, T.; Cooke, C.M. Pulsed electroacoustic method for the measurement of volume charges in E-beam irradiated PMMA. In Proceedings of the Conference on Electrical Insulation & Dielectric Phenomena, Amherst, NY, USA, 20–24 October 1985. [Google Scholar]
- IEEE Recommended Practice for Space Charge Measurements on High Voltage Direct-Current Extruded Cables for Rated Voltages up to 550 kV. IEEE Std 1732™-2017. Available online: https://ieeexplore.ieee.org/servlet/opac?punumber=7949156 (accessed on 11 September 2019).
- Mazzanti, G.; Chen, G.; Fothergill, J.C.; Hozumi, N.; Li, J.; Marzinotto, M.; Mauseth, F.; Morshuis, P.; Reed, C.; Tzimas, A.; et al. A Protocol for Space Charge Measurements in Full-size HVDC Extruded Cables. IEEE Trans. Dielectr. Electr. Insul. 2015, 22, 21–34. [Google Scholar] [CrossRef]
- Tsekmes, I.A.; van der Born, D.; Morshuis, P.H.F. Space Charge Accumulation in Polymeric DC Mini-Cables. In Proceedings of the 2013 IEEE International Conference on Solid Dielectrics, Bologna, Italy, 30 June–4 July 2013. [Google Scholar]
- Ghorbani, H.; Abbasi, A.; Jeroense, M.; Gustafsson, A.; Saltzer, M. Electrical Characterization of Extruded DC Cable Insulation—The Challenge of Scaling. IEEE Trans. Dielectr. Electr. Insul. 2017, 24, 1465–1475. [Google Scholar] [CrossRef]
- Chen, G.; Hao, M.; Xu, Z.; Vaughan, A.; Cao, J.; Wang, H. Review of High Voltage Direct Current Cables. CSEE J. Power Energy Syst. 2015, 1, 9–21. [Google Scholar] [CrossRef]
- Li, S.; Lan, L.; Wu, J.; Yin, Y. Investigation of Space Charge Behavior of HVDC XLPE Cables Using PEA Method. In Proceedings of the 7th International Symposium on Electrical Insulating Materials, Niigata City, Japan, 1–5 June 2014. [Google Scholar]
- Van der Born, D.; Tsekmes, I.A.; Morshuis, P.H.F.; Smit, J.J.; Person, T.J.; Sutton, S.J. Evaluation of Apparent Trap-Controlled Mobility and Trap Depth in Polymeric HVDC Mini-Cables. In Proceedings of the 2013 IEEE International Conference on Solid Dielectrics, Bologna, Italy, 30 June–4 July 2013. [Google Scholar]
- Zhan, Y.; Chen, G.; Hao, M.; Pu, L.; Zhao, X.; Duan, W.; Sun, H.; Ju, Z.; Wang, N. Thermal Transient Effects on Space Charge Dynamics in HVDC Extruded Cable Insulation. In Proceedings of the 12th IEEE International Conference on the Properties and Applications of Dielectric Materials, Xi’an, China, 20–24 May 2018. [Google Scholar]
- Tzimas, A.; Boyer, L.; Mirebeau, P.; Dodd, S.; Castellon, J.; Notingher, P. Qualitative analysis of PEA and TSM techniques on a 200kV extruded cable during a VSC ageing program. In Proceedings of the 2016 IEEE International Conference on Dielectrics, Montpellier, France, 3–7 July 2016. [Google Scholar]
- Zheng, H. Application of PEA Technique to Space Charge Measurement in Cylindrical Geometry HV Cable Systems. Ph.D. Thesis, Department of Engineering, University of Leicester, Leicester, UK, 2015. [Google Scholar]
- Kitajima, H.; Tanaka, Y.; Takada, T. Measurement of space charge distribution at high temperature using the pulsed electro-acoustic (PEA) method. In Proceedings of the 1996 Seventh International Conference on Dielectric Materials, Measurements and Applications, Bath, UK, 23–26 September 1996. [Google Scholar]
- Wang, X.; Hao, J.Q.; Xiong, J.Z.; Chen, C.; Wu, K.; Fu, M.L.; Chen, G. Comparison and Analysis of Three Pulse Injection Methods in the Pulsed Electroacoustic Technique Used for Long Cables. IEEE Electr. Insul. Mag. 2018, 34, 17–31. [Google Scholar] [CrossRef]
- IEC/TS 62758, Calibration of Space Charge Measuring Equipment Based on the Pulsed Electroacoustic (PEA) Measurement Principle. 2012. Available online: https://webstore.iec.ch/preview/info_iec62758%7Bed1.0%7Den.pdf (accessed on 11 September 2019).
- Ala, G.; Caruso, M.; Cecconi, V.; Ganci, S.; Imburgia, A.; Miceli, R.; Romano, P.; Viola, F. Review of Acoustic Methods for Space Charge Measurement. In Proceedings of the 2015 AEIT International Annual Conference (AEIT), Naples, Italy, 14–16 October 2015. [Google Scholar]
- Imburgia, A. Modelling of Pulsed Electro Acoustic Method for Space Charge Detection on Single and Multilayer Dielectrics. Ph.D. Thesis, DEIM, University of Palermo, Palermo, Italy, 2018. [Google Scholar]
- Jeroense, M.J.P. Charges and Discharges in HVDC Cables. Ph.D. Thesis, Faculty of Electrical Engineering, Mathematics and Computer Science, Delft University, Delft, The Netherlands, 1997. [Google Scholar]
- Bodega, R.; Morshuis, P.H.F.; Smit, J.J. Space Charge Signal Interpretation in a Multi-layer Dielectric Tested by Means of the PEA Method. In Proceedings of the International Conference on Solid Dielectrics, Toulouse, France, 5–9 July 2004. [Google Scholar]
- Bodega, R.; Morshuis, P.H.F.; Smit, J.J. Space charge measurements on multi-dielectrics by means of the pulsed electroacoustic method. IEEE Trans. Dielectr. Electr. Insul. 2006, 13, 272–281. [Google Scholar] [CrossRef]
- Andrade, M.D.; Candela, R.; de Rai, L.; Bononi, S.F.; Imburgia, A.; Sanseverino, E.R.; Romano, P.; Viola, F. Interpretation of PEA Output Signal in a Multilayer Specimen. In Proceedings of the 2018 IEEE Conference on Electrical Insulation and Dielectric Phenomena, Cancun, Mexico, 21–24 October 2018. [Google Scholar]
- Fukunaga, K.; Miyata, H.; Sugimori, M.; Takada, T. Measurement of Charge Distribution in the Insulation of Cables using Pulsed Electroacoustic Method. Ieej Trans. Fundam. Mater. 1990, 110, 647–648. [Google Scholar] [CrossRef]
- Hozumi, N.; Okamoto, T.; Imajo, T. Space charge distribution measurement in a long size XLPE cable using the Pulsed Electroacoustic Method. In Proceedings of the Conference Record of the 1992 IEEE International Symposium on Electrical Insulation, Baltimore, MD, USA, 7–10 June 1992. [Google Scholar]
- Yasuda, M.; Ito, M.; Takada, T. Measurement of charge distribution in coaxial cable using the Pulsed Electroacoustic Method. Jpn. J. Appl. Phys. 1991, 30, 71. [Google Scholar] [CrossRef]
- Liu, R.; Takada, T.; Takasu, N. Pulsed electro-acoustic method for measurement of space charhe distribution in power cables under both DC and AC electric field. Jpn. J. Appl. Phys. 1993, 26, 986. [Google Scholar]
- Fu, M.; Chen, G.; Davies, A.E.; Tanaka, Y.; Takada, T. A Modified PEA Space Charge Measuring System for Power Cables. In Proceedings of the 6th International Conference on Properties and Applications of Dielectric Materials, Xi’an, China, 21–26 June 2000. [Google Scholar]
- Perego, G.; Peruzzotti, F.; Montanari, G.C.; Palmieri, F.; de Robertis, G. Investigating the effect of additives for high-voltage polymeric dc cables through space charge measurements on cables and films. In Proceedings of the 2001 Annual Report Conference on Electrical Insulation and Dielectric Phenomena, Kitchener, ON, Canada, 14–17 October 2001. [Google Scholar]
- Hozumi, N.; Suzuki, H.; Okamoto, T.; Watanabe, K.; Watanabe, A. Direct Observation of Time-dependent Space Charge Profiles in XLPE Cable under High Electric Fields. IEEE Trans. Dielectr. Electr. Insul. 1994, 1, 1068–1076. [Google Scholar] [CrossRef]
- Hozumi, N.; Takeda, T.; Suzuki, H.; Okamoto, T. Space Charge Behavior in XLPE Cable Insulation under 0.2-1.2 MV/cm dc Fields. IEEE Trans. Dielectr. Electr. Insul. 1998, 5, 82–90. [Google Scholar] [CrossRef]
- Raja, A.R.A.; Vissouvanadin, B.; Vu, T.T.N.; Teyssedre, G.; Sinisuka, N.I. Space Charge Measurement on XLPE Cable for HVDC Transmission using PEA Method. In Proceedings of the 4th International Conference on Electrical Engineering and Informatics (ICEEI 2013), Bangi, Malaysia, 24–25 June 2013. [Google Scholar]
- Vu, T.T.N.; Teyssedre, G.; Vissouvanadin, B.; Steven, J.Y.; Laurent, C. Transient space charge phenomena in HVDC model cables. In Proceedings of the9th International Conference on Insulated Power Cables (JiCable), Versailles, France, 21–25 June 2015. [Google Scholar]
- Lee, J.-H.; Kim, C.-H.; Park, Y.-H.; Hwangb, S.; Kim, Y.H.; Kim, J.-T.; Morshuis, P.; Hozumi, N. A Development of Space Charge Measurement Device for Model Cable. In Proceedings of the 2016 International Conference on Condition Monitoring and Diagnosis, Xi’an, China, 25–28 September 2016. [Google Scholar]
- Hozumi, N.; Hori, M. Measuring Space-Charge in HVDC Cables. Cigré Science Engineering. 2016. Available online: https://www.ee.co.za/wp-content/uploads/2017/02/Energize-TD-page35-38-Feb17.pdf (accessed on 11 September 2019).
- Zheng, H.; Dodd, S.J.; Dissado, L.A.; Fothergill, J.C.; Allais, A.; Kebbabi, L. Feasibility of using a flat bottom electrode for PEA space charge measurement on mini-cables under high temperatures. In Proceedings of the 2013 Annual Report Conference on Electrical Insulation and Dielectric Phenomena, Shenzhen, China, 20–23 October 2013. [Google Scholar]
- Zheng, H.; Dodd, S.J.; Dissado, L.A.; Fothergill, J.C.; Allais, A.; Kebbabi, L. Influence of cable clamping force on PEA measurement on HVDV mini-cables. In Proceedings of the 2013 IEEE International Conference on Solid Dielectrics, Bologna, Italy, 30 June–4 July 2013. [Google Scholar]
- Montanari, G.C.; Fabiani, D.; Dissado, L.A. Fast Charge Pulses: The Evidence and its Interpretation. In Proceedings of the 2013 IEEE International Conference on Solid Dielectrics, Bologna, Italy, 30 June–4 July 2013. [Google Scholar]
- Fabiani, D.; Montanari, G.C.; Dissado, L.A. Measuring a Possible HVDC Insulation Killer: Fast Charge Pulses. IEEE Trans. Dielectr. Electr. Insul. 2015, 22, 45–51. [Google Scholar] [CrossRef]
- Montanari, G.C.; Dissado, L.A.; Serra, S. The Hidden Threat to HVDC Polymeric Insulation at Design Field: Solitonic Conduction. IEEE Electr. Insul. Mag. 2014, 30, 39–50. [Google Scholar] [CrossRef]
- Zhu, Z.; Yang, L.; Guo, S.; Li, D.; Zhang, Y. Comparison Between PEA and PWP Method of Space Charge Measurement in Model Cable. In Proceedings of the 2015 IEEE 11th International Conference on the Properties and Applications of Dielectric Materials, Sydney, Australia, 19–22 July 2015. [Google Scholar]
- Zimmerling, I.M.; Tsekmes, I.A.; Morshuis, P.H.F.; Smit, J.J.; Person, T.J.; Geussens, T. Space charge analysis of modified and unmodified XLPE model-cables under different electric fields and temperatures. In Proceedings of the 2015 IEEE Conference on Electrical Insulation and Dielectric Phenomena (CEIDP), Ann Arbor, MI, USA, 18–21 October 2015. [Google Scholar]
- Adi, N.; Vu, T.T.N.; Teyssèdre, G.; Baudoin, F.; Sinisuka, N. DC Model Cable under Polarity Inversion and Thermal Gradient: Build-Up of Design-Related Space Charge. Technologies 2017, 5, 46. [Google Scholar] [CrossRef]
- Adi, N.; Teyssedre, G.; Vu, T.T.N.; Sinisuka, N.I. DC Field Distribution in XLPE-Insulated DC Model Cable with Polarity Inversion and Thermal Gradient. In Proceedings of the 2016 IEEE International Conference on High Voltage Engineering and Application (ICHVE), Chengdu, China, 19–22 September 2016. [Google Scholar]
- Albertini, M.; Bononi, S.F.; Giannini, S.; Troia, I.; Sica, G.; Mazzanti, G.; Pini, D. Issues in Space Charge Measurments with the PEA Technique in HVDC Cables: Applicative Case Study. In Proceedings of the 2018 IEEE CEIDP Conference on Electrical Insulation and Dielectric Phenomena, Cancun, Mexico, 21–24 October 2018. [Google Scholar]
- Fechner, T.; Zhou, Y.; Lei, X.; Zhou, M. Important Design Aspects of Pulsed Electroacoustic Measurement Systems for Thick Full-Size Cable Specimen. In Proceedings of the 2018 International Conference on Power System Technology (POWERCON), Guangzhou, China, 6–8 November 2018. [Google Scholar]
- Imburgia, A.; Romano, P.; Sanseverino, E.R.; de Rai, L.; Bononi, S.F.; Troia, I. Pulsed Electro-Acoustic Method for specimens and cables employed in HVDC systems: Some feasibility considerations. In Proceedings of the 2018 AEIT International Annual Conference, Bari, Italy, 3–5 October 2018. [Google Scholar]
- Toureille, A.; Reboul, J.P. The thermal-step-technique applied to the study of charge decay in polyethylene thermoelectrets. In Proceedings of the 6th International Symposium on Electrets (ISE 6) Proceedings, Oxford, UK, 1–3 September 1988; pp. 23–27. [Google Scholar]
- Morshuis, P. A Short History of High-Voltage Direct Current Cables and Space Charge Measurements at Delft University of Technology. Sens. Mater. 2017, 29, 1099–1108. [Google Scholar]
- Kang, J.; Hwangbo, S.; Min, W.; Jung, H.; Park, J. Automatic Measurement System for Space Charge Distribution in HVDC Model Cable. In Proceedings of the 8th International Symposium on Electrical Insulating Materials, Toyohashi City, Japan, 12–15 September 2017. [Google Scholar]
- Tang, C.; Huang, B.; Hao, M.; Xu, Z.; Hao, J.; Chen, G. Progress of Space Charge Research on Oil-Paper Insulation Using Pulsed Electroacoustic Techniques. Energies 2016, 9, 53. [Google Scholar] [CrossRef]
- Chen, Q.; Zhang, J.; Chi, M.; Tan, P.; Sun, W. Effect of Temperature on Space Charge Distribution of Oil–Paper Insulation under DC and Polarity Reversal Voltage. Energies 2018, 11, 2271. [Google Scholar] [CrossRef]
- Imburgia, A.; Romano, P.; Viola, F.; Madonia, A.; Candela, R.; Troia, I. Space charges and partial discharges simultaneous measurements under DC stress. In Proceedings of the 2016 IEEE Conference on Electrical Insulation and Dielectric Phenomena (CEIDP), Toronto, ON, Canada, 16–19 October 2016. [Google Scholar]


© 2019 by the authors. Licensee MDPI, Basel, Switzerland. This article is an open access article distributed under the terms and conditions of the Creative Commons Attribution (CC BY) license (http://creativecommons.org/licenses/by/4.0/).