Article

Molecular Dynamics Simulation of Diffusion Behavior of CH4, CO2, and N2 in Mid-Rank Coal Vitrinite

1
Key Laboratory of Coal bed Methane Resource & Reservoir Formation Process, Ministry of Education China University of Mining and Technology, Xuzhou 221008, China
2
School of resources and earth science, China University of Mining and Technology, Xuzhou 221116, China
*
Author to whom correspondence should be addressed.
Energies 2019, 12(19), 3744; https://doi.org/10.3390/en12193744
Submission received: 27 August 2019 / Revised: 22 September 2019 / Accepted: 27 September 2019 / Published: 30 September 2019
(This article belongs to the Section H: Geo-Energy)

Abstract

:
The diffusion characteristics of CH4, CO2, and N2 in coal are important for the study of CO2-enhanced coalbed methane (CO2-ECBM) recovery, which has become the most potential method for carbon sequestration and natural gas recovery. However, quantitative research on the diffusion characteristics of CH4 and the invasive gases (CO2 and N2) in coal, especially those in micropores, still faces enormous challenges. In this paper, the self-, Maxwell’s, and transport diffusions of CO2, CH4, and N2 in mid-rank coal vitrinite (MRCV) macromolecules were simulated based on the molecular dynamics method. The effects of the gas concentration, temperature, and pressure on the diffusion coefficients were examined via the comparison of various ranks. The results indicated that the diffusion coefficients have the order of D(N2) > D(CO2) > D(CH4) in their saturated adsorption states. However, when MRCV adsorbed the same amounts of CH4, CO2, and N2, the self- and transport diffusion coefficients followed the order of DS(N2) > DS(CO2) > DS(CH4) and Dt(CO2) > Dt(N2) > Dt(CH4), respectively. Independent of the gas species, all these diffusion coefficients decreased with increasing gas concentration and increased with increasing temperature. In the saturated adsorption state, the diffusion activation energies of CH4, CO2, and N2 were ordered as CH4 (27.388 kJ/mol) > CO2 (11.832 kJ/mol) > N2 (10.396 kJ/mol), indicating that the diffusion processes of CO2 and N2 occur more easily than CH4. The increase of temperature was more conducive to the swelling equilibrium of coal. For the pressure dependence, the diffusion coefficients first increased until the peak pressure (3 MPa) and then decreased with increasing pressure. In contrast, the diffusion activation energy first decreased and then increased with increasing pressure, in which the peak pressure was also 3 MPa. The swelling rate changed more obviously in high-pressure conditions.

Graphical Abstract

1. Introduction

As a clean energy source, which occurs in the adsorption state, coalbed methane (CBM) is an important, unconventional natural gas resource in the United States, Australia, China, and other countries [1,2,3], primarily consisting of CH4 and a small amount of heavy hydrocarbons, CO2, N2, and H2O [2]. Compared with CH4, coal seams can adsorb CO2 more easily. Injecting CO2 and N2 into the coal seams can promote CH4 to escape from the coal seams [4,5,6,7,8]. Therefore, the unmineable coal seams have the potential to store CO2 and enhanced coalbed methane recovery. During the production process of CBM, CH4 in the adsorption state is first desorbed from the optimal sites in the micropores, then diffused into the mesopores, macropores, and cleats of the coal seam through the pore network, and finally enters the production well through a continuous seepage flow [9]. Therefore, the gas diffusion in the coal matrix is a vital process for mass migration from the pores to the cleats [10]. However, it is very challenging to quantitatively investigate the microscopic diffusion behavior of gas in coal, especially in the micropores. Systematic research on the diffusion process and mechanisms of CH4, CO2, and N2 at different geometric scales in coal seams can both efficiently enhance both CBM production and the implementation of CO2 capture, utilization, and sequestration (CCUS) [11,12].
Considering the wide distribution of the strong heterogeneity and the complex pore structure of coal [13], to the best of our knowledge, the pores in coal can be classified as micropores (pore size: d < 2 nm), mesopores (2–50 nm), and macropores (d > 50 nm) [14]. Previous research [15,16] has shown that the micropores in coal account for more than 60% of the total pore volume, and the gases of CO2 and CH4 are mainly adsorbed in the coal matrix. Different scholars have been studied gas diffusion in coal, which is based on different models of pores. Many multipore models were proposed for coal, such as Crank’s (1975) unique model [17] and Ruckenstein’s (1971) bidisperse [18] and modified bidisperse [4] models, among which the unique model (d = 0.3 nm) only considers that coal particles consist of uniform spherical particles [19]. However, the bidisperse model is composed of two spheres of different sizes, which can reflect the adsorption and diffusion processes of gas not only in the micropores but also in the macropores. The diffusion coefficients calculated based on the different pore models are quite different. Although Staib et al. [20] showed that the results of the modified bidisperse model were closer to the experimental values than the unique and bidisperse models, none of the models took into account the effect of the interaction between the chemical groups on the pore walls and the gas on the gas adsorption and diffusion processes.
The self-diffusion process is driven through the spontaneous thermal motion of micro-particles and follows Einstein’s laws [21], which are independent of pressure and concentration gradients. Most scholars focus on the self-diffusion process and further obtain the diffusion coefficient through molecular simulations [12]. This diffusion coefficient, although at the microscale, can efficiently reflect the motion characteristics of the diffusion particles and is the basis for the macroscopic mass transport [22]. However, the investigations of the Maxwell’s diffusion coefficient and the transport diffusion coefficient have also received attention, as they are useful for describing macroscopic mass transport. To date, research on the microscopic diffusion process for the above three gases has primarily been conducted via molecular simulations and experimental characterizations. Over the last decade, there have already been several works studying the self- and transport diffusion processes over the last decade. Among these studies, Cui et al. [4] (2004) studied the diffusion of CO2, CH4, and N2 in micropores and macropores based on the bidisperse model. It was found that the CO2 diffusion coefficient was one to two orders of magnitude higher than those of CH4 and N2, suggesting that this may be related to the molecular dynamics diameter of gas. In addition, the diffusion coefficient decreases with increasing pressure. Charrière et al. (2010) [23] estimated the CO2 and CH4 diffusion coefficients of 1.4 × 10⁻¹² m2/s and 0.41 × 10⁻¹² m2/s, respectively, based on the unique model combined with experimental adsorption data and calculated the activation energies of CO2 and CH4 as 18 kJ/mol and 34 kJ/mol, respectively. Zhao et al. [12] (2016) researched the diffusion characteristics of CO2 and CH4 in micropores based on the Wiser bituminous coal model. The diffusion coefficients of CO2 and CH4 were calculated to be 8.13 × 10⁻¹⁰ m2/s and 2.08 × 10⁻¹⁰ m2/s, respectively. The activation energies were 36.40 and 38.34 kJ/mol, respectively. Hu et al. (2017) [22] researched the self-diffusion and mutual diffusion of a CO2–CH4 mixture via molecular simulations for the first time based on the bituminous coal model, through which it was found that CO2(CH4) diffusion was coupled with CH4(CO2) diffusion.
A large number of scholars in domestic and overseas research have used a variety of experimental devices to research the diffusion of gases in coal by measuring the adsorption kinetic data [2,15,23,24,25,26,27,28,29,30,31,32,33]. Saghafi et al. [24] used a new experimental technique to analyze samples with a maturity between 0.66% and 1.45%, and the CO2 diffusion coefficient between 1.2 × 10⁻⁶ and 10.2 × 10⁻⁶ cm2/s, which was twice the CH4 diffusion coefficient. Yao et al. [25] developed a non-innovative technique of low-field nuclear magnetic resonance (NMR) spectral replication analysis to characterize the methane adsorption process with coal and compared the analysis results with traditional volumetric isotherm measurements to examine the mechanism of methane relaxation. Olague et al. [26] used gas–solid chromatography and moment analysis to determine the effective diffusivities of CH4 and N2 in coal. The results showed that the effective diffusivities ranged from 1.82 × 10⁻⁷ to 1.11 × 10⁻⁴ cm2/s for N2 and from 2.93 × 10⁻⁷ to 3.70 × 10⁻⁵ cm2/s for CH4. Compared with the unique model, significant progress has been made in the analysis of diffusion data results and the observation of molecular size effects.
The macroscopic diffusion process for the CH4, CO2, and N2 into coal is closely related to the ranks [24]. However, the previous efforts have mainly concentrated on the low-rank coals (Ro, max = 0.58–0.62% [11,12]). Although, the Wiser [27] bituminous coal model was also adopted for the studies on the self- and transport diffusions, this model was constructed via the gasification and liquefaction processes of coal gas and has a lower fidelity for the macromolecules of bituminous coal. Thus, to the best of our knowledge, the self- and transport diffusions of CH4, CO2, and N2 in experiments using macromolecules of mid-rank coals have not been reported to date.
In summary, the macromolecules of mid-rank coal, in this study, were obtained through elemental analysis, solid-state cross-polarization magic angle spinning (CP/MAS) 13C NMR, and Fourier-transform infrared (FT-IR) spectroscopy. The diffusion mechanism was quantitatively examined based on the grand canonical Monte Carlo (GCMC) and molecular dynamics (MD) methods, and the influences of the gas concentration, temperature, and pressure on diffusion were studied, which providing a reliable theoretical basis and foundation for E-CBM in order to efficiently achieve CO2 geological storage.

2. Materials and Methods

A coal vitrinite sample, TL-1, was collected from the Tunlan mine, Shanxi Province, China. The sample was from the Carboniferous-Permian coal seam. We chose the vitrinite from the raw coal by hand, and the vitrinite reflectance, Ro, was 1.3%. The sample was ground to 200 mesh. The proximate and elemental analysis test results by the Jiangsu Provincial Institute of Geology and Mineral Design were in accordance with national standards GB/T212-2008 and GB/T31391-2015, as listed in Table 1, and were obtained with the Vario EL elemental analyzer from EA Germany.

3. Model and Calculation Method

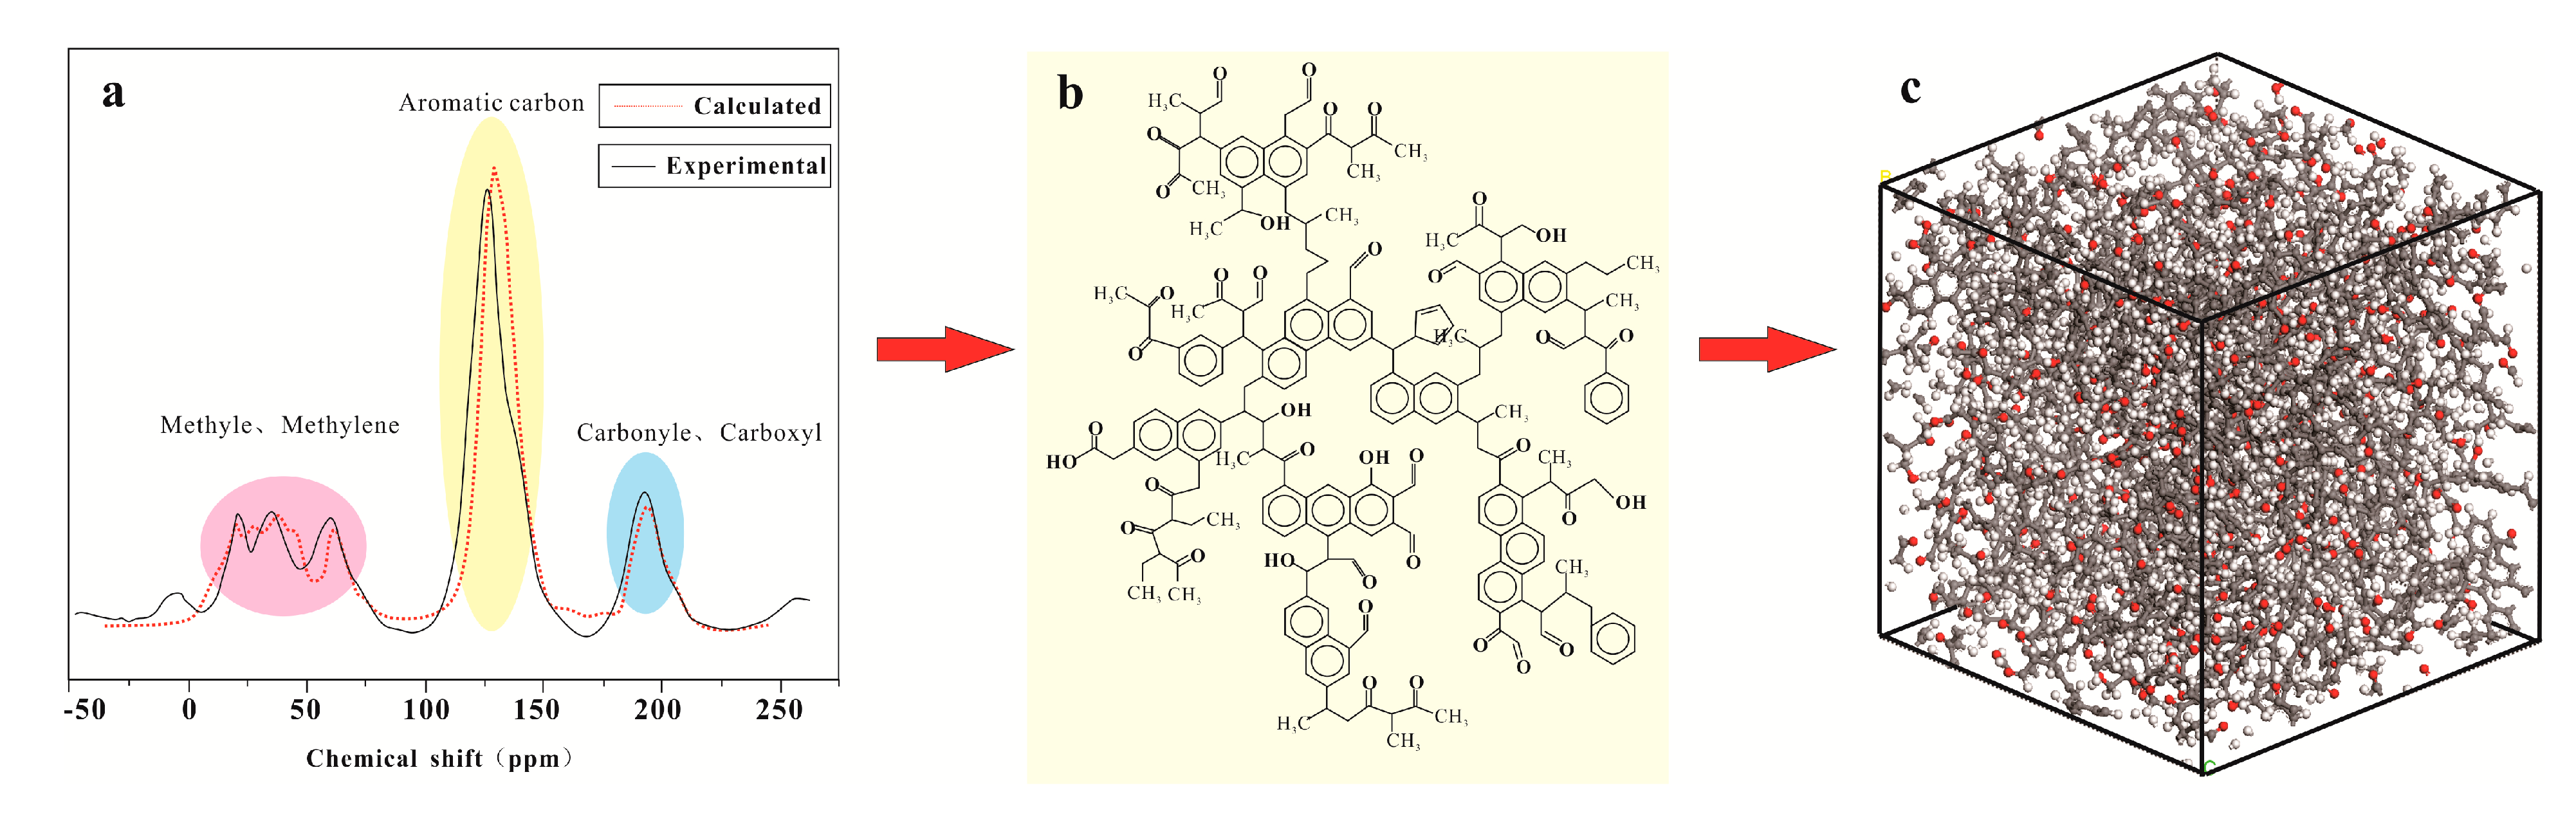
3.1. Macromolecular Structure Construction

Before construction of the 3D macromolecular structure, the size of the aromatics was determined by 13C NMR spectroscopy, the size of the aliphatic carbon and heteroatoms was determined by infrared spectroscopy, and the 2D chemical structure of the TL-1 vitrinite was characterized. A large number of studies have shown that 13C NMR can effectively characterize the 2D chemical molecular structure [29]. The 13C chemical shift of the constructed vitrinite molecular structure was calculated using ACD/C NMR prediction software. After thousands of structural unit adjustments, the 13C NMR spectrum of the constructed macromolecular structure and the 13C NMR spectrum of the TL-1 vitrinite sample were matched (Figure 1a).
Geometric optimization and energy annealing of the 2D molecular structure (Figure 1b) were conducted based on the Materials Studio (Accelrys) software. Considering that the TL-1 sample’s mid-rank coal structure order had not been completely formed [30], we used the AC module in the software to form a 3D unit box of 14 2D unit structures (Figure 1c). Geometric optimization was conducted the same way, whereby the Compass II force field was used to calculate the van der Waals force using the L-J 9-6 potential energy equation. The density was set to 1.34 g/cm3, which was consistent with the true density measured in the sample experiment, and the accessible volume of the macromolecular model was 0.034 cm3/g (the probed molecular radius was 0.165 nm), which was consistent with the micropores volume of 0.035 cm3/g (Dubiin–Astakhov model) obtained in the low-temperature carbon dioxide experiment.
The experimental peak of 13C NMR spectroscopy showed that there were three distinct peaks between 10–75 ppm, 100–160 ppm, and 175–225 ppm. Among these peaks, 10-75 ppm is classified as methyl and methylene in the aliphatic carbon region, and 100–160 ppm belongs to the aromatic carbon region, including protonated aromatic carbon and bridged aromatic carbon, and 175–225 ppm belongs to the carbonyl group containing oxygen. Since the sample was a mid-rank coal vitrinite sample, some of the aliphatic chains had fallen off, and the proportion of aromatic carbon was larger than that of aliphatic carbon, while the aromatic carbon mainly existed in the form of a benzene ring and a naphthalene ring. In the 3D molecular structure (Figure 1c), the relative atomic mass was 3358, and the unit cell size was 3.878 nm × 3.878 nm × 3.878 nm.

3.2. Monte Carlo Simulation

Using the sorption module in the Materials Studio (Accelrys) software, the adsorption behavior of CH4/CO2/N2 was studied by the grand canonical ensemble Monte Carlo (GCMC) simulation method. The interactions in the simulations included van der Waals interactions and Coulomb interactions, and the van der Waals interactions are described by the Lennard–Jones (LJ 9-6) potential energy model. The potential energy model describing the combined effects of the van der Waals forces and Coulomb forces is described in Equation (1) [31,32]:
E ij = ij ε ij [ 2 ( r o ij r ij ) 9 3 ( r o ij r ij ) 6 ] + q i q j 4 π r ij ε 0 ,
where E ij represents the interaction energy, kJ/mol; q i and q j are the atomic charges in the system, C, r ij is the distance between atom i and atom j, nm; ε 0 is the dielectric constant, 8.854 × 10⁻¹² F/m; and the van der Waals force parameters, r o ij and ε ij , can be calculated based on r o (the atomic radius) and ε (the potential depth) (Equations (2) and (3), respectively) [31]:
r ij o = ( ( r i o ) 6 ( r j o ) 6 2 ) 1 6 ,
ε ij = 2 ε i ε j ( ( r i o ) 3 · ( r j o ) 3 ( r i o ) 6 · ( r j o ) 6 ) ,
Considering the geological characteristics of the coal reservoir pressure, five temperature points of 283 K, 298 K, 318 K, 338 K, and 358 K were selected, respectively. The pressure range was between 0.1 and 10 MPa. To accurately calculate, the constant temperature and the constant pressure, the point-by-point calculation method was adopted, and the calculation was divided into eight pressure points. In this paper, the Compass II force field [33] was used to calculate the intermolecular force. The key energy equations are as follows (Equations (4)–(6)) [24]:
Etotal = EVal + ENon,
ENon = EVan + Eele + Ehy,
EVal = EBo + EAn + ETor + EIn,
where Etotal is the total energy, EVal and ENon are the valence electron energy and the nonbond energy, respectively, and EVan, Eele, and Ehy are the van der Waals forces, electrostatic forces, and hydrogen bond energies, respectively.
Based on this point of view, Gibbs defined the concept of excess adsorption, which is considers that not all gas in the adsorbed phase is on the surface of the adsorbent. The absolute adsorbed amount contains the adsorbed molecules in the form of the adsorbed phases, and in the form of the gas phase. The adsorbed molecules are distributed in the adsorption region, and the excess adsorption capacity only includes the adsorbed molecules in the form of the adsorbed phases (Figure 2a) [31,34]. When the adsorption pressure is low, the excess adsorption capacity and absolute adsorption capacity are basically the same, due to the small difference between the bulk gas phase density and the adsorption phase density. However, when the experimental pressure increases, the larger difference between the two density values results in a larger difference between the excess adsorption capacity and the absolute adsorption capacity. According to the Gibbs concept, the excess adsorption capacity can be obtained by Equation (7) [35]:
N ( excess ) = N ( absolute ) V P ρ g ,
where N ( excess ) and N ( absolute ) are the excess adsorption and absolute adsorption capacities, respectively, mol/g; V P is the adsorbed phase volume, cm3; ρ g is the density of the gas phase, which can be calculated by the SRK equation, g/cm3.
In Figure 2, the area of Region a is the amount of adsorption that is completely present in the form of the adsorbed phase, that is, the amount of excess adsorption. Region b represents the amount of adsorption present in the adsorption zone in the form of the gas phase. Region c is the free gas present in the form of a gas phase. The sum of Regions a and b is the absolute adsorption capacity. The sum of Region of a, b, and c is the total amount of gas in the system, N, and the obtained result is the total gas content. Therefore, the excess adsorption capacity can be expressed as [35]:
N ( excess ) = N ( V a + V g ) ρ g = N V p ρ g
where N is the total gas content in the simulation, mol/g; V g is the gas phase volume, cm3; V P is the free volume, cm3; which can be obtained by selecting the corresponding gas molecules as probes using the Connolly Surface software tool, cm3.

3.3. Molecular Dynamics Simulation

A molecular dynamics simulation was carried out by using the dynamics tasks in the Focite module of the Material Studio software. In the molecular dynamics simulation, the geometrical optimization and energy optimization of the dominant adsorption configuration were carried out. The initial rate obeyed the Boltzmann random distribution, and the control of the temperature and pressure was performed by the Berendsen method and the Andersen thermal bath temperature control method, respectively. First, a 500 ps NVE ensemble was used for crystal relaxation to ensure the optimal structure; then, a 500 ps NVT ensemble was used to balance the system, and finally, a 500 ps NPT ensemble was used for the molecular dynamics simulations to ensure sufficient time to form a stable linear relationship between MSD and time.

3.4. Self-, Maxwell’s, and Transport Diffusions

The diffusion coefficients were divided into the self-diffusion coefficient ( D s ), the Maxwell’s diffusion coefficient (Dc), and the transport diffusion coefficient ( D t ), which are used to characterize the gas molecular mobility and transport in porous materials [36]. Self-diffusion is the Brownian motion of particles in thermodynamic equilibrium without the driving force, while the particle motion driven by a chemical potential or concentration gradient is transport diffusion. In molecular dynamics, the Einstein equation is used to calculate the self-diffusion coefficient [21,37]:
MSD = i = 1 N | r i ( t ) r i ( 0 ) | 2 ,
D s = 1 6 lim t d dt ( MSD ) ,
D s = 1 6 lim t d dt i = 1 N | r i ( t ) r i ( 0 ) | 2 ,
where N is the number of diffused particles in the system, r i ( t ) is the position vector of a particle at time t, r i ( 0 ) is the position vector of the particle at the initial time, and t is the simulation time.
According to Maxwell’s theory, the Maxwell’s diffusion coefficient can be obtained as follows [38]:
D c = 1 3 · V · c 0 V i ( t ) · V i ( 0 ) dt ,
The relationship between the self-diffusion and Maxwell’s diffusion is as follows:
D c = 2 V · c · D s ,
where c is the gas concentration, mol/m3; and V is the volume, m3.
D t = D c · Γ ,
Γ = ln f ln c ,
where f is the degree of fugacity, MPa; according to the P–R equation [39]:
ln f p = z 1 ln ( z b ) a 2 · b 2 · ln [ z + ( 1 + 2 ) · b z + ( 1 2 ) · b ] ,
D t = D c · Γ = 1 3 cV 0 i = 1 0 V i ( t ) · i = 1 0 V i ( 0 ) dt · ln f ln c T ,
where p is the pressure, MPa, z is the compression coefficient, a is a gravitational parameter, and b is the van der Waals covolume. The diffusion behavior of gas in coal molecules is also an activation process, that is, the relationship between the transport diffusion process and activation energy is
ln ( D t ) = Ea RT + ln ( D 0 ) ,
where Ea is the diffusion activation energy, J·mol−1; D 0 is the diffusion prefactor, m2/s; R is the universal gas constant, J·mol−1·k−1; and T is the thermodynamic temperature, K.
When gas molecules interact with coal molecules, strain deformation occurs along with the volume of the coal molecules, and the volumetric strain expansion rate is defined as [12]
Swelling ratio = (ViV0)/V0,
where Vi and V0 are the volume before and after the volume strain, A3.

4. Results and Discussion

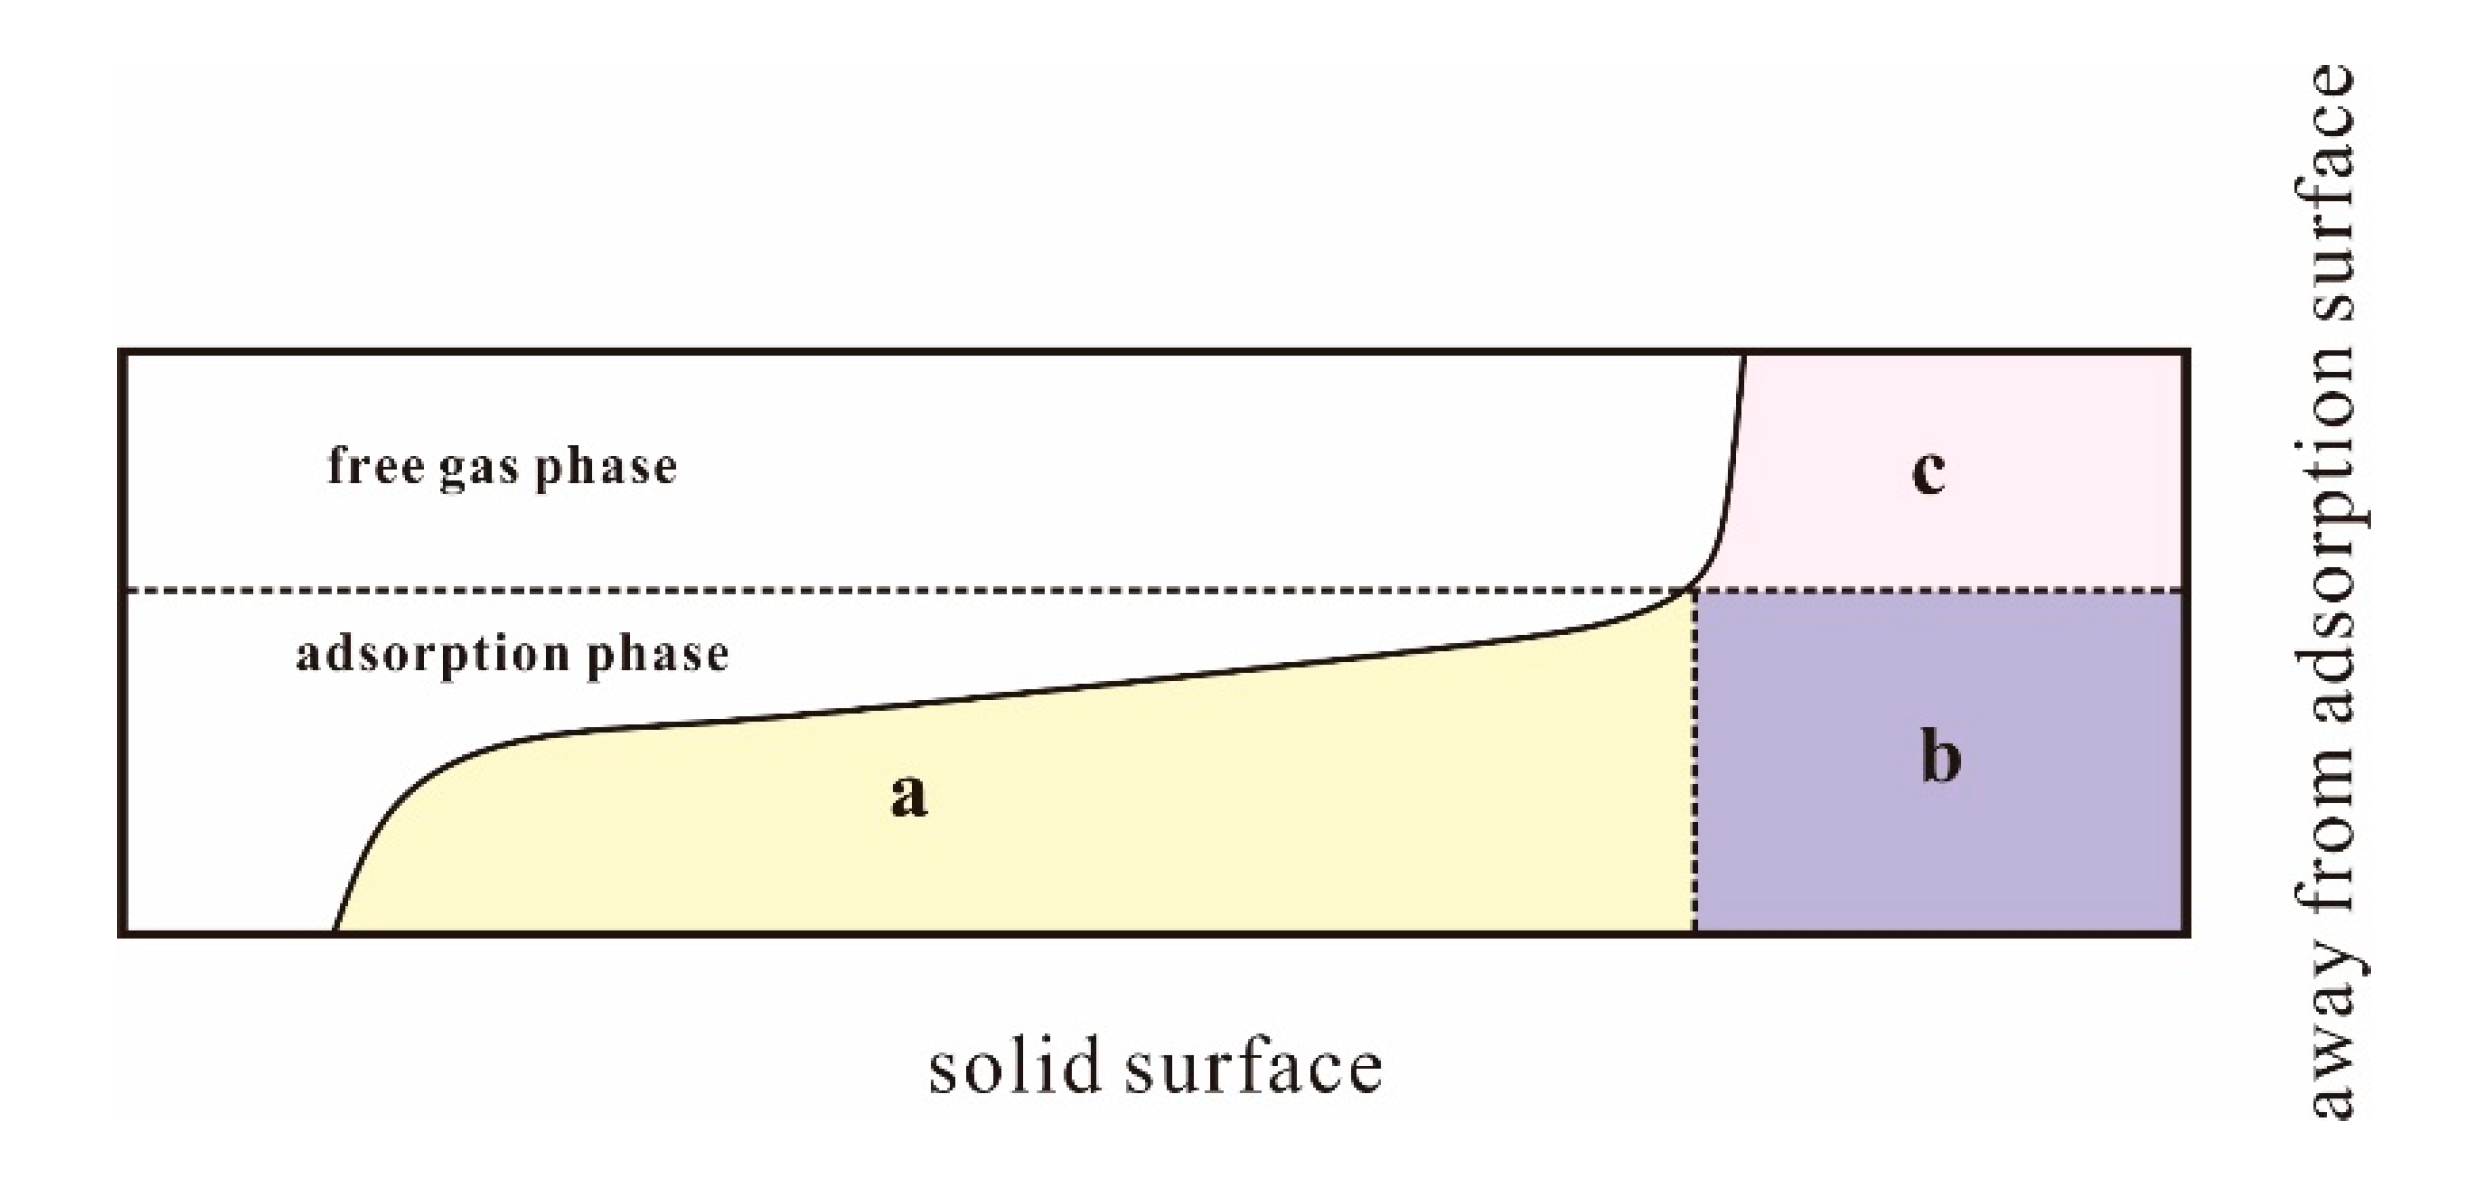
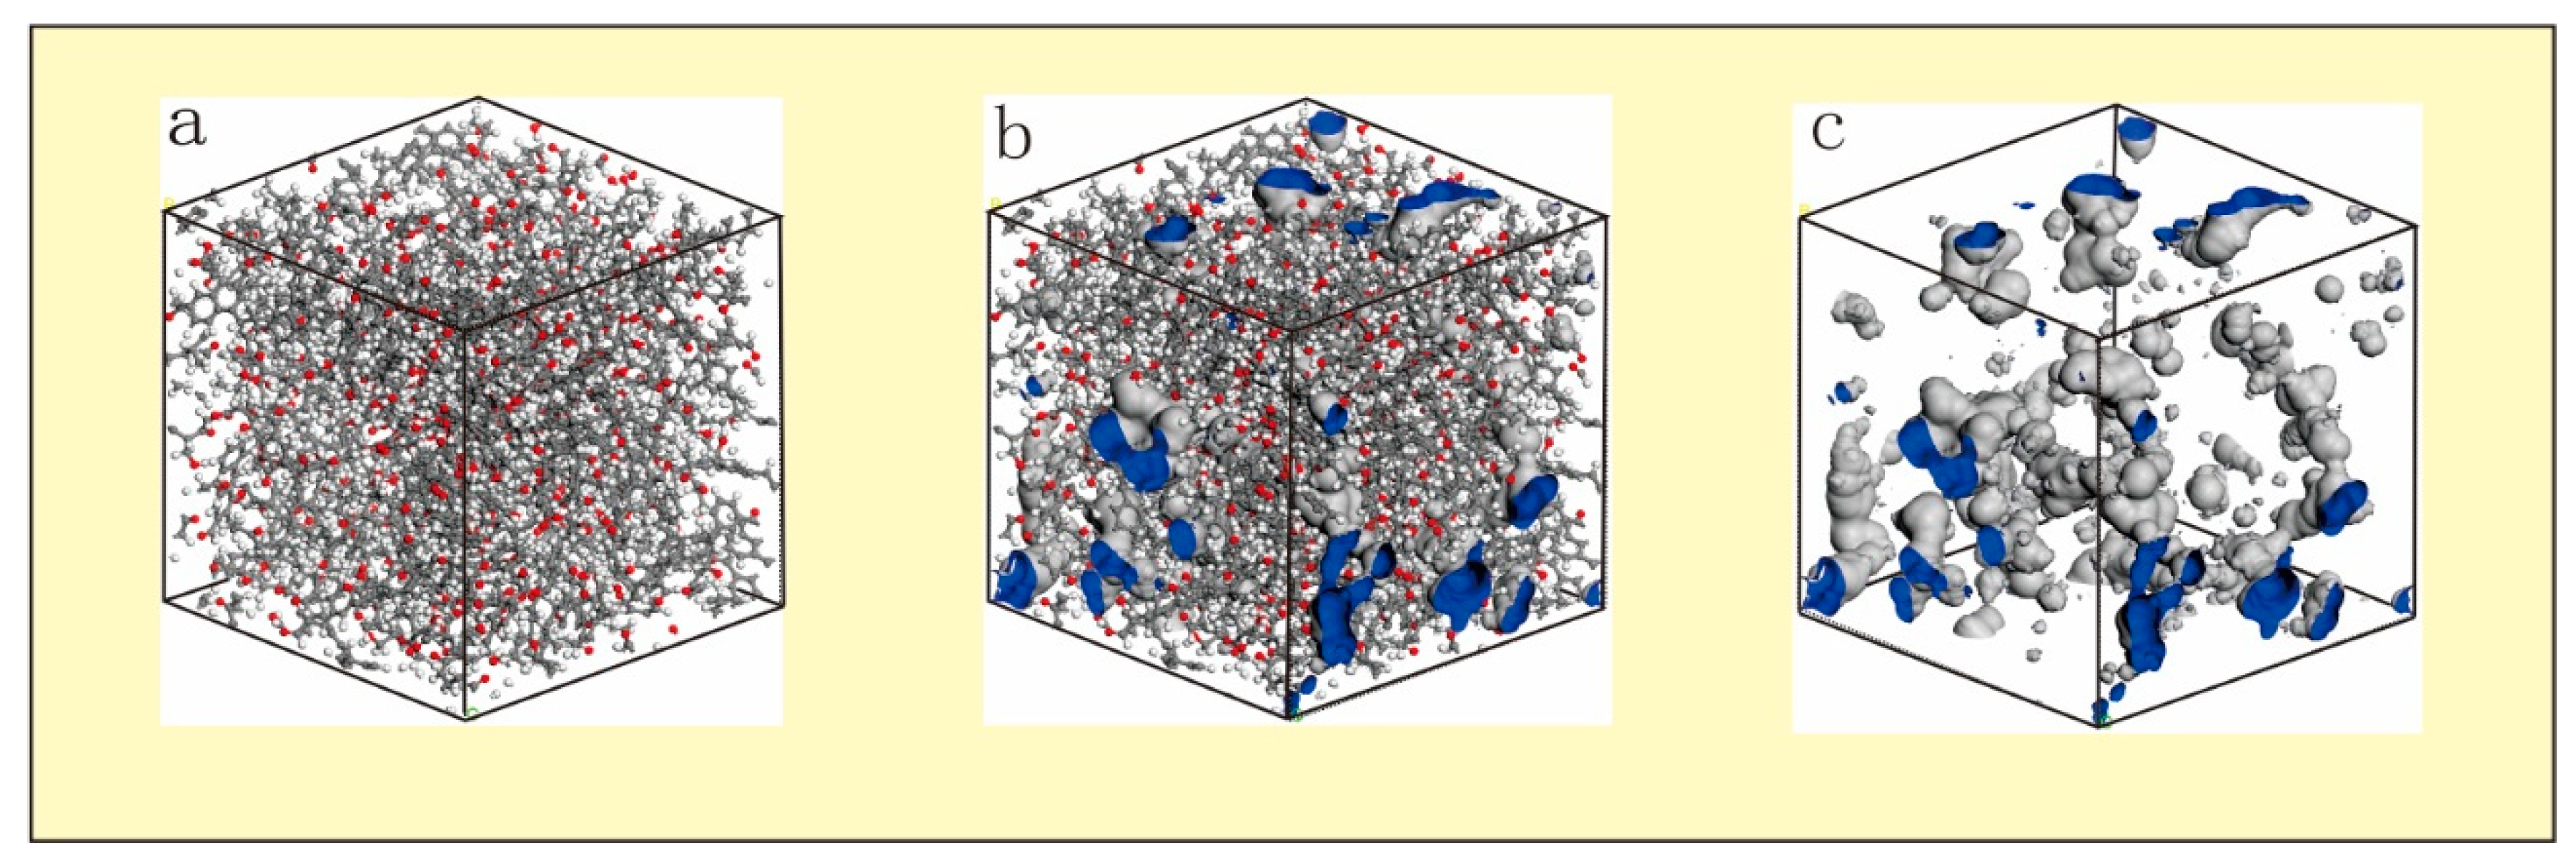
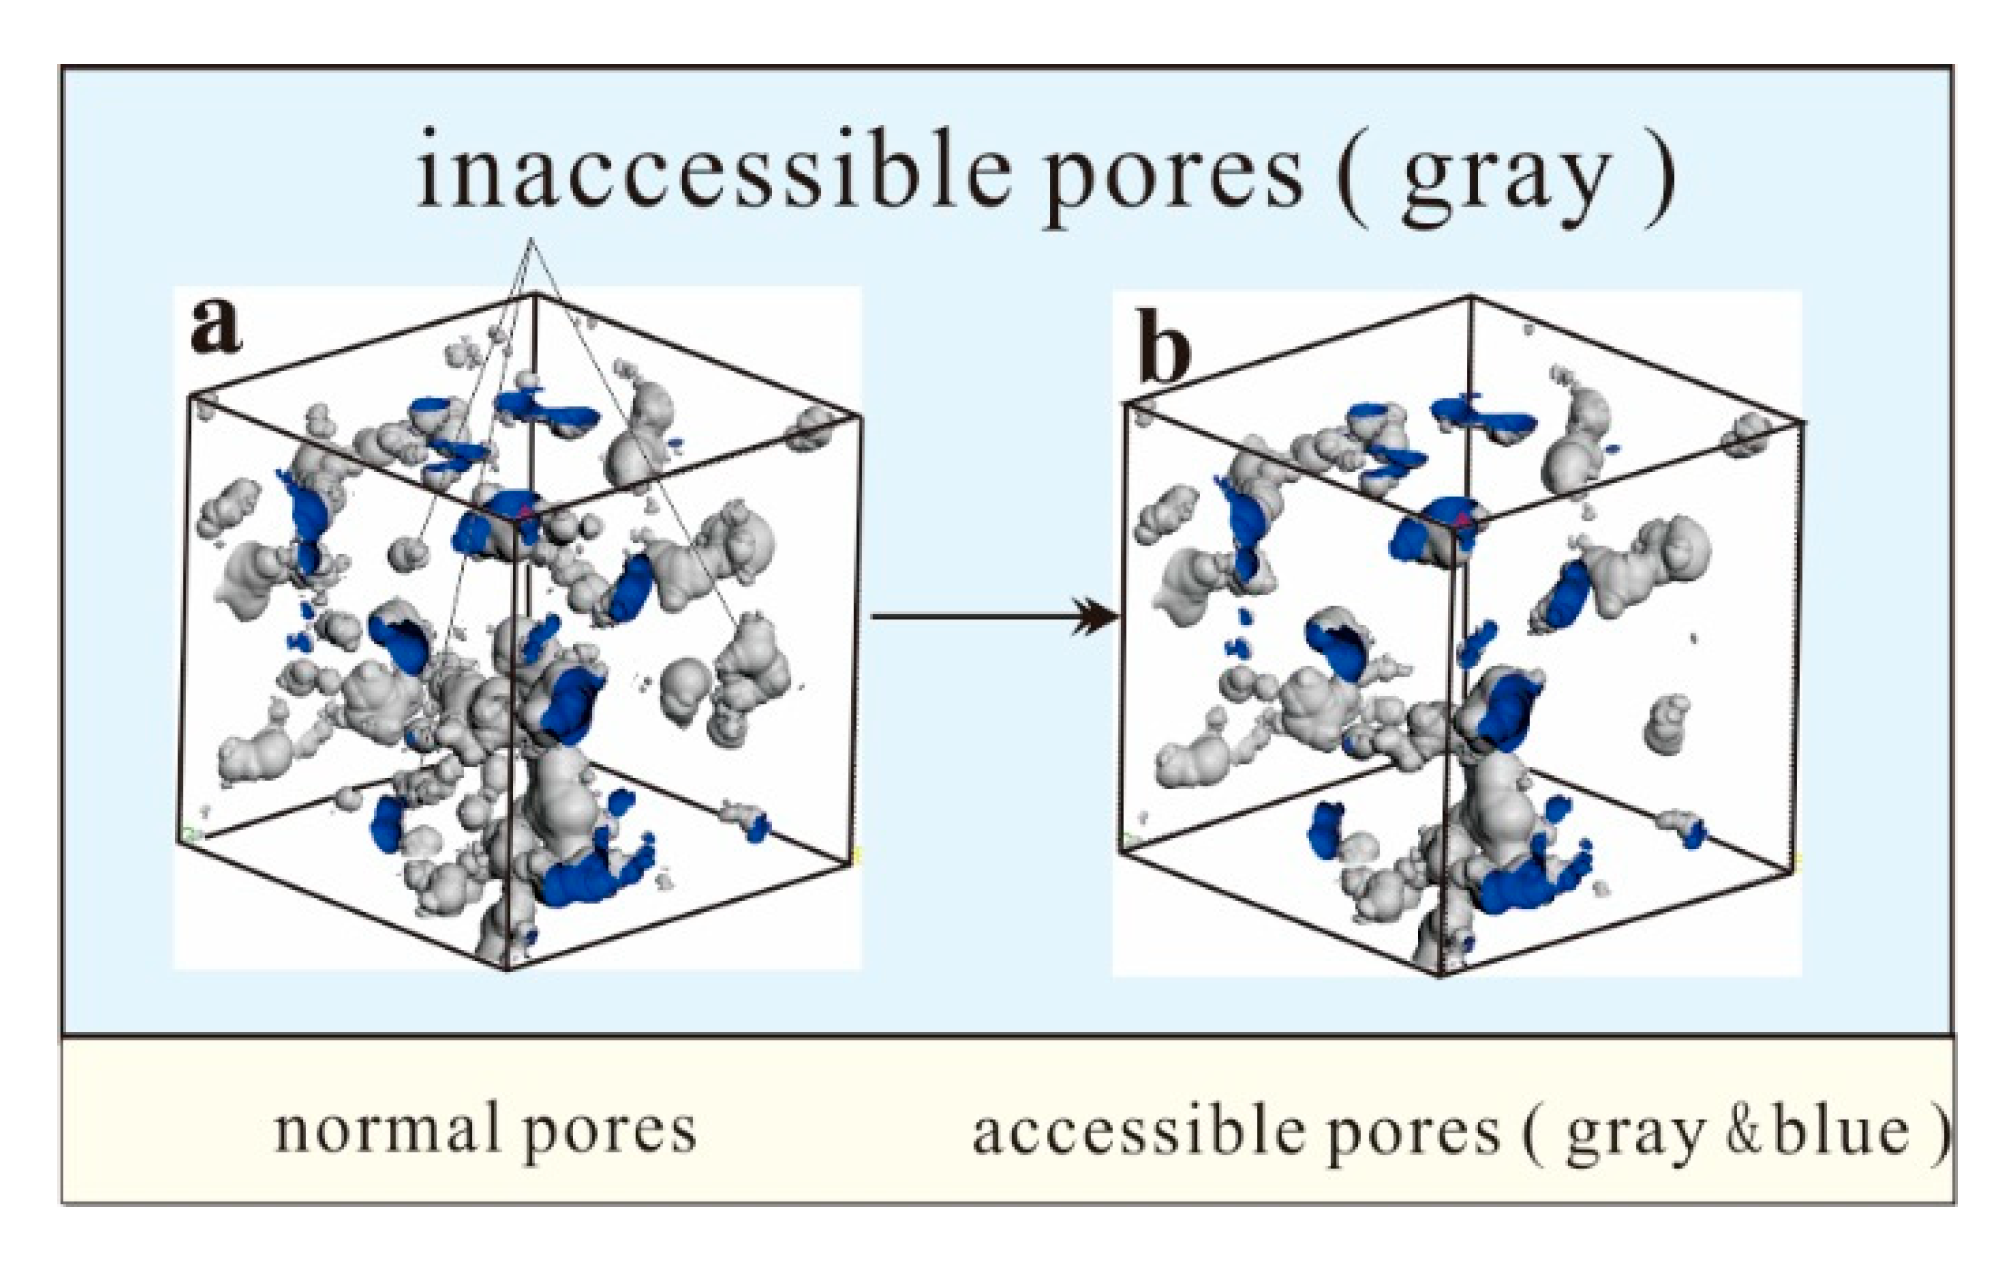
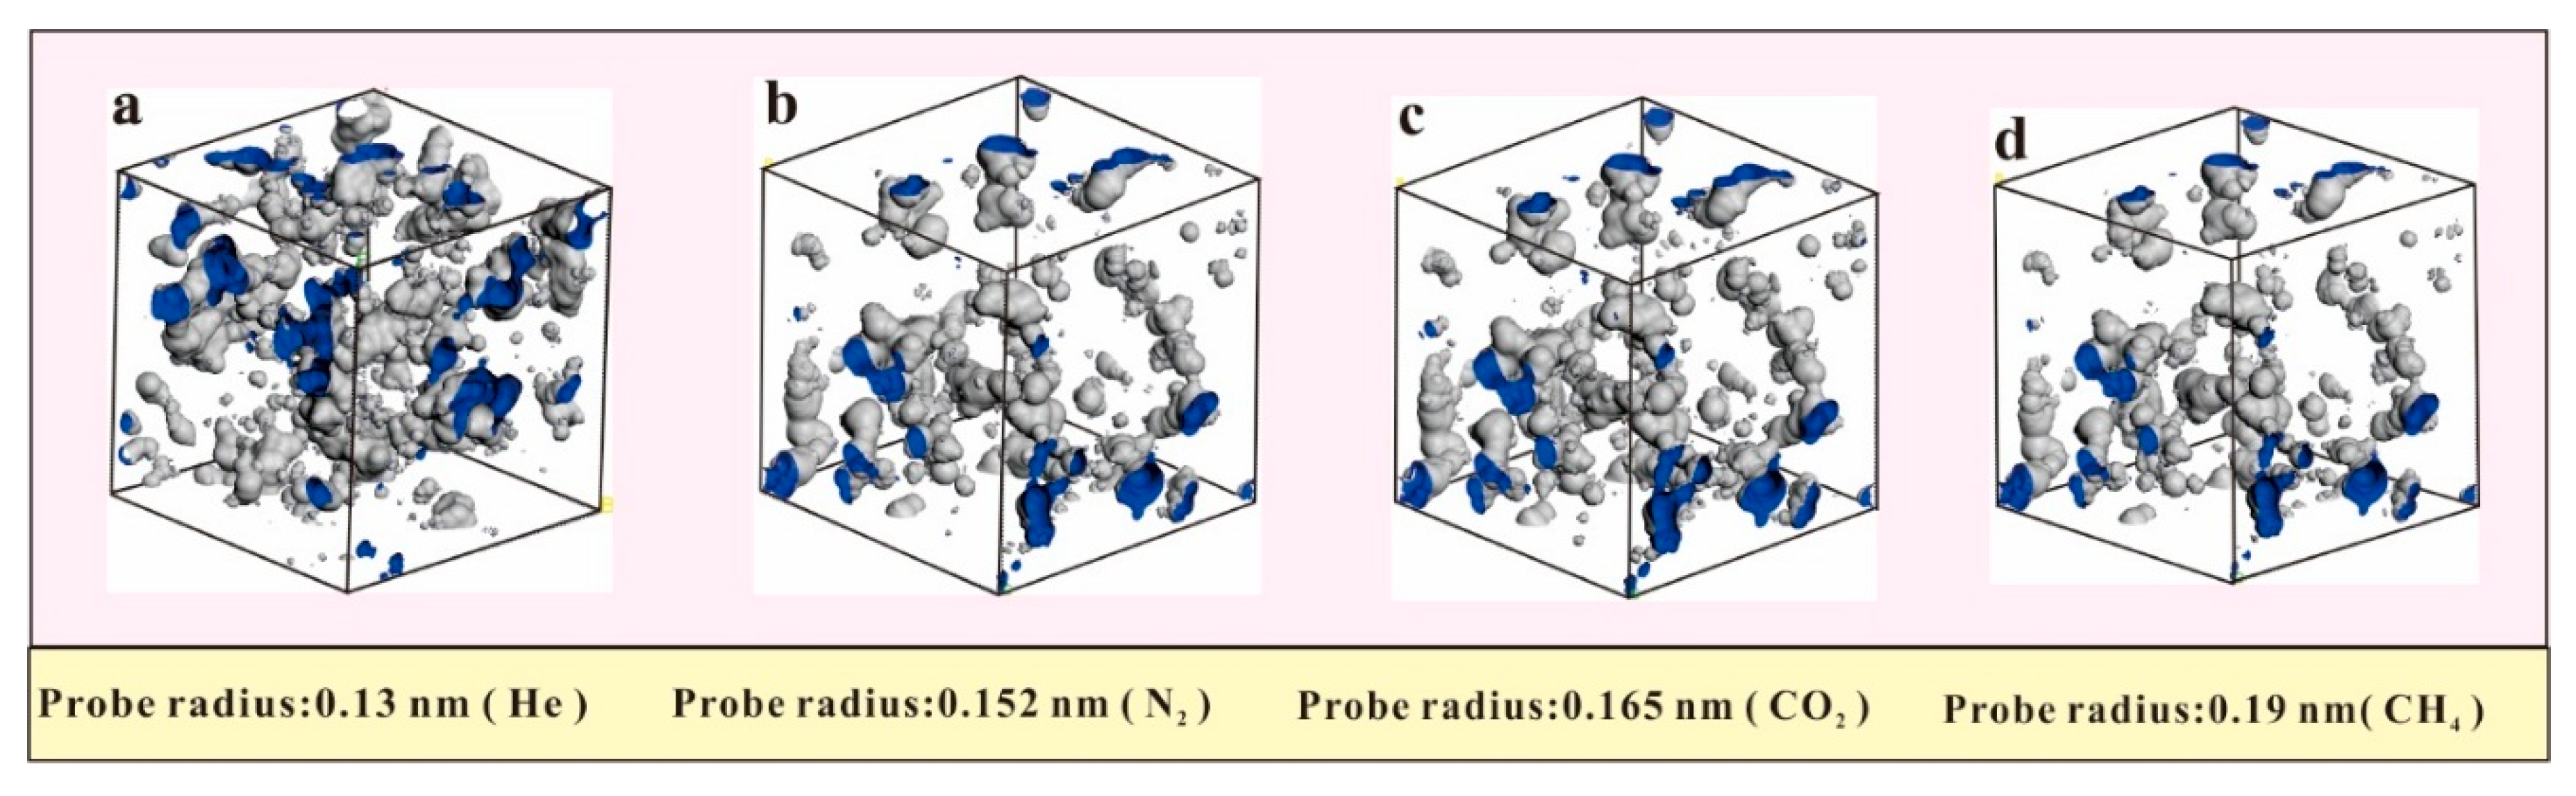
4.1. Pores in Coal Macromolecule

Previous studies have shown that the micropore volume and specific surface area account for a large proportion of the total pores, which is important for gas adsorption and diffusion [1]. Therefore, it is necessary to define the pores in the macromolecular structure. The same pores were measured using probe molecules with different radii, and the results were different. In gas adsorption studies, it is particularly important that the gas probe molecules detect the free pore volume. In this paper, each gas molecule operating as a probe molecule scanned the pores one by one (Figure 3). Different pore sizes of probe molecules could detect different pore volumes. Some spaces inside the pores were very small, which large-diameter probe molecules could not detect, and so part of the pore volume was ignored by the probe molecules. However, this part of the space system could be detected when a probe molecule with a smaller radius was used. The surface of the van der Waals surface detected in the macromolecular structure was the micropore surface, and the micropore volume and surface area information could be obtained by detecting the van der Waals surface in the macromolecular structure.
Taking the CO2 (R = 0.165 nm) probe molecule as an example, the sample pores were calculated (Figure 4). The pores in the macromolecular structure were formed by vacancies in the absence of atoms (Figure 4b). In general, the pore wall atoms were mainly composed of aliphatic side chains and a small amount of oxygen-containing functional groups. Part of the side chain of the sample had fallen off in this mid-rank coal, resulting in the formation of some oxygen-containing functional groups in the pore structure. Figure 4c shows that there were a large number of pores in the model with diverse and irregular shapes. Most were elliptic, and some pores were connected by several small pores to form a pore network, which provided an important channel for gas transport and desorption.
Different sizes of gas probe molecules can detect the pore surface area and volume. In the same pore space, the larger the probe molecule radius, the smaller the measured surface area is. If the pore inlet size is too small, the molecular probe with a diameter that is larger than the pore diameter cannot access the pore; however, the molecular probe with a diameter that is smaller than the pore diameter probe molecules can enter the pore (Figure 5). This results in differences in the detected pore volume. Therefore, according to different research purposes, appropriately sized probe molecules were selected.
There are two types of pores in the macromolecular structure. The first type is the accessible pores in Figure 5b, which means that gas can enter the pore from the outside; the other type is the inaccessible pores (the gray part of Figure 5a) which is mainly located inside the molecular structure. For an inaccessible pore, the atomic contact with the external environment does not occur, and the external gas cannot enter the pore. It is also difficult for gas molecules to enter such pores during an experiment.
The pores in the model were measured using He, N2, CO2, and CH4 probe molecules with radii of 0.13 nm, 0.152 nm, 0.165 nm, and 0.19 nm, respectively. The measured pore volumes were 0.053 mL/g, 0.039 mL/g, 0.03426 mL/g, and 0.026 mL/g, respectively. Figure 6 shows that the pore volumes measured by the different sizes of probe molecules vary greatly. As the molecular radius of helium gas is smaller than those of N2, CO2, and CH4, the pores that can be detected by helium gas may not be accessible to N2, CO2, and CH4, which means that helium gas has a stronger pore-measuring capacity. The pore volume measured by helium was approximately twice the pore volume of the pores measured by the CH4. As shown in Figure 6b,c, the pore morphology measured by N2 was roughly similar to that measured by CO2, except for some differences in the small pores. This phenomenon was because the CO2-detected pores were mostly detectable by N2, but that the CO2 molecules could not enter the smaller spaces at the edges. In the methane adsorption experiment, the helium gas volume was measured first, resulting in a difference in the calculation of the adsorption capacity. Therefore, selecting the appropriate size of the probe molecule in the simulations is an important prerequisite for accurately calculating the excess adsorption capacity.

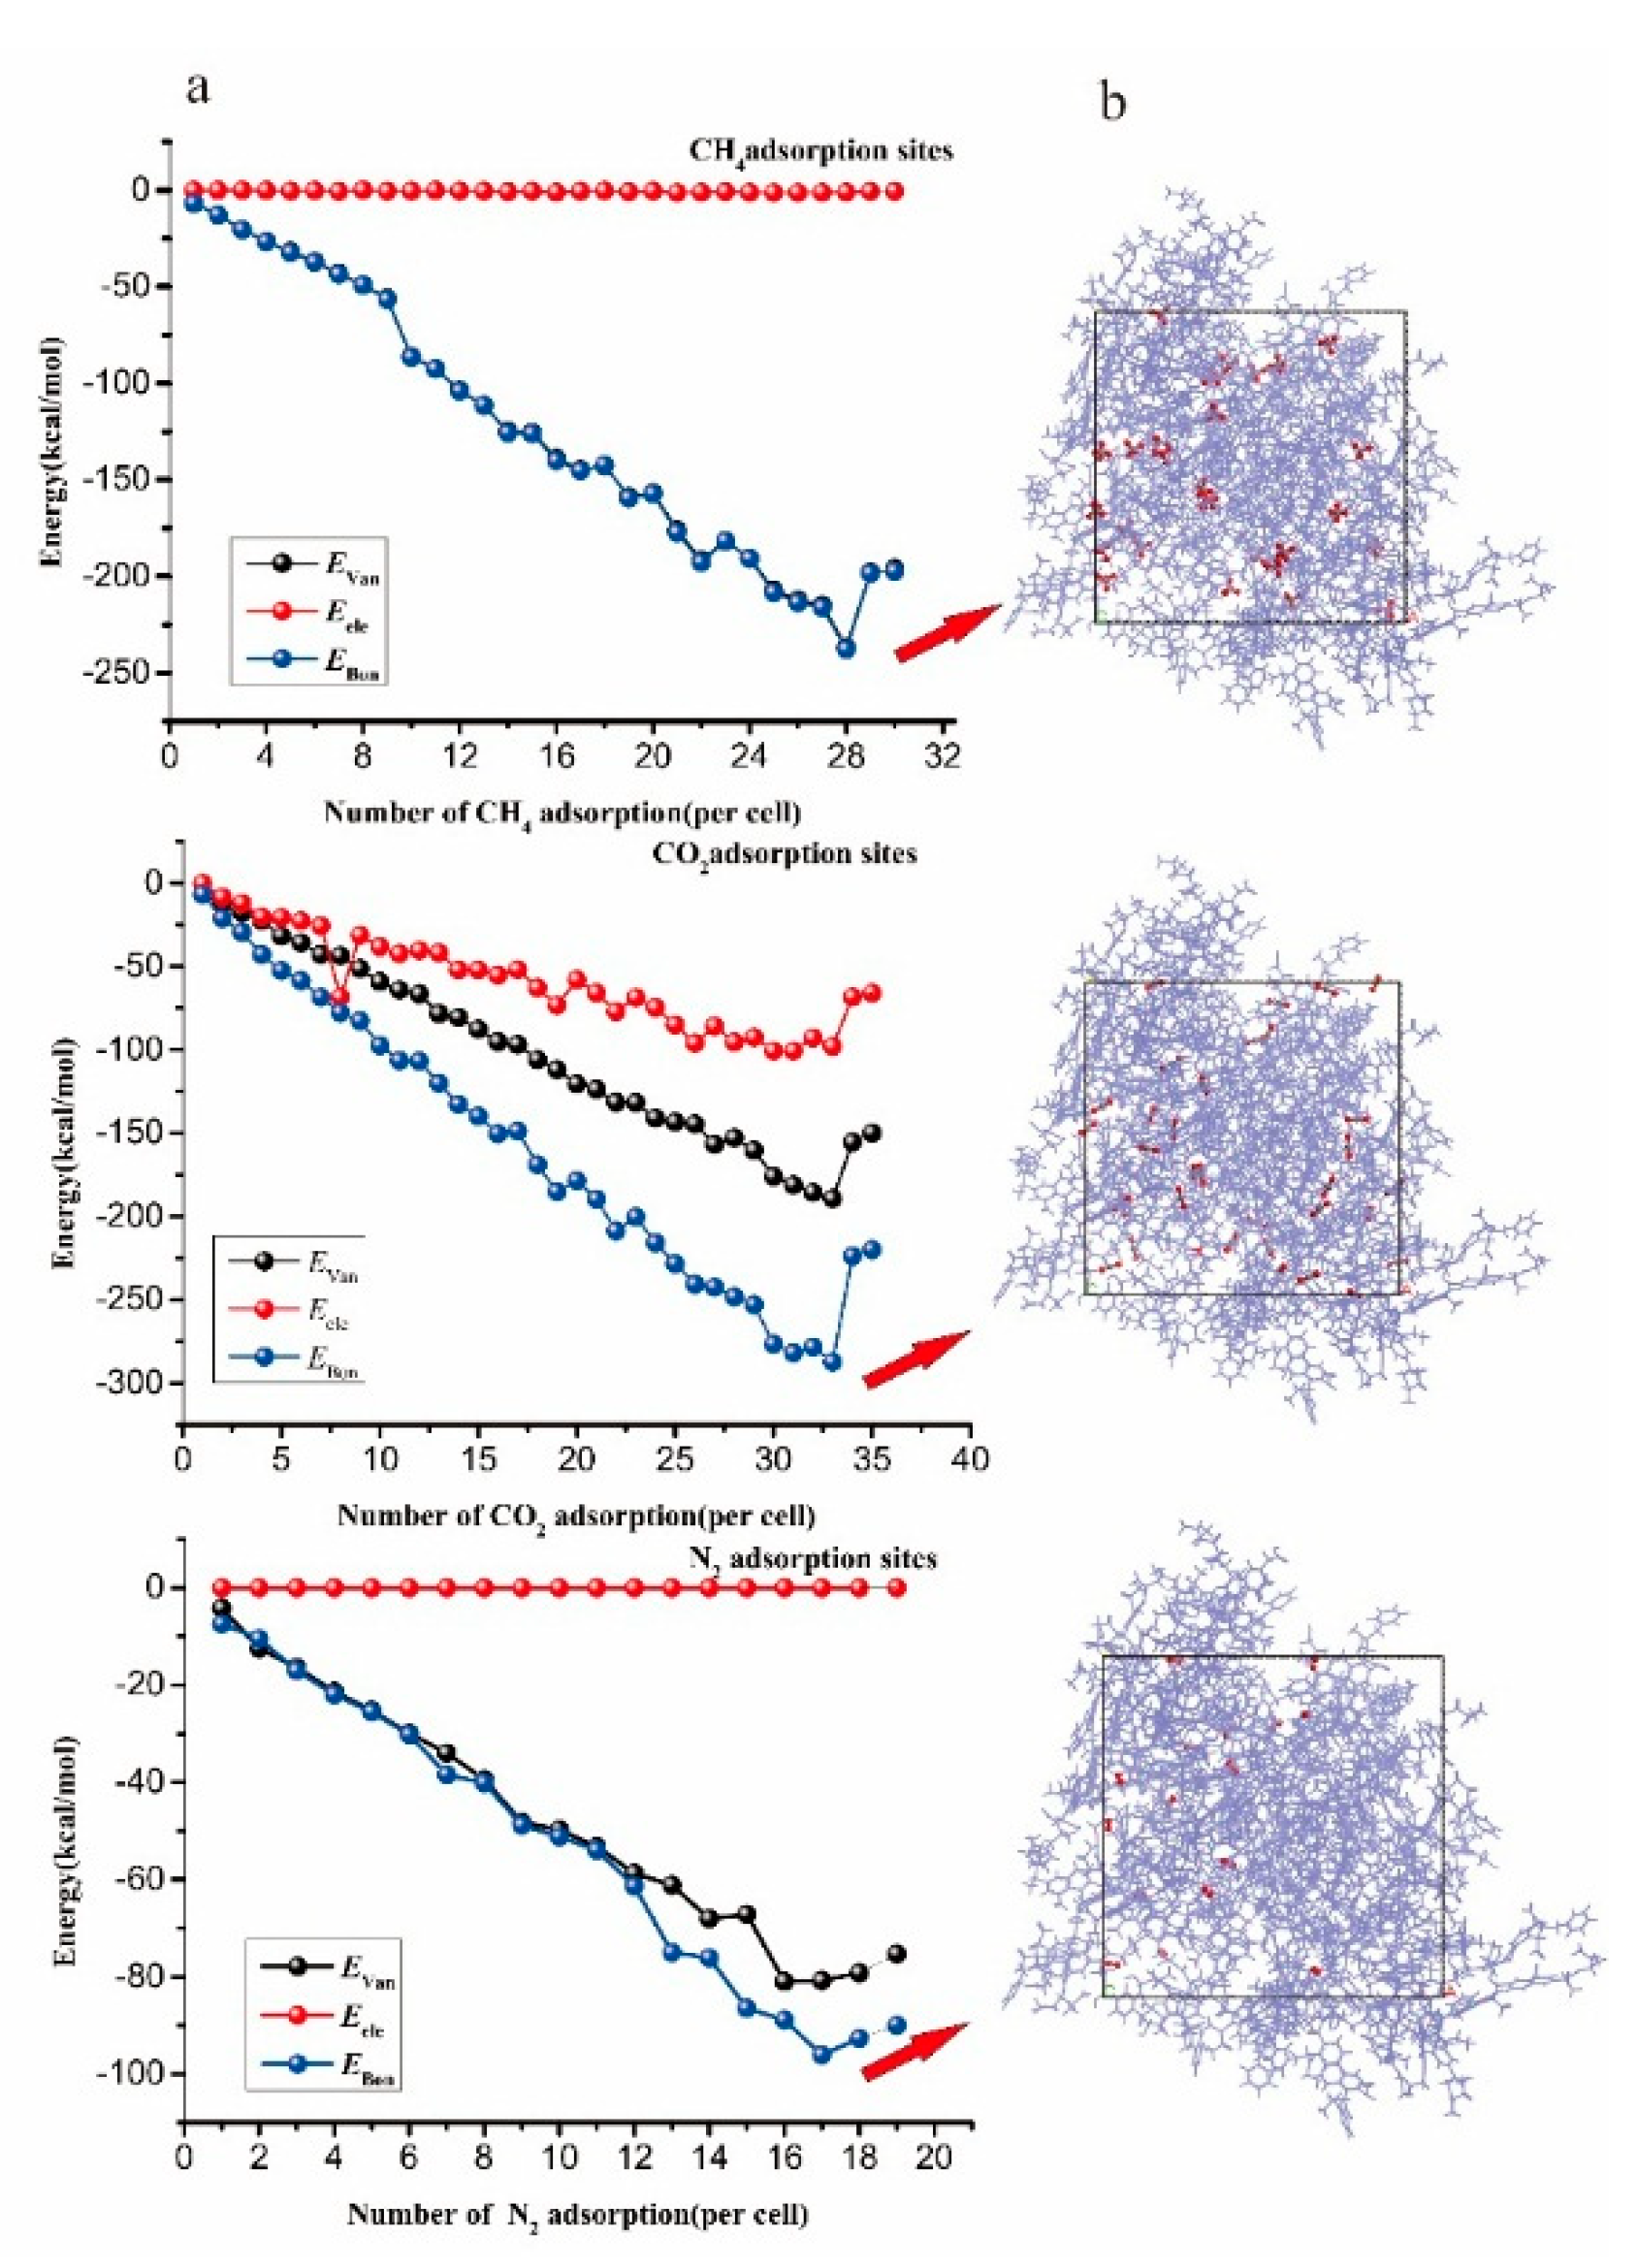
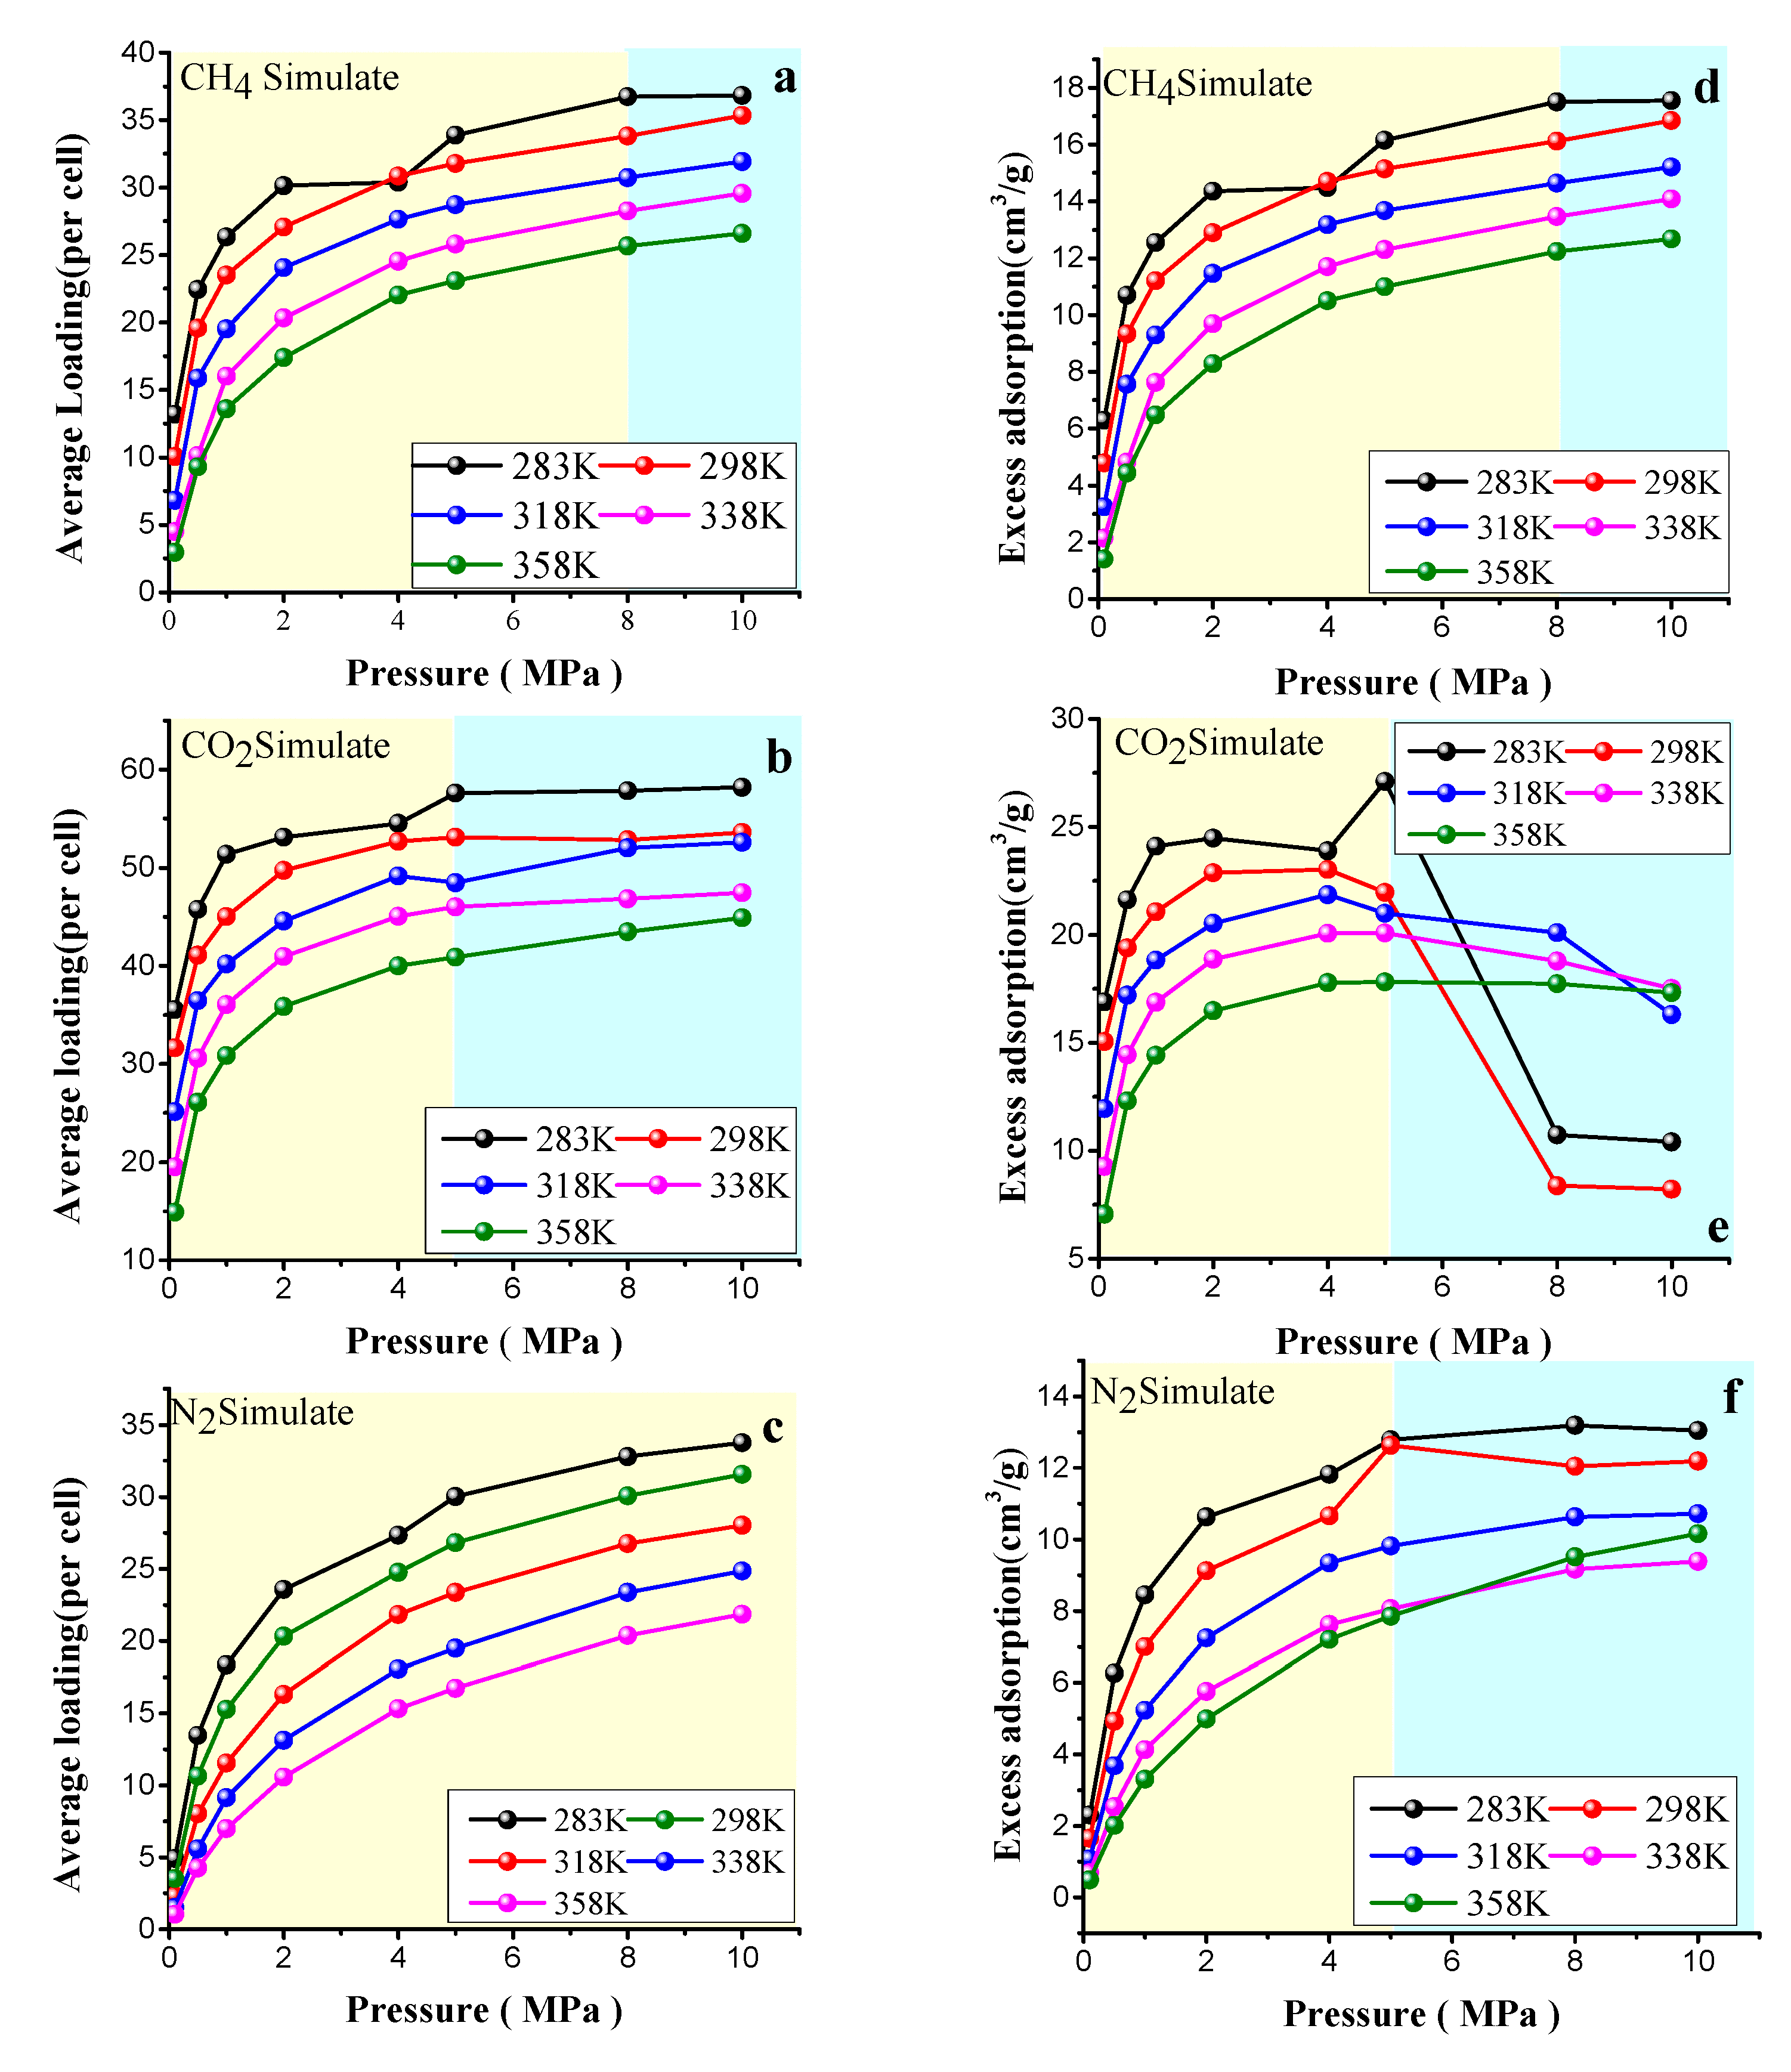
4.2. Adsorption Results

The energy changes and adsorption configurations for different amounts of CH4, CO2, and N2 are shown in Figure 7a. The Eele basically did not change with the increasing number of adsorption, while the interaction energy between the EVan and the Ebon decreased with the increasing number of the adsorbates, indicating that the vitrinite of coal attracted the adsorbates in this adsorption process. Then the Eele decreased, indicating that the vitrinite no longer attracted the adsorbates and began to exclude them. When Ebon reached the lowest value, the amount of adsorbate reached the maximum. The adsorption of vitrinite reaches the saturation state after adsorbing 28CH4, 33CO2, and 17N2 (Figure 7b), and the Ebon energies of the three gases reaching the maximum adsorption sites were 237.876, −287.417 kcal/mol, and −96.057 kcal/mol, respectively, indicating that the order of the adsorption capacity of the macromolecular structures for the three gases was CO2 > CH4 > N2. In addition, as shown in Figure 7b, the dominant adsorption sites occupied by CO2 covered the CH4/N2 sites, indicating that CO2 can compete with CH4 and N2 for adsorption by preferentially occupying the adsorption sites. The gas diffusion characteristics were studied by the molecular dynamics method, using the dominant adsorption sites for the three gases as the initial configuration.
Figure 8 shows the adsorption isotherm curves of the average loading per cell and excess adsorption capacity of CO2, CH4, and N2 under different temperature and pressure conditions. The average loading per cell refers to the number of gas molecules adsorbed by the 3D coal molecular structure unit constructed above. The adsorption capacity of CH4, CO2, and N2 decreased with increasing temperature, which is due to the adsorption behavior. During the exothermic process, the temperature rise increased the kinetic energy of the gas molecules, which increased the rate of movement, making it easier for gas molecules to escape the nucleus of the vitrinite, and thus the van der Waals function could be reduced. The adsorption capacity of CH4 and N2 increased with increasing pressure; specifically, the adsorption rate of CH4 and N2 increased rapidly when P < 5 MPa at the low-pressure stage. In the middle stage of the curve, the adsorption capacity increased slowly for P > 6 MPa until P < 8 MPa. When P > 8 MPa at the high-pressure stage, the adsorption curves of the two groups tended to be stable and reached the saturated adsorption state at this time, regardless of whether the average loading per unit or the excess adsorption capacity was larger for CH4 and N2 at the same temperature or pressure. Compared with CH4 and N2, CO2 has more preferential adsorption characteristics, which is consistent with the above simulation results for the saturated adsorption sites. This finding is closely related to the difference in the interaction between each gas and the coal molecular structure and the molecular dynamics diameter and polarity. Compared with the excess adsorption of CH4 and N2, the change of excess adsorption capacity of CO2 was different. Under the low pressure, the excess adsorption capacity showed an increasing trend. When the pressure was larger than 5 MPa, the excess adsorption capacity reached its maximum and began to decrease. This is due to the excess adsorption capacity of CO2 being related to the pore volume. Under high pressure, the volume phase was still compressed, the pores are filled up, and the density of the adsorbed phase leveled off. Once the bulk phase density was higher than the adsorbed phase density, the excess adsorption capacity showed a decreasing trend.
A comparison of the CH4 adsorption simulation at 298K and experimental data [28] at 303.15 K is shown in Figure 9. Overall, the simulation results are consistent with the general trend of the experimental data changes with increasing pressure, and the adsorption capacity reached a maximum when the pressure reached the saturation pressure value. The maximum value of the simulated adsorption was slightly smaller than the experimental value. When P < 5 MPa, the simulated values of the adsorption capacity and adsorption rate were significantly higher than the experimental values. When P > 5 MPa, the relative differences of the two variables gradually decreased, and the difference was the smallest when the maximum adsorption capacity was reached. The simulated maximum adsorption capacity was 13.75 cm3/g, and the experimental value was 14.78 cm3/g. There are many reasons for the difference at the low-pressure stage. Firstly, the experimental sample may have contained ash and other mineral components inside the components of the hand-selected vitrinite group. Compared with the pure organic matter vitrinite, the macromolecular structure model constructed in this paper had a relatively low adsorption capacity. The presence of inorganic mineral components may have hindered the adsorption process. The smaller difference under high-pressure conditions may be because that the adsorption of minerals and ash is more obvious under low- pressure conditions, and the adsorption is not exerted under high-pressure conditions, while the adsorption of vitrinite plays a dominant role. Secondly, the model mainly simulates the micropore structure in the vitrinite macromolecular structure, and does not consider the structure of mesopores and macropores while the experimental sample contained both micropores, mesopores, and macropores structures. Since the adsorption mainly occurs in the micropores structure under low-pressure conditions, the micropore filling effect occurs in a short time, so the simulated value relative to the experimental adsorption capacity was more notable under low-pressure conditions. Finally, in this paper, in order to calculate more realistically and effectively and obtain the excess adsorption capacity, we selected the appropriate gas as the probe molecule to measure the free pore volume. For example, the free pore volume of CH4 was measured by a CH4 (r = 0.13 nm) molecular probe. However, in the experimental process, helium gas (r = 0.19 nm) was selected as the probe molecule to measure the free pore volume, which meant that the free pore volume measured relative to the gas molecules was small, resulting in relatively small differences in the experimental and calculated values.

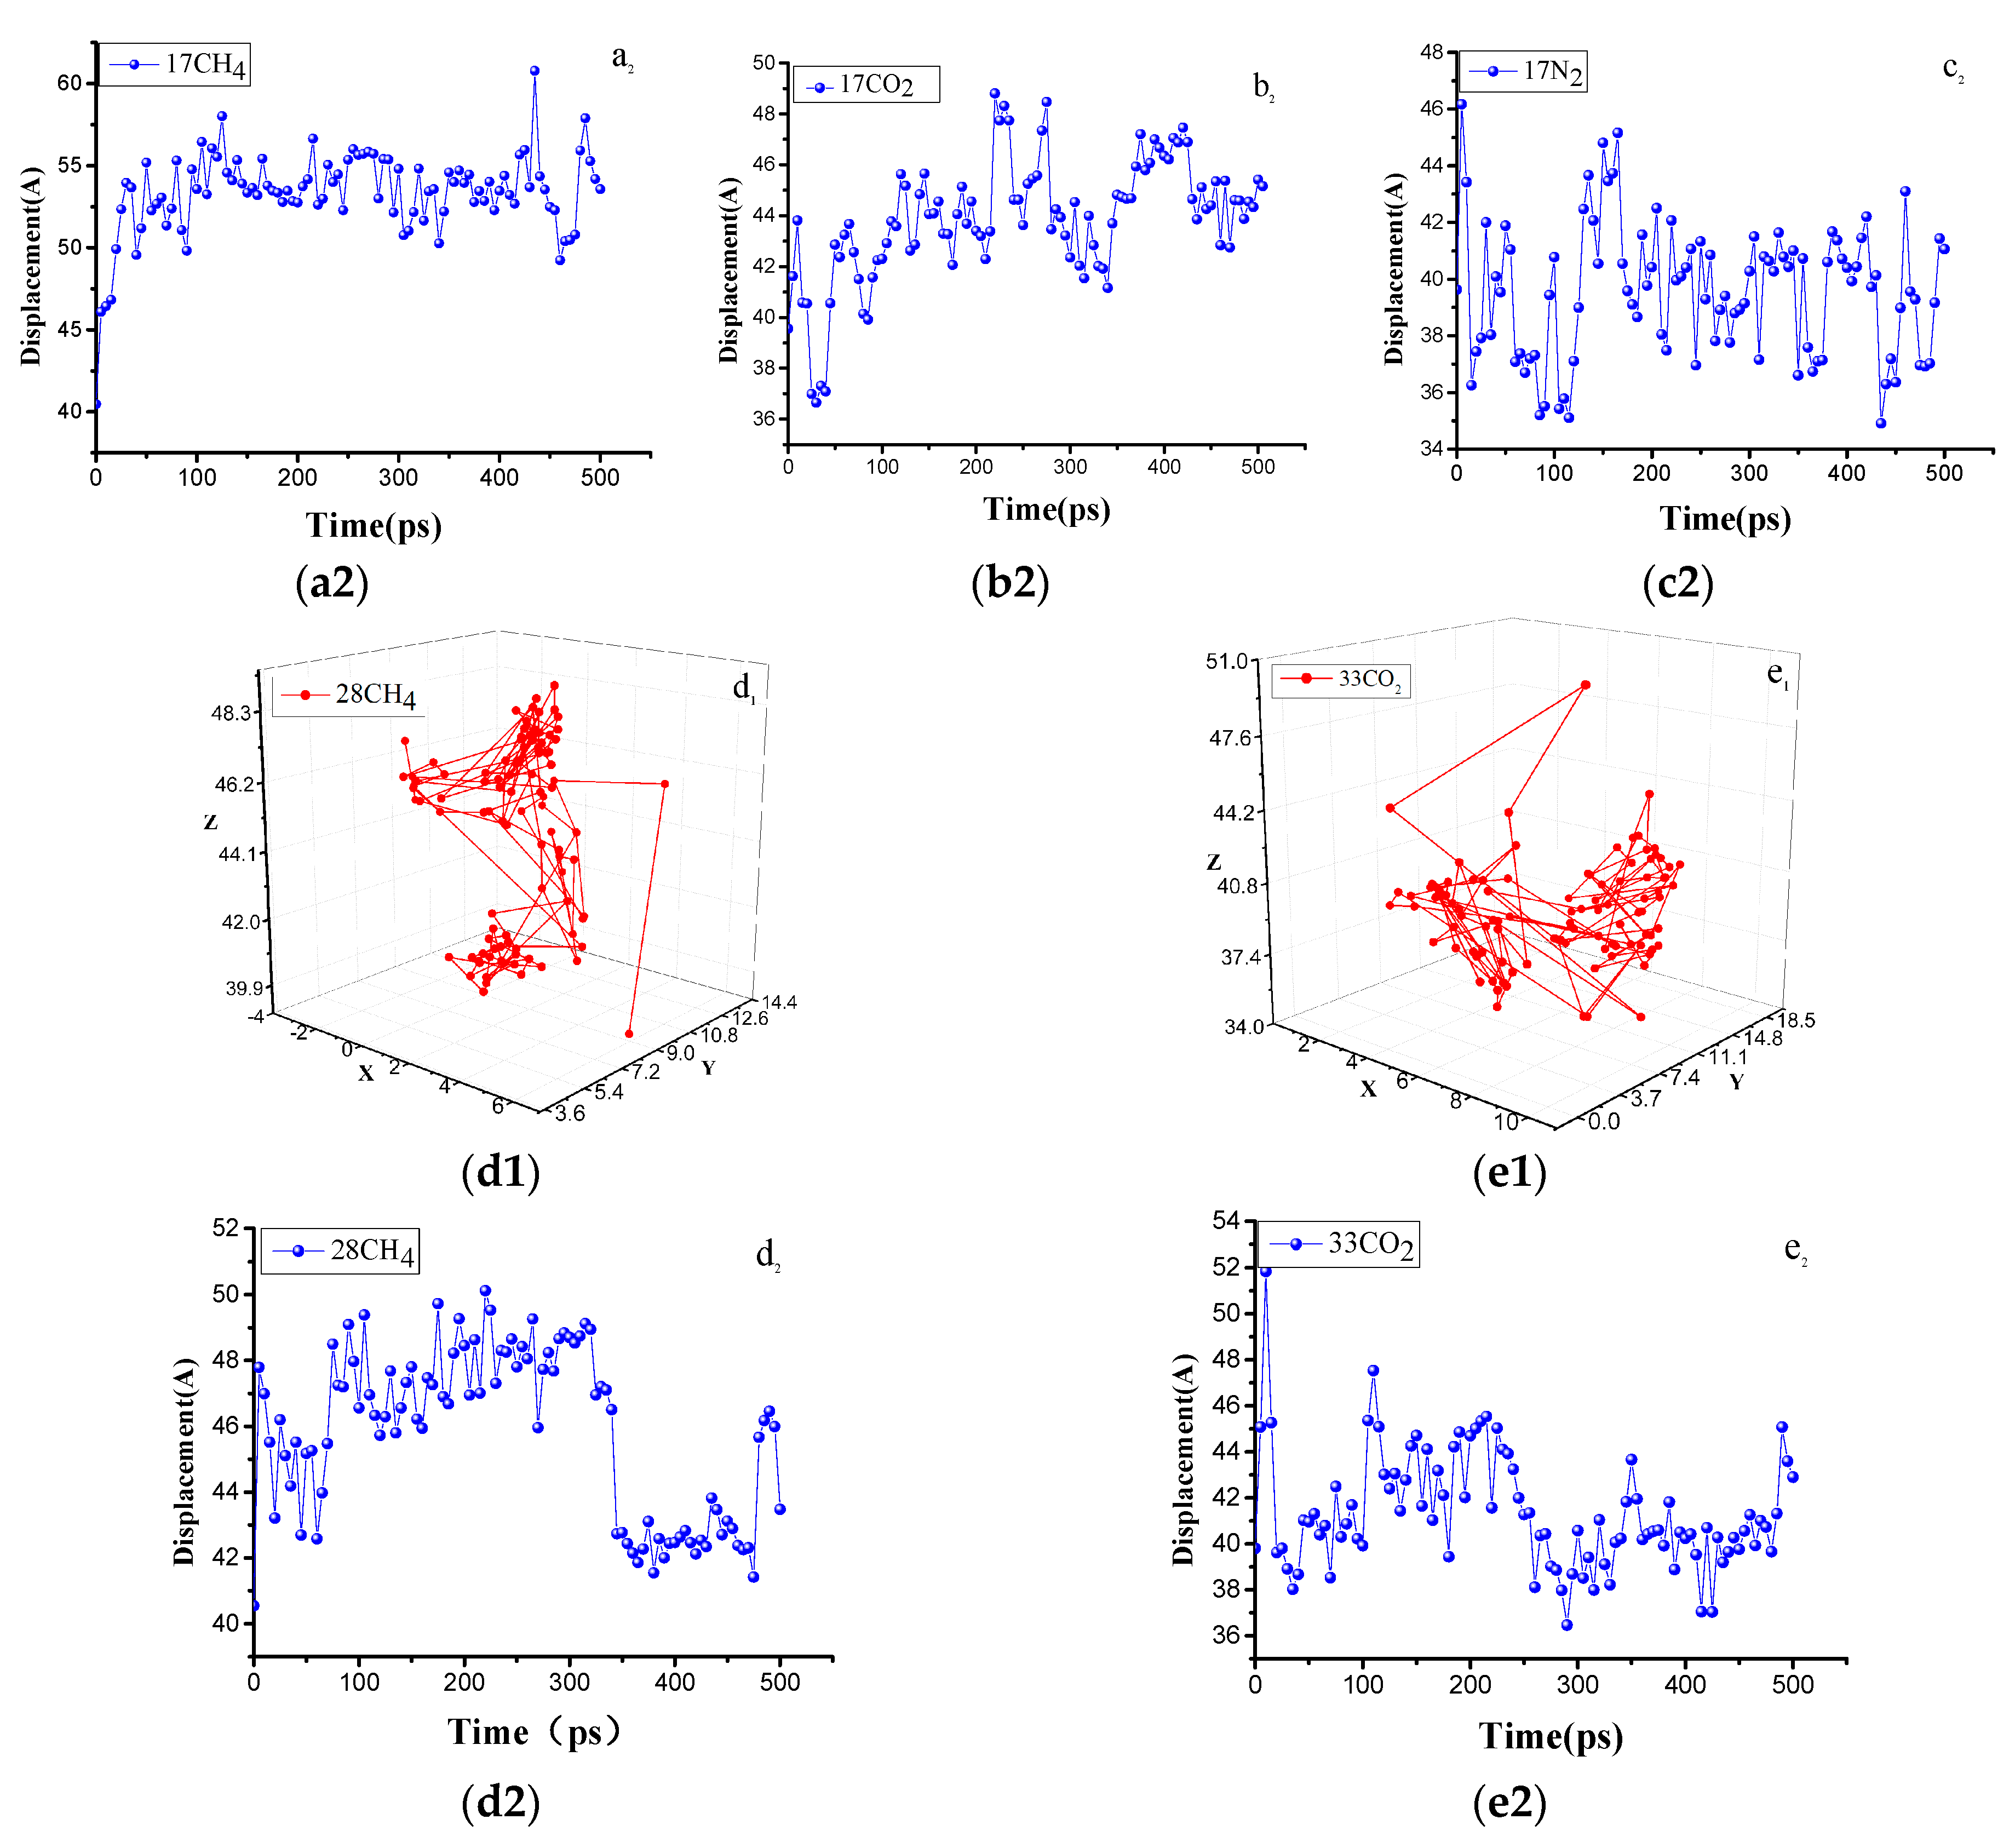
4.3. Self-, Corrected, and Transport Diffusion Coefficients

Transport diffusion means that the attenuation of the mass transport and density fluctuations in the system occurs more macroscopically than that of self-diffusion, and transport diffusion is more closely related to the application of modern technology and engineering. An increasing number of scholars have paid attention to transport diffusion [22]. To investigate the influence of different concentrations of adsorbed gas on the diffusion behavior under saturated conditions, CH4 and CO2 were taken as the control group with the same number of dominant saturated adsorption sites of N2. The gas diffusion coefficients were obtained by molecular dynamics simulations and compared with the diffusion experimental values using the same coal rank, temperature, and pressure in the paper of Saghafi. The result indicates that CH4 and CO2 were relatively close to the experimental values in the literature.
The diffusion coefficients of CO2, CH4, and N2 simulated by Song et al. [11] in low-rank coal vitrinite molecules were 27.83–79.56 × 10⁻¹¹, 16.23–38.45 × 10⁻¹¹, and 42.37–86.45 × 10⁻¹¹ m2/s, respectively. Zhao et al. [12] obtained the diffusion coefficients of CO2 and CH4 based on the Wiser coal molecular simulations, which were 77.3 × 10⁻¹¹ m2/s and 36.3 × 10⁻¹¹ m2/s, respectively. However, these values are much smaller than those found by Hu et al. [36] based on the Wiser coal molecular model; they obtained CO2 and CH4 diffusion coefficients of 1.2 × 10⁻⁹ and 1.0 × 10⁻⁹ m2/s, respectively. The reasons for the difference mainly include two aspects. On the one hand, based on the different coal molecular models, there was a large difference in the number ratio of the oxygen-containing functional groups and aliphatic side chains. Previous studies have shown that different types of chemical groups have complex effects on the gas adsorption capacity, which is mainly related to the interaction between the groups and gases and the distribution of the groups in space. A study by Yu et al. [1], based on the slite pore model, found that the order of the adsorption capacity of the groups was aromatic ring > aliphatic side chain > carboxyl group > hydroxyl group when adsorbing a single methane molecule, but this provided more gas when the carboxyl group and the hydroxyl group formed the pore wall atoms. At this point, the adsorption capacity was greater than those of the aromatic ring and methyl group. Therefore, the difference in the number of chemical groups in each model is the main reason for the difference in the simulated diffusion results. On the other hand, the different force field selections and parameter settings in the simulations will also lead to large differences in the simulation results, as reported by Song et al. [11], who based their work on the Dreiding force field, and by Hu et al. [36], who used the Compass II force field. In molecular dynamics, the self-diffusion requires a long simulation time to ensure a stable linear relationship between MSD and time. Therefore, the length of the simulation will also cause a difference in the results. In this paper, the simulation time was 500 ps for accurate calculation results.
As summarized in Table 2, the diffusion coefficients of CO2, CH4, and N2 were ordered as DS < Dc < Dt, indicating that the diffusion capacity increases with an increasing observation scale from the microscale to the macroscale, in which the diffusion coefficient decreases with the increase in adsorption capacity, indicating that the increase in gas concentration is not conducive to diffusion. The increase in concentration corresponds to a high pressure and high gas density, and the intermolecular force is enhanced to hinder the tendency of gas to diffuse out of the pore. In the saturated adsorption state, the self–diffusion and transport diffusion were both ordered as N2 > CO2 > CH4. However, when there were 17 adsorption sites, the order was DS(N2) > DSCO2) > DS(CH4) and Dt(CO2) > Dt(N2) > Dt(CH4), respectively, which are opposite to the order of the gas molecular dynamics diameter, namely σ CH4 (0.38 nm) > σ N2 (0.36 nm) > σ CO2 (0.33 nm). The molecular dynamics diameter is a sensitive measure of the ability to move in a highly restricted environment [40]. CH4 cannot enter pores with pore diameters smaller than 0.38 nm, while CO2 can enter and exit. The smaller the kinetic diameter is, the wider the range of the pore diameter is. In addition to the difference in diameter, this phenomenon is related to the tensile morphology of gas molecules. CO2 is smaller and more linear than CH4 and is more accessible to the restricted pore space volume. Figure 10 shows the difference in the adsorption sites of the five CO2, CH4, and N2 adsorbed molecules configurations in the model. As shown in Figure 10a–c, when the three gases existed individually, CO2 was distributed in the narrow pore throats according to the linear dominance, and the CH4 tetrahedral structure was distributed in the interior of the large voids; N2 may have been distributed in the interior of the small pores due to its triple bond form. As shown in Figure 10d–f, when CH4 and CO2 were in the same pore, CO2 was closer to the pore throat position, and CH4 was inside the pore. When N2 and CO2 were in the same pore, CO2 was closer to the pore throat position, and N2 was distributed in the pores. The molecular dynamics diameter and morphology were important factors affecting adsorption and diffusion. In addition, Larsen [41] proposed another theory whereby the CO2 adsorption isotope is greater than that of nonpolar hydrocarbons, such as CH4, which is responsible for the faster diffusion of CO2 in coal.
Einstein’s diffusion law can be used to determine the migration path of molecules in the different micropores by the diffusion trajectory of a single gas molecule, which can clearly discriminate the diffusion path and displacement of gas molecules from one pore to another. The gas molecules are constantly moving inside the coal molecules. In most cases, small-amplitude vibrations occur in the pores. When the gas molecule vibrates to a certain position in the pores, the molecular structure of the vitrinite is twisted or moved, and the gas molecule is directed to the other pores. Jumping provides a channel and again results in a small amplitude vibration in the other aperture. The diffusion trajectories and displacements of the five stable configurations of CO2, CH4, and N2 are shown in Figure 11. As shown by the comparison of Figure 11a–c, when the capacity of the adsorbed gas was constant, the displacement change intensity was ordered as N2 > CO2 > CH4, and the simulated jump time between 0 and 50 ps was because the system energy that had not been completely stabilized. When N2 shifted within 100 ps, a cross-pore jump occurred, and the CO2 and CH4 cross-pore movement points appeared at 200 and 450 ps, respectively, which are consistent with the calculation results listed in Table 2 above. As shown in Figure 11d, the contrast between e and a, b, and c increased with the increase in the concentration of the adsorbed gas, and the vibration amplitude of the gas decreased significantly. The time of the large-jump point was shortened. It should be noted that the large-jump point at this time was not the cross-pore jump. Instead, relatively large-amplitude vibrations occurred in the same pore.

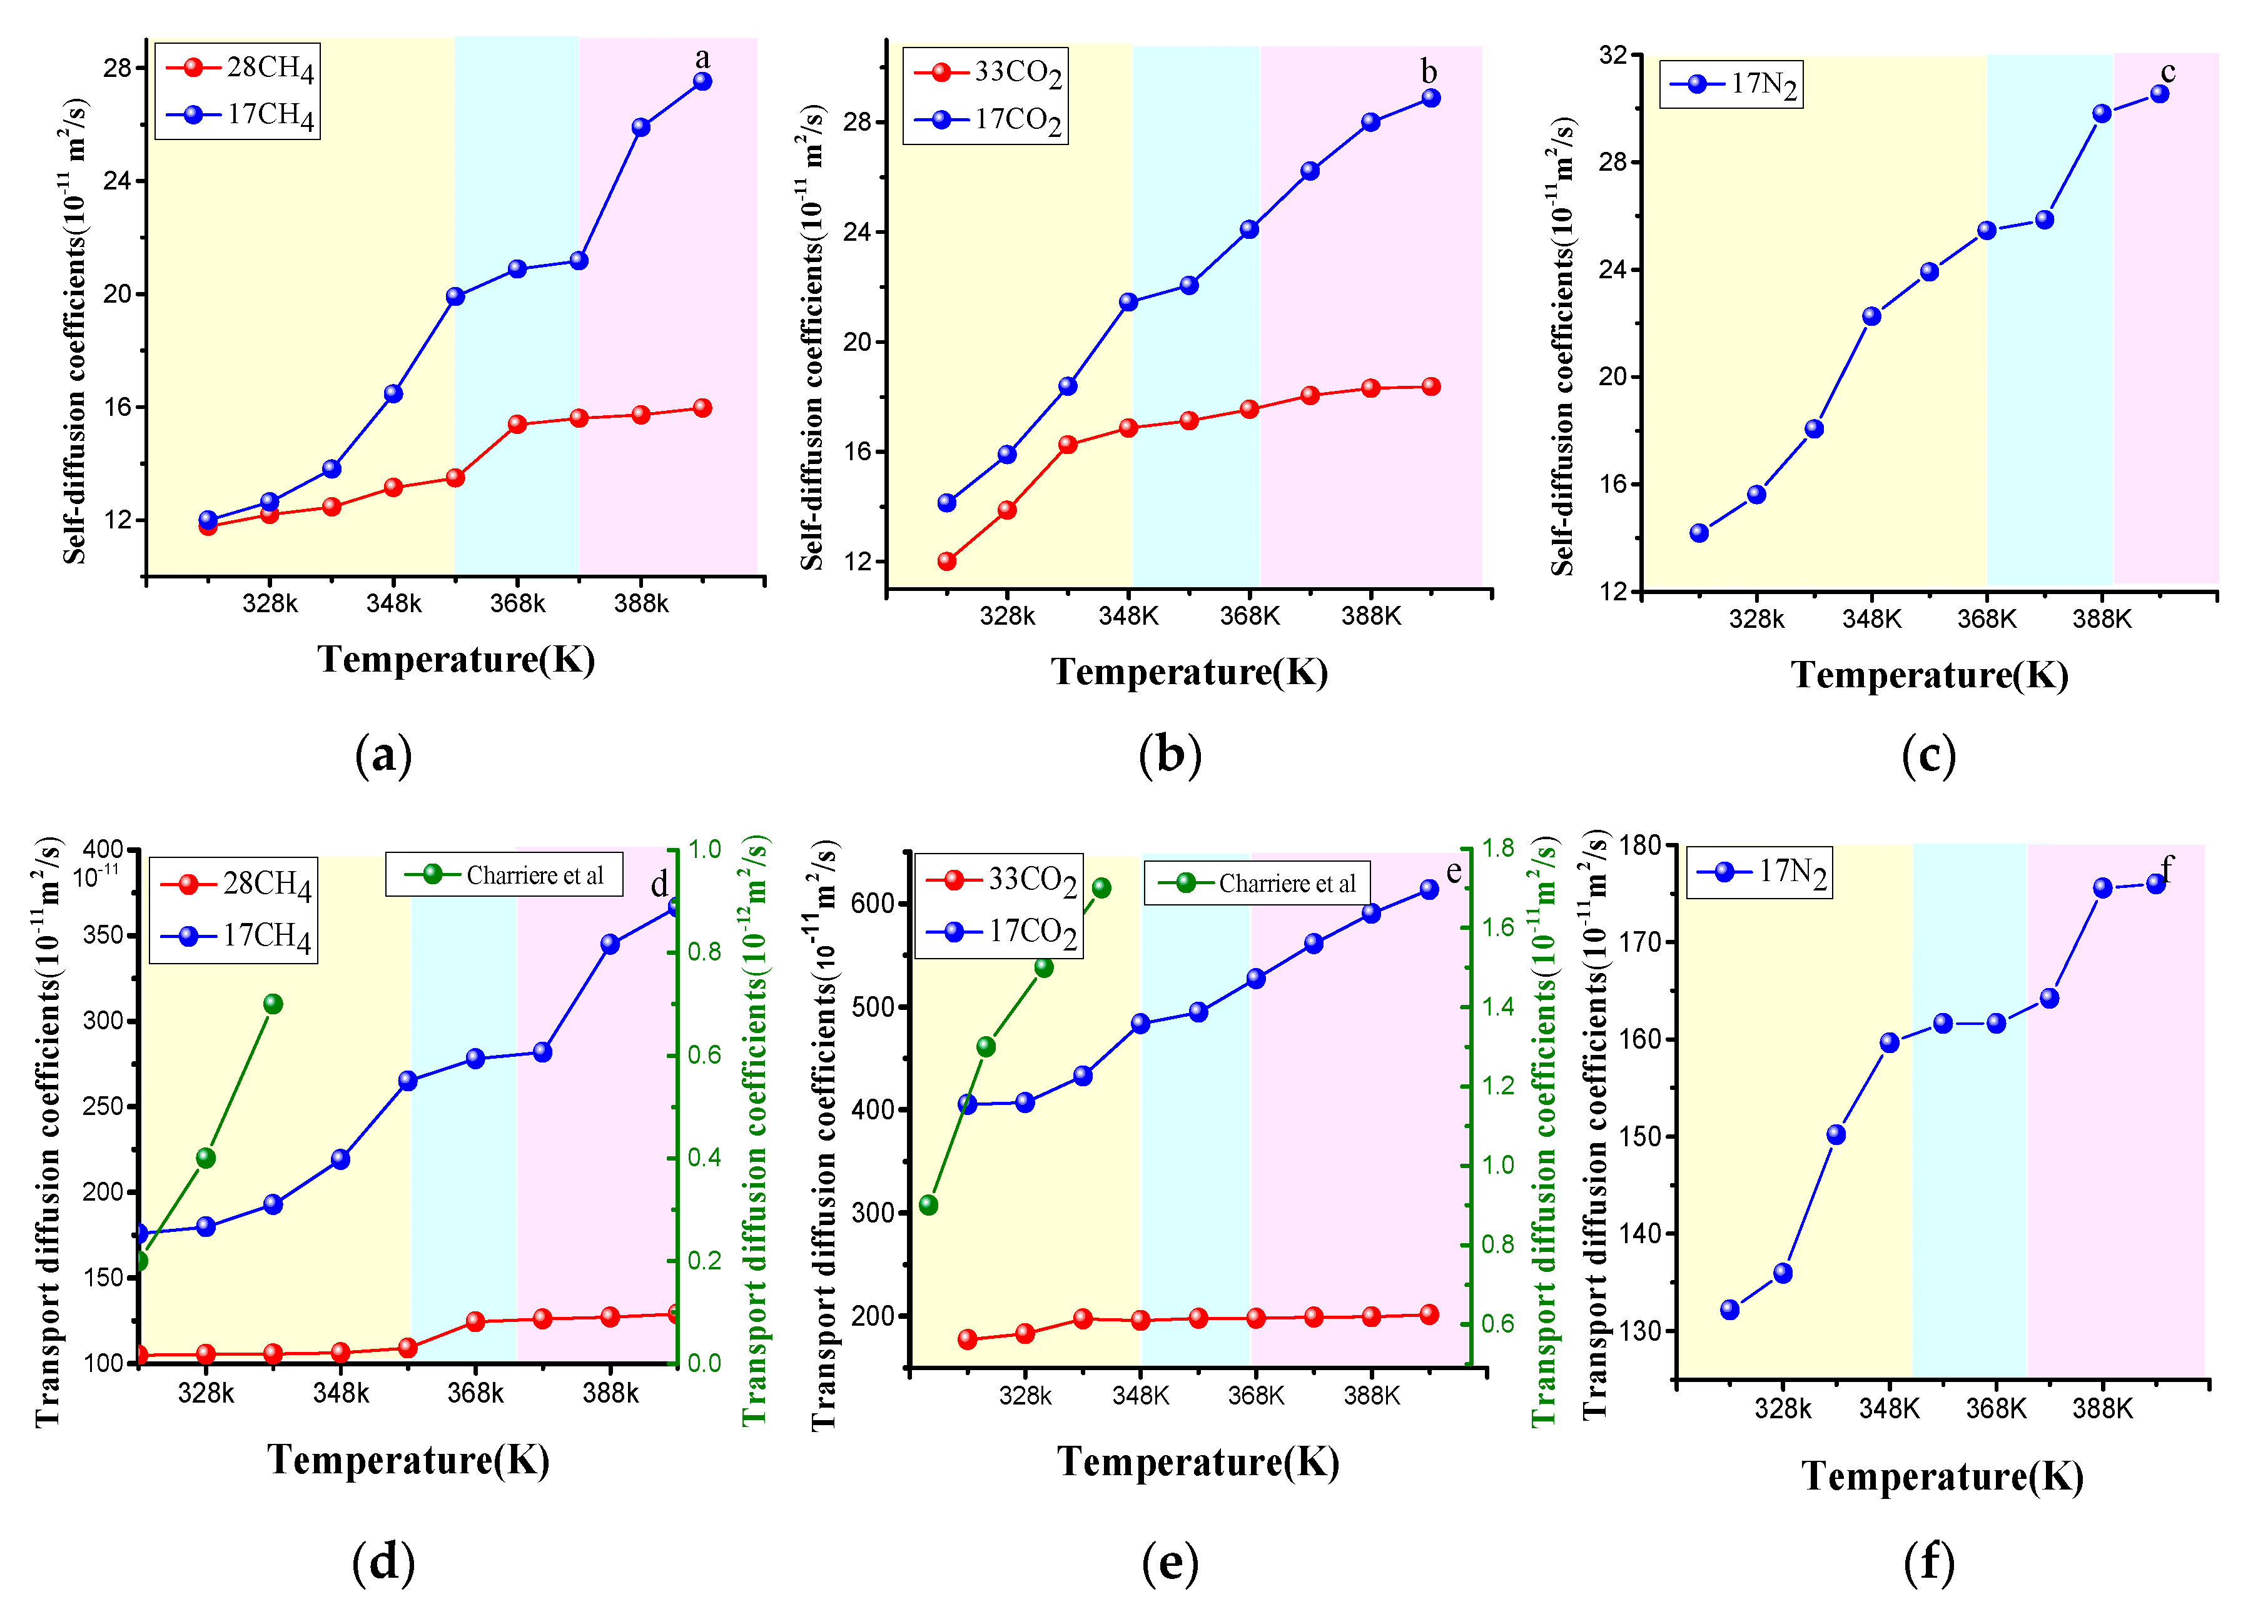
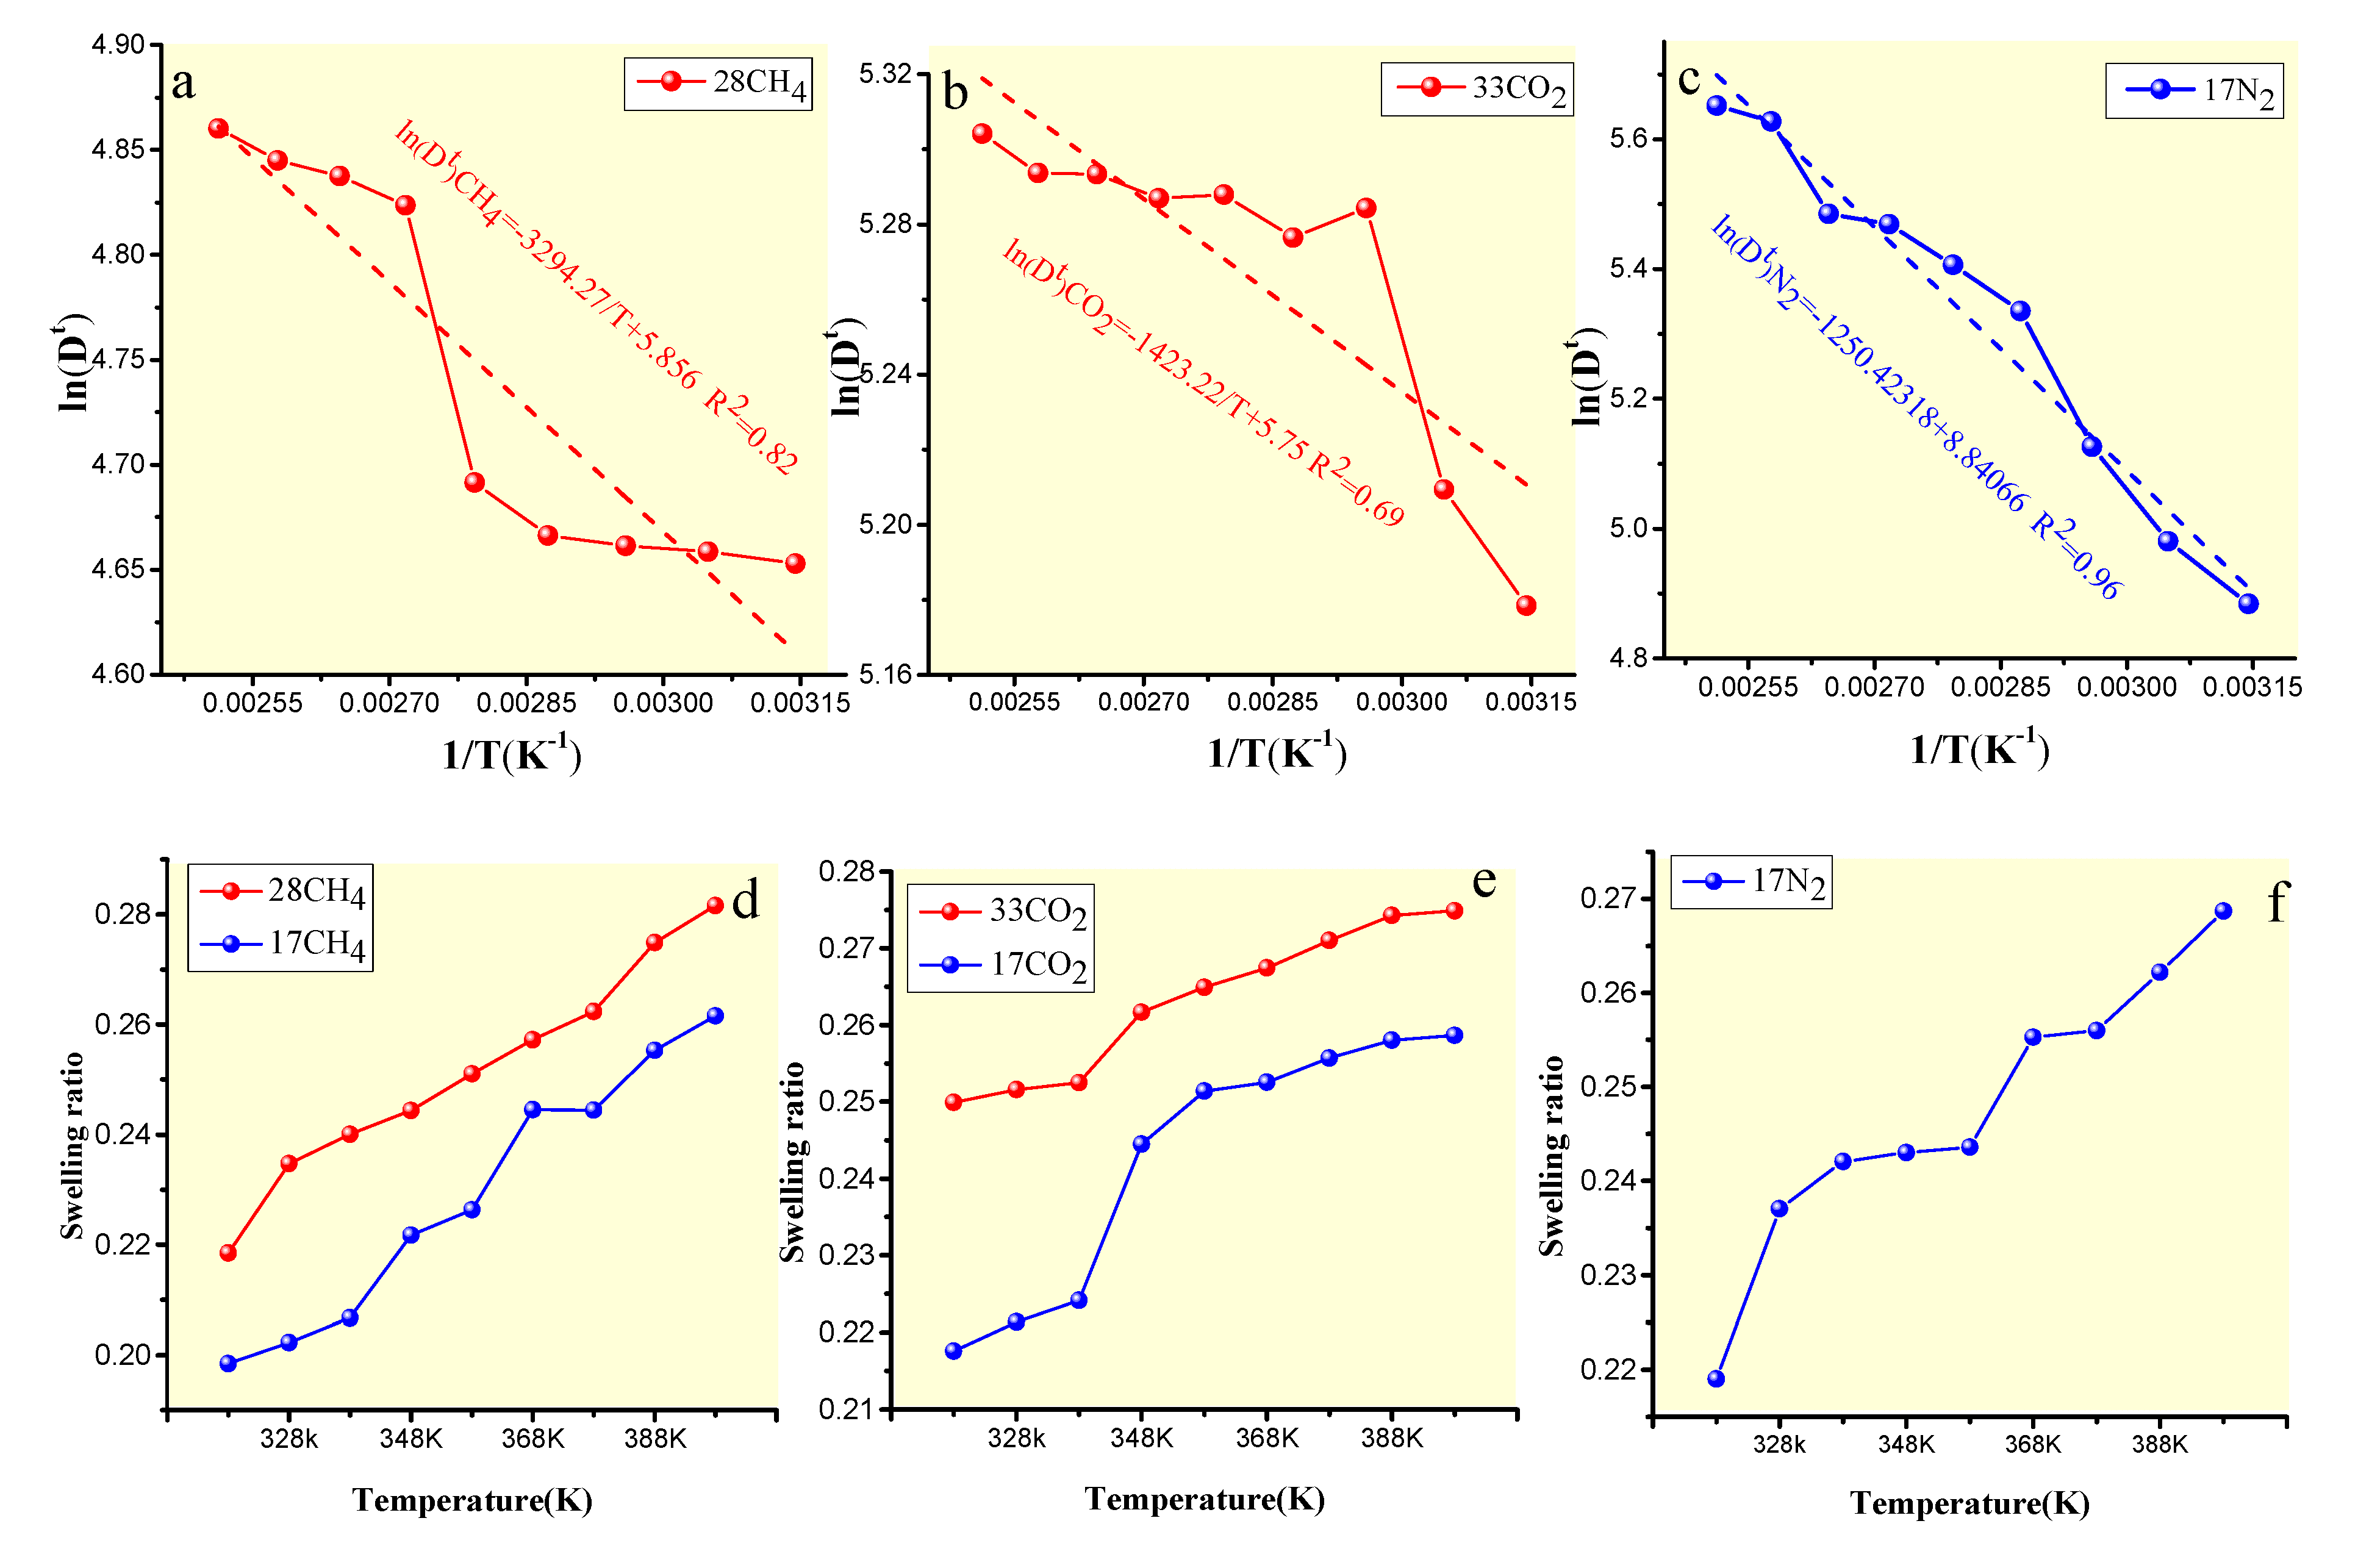
4.3.1. Effect of the Temperature on Gas Diffusion

The laws of the self-diffusion and transport diffusion coefficients of CH4, CO2, and N2 with the temperature are shown in Figure 12 (the fixed pressure was 1 MPa). The three self-diffusion and transport diffusion coefficients increased with temperature, which was the same growth trend as the Charrière et al. [23] unique model simulation results. As shown in Figure 12a–c, the influence of the temperature on the self-diffusion coefficient can be divided into three stages—rapid rise, slow rise, and rapid rise again. The initial rapid rise is due to the increase in the molecular vibration amplitude of a single gas molecule in a certain pore with increasing temperature. When the molecule moves to the position of the orifice, the resistance of the pore wall increases, and the diffusion rate is decreases, Finally, the self-diffusion coefficient rapidly rises again due to the molecule from a pore jumping to another pore and continuing to make a large vibration. The effect of the temperature on transport diffusion is manifested in the interaction force and adsorption affinity between gas and coal. Compared with the simulation results of Charrière et al. [23], which were based on the unique model with a uniform particle size of 0.3 nm, the results in Figure 12d,e are several orders of magnitude larger since Charrière is based on the unique model with a uniform particle size of 0.3 nm. On one hand, the vitrinite molecular model is based on the atomic level and combined with intermolecular interaction. On the other hand, the unique model is a graphite slit pore composed of an aromatic ring, and the vitrinite molecular model contains different types of chemical groups. The adsorption order of the groups mentioned above was aromatic ring > aliphatic side chain > carboxyl group > hydroxyl group. Therefore, the diffusion simulation results in this paper were relatively large. Compared with the unique model, the vitrinite model can better reflect the heterogeneity of the pore structure.
The migration and diffusion of gas in coal molecules is an activation process in accordance with the Arrhenius law [42]. As shown in Figure 13, ln(Dt) has a good linear relationship with 1/T (R2 = 0.69–0.913), which also conforms to Equation (18). From the slope, a set of gas diffusion activation energies at different temperatures can be calculated. The diffusion activation energy also indicates the dependence of diffusion on the temperature, which can characterize the difficulty of migration and diffusion. The lower the activation energy is, the smaller the migration barrier is that needs to be overcome, and the faster the diffusion process is. The order of the activation energy of CH4, CO2, and N2 in the adsorption saturated state, as shown in Figure 13, was CH4 (27.388 kJ/mol) > CO2 (11.832 kJ/mol) > N2 (10.396 kJ/mol), which indicates that CO2 and N2 are more prone to diffusion behavior during diffusion than CH4.
Studies [20,23,29,43] have shown that the diffusion process of different concentrations of gas molecules in coal molecules causes coal volume swelling. As shown in Figure 13d–f, the volume swelling ratio increased with increasing temperature, independent of the gas concentration, indicating that the temperature promotes a swelling balance. On the one hand, the relationship between the swelling ratio and temperature is determined by the decrease in the Gibbs free energy required for the chemical thermodynamic processes (∆G < 0 and ∆Gm = ∆Hm – T ∆Sm). As the adsorption entropy increases during the diffusion process (∆S > 0), the temperature rise is favorable for ∆G < 0, resulting in an increase in the swelling ratio. On the other hand, some studies [41] have shown that the partial dissolution of CO2 in the adsorption process leads to the rearrangement effect of the coal molecular structure, which is reflected in the macroscopic volume swelling, and that, with a rise in temperature, the solubility of CO2 increases and the volume changes more notably. Compared with CO2, CH4 is mainly present in the adsorbed state, and so the volume swelling ratio is lower than for CO2. The higher swelling ratio of N2 at the same adsorption capacity of CH4 and CO2 may be related to the strength of the interaction between the triple bonds and the coal molecules. In addition, Figure 13 shows that the volume swelling ratio increased as the capacity of the gas increased.

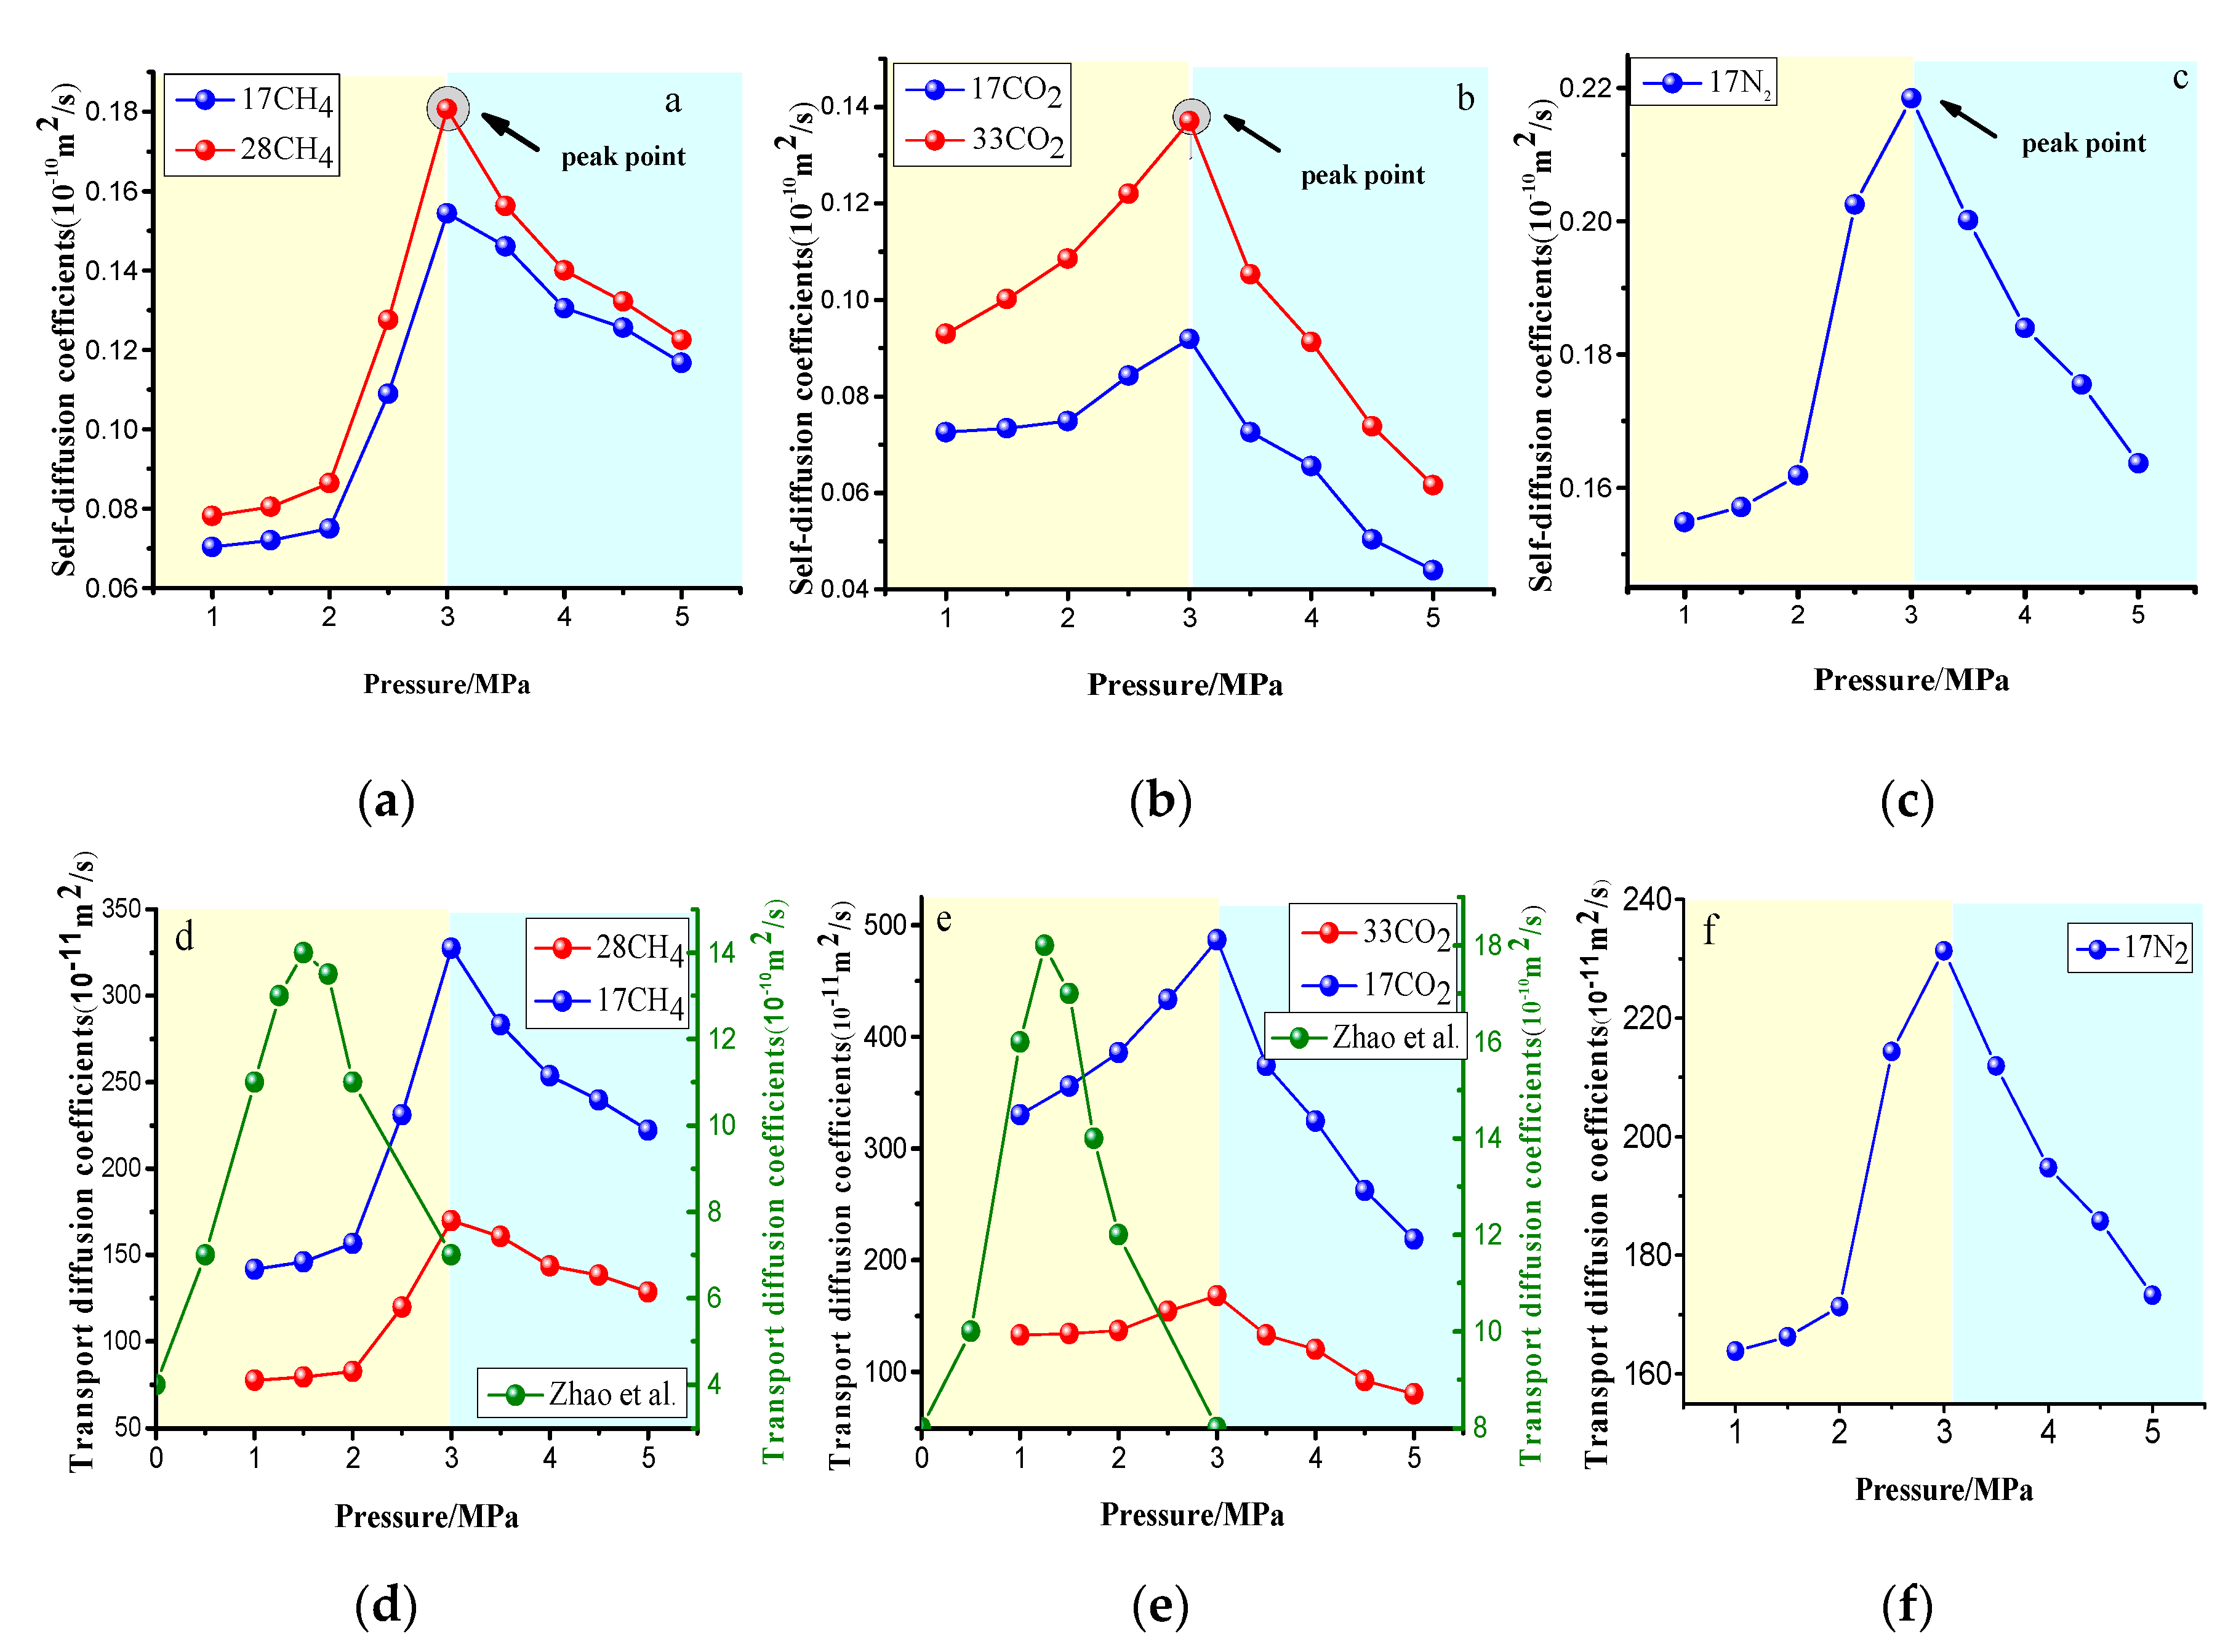
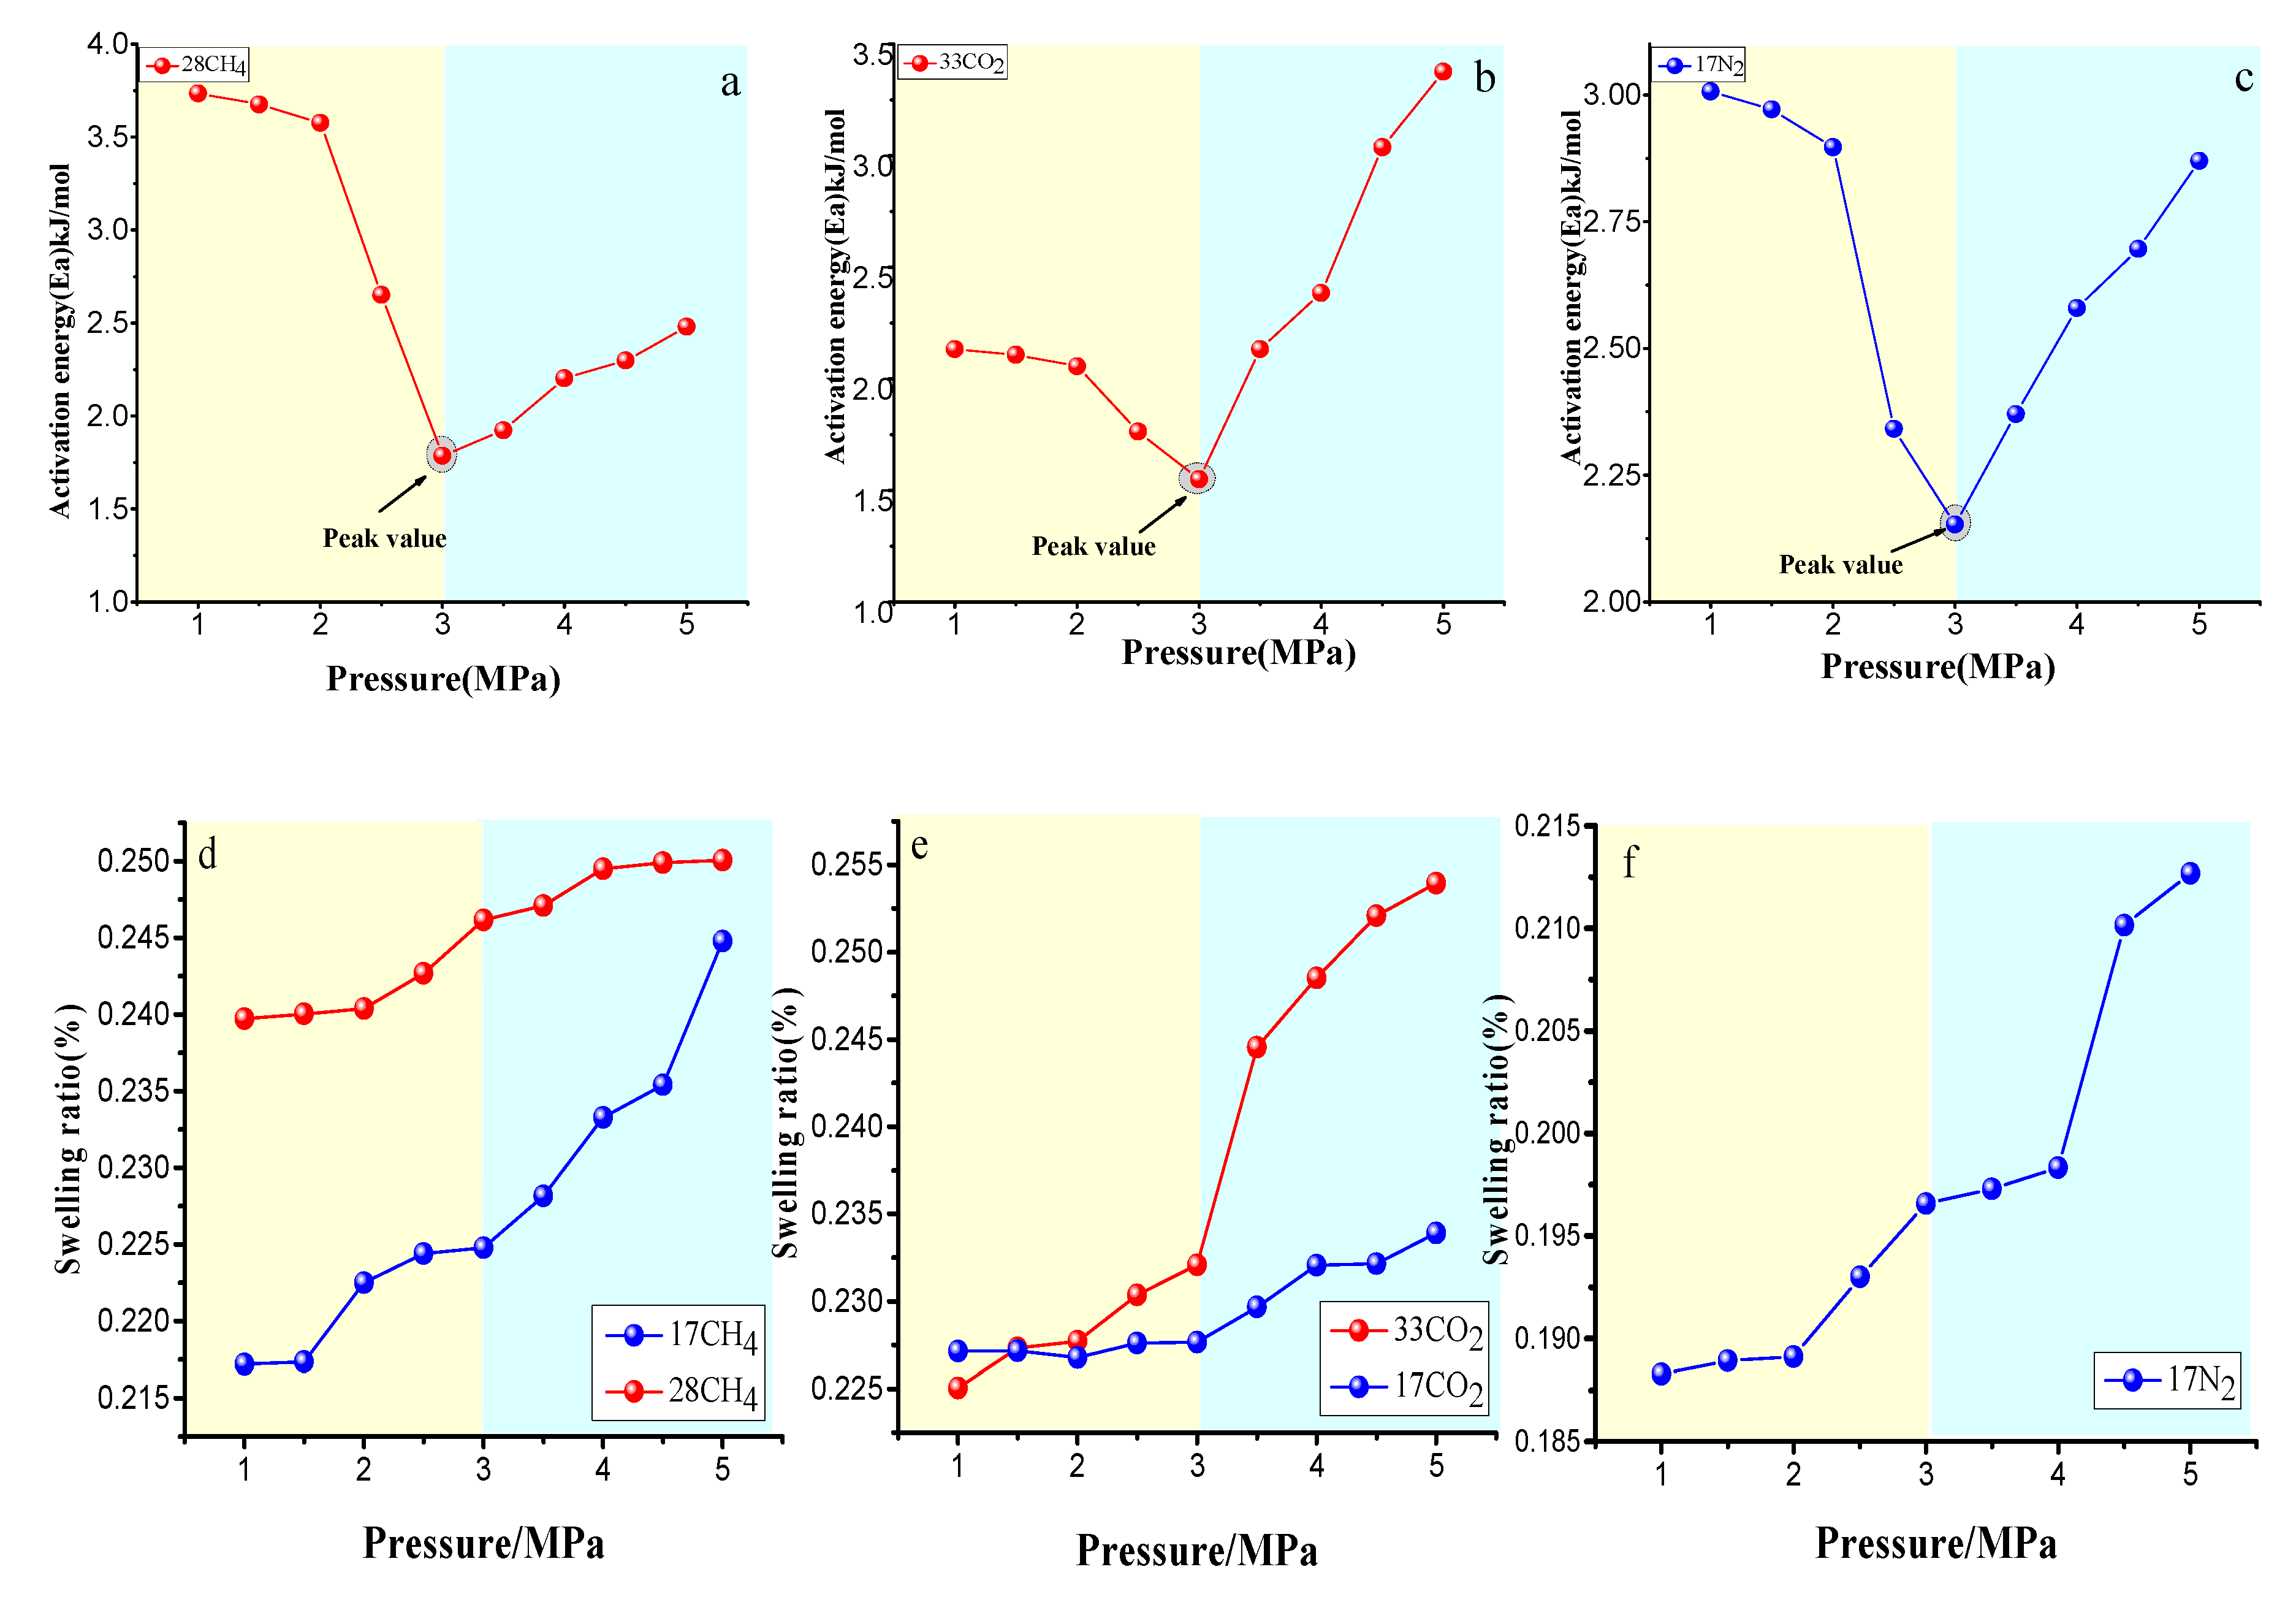
4.3.2. Effect of the Pressure on Gas Diffusion

At present, the influence of the pressure on gas diffusion is controversial. Based on the different models, there are notable differences in the diffusion law with the pressure. Based on the unique model, Charrière et al. [23] found that the diffusion coefficient increased with increasing pressure. The results of Cui et al. [4] based on the bidisperse model, show that the diffusion rate of gas in coal is significantly reduced with the increase of pressure due to the high shrinkage of the micropores. In this paper, based on the vitrinite microporous model, the molecular dynamics simulation results of the diffusion coefficient with the pressure changes are shown in Figure 14. The results show that the self-diffusion and transport diffusion first increased and then decreased with increasing pressure, independent of the gas type and concentration. Additionally, the peak pressures of CH4, CO2, and N2 were all fixed values of 3 MPa. Before the peak pressure, the increase in pressure aggravated the collision between the gas molecules or between the gas molecules and the vitreous group molecules, leading to an increase in the diffusion coefficient. The decrease in the diffusion coefficient after the peak pressure was caused by the strong collision between the gas molecules and the molecules and the interaction with coal adsorption swelling. Figure 14d,e compare the transport diffusion coefficients calculated with those of Zhao et al. [12], that were based on the Wiser model. Generally, the trend of the change was consistently rising at first and then decreasing, but the peak pressures of CH4 and CO2 were lower than in this paper and were not fixed values of 1.5 and 1.25 MPa, respectively, which may be related to the differences in coal rank and pore structure of the model.
In contrast to the law of the diffusion coefficient with the pressure, the law of diffusion activation energy decreased with the pressure, as shown in Figure 15a–c, and the peak pressure was is 3 MPa. This indicates that the lower the energy barrier is, the easier it is for the gas to overcome the energy, threshold, and therefore the higher the diffusion coefficient will be. Conversely, when the peak pressure is reached, the energy barrier increases, and the gas hardly overcomes the barrier, and the diffusion coefficient decreases. The relationship between the volume swelling rate of the vitrinite and the pressure is shown in Figure 15d–f. Overall, it was consistent with the law in temperature change and increased with the increase in pressure. Under low- pressure conditions (1–3 MPa), the rate of change was low, and the rate of change was more notable under high-pressure conditions, indicating that the volume swelling effect is more notable under high-pressure conditions, which is consistent with Busch’s [29] research results. Volume swelling can lead to the narrowing of the micropore orifice, which is in contrast to the gas under high-pressure conditions, and the potential energy of the pore wall to the gas molecules is enhanced, and thus the diffusion coefficient is reduced. This condition corresponds to a decrease in the diffusion coefficient under the above high-pressure conditions.

5. Conclusions

Based on the molecular structure model of TL-1 vitrinite, the self-diffusion and transport diffusion coefficients of CO2, CH4, and N2 were obtained by the Monte Carlo method and molecular dynamics simulation. The effects of the gas concentration, temperature, and pressure were examined. The main conclusions are as follows:
(1) Based on the simulation of the molecular pore structure characteristics of coal vitrinite, it has been shown that the pore volume of the models measured based on the method of using a probe with different radius scales varied greatly, so selecting the appropriate probe to measure the free volume is an important prerequisite for the accurate calculation of the adsorption capacity.
(2) The GCMC results show that the order of the gas adsorption capacity of the three gases was CO2 > CH4 > N2 under the same temperature and pressure conditions. Increasing the temperature is not conducive to gas adsorption. Among these gases, the excess CO2 adsorption capacity reached the saturation pressure value, and the saturation pressure value increased when the temperature was higher than 298 K. The simulated excess adsorption capacity of CH4 in coal was relatively consistent with the experimental results.
(3) The self-diffusion and transport diffusion coefficients in the saturated adsorption state of CO2, CH4, and N2 were ranked as DS(N2) > DS(CO2) > DS(CH4) and Dt(N2) > Dt(CO2) > Dt(CH4), respectively. When the number of adsorption sites was the same, the orders were DS(N2) > DS(CO2) > DS(CH4) and Dt(CO2) > Dt(N2) > Dt(CH4), respectively, which are closely related to the gas molecular dynamics diameter, tensile morphology, and allosteric adsorption. As the gas concentration increased, the three gases self- and transport diffusion coefficients decreased. Based on the five diffusion configurations and the self-diffusion trajectory, the order of the three gases vibration amplitudes was N2 > CO2 > CH4, and the jump time of N2 was the shortest.
(4) The diffusion coefficients of the three gases in coal increased with increasing temperature, and first increasing and then decreasing with increasing pressure. The peak pressure was 3 MPa. The order of the diffusion activation energies of CH4, CO2, and N2 under the saturated adsorption condition were CH4 (27.388 kJ/mol) > CO2 (11.832 kJ/mol) > N2 (10.396 kJ/mol). The diffusion activation energies first decreased and then increased with the pressure, and the peak values was also 3 MPa. At a high pressure, the effect of volume swelling was more notable.

Author Contributions

J.L. and Y.W. designed the project; J.L. and S.L. performed the simulation and analyzed the data; J.L. wrote the paper and Y.W. corrected it. S.L. modified the formats.

Funding

This research was supported of the National Natural Science Foundation of China (41802183 and 41972169), and National Science and Technology Major Project (2017ZX05035004-002).

Acknowledgments

We are grateful to the editors and reviewers for their constructive comments and suggestions.

Conflicts of Interest

The authors declare no conflict of interest.

References

  1. Liu, Y.; Zhu, Y.; Li, W.; Zhang, C.; Wang, Y. Ultra micropores in macromolecular structure of subbituminous coal vitrinite. Fuel 2017, 210, 298–306. [Google Scholar] [CrossRef]
  2. Moore, T.A. Coalbed methane: A review. Int. J. Coal Geol. 2012, 101, 36–81. [Google Scholar] [CrossRef]
  3. Vishal, V.; Singh, T.N.; Ranjith, P.G. Influence of sorption time in CO2-ECBM process in Indian coals using coupled numerical simulation. Fuel 2015, 139, 51–58. [Google Scholar] [CrossRef]
  4. Cui, X.; Bustin, R.M.; Dipple, G. Selective transport of CO2, CH4, and N2 in coals: Insights from modeling of experimental gas adsorption data. Fule 2004, 83, 293–303. [Google Scholar] [CrossRef]
  5. Cuéllar-Franca, R.M.; Azapagic, A. Carbon capture, storage and utilisation technologies: A critical analysis and comparison of their life cycle environmental impacts. J. CO2 Util. 2015, 9, 82–102. [Google Scholar] [CrossRef]
  6. Middleton, R.S.; Keating, G.N.; Stauffer, P.H.; Jordan, A.B.; Viswanathan, H.S.; Kang, Q.J.; Carey, J.W.; Mulkey, M.L.; Sullivan, E.J.; Chu, S.P. The cross-scale science of CO2 capture and storage: From pore scale to regional scale. Energy Environ. Sci. 2012, 5, 7328–7345. [Google Scholar] [CrossRef]
  7. Tang, X.; Ripepi, N. High pressure supercritical carbon dioxide adsorption in coal: Adsorption model and thermodynamic characteristics. J. CO2 Util. 2017, 18, 189–197. [Google Scholar] [CrossRef] [Green Version]
  8. Ranathunga, A.S.; Perera, M.S.A.; Ranjith, P.G.; Zhang, X.G.; Wu, B. Super-critical carbon dioxide flow behaviour in low rank coal: A meso-scale experimental study. J. CO2 Util. 2017, 20, 1–13. [Google Scholar] [CrossRef]
  9. Damen, K.; Faaij, A.; van Bergen, F.; Gale, J.; Lysen, E. Identification of early opportunities for CO2 sequestration—worldwide screening for CO2-EOR and CO2-ECBM projects. Energy 2005, 30, 1931–1952. [Google Scholar] [CrossRef]
  10. Jian, X.; Guan, P.; Zhang, W. Carbon dioxide sorption and diffusion in coals: Experimental investigation and modeling. Sci. China Earth Sci. 2012, 55, 633–643. [Google Scholar] [CrossRef]
  11. Yu, S.; Bo, J.; Meijun, Q. Molecular Dynamic Simulation of Self- and Transport Diffusion for CO2/CH4/N2 in Low-Rank Coal Vitrinite. Energy Fuels 2018, 32, 3085–3096. [Google Scholar] [CrossRef]
  12. Zhao, Y.; Feng, Y.; Zhang, X. Molecular simulation of CO2/CH4 self- and transport diffusion coefficients in coal. Fuel 2016, 165, 19–27. [Google Scholar] [CrossRef]
  13. Zhao, Y.; Liu, S.; Elsworth, D.; Jiang, Y.; Zhu, J. Pore Structure Characterization of Coal by Synchrotron Small-Angle X-ray Scattering and Transmission Electron Microscopy. Energy Fuels 2014, 28, 3704–3711. [Google Scholar] [CrossRef]
  14. Rouquerol, J.; Avnir, D.; Fairbridge, C.W.; Everett, D.H.; Haynes, J.M.; Pernicone, N.; Ramsay, J.D.F.; Sing, K.S.W.; Unger, K.K. Recommendations for the characterization of porous solids. Pure Appl. Chem. 1994, 66, 1739–1758. [Google Scholar] [CrossRef]
  15. Zhao, W.; Cheng, Y.; Yuan, M.; An, F. Effect of Adsorption Contact Time on Coking Coal Particle Desorption Characteristics. Energy Fuels 2014, 28, 2287–2296. [Google Scholar] [CrossRef]
  16. Tambach, T.J.; Mathews, J.P.; van Bergen, F. Molecular Exchange of CH4 and CO2 in Coal: Enhanced Coalbed Methane on a Nanoscale. Energy Fuels 2009, 23, 4845–4847. [Google Scholar] [CrossRef]
  17. Barton, G. The Mathematics of Diffusion 2nd edn. Phys. Bull. 1975, 26, 500–501. [Google Scholar] [CrossRef]
  18. Ruckenstein, E.; Vaidyanathan, A.S.; Youngquist, G.R. Sorption by solids with bidisperse pore structures. Chem. Eng. Sci. 1971, 26, 1305–1318.21. [Google Scholar] [CrossRef]
  19. Clarkson, C.R.; Bustin, R.M. The effect of pore structure and gas pressure upon the transport properties of coal: A laboratory and modeling study. 2. Adsorption rate modeling. Fuel 1999, 78, 1345–1362. [Google Scholar] [CrossRef]
  20. Staib, G.; Sakurovs, R.; Gray, E.M.A. Dispersive diffusion of gases in coals. Part II: An assessment of previously proposed physical mechanisms of diffusion in coal. Fuel 2015, 143, 620–629. [Google Scholar] [CrossRef]
  21. Einstein, A. On the movement of small particles suspended in a stationary liquid demanded by the molecular-kinetic theory of heat. Ann. Phys. (Leipzig) 1905, 17, 549–560. [Google Scholar] [CrossRef]
  22. Hu, H.; Du, L.; Xing, Y.; Li, X. Detailed study on self- and multicomponent diffusion of CO2-CH4 gas mixture in coal by molecular simulation. Fuel 2017, 187, 220–228. [Google Scholar] [CrossRef]
  23. Charrière, D.; Pokryszka, Z.; Behra, P. Effect of pressure and temperature on diffusion of CO2 and CH4 into coal from the Lorraine basin (France). Int. J. Coal Geol. 2010, 81, 373–380. [Google Scholar] [CrossRef]
  24. Saghafi, A.; Faiz, M.; Roberts, D. CO2 storage and gas diffusivity properties of coals from Sydney Basin, Australia. Int. J. Coal Geol. 2007, 34, 240–254. [Google Scholar] [CrossRef]
  25. Yao, Y.; Liu, D.; Xie, S. Quantitative characterization of methane adsorption on coal using a low-field NMR relaxation method. Int. J. Coal Geol. 2014, 131, 32–40. [Google Scholar] [CrossRef]
  26. Olague, N.E.; Smith, D.M. Diffusion of gases in American coals. Fuel 1989, 68, 1381–1387. [Google Scholar] [CrossRef]
  27. Wiser, W.H. Conversion of bituminous coal to liquids and gases: Chemistry and representative processes. In Magnetic Resonance; Springer: Dordrecht, The Netherlands, 1984; pp. 325–350. [Google Scholar]
  28. Liu, Y.; Zhu, Y.; Liu, S.; Chen, S.; Li, W.; Wang, Y. Molecular structure controls on micropore evolution in coal vitrinite during coalification. Int. J. Coal Geol. 2018, 199, 19–30. [Google Scholar] [CrossRef]
  29. Jianhua, X.; Fangui, Z.; Huzhen, L. Molecular Simulation of Adsorption of CH4/CO2/H2O in Coal Molecular Structure. Chin. Sci. 2014, 44, 1418–1428. [Google Scholar]
  30. Mathews, J.P.; Chaffee, A.L. The molecular representations of coal—A review. Fuel 2012, 96, 1–14. [Google Scholar] [CrossRef]
  31. Sun, H. COMPASS: An ab Initio Force-Field Optimized for Condensed-Phase Applications Overview with Details on Alkane and Benzene Compounds. J. Phys. Chem. 1998, 102, 7338–7364. [Google Scholar] [CrossRef]
  32. Tan, Z.; Gubbins, K.E. Adsorption in carbon micropores at supercritical temperatures. J. Phys. Chem. 1990, 94, 6061–6069. [Google Scholar] [CrossRef]
  33. Liu, Y.; Zhu, Y.; Liu, S.; Li, W.; Tang, X. Temperature effect on gas adsorption capacity in different sized pores of coal: Experiment and numerical modeling. J. Pet. Sci. Eng. 2018, 165, 821–830. [Google Scholar] [CrossRef]
  34. Zhang, C.; Chen, S.; Liu, Y.; Chen, S.; Li, X. Mechanism of methane adsorption on groove space in organic matter surface. Mol. Simul. 2019, 45, 186–198. [Google Scholar] [CrossRef]
  35. Gibbs, J.W. The Collected Works of JW Gibbs; Longmans, Green: New York, NY, USA, 1928. [Google Scholar]
  36. Hu, H.; Li, X.; Fang, Z.; Wei, N.; Li, Q. Small-molecule gas sorption and diffusion in coal: Molecular simulation. Energy 2010, 35, 2939–2944. [Google Scholar] [CrossRef]
  37. Jobic, H.; Theodorou, D.N. Quasi-elastic neutron scattering and molecular dynamics simulation as complementary techniques for studying diffusion in zeolites. Microporous Mesoporous Mater. 2007, 102, 21–50. [Google Scholar] [CrossRef]
  38. Krishna, R.; Wesselingh, J.A. The Maxwell-Stefan Approach to Mass Transfer; Elsevier: Amsterdam, The Netherlands, 1997; Volume 52, pp. 861–911. [Google Scholar]
  39. Robinson, D.P.A.D. A New Two-Constant Equation of State. Ind. Eng. Chem. Fundam. 1976, 1, 59–64. [Google Scholar]
  40. Shieh, J.J.; Chung, T.S. Gas permeability, diffusivity, and solubility of poly (4-vinylpyridine) film. J. Polym. Sci. Part B Polym. Phys. 1999, 37, 2851–2861. [Google Scholar] [CrossRef]
  41. Larsen, J.W. The effects of dissolved CO2 on coal structure and properties. Int. J. Coal Geol. 2004, 57, 63–70. [Google Scholar] [CrossRef]
  42. Kärger, J.; Valiullin, R. Mass transfer in mesoporous materials: The benefit of microscopic diffusion measurement. Chem. Soc. Rev. 2013, 42, 4172–4197. [Google Scholar] [CrossRef]
  43. Staib, G.; Sakurovs, R.; Gray, E.M.A. A pressure and concentration dependence of CO2 diffusion in two Australian bituminous coals. Int. J. Coal Geol. 2013, 116–117, 106–116. [Google Scholar] [CrossRef]
Figure 1. Two-dimensional to three-dimensional TL-1 structural models. (a) experimental and calculated 13C NMR spectrum (b) two-dimensional structure (c) three-dimensional structure.
Energies 12 03744 g001
Figure 2. The excess adsorption capacity and the absolute adsorption capacity modified from Zhang et al. [34].
Energies 12 03744 g002
Figure 3. Principles of molecular measurement using probe molecules with different scales. (a) Probe surface difference with different radius measurements. (b) Measurement of volume differences by probe molecules with different radius sizes.
Energies 12 03744 g003
Figure 4. CO2 probe molecular pore measurement. (a) three-dimensional structure (b) three-dimensional molecular structure and formed pores. (c) remove the pore structure of the atom.
Energies 12 03744 g004
Figure 5. Accessible pores and inaccessible pores. (a) normal pores (b) accessible pores.
Energies 12 03744 g005
Figure 6. Different sizes of probe molecular pores. (a) the pores were measured by He. (b) the pores were measured by N2. (c) the pores were measured by CO2. (d) the pores were measured by CH4.
Energies 12 03744 g006
Figure 7. Total energy change and configuration of the CO2/CH4/N2 saturated adsorption process. (a) the total energy change of CO2/CH4/N2 saturated adsorption process. (b) the configuration of the CO2/CH4/N2 saturated adsorption proes.
Energies 12 03744 g007
Figure 8. Adsorption isotherm of CH4/CO2 and N2 at 283–358 K obtained through the grand canonical Monte Carlo (GCMC) method. (a) the average loading (per cell) of CH4 at 283–358 K. (b) the average loading (per cell) of CO2 at 283–358 K. (c) the average loading (per cell) of N2 at 283–358 K. (d) the excess adsorption of CH4 at 283–358 K. (e) the excess adsorption of CO2 at 283–358 K. (f) the excess adsorption of N2 at 283–358 K.
Energies 12 03744 g008
Figure 9. Comparison of the excess adsorption capacity of CH4 at 298 K with the experimental data at 303.15 K.
Energies 12 03744 g009
Figure 10. Different adsorption positions of CO2/CH4/N2. (a) Only CO2 were present in the pore. (b) Only CH4 were present in the pore. (c) Only N2 were present in the pore. (d) CH4 and CO2 were both in the pores. (e) N2 and CO2 were both in the pores. (f) CH4 and CO2 were both in the pores.
Energies 12 03744 g010
Figure 11. Diffusion trajectories and displacements of CO2, CH4, and N2. (a1) the diffusion trajectory of 17CH. (a2) the diffusion displacement of 17CH4. (b1) the diffusion trajectory of 17CO2. (b2) the diffusion displacement of 17 CO2. (c1) the diffusion displacement of 17 N2. (c2) the diffusion trajectory of 17 N2. (d1) the diffusion displacement of 28CH4. (d2) the diffusion trajectory of 28 CH4. (e1) the diffusion displacement of 33 CO2. (e2) the diffusion trajectory of 33 CO2.
Energies 12 03744 g011aEnergies 12 03744 g011b
Figure 12. Temperature dependence of the self- and transport diffusion coefficients at 318–398 K obtained through the molecular dynamics (MD) method. (a) the variation of CH4 self-diffusion coefficient with temperature. (b) the variation of CO2 self-diffusion coefficient with temperature. (c) the variation of N2 self-diffusion coefficient with temperature. (d) the variation of CH4 transport diffusion coefficient with temperature. (e) the variation of CO2 transport diffusion coefficient with temperature. (f) the variation of N2 transport coefficient with temperature.
Energies 12 03744 g012
Figure 13. Relationship between ln(Dt) and 1/T for CH4 (a), CO2 (b), and N2 (c) diffusions in vitrinite macromolecules, and the swelling ratios for CH4 (d), CO2 (e), and N2 (f).
Energies 12 03744 g013
Figure 14. Pressure dependence of self- and transport diffusion coefficients at 0–5 MPa obtained through the molecular dynamics (MD) method. (a) the variation of CH4 self-diffusion coefficient with pressure. (b) the variation of CO2 self-diffusion coefficient with pressure. (c) the variation of N2 self-diffusion coefficient with pressure. (d) the variation of CH4 transport diffusion coefficient with pressure. (e) the variation of CO2 transport coefficient with pressure.(f) the variation of N2 transport coefficient with pressure.
Energies 12 03744 g014
Figure 15. Activation energy of CH4 (a), CO2 (b), and N2 (c) diffusing in vitrinite macromolecules, and the swelling ratio of CH4 (d), CO2 (e), and N2 (f) diffusing in vitrinite macromolecules.
Energies 12 03744 g015
Table 1. Proximate analysis and element analysis of the TL-1 coal sample [28].
Sample
Name
VR (%)Proximate Analysis (wt.%)Total Sulfur (wt.%)Ultimate Analysis (wt.%)
MadAdCdafHdafOdafNdaf
TL-11.30.826.010.5587.825.025.521.42
VR: Vitrinite reflectance; Mad: Moisture, air dry; Ad: Ash, dry; Cdaf: Carbon, dry and ash free; Hdaf: Hydrogen, dry and ash free; Ndaf: Nitrogen, dry and ash free.
Table 2. Diffusion coefficients of CO2, CH4, and N2 in the vitrinite (298 K and 0.1 MPa).
Diffusion Coefficients
(10−11 m2/s)
ConfigurationDSDcDt
CO2337.2619.15132.81
179.2347.27327.79
CH4287.0321.8776.55
177.8240.06140.19
N21715.4879.29198.22

