Effect of Fines Content on Fluidity of FCC Catalysts for Stable Operation of Fluid Catalytic Cracking Unit


Abstract
:1. Introduction
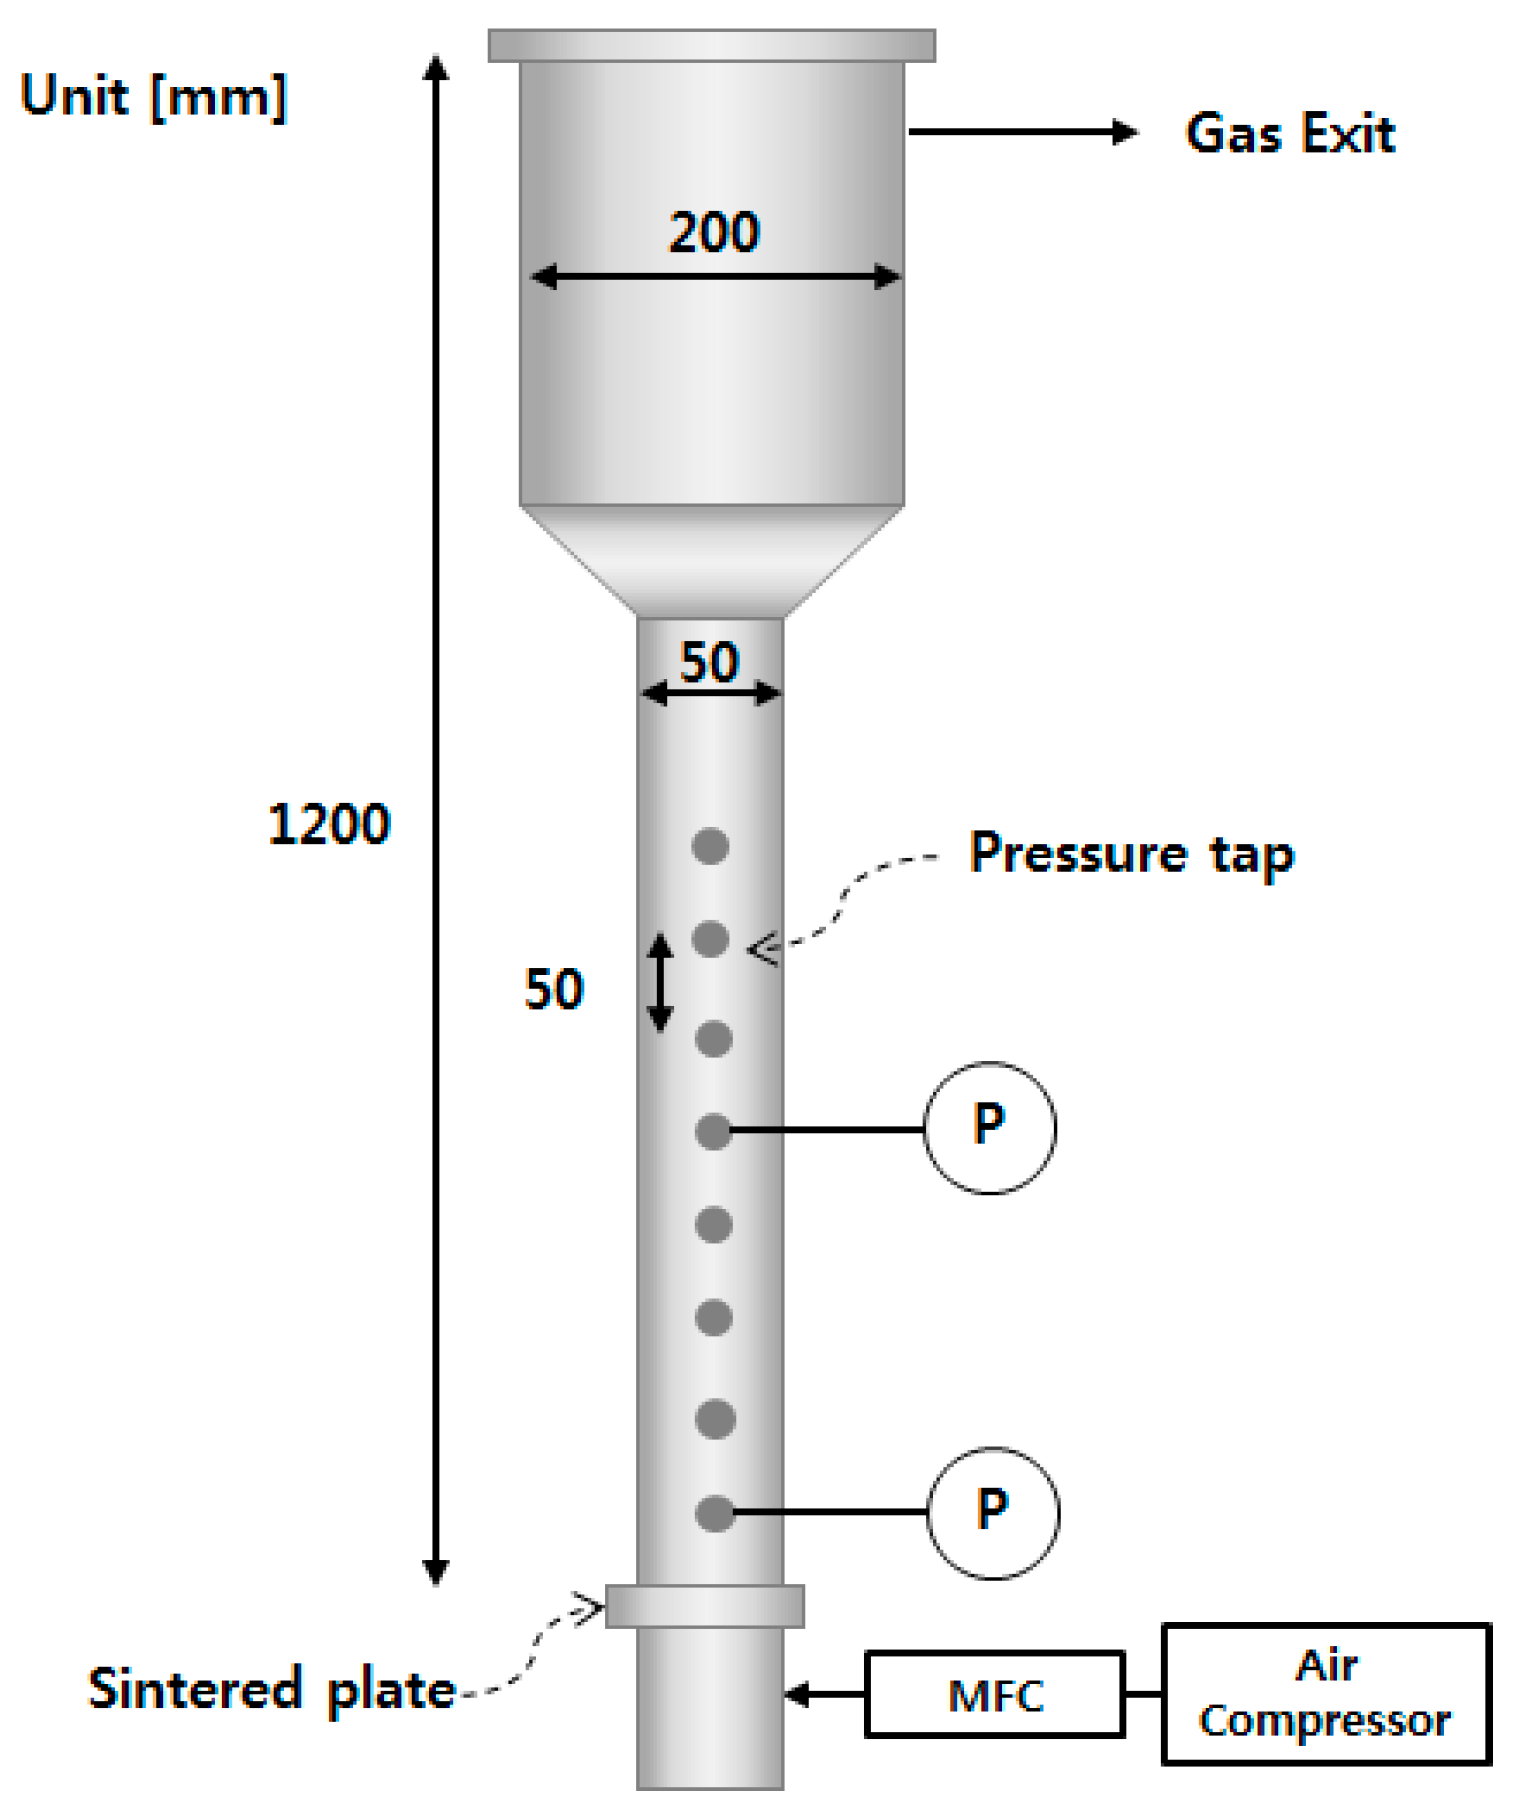
2. Materials and Methods
3. Results
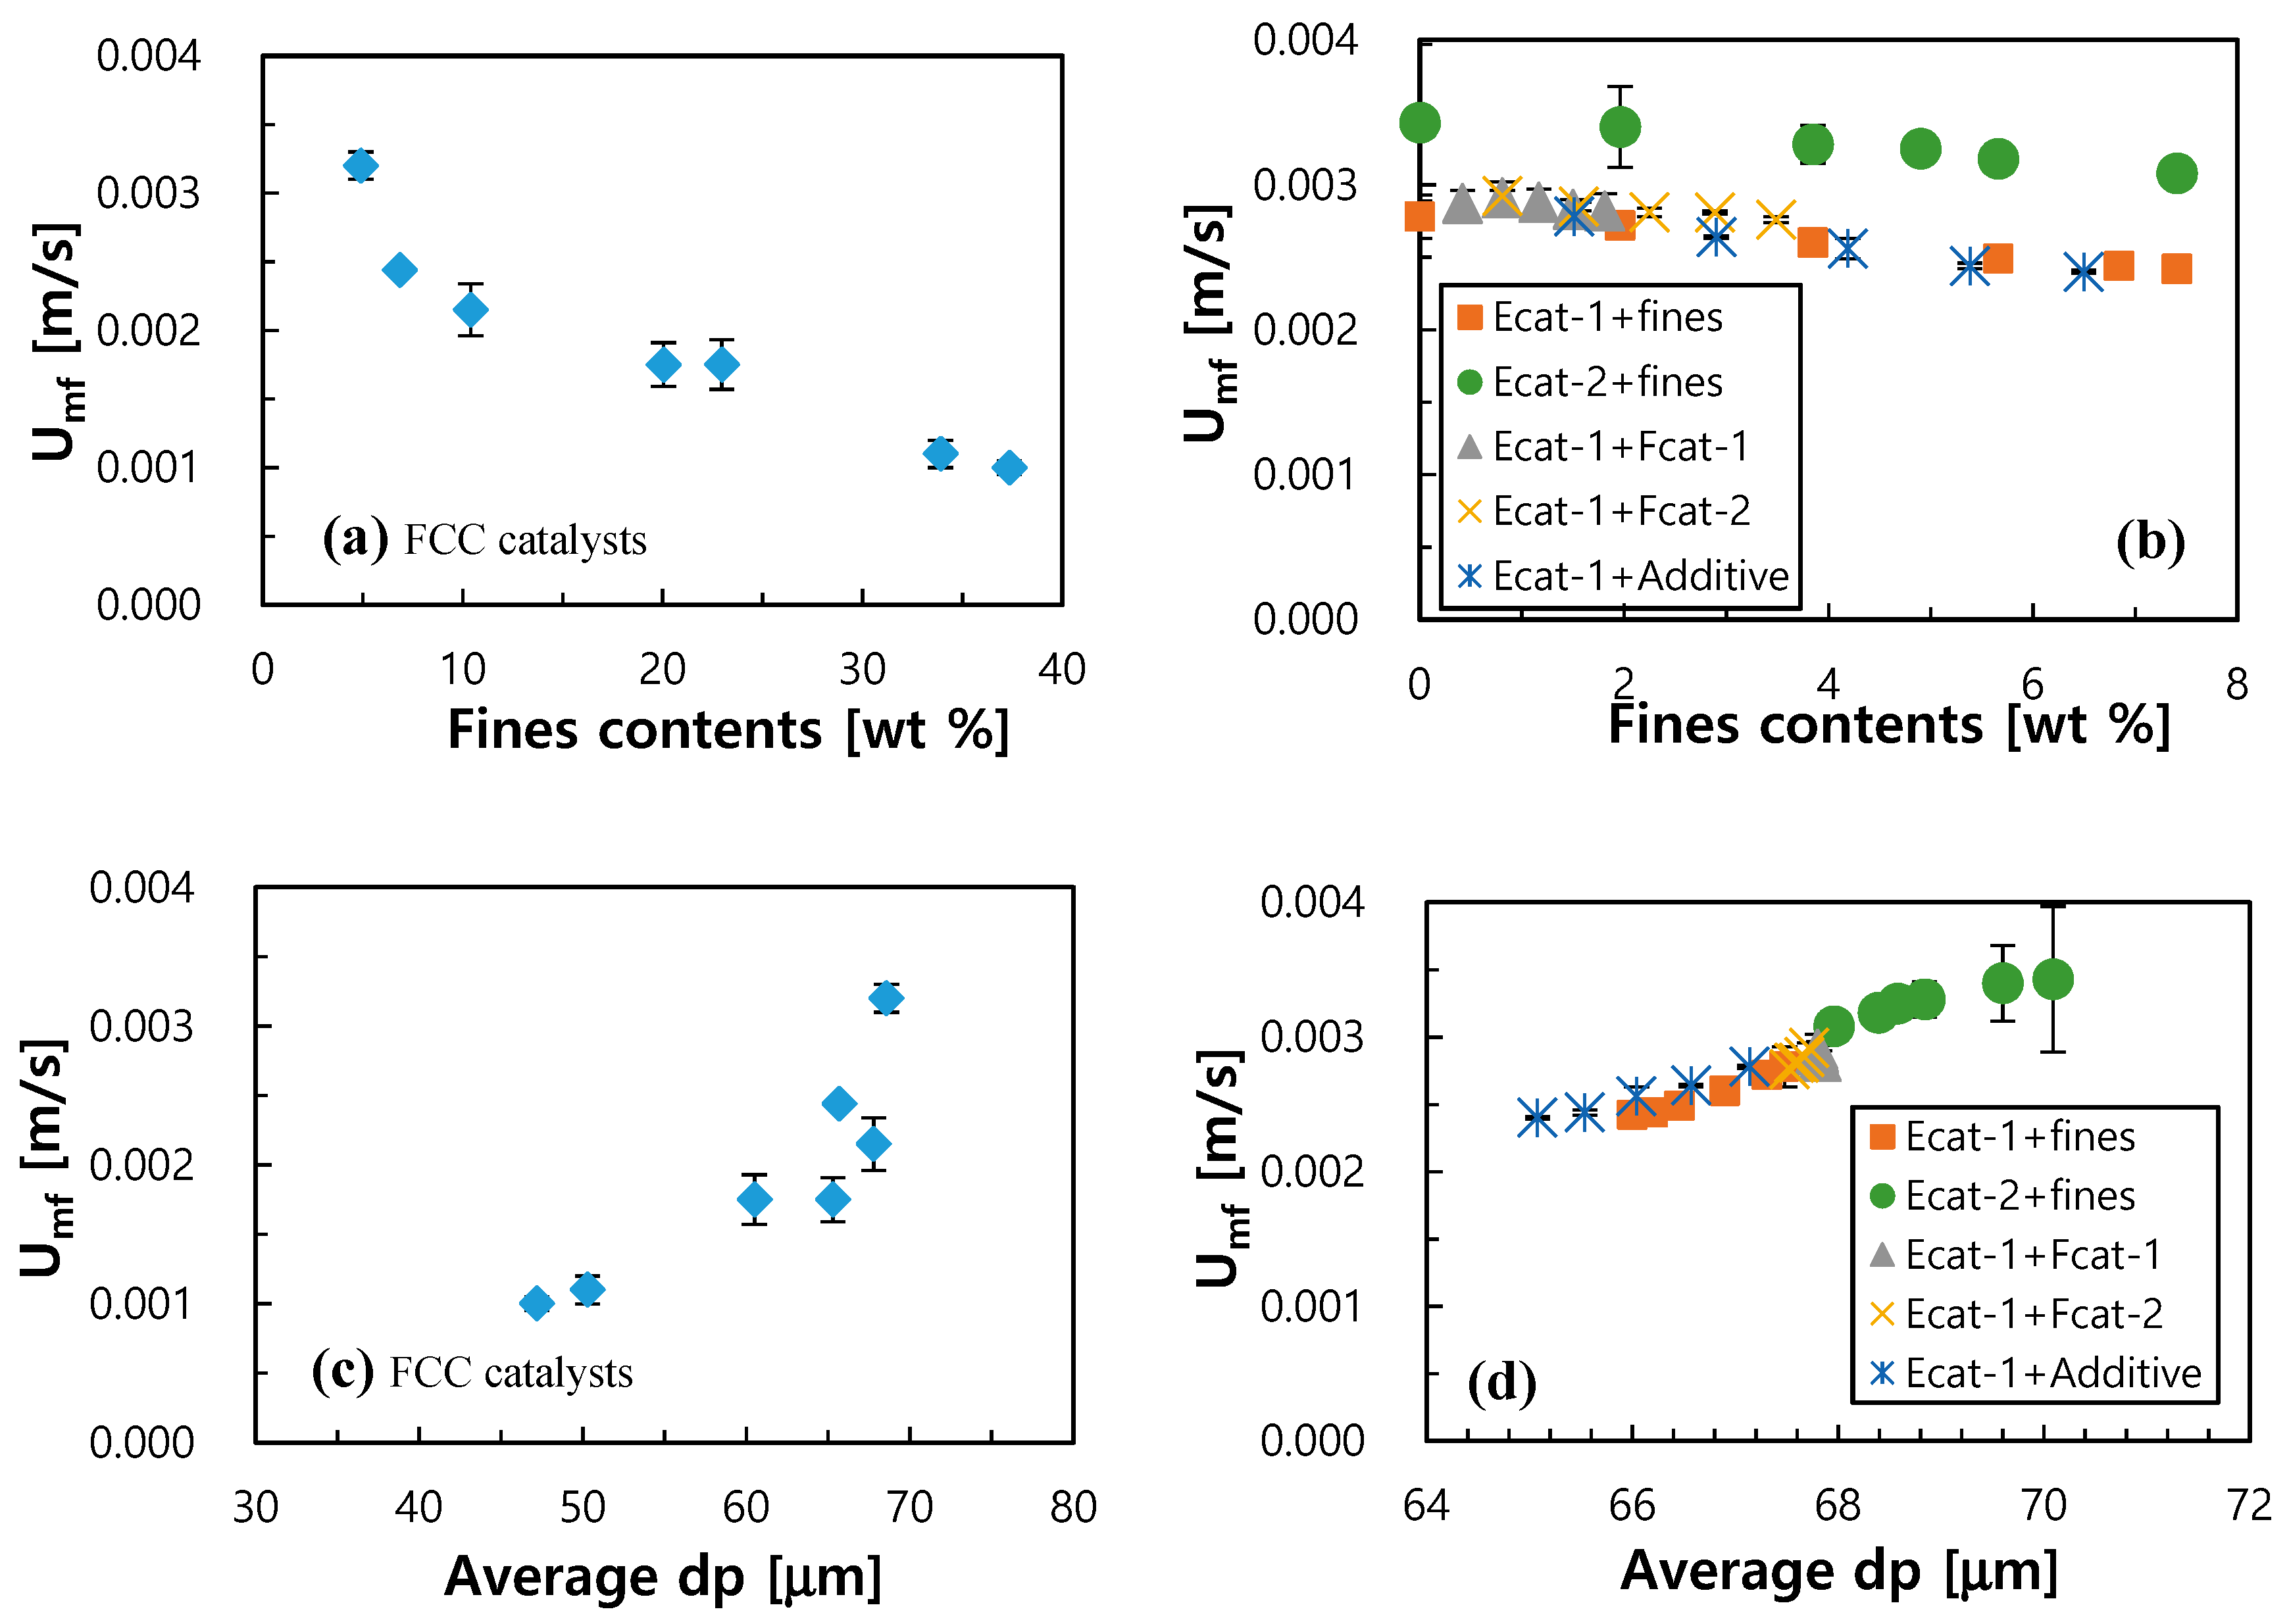
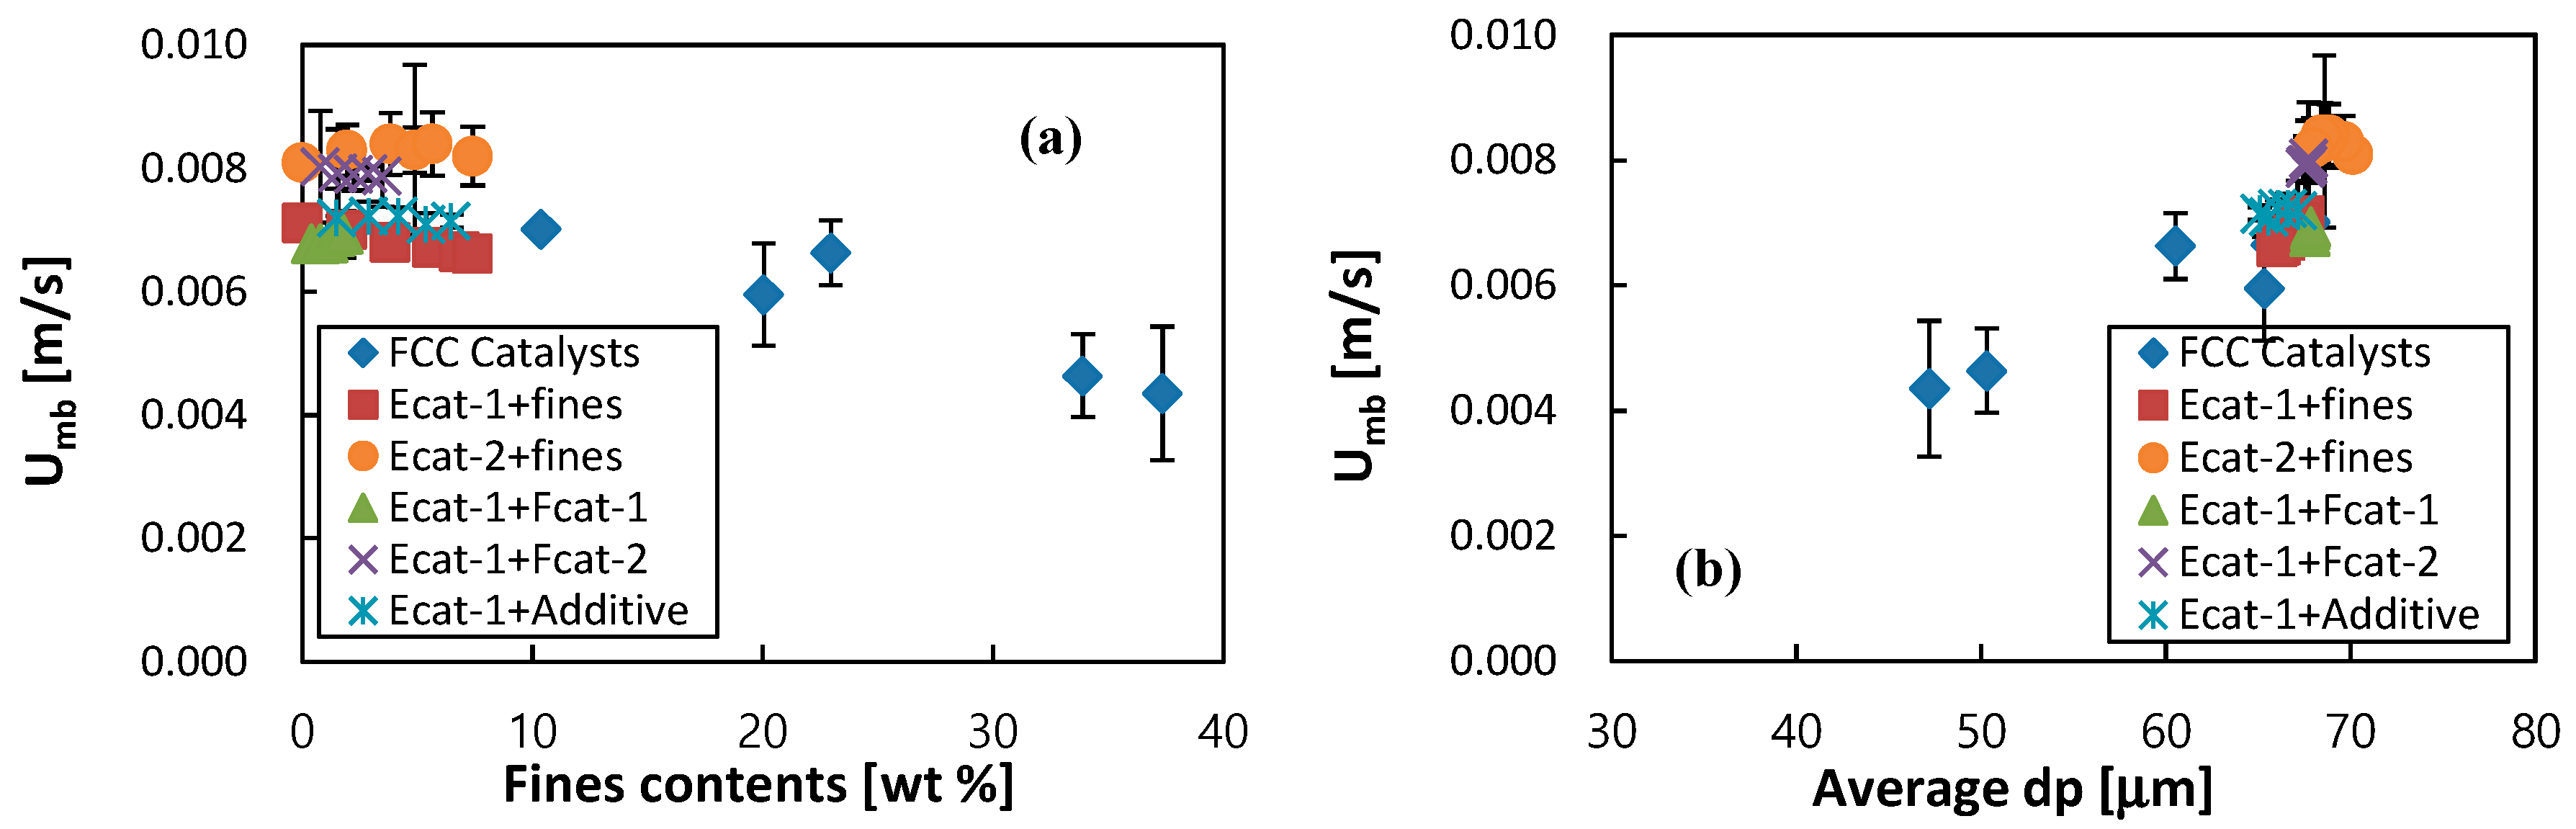
3.1. Effect of Fcat or Additive Make-up on Bed Fluidity
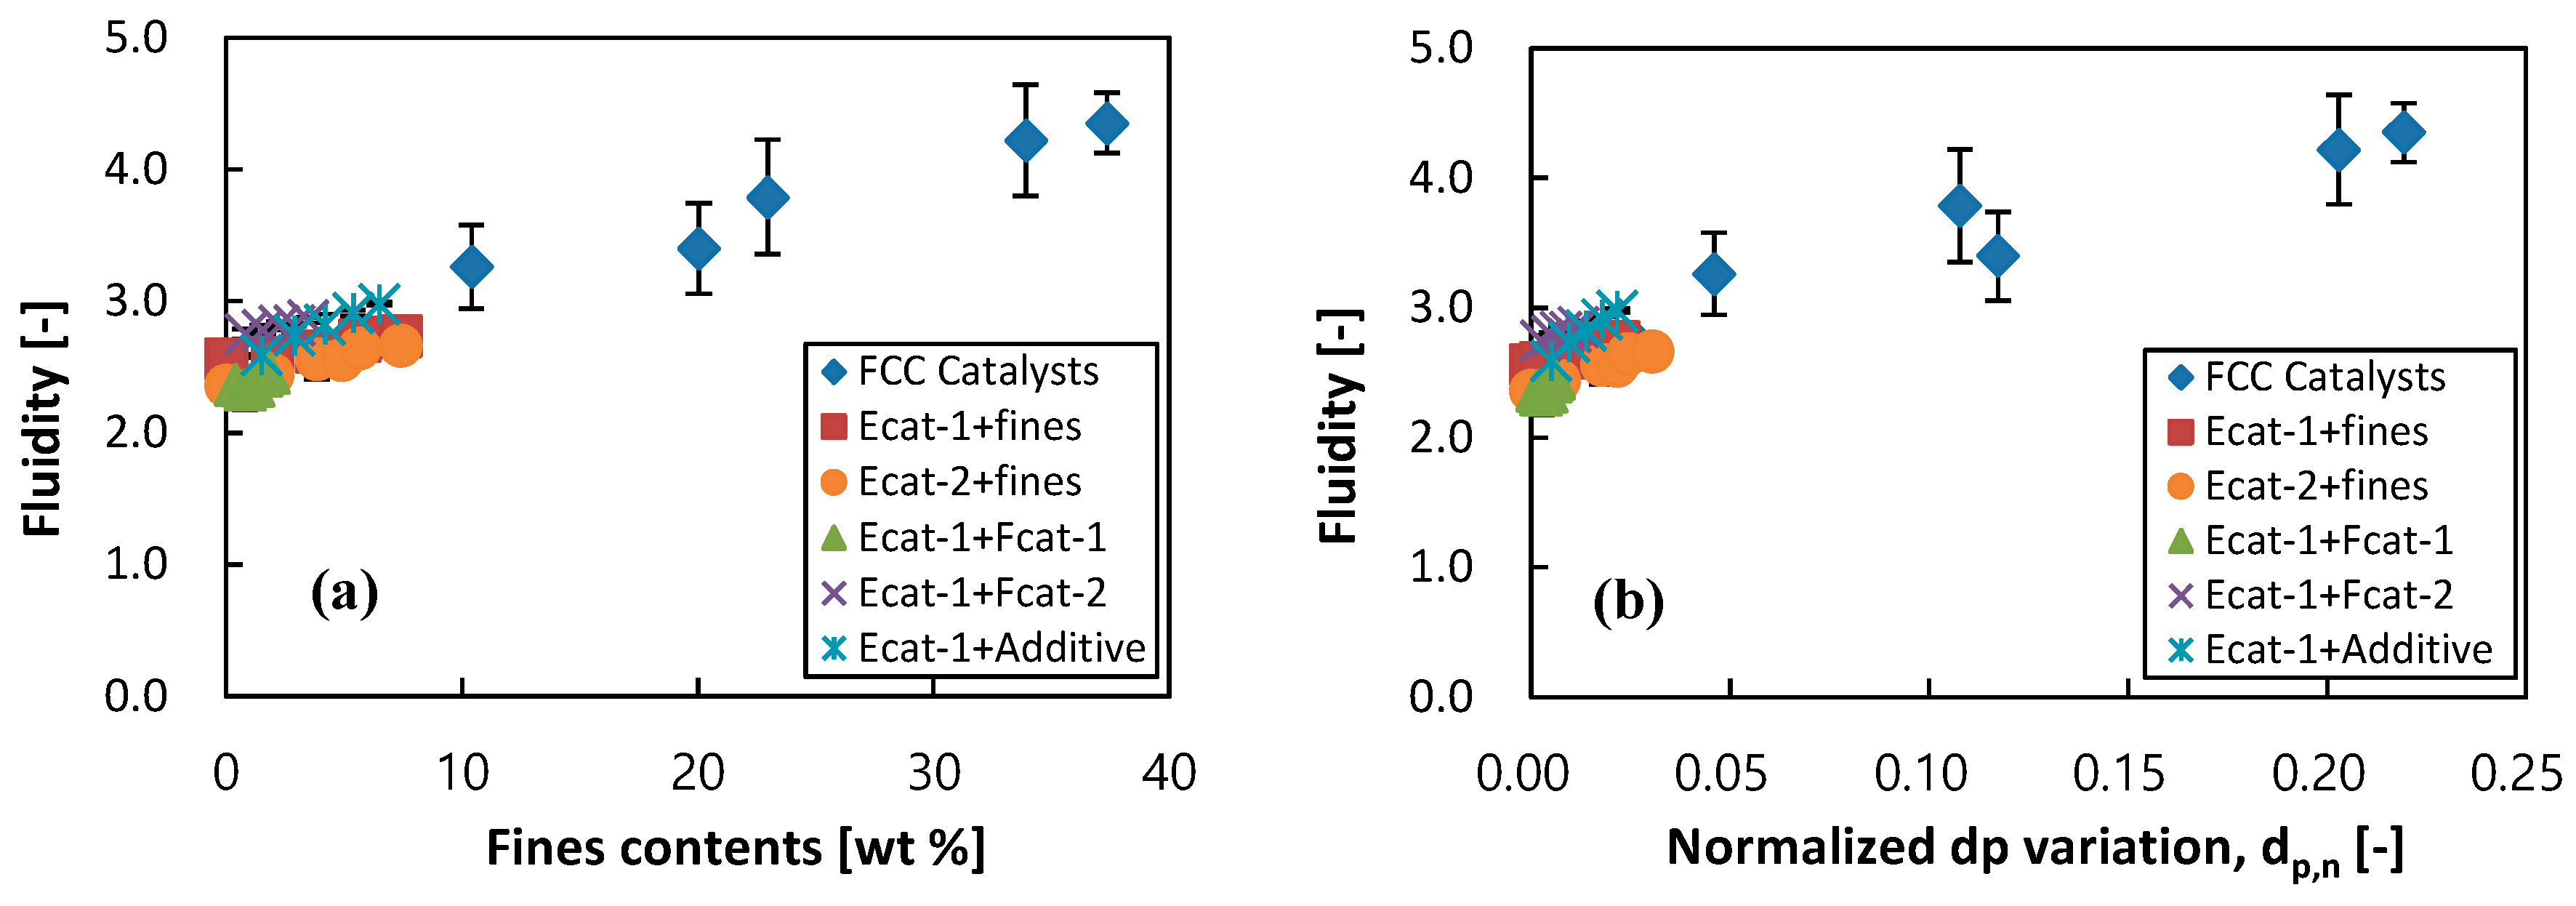
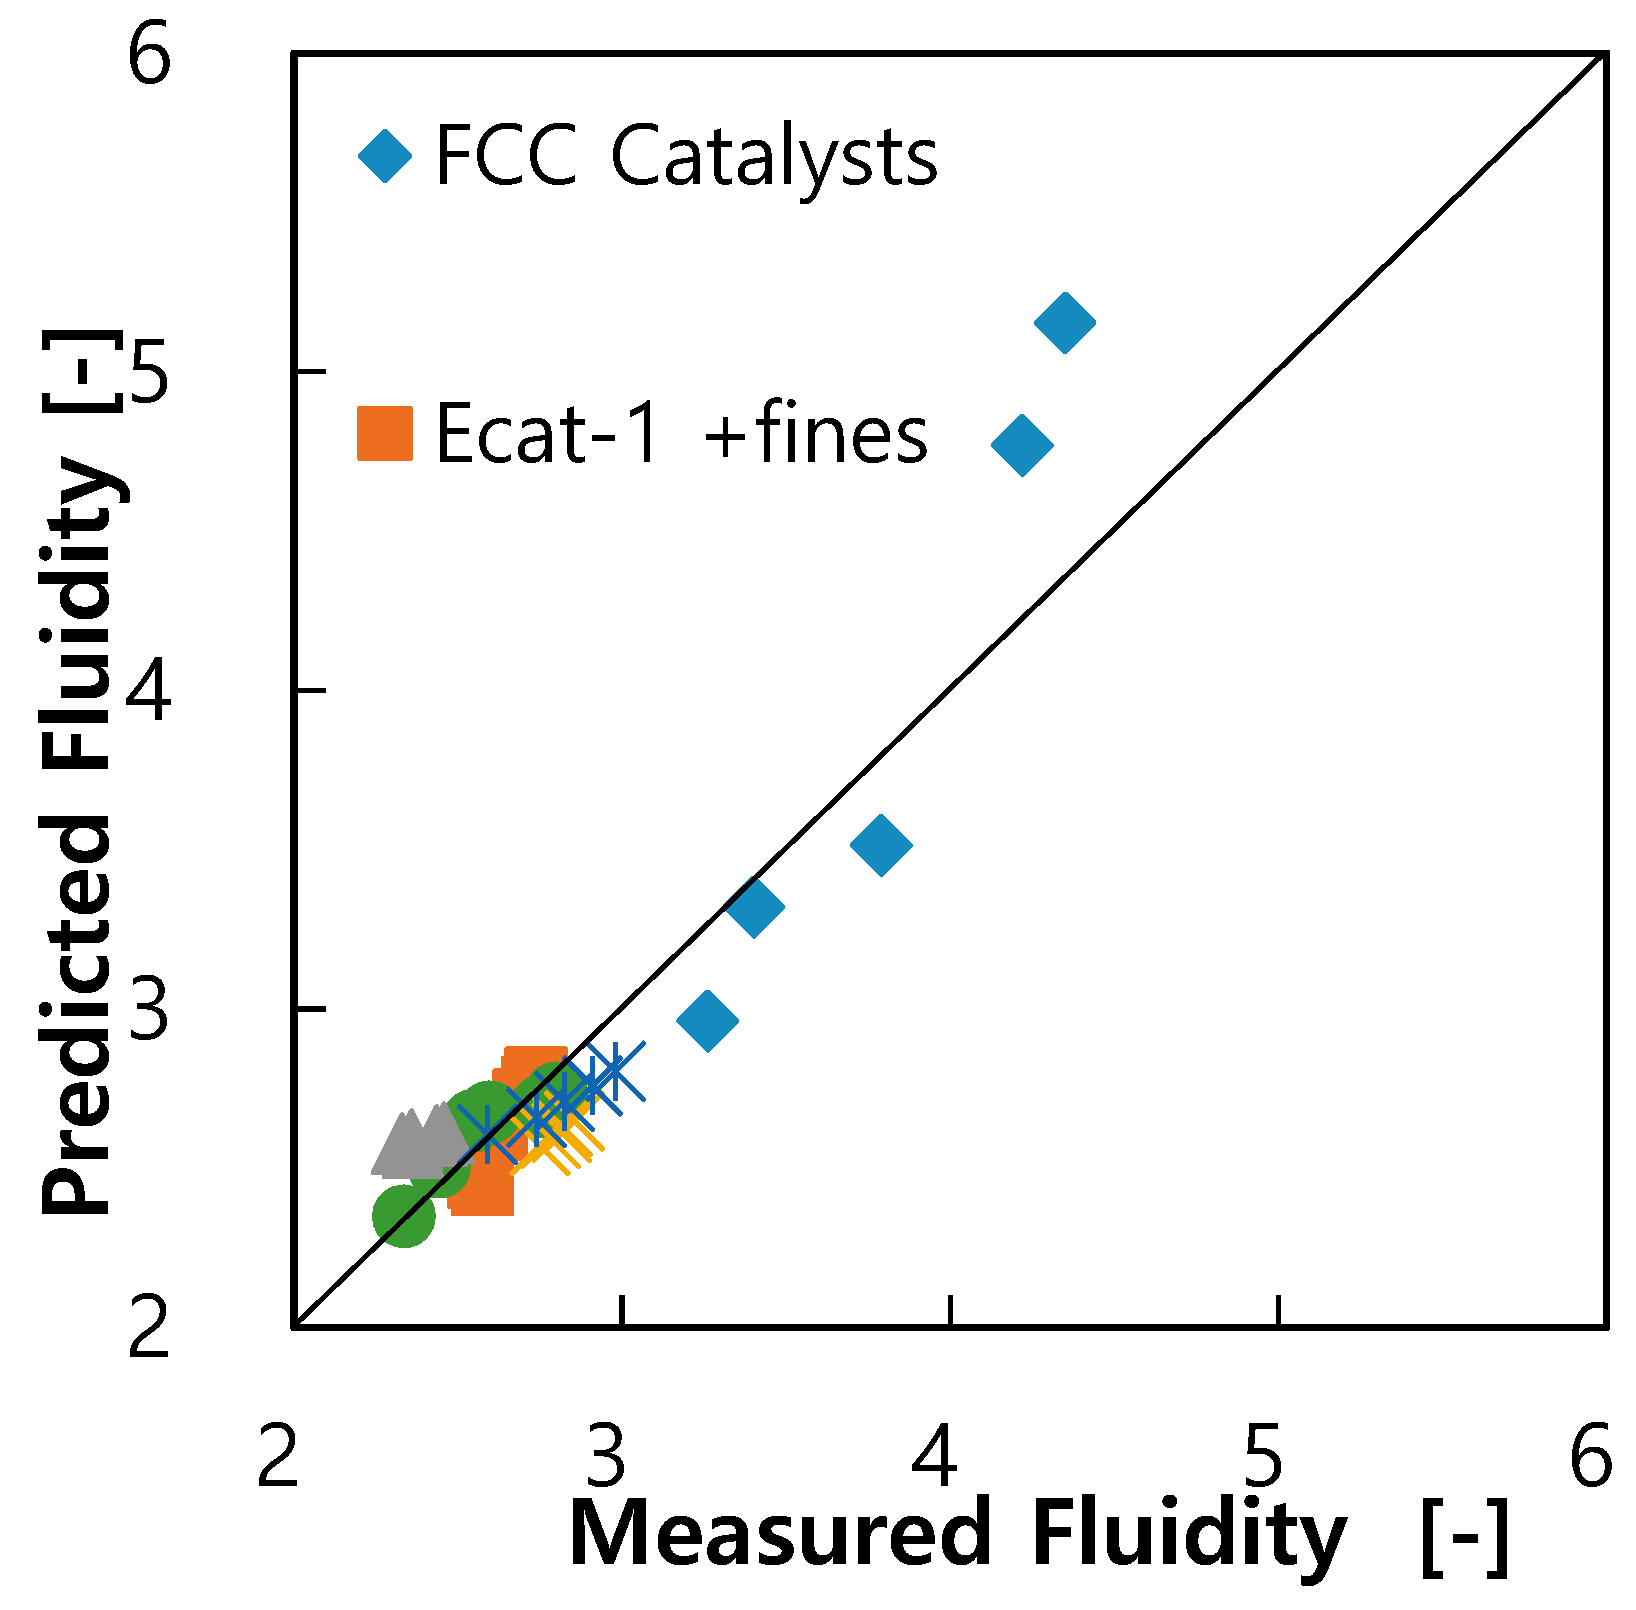
3.2. Correlation on Fluidity of FCC Catalysts
3.3. Guidance for Control of Bed Fluidity
4. Conclusions
Author Contributions
Funding
Acknowledgments
Conflicts of Interest
References
- Kim, S.W.; Kim, S.D. Void Properties in Dense Bed of Cold-Flow Fluid Catalytic Cracking Regenerator. Processes 2018, 6, 80. [Google Scholar] [CrossRef]
- Sadeghbeigi, R. Fluid Catalytic Cracking Handbook, 3rd ed.; Butterworth-Heinemann: Oxford, UK, 2012; pp. 1–42. ISBN 978-0-12-386965-4. [Google Scholar]
- Song, J.; Sun, G.; Chao, Z.; Wei, Y.; Shi, M. Gas flow behavior and residence time distribution in a FCC disengage vessel with different coupling configurations between two-stage separators. Powder Technol. 2010, 201, 258–265. [Google Scholar] [CrossRef]
- Mandal, D.; Sharma, V.K.; Pant, H.J.; Sathiyamoorthy, D.; Vinjamur, M. Quality of Fluidization in Gas-solid Unary and Packed Fluidized Beds: An Experimental Study using Gamma Ray Transmission Technique. Powder Technol. 2012, 226, 91–98. [Google Scholar] [CrossRef]
- Abrahamsen, A.R.; Geldart, D. Behaviour of Gas-Fluidized Beds of Fine Powders Part I. Homogeneous Expansion. Powder Technol. 1980, 26, 35–46. [Google Scholar] [CrossRef]
- Xie, H.-Y.; Geldart, D. Fluidization of FCC Powders in the Bubble-free Regime: Effect of Types of Gases and Temperature. Powder Technol. 1995, 82, 269–277. [Google Scholar] [CrossRef]
- Lettieri, P.; Macrì, D. Effect of Process Conditions on Fluidization. KONA Powder Part. J. 2016, 33, 86–108. [Google Scholar] [CrossRef]
- Whitcombe, J.M.; Agranovski, I.E.; Braddock, R.D. Impact of Metal Ridging on the Fluidization Characteristics of FCC Catalyst. Chem. Eng. Technol. 2002, 25, 981–987. [Google Scholar] [CrossRef]
- Wang, J.; vanderHoef, M.A.; Kuipers, J.A.M. CFD study of the minimum bubbling velocity of Geldart A particles in gas-fluidized beds. Chem. Eng. Sci. 2010, 65, 3772–3785. [Google Scholar] [CrossRef]
- Sande, P.C.; Ray, S. Fine Mesh Computational Fluid Dynamics Study on Gas-Fluidization of Geldart A Particles: Homogeneous to Bubbling Bed. Ind. Eng. Chem. Res. 2016, 55, 2623–2633. [Google Scholar] [CrossRef]
- Brown, G.W. Direct measurement of FCC fluidizability helps spot problems. Oil Gas J. 1990, 15, 46–49. [Google Scholar]
- Singh, R.K.; Roy, G.K. Prediction of Minimum Bubbling Velocity, Fluidization Index and Range of Particulate Fluidization for Gas–solid Fluidization in Cylindrical and Non-cylindrical beds. Powder Technol. 2005, 159, 168–172. [Google Scholar] [CrossRef]
- Chiranjeevi, T.; Ravichander, N.; Gokak, D.T.; Ravikumar, V.; Choudary, N.V. The Selection of Fluid Catalytic Cracking Catalysts and Additives: The Significance of Attrition Studies. Petrol. Sci. Technol. 2014, 32, 470–478. [Google Scholar] [CrossRef]
- Davies, C.E.; Krouse, D.; Carroll, A. A New Approach to the Identification of Transitions in Fluidized Beds. Powder Technol. 2010, 199, 107–110. [Google Scholar] [CrossRef]
- Whitcombe, J.M.; Agranovski, I.E.; Braddock, R.D. Categorisation of Particlulate Emissions from a Fluidised Catalytic Cracking Unit. Part. Part. Syst. Charact. 2004, 21, 463–472. [Google Scholar] [CrossRef]
- Knowlton, T.M.; Karri, S.B.R.; Issangya, A. Scale-up of Fluidized-bed Hydrodynamics. Powder Technol. 2005, 150, 72–77. [Google Scholar] [CrossRef]
- Coltters, R.; Rivas, A.L. Minimum fluidization Velocity Correlations in Particle Systems. Powder Technol. 2004, 147, 34–48. [Google Scholar] [CrossRef]
- Zhong, Y.; Gao, J.; Wang, Z.; Guo, Z. Influence of Particle Size Distribution on Agglomeration/defluidization of Iron Powders at Elevated Temperature. ISIJ Int. 2017, 57, 649–655. [Google Scholar] [CrossRef] [Green Version]
- Kunii, D.; Levenspiel, O. Fluidization Engineering, 2nd ed.; Butterworth-Heinman: Oxford, UK, 1991. [Google Scholar]
- Kim, S.W.; Kim, G.R.; Shin, J.W.; Yoo, I.S.; Kang, H.S.; Park, S.H. Fluidization Technology for Stable Startup of Commercial FCC Unit; Fluidization XIII; Kim, S.D., Kang, Y., Lee, J.K., Seo, Y.C., Eds.; ECI: Gyeong-ju, Korea, 2010; pp. 773–780. [Google Scholar]
- Kim, S.W.; Kim, S.D. Heat transfer characteristics in a pressurized fluidized bed of fine particles with immersed horizontal tube bundle. Int. J. Heat Mass Transfer 2013, 64, 269–277. [Google Scholar] [CrossRef]
- Kim, S.W. Measurement of Carbon Nanotube Agglomerates Size and Shape in Dilute Phase of a Fluidized Bed. Korean Chem. Eng. Res. 2017, 55, 646–651. [Google Scholar]
- Kim, S.W. Pyrolysis Conditions of Biomass in Fluidized Beds for Production of Bio-oil Compatible with Petroleum Refinery. J. Anal. Appl. Pyrolysis. 2016, 117, 220–227. [Google Scholar] [CrossRef]

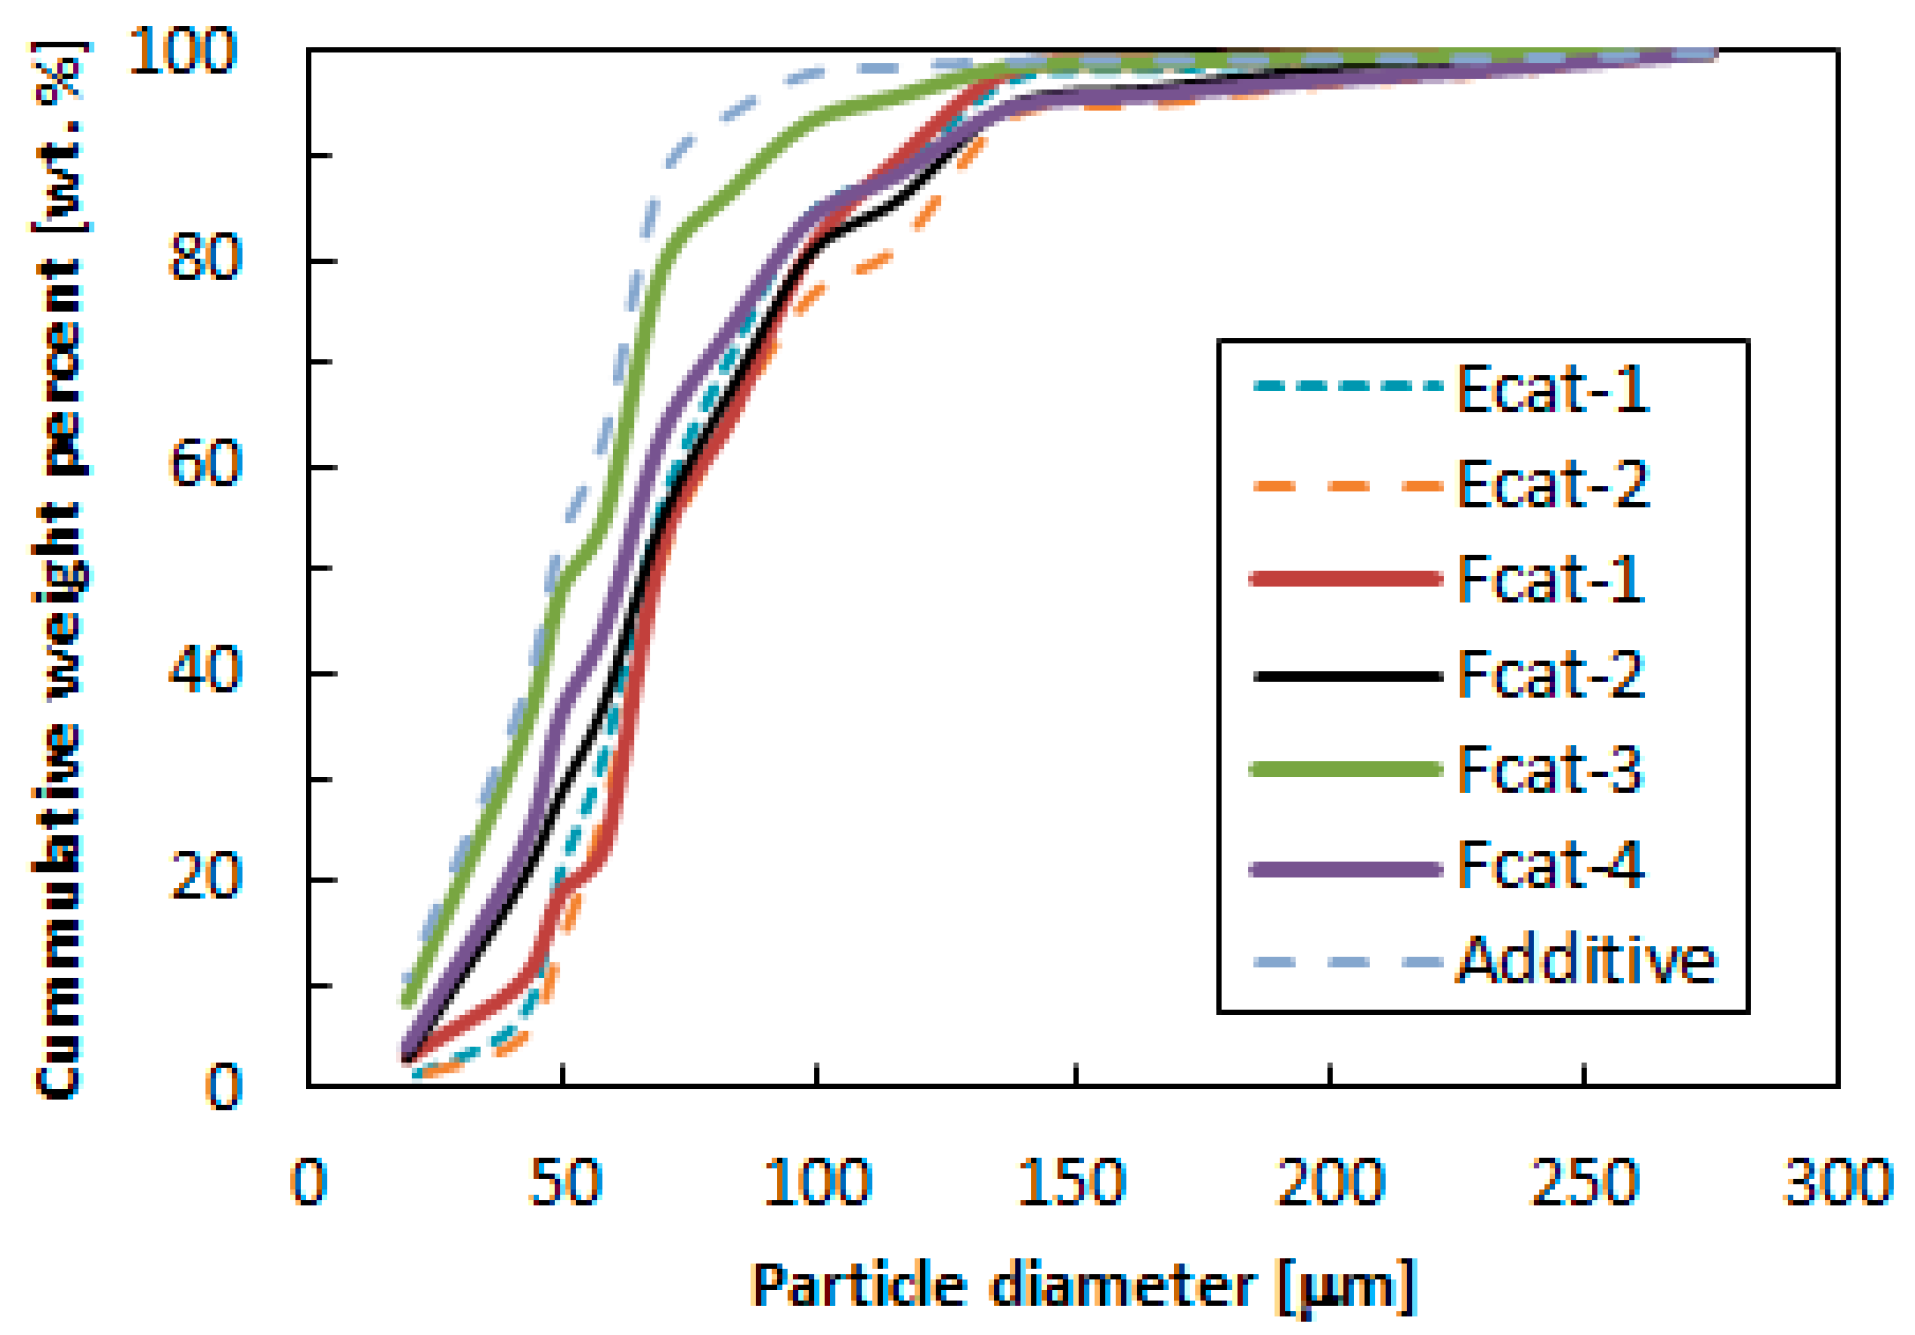
| FCC Catalysts | Average Particle Diameter, dp [m] (a) | dp,45+ [m] (a) | Fine Contents [wt. %] | Apparent Density, p [kg/m3] (b) |
|---|---|---|---|---|
| Ecat-1 | 65.7 | 67.5 | 6.8 | 1647 |
| Ecat-2 | 68.6 | 70.1 | 4.9 | 1646 |
| Fcat-1 | 67.8 | 71.1 | 10.4 | 1402 |
| Fcat-2 | 65.3 | 74.0 | 20.0 | 1608 |
| Fcat-3 | 50.3 | 63.1 | 33.9 | 1580 |
| Fcat-4 | 60.5 | 67.8 | 23.0 | 1720 |
| Additive | 47.2 | 60.5 | 37.4 | 1625 |
| SET | Method | Remark |
|---|---|---|
| 1 | Measurement with 7 FCC catalysts in Table 1. | Effect of physical properties. |
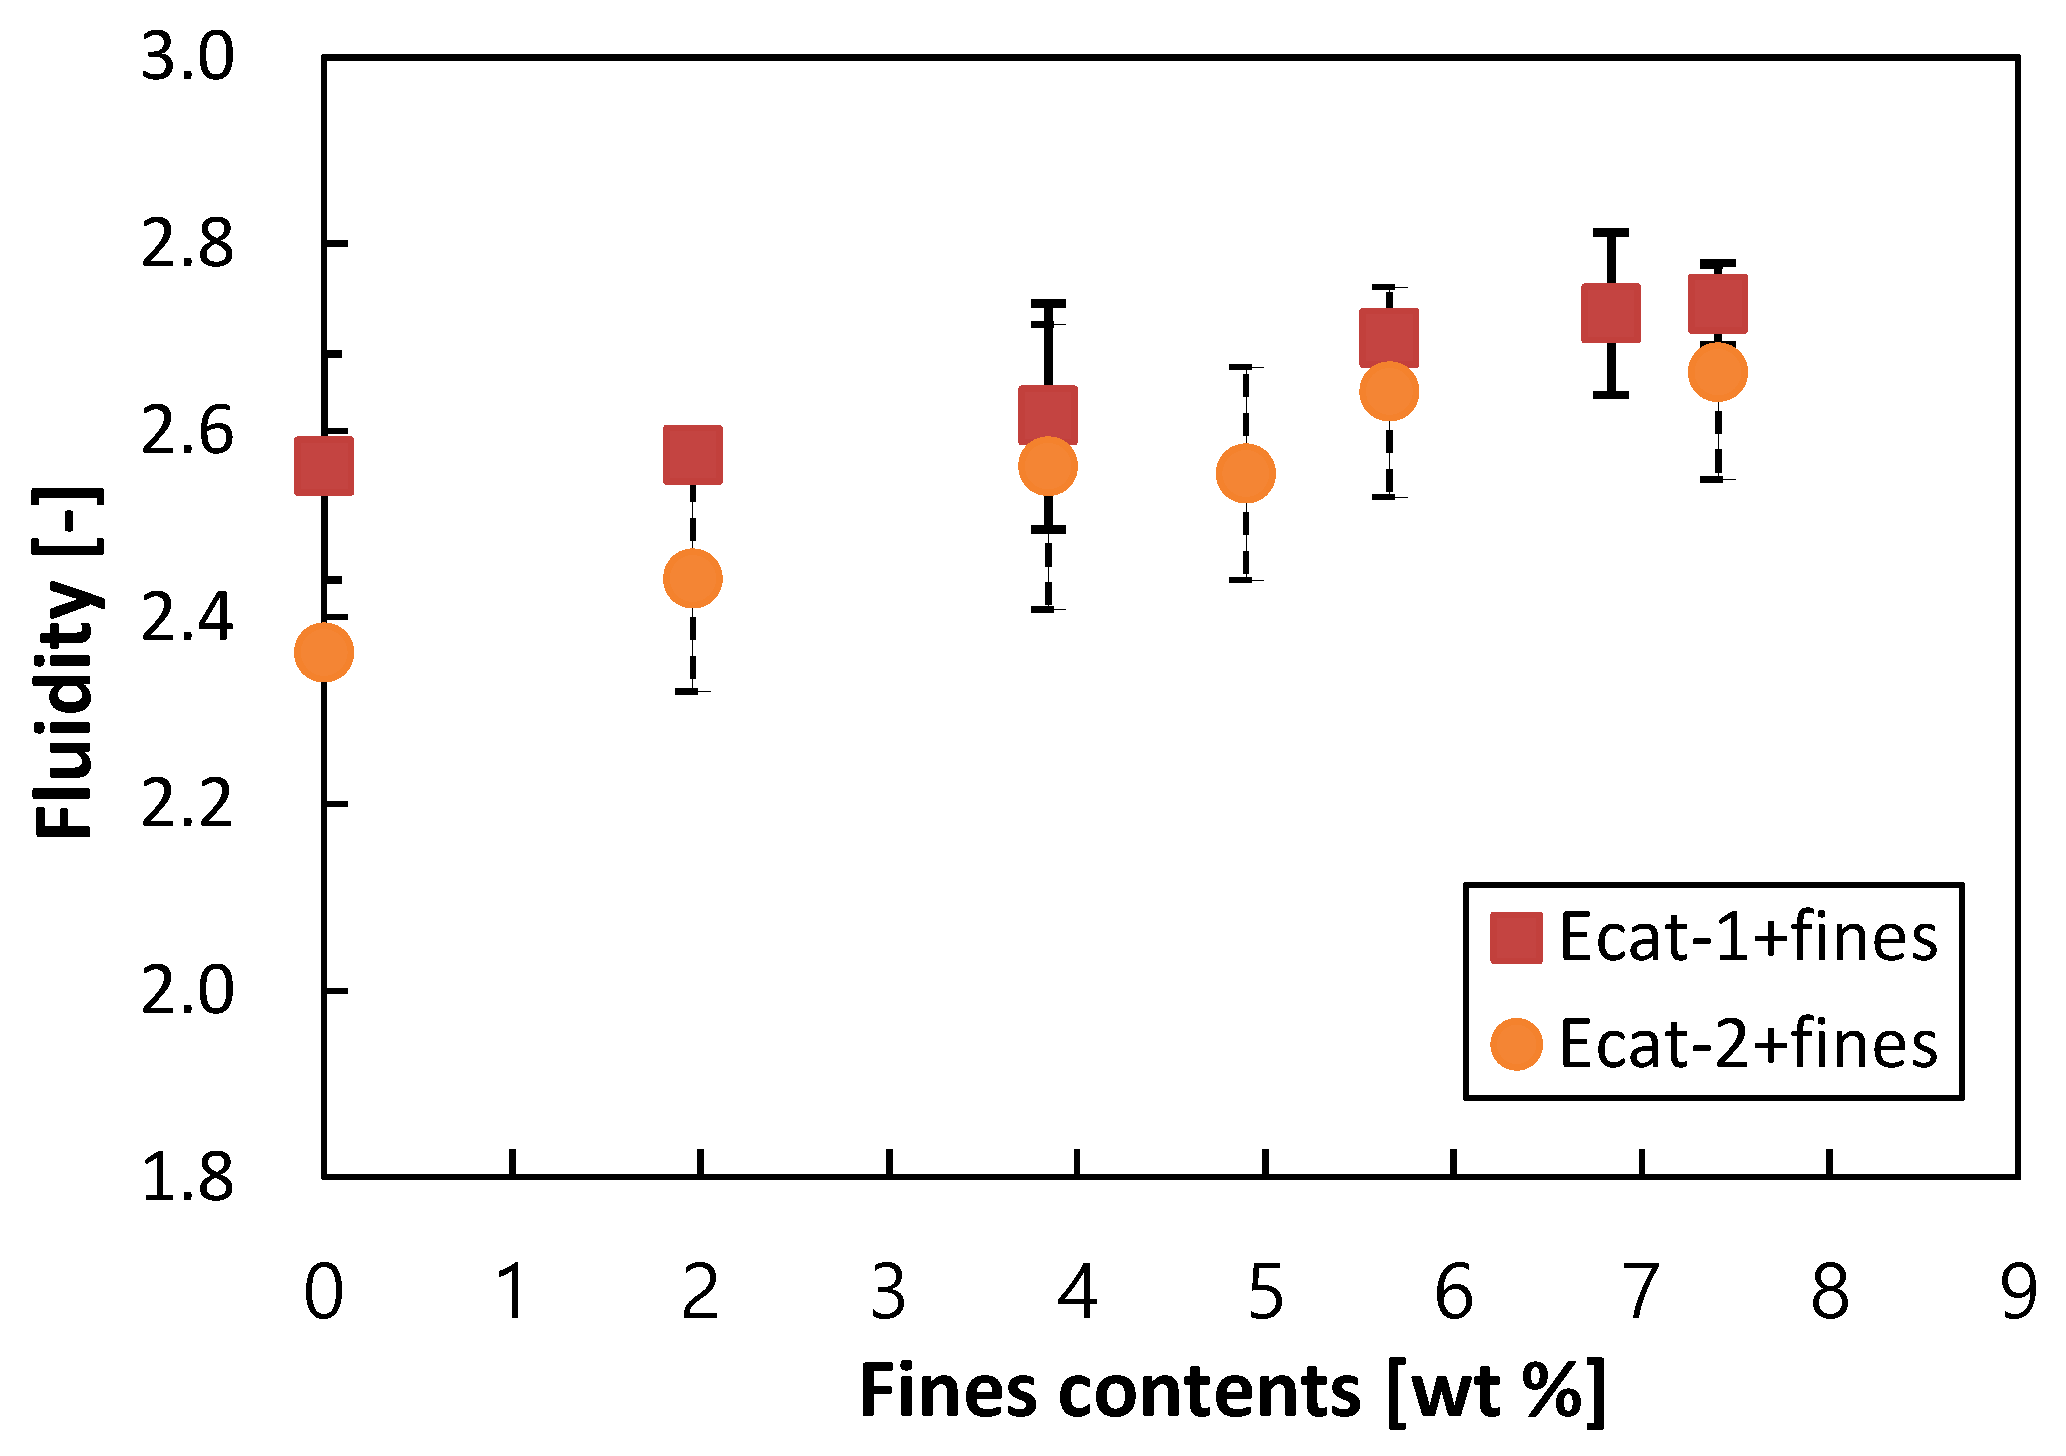
| 2 | Measurement with the Ecat bed with controlled fines content by (1) adding fines to Ecat-1 without fines. (2) adding fines to Ecat-2 without fines. | Effect of fines contents in Ecats. |
| 3 | Measurement with the Ecat bed with controlled Fcat content by (1) adding Fcat-1 to Ecat-1 without fines. (2) adding Fcat-2 to Ecat-1 without fines. | Effect of Fcats make-up in Ecat bed without fines. |
| 4 | Measurement with the Ecat bed with controlled additive content by adding additive to Ecat-1 without fines. | Effect of additive make-up in Ecat bed. |
© 2019 by the authors. Licensee MDPI, Basel, Switzerland. This article is an open access article distributed under the terms and conditions of the Creative Commons Attribution (CC BY) license (http://creativecommons.org/licenses/by/4.0/).
Share and Cite
Kim, S.W.; Yeo, C.E.; Lee, D.Y. Effect of Fines Content on Fluidity of FCC Catalysts for Stable Operation of Fluid Catalytic Cracking Unit. Energies 2019, 12, 293. https://doi.org/10.3390/en12020293
Kim SW, Yeo CE, Lee DY. Effect of Fines Content on Fluidity of FCC Catalysts for Stable Operation of Fluid Catalytic Cracking Unit. Energies. 2019; 12(2):293. https://doi.org/10.3390/en12020293
Chicago/Turabian StyleKim, Sung Won, Chae Eun Yeo, and Do Yeon Lee. 2019. "Effect of Fines Content on Fluidity of FCC Catalysts for Stable Operation of Fluid Catalytic Cracking Unit" Energies 12, no. 2: 293. https://doi.org/10.3390/en12020293