Article

Sensitivity Analysis of Multistage Compressor Characteristics Under the Spray Atomization Effect Using a CFD Model

1
College of Power and Energy Engineering, Harbin Engineering University, Harbin 150001, China
2
Harbin Marine Boiler and Turbine Research Institute, Harbin 150001, China
*
Author to whom correspondence should be addressed.
Energies 2019, 12(2), 301; https://doi.org/10.3390/en12020301
Submission received: 22 November 2018 / Revised: 12 January 2019 / Accepted: 15 January 2019 / Published: 18 January 2019
(This article belongs to the Section J: Thermal Management)

Abstract

:
In this paper, a CFD model is used to simulate the effect of spray atomization at the compressor inlet on a multistage axial subsonic compressor. Special attention is paid to the change of compressor characteristics with wet compression under different rotating speeds to gain the compressor characteristic lines of wet compression. The effects of pneumatic crushing and blade-wall-collision on water droplets and droplet trajectories are contrasted and analyzed under different spray conditions. Then, the whole/stage-by-stage compressor performances and the flow field are also investigated under dry and wet cases near the design operating condition. The results indicate that multistage compressor performance can be improved with wet compression under the proper water spaying rate and a small droplet size. The influence of pneumatic crushing on the water droplets below 20 μm can be ignored, and the effect of blade collision on water droplets above 5 μm should be considered in the wet compression conditions. Compared to the dry compression, as measured by volume flow, wet compression with proper spaying conditions makes the front stages operate within a relatively high flow range and the back stages operate within a relatively low flow range. Additionally, the operating state with wet compression is opposite to the compressor operating near the surge boundary, which presents the phenomenon of “former surged and back blocking”.

1. Introduction

As one of the components of the gas turbine, the consumption of the compressor accounts for 1/2 to 2/3 of the expansion work of the turbine [1]. The environmental temperature increase will inevitably lead to the air specific volume rising, density dropping, and mass flow increasing inside the gas turbine, and then make the compressor power consumption increase, the net output work, and the thermal efficiency of the gas turbine drop obviously [2]. Most of the gas turbine output power decline of about 0.54%~0.90% is due to per a 1 °C rise of the environmental temperature [3,4]. Reducing the compressor power consumption is significant to improving the gas turbine output. Using a conventional air inlet cooling cycle and an intermediate cooling cycle can effectively improve the output power of the gas turbine, but may cause a decreasing of the efficiency [5,6]. The wet compression technique has recently been considered an effective technique to enhance the gas turbine performance [7]. Spray atomization at inlet or inter-stage positions in the compressor results in heat and mass transfer between air/droplet two phase. It was important that the output power and thermal efficiency of the gas turbine was improved after spray cooling [8].
So far, the wet compression technique has been studied by using the theoretical method, experimental method, and Computational Fluid Dynamics (CFD) method. The studies showed that this technique was successfully applied to improve the gas turbine performance [9,10,11,12]. The wet compression technique was first proposed by Kleinschmidt in 1947 [13]. Wetzel and Jennings proved that the compression power consumption decreased by means of theoretical studies and analyses over the wet compression process in 1949 [14]. According to the injecting position, inlet fogging and interstage fogging in the compressor are widely used and both methods need further research and investigation. Horlock et al. [15] analyzed the change of compressor capability with spray atomization by using a one-dimensional analysis method, and then expounded the effect of water droplet evaporation and cooling on the compressor performance. Moon et al. [16,17,18] concluded that the spray atomization was of great significance for multiphase flow characteristics. Bhargava et al. [19] studied the change of parameterization on several gas turbines with inlet fogging and overspray technology, and suggested that wet compression with appropriate spraying conditions can largely reduce the compressor power consumption. Lin et al. [20] found that the fluctuation characteristics in the compressor could be controlled by manipulating mist injection conditions. Meher-Homji and Charker et al. [21] suggested that the spraying conditions should be limited because they could affect the surge margin of the compressor and they then conducted in-depth research on the inlet fogging system. Härtel et al. [22] pointed out that the effect of spray atomization in a low-efficiency compressor would be even more significant. Bardon et al. [23,24] indicated that the alcohol could be used as a coolant jetting into the compressor so that the compressor power consumption decreased, and the rest of the alcohol at the compressor outlet could then be used as fuel in the combustor. Hill and Zheng et al. [1,25] established the thermodynamic wet compression model, showing the reduction of compressor work and the water droplets evaporation process. Overspray and interstage fogging on a stage-by-stage performance have been studied by Wang and Khan [26,27] and they gained positive overall compressor performance results. Abdelwahab et al. [28] discussed the wet compression performance on the centrifugal compressor and pointed out that in the case of a large water injecting rate, problems such as excessive erosion and torque braking of the blade could be avoided by using a relatively smaller size. Kim et al. [29] discussed restriction on the use of a compressor spray cooling device and analyzed a continuous wet compression cooling process. They pointed out that the water droplet injecting rate should be controlled in the range of 0.5% to 2% mass flow, which can be restricted by the compressor operating range. Sun and Zheng et al. [8,30] studied the effect of inlet fogging on a single stage axial compressor and found that inlet fogging could be used as a control technique for the separation flow on the blade. Following this, they analyzed the mechanism of impingement between water droplets and the blade. Luo and Zheng et al. [31,32] found that injecting water could be used as an effective method to improve compressor stability.
Most of the predecessors’ research focused on the compressor performance change with wet compression, but showed little research about the effects of wet compression on the compressor under different operating conditions. It is necessary to explain the impact of aerodynamic force and impinge with the wall on the injecting water droplets. Additionally, the compressor characteristic with wet compression on stage-by-stage performance needs to be researched thoroughly. In this paper, the effect of water injection on the performance of a multistage axial compressor under different rotational speeds has been investigated by using a numerical simulation method. The changes of compressor characteristic line, water droplet trajectory, pneumatic crushing, and collision on wall, as well as the performance parameters of stage-by-stage in the multistage compressor, are investigated and discussed by the software ANASYS CFX. The change of flow field contours, limiting streamlines, has been studied under different water injecting rates and droplet sizes.

2. Numerical Research Methods

2.1. Numerical Model

A constant exchange of heat, mass, and momentum between water droplets and surrounding air occurs when the water mist is injected into the compressor. Water droplets absorb heat from the air and are vaporized to cooling surrounding air, and the water vapor then enters the air stream and forms the wet air mixture. In numerical simulation, the water droplets and wet air mixture are defined as the dispersed phase and continuous phase, respectively. The impact of two-phase coupling is based on the heat, mass, and momentum transfer equations. In this paper, the Eulerian-Lagrangian multiphase flow model was adopted to solve the two-phase coupling process. The continuous phase control equation relating to the wet air mixture was solved by the Euler method and the discrete phase control equation relating to the water droplets was solved by the Lagrangian method. The interaction between the two phases is coupled by the source term of mass, momentum, and energy. Figure 1 shows the coupling process between the dispersed phase and continuous phase in the compressor. Then, the governing equations [8,30,32] are written as follows:

2.1.1. Governing Equations of the Continuous Phase

(1) The mass control equation of the continuous phase
ρ t + · ( ρ u ) = S m
where ρ is the density and u is the velocity of the continuous phase. The source term S m represents the mass transfer from the dispersed phase to the continuous phase due to the vaporization of water droplets.
(2) Momentum control equation of the continuous phase
t ( ρ u ) + · ( ρ u u ) = p + · ( τ = ) + F
where p represents the static pressure of the continuous phase and the vector F is referred to as external body forces which represent the momentum transfer between the water droplets and wet air mixture.
The symbol τ = represents the viscous shear stress tensor given by
τ = = μ [ ( u + u T ) 2 3 · u I ]
where μ is the dynamic viscosity and I is the unit tensor.
(3) Energy control equation of the continuous phase
t ( ρ h t ) + · ( u ( ρ h t + p ) ) = · ( λ T + ( τ = · u ) ) + u · F + S h
where h t and λ are defined as the total enthalpy and thermal conductivity, respectively. S h is the heat source, which represents the energy exchange between the dispersed phase and the continuous phase. Total enthalpy h t is related to static enthalpy h , which is given by
h t = h + u 2 2

2.1.2. Governing Equations of the Dispersed Phase

(1) The motion equation of the dispersed phase
m p d u p d t = F D + F R + F B + F G + F P
where m p and u p are defined as the mass and velocity of the water droplets, respectively. F D shows the drag force acting on the particle; F R contains the centrifugal and Coriolis forces acting on the dispersed phase; F B is buoyancy item due to the impact of droplets gravity; and F G and F P show the virtual mass force and pressure gradient force of the dispersed phase, respectively.
During the numerical simulation, compared to the drag force item and rotating force item, the buoyancy item F B is so small on several orders of magnitude that it can be ignored. The effects of the virtual force and pressure gradient force are obvious in the case that there is not much difference in density between the two phases or the case that the density of the continuous phase is much larger than that of the dispersed phase, so these two items can be ignored. The motion equation of the dispersed phase in Lagrange coordinates can be simplified as follows:
m p d u p d t = F D + F R
The drag force item F D and rotating force item F R can be written as follows:
F D = C D ( u u p )
F R = m p [ ω × ( ω × r ) 2 ω × u p ]
where ω and r are defined as the rotating speed and position vector, respectively. C D is the drag coefficient.
The Reynolds number of disperse phase is determined by an equation as follows:
R e p = ρ d p | u p u | μ
where d p is the water droplet size. The Reynolds number of the dispersed phase is different in different regions and the drag coefficient C D changes along with the dispersed phase Reynolds number. Then, the value of C D can be determined by the following law:
In the viscous region, R e p < 0.1 ,
C D = 24 / R e p
In the transitional region, 0.1 < R e p < 1000 ,
C D = max ( 24 / R e p ( 1 + 0.15 R e p 0.687 ) , 0.44 )
In the inertial region, 1000 R e p ,
C D = 0.44
(2) Heat transfer equation of the dispersed phase
The heat transfer equation between the continuous and discrete phases is defined as follows:
m p C w d T p d t = π d p λ N u ( T T p ) + d m p d t h f g
where C w represents specific water droplets, and λ is the heat conductivity of the surrounding air continuous phase. Symbols T and T p are defined as the continuous phase and discrete phase temperature, respectively. The first term on the right side of the equation represents the convective heat transfer between two phases. d m p / d t represents the mass changing rate of the droplets and h f g is the evaporating latent heat item. The second term on the right side shows the influence of latent heat of evaporation between two phases. N u is the Nusselt number and given by
N u = 2 + 0.6 R e 0.5 ( μ C p λ ) 1 / 3
(3) Mass transfer equation of the dispersed phase
The evaporation of water droplets in the compressor is largely affected by the surrounding air/wet air mixture temperature and pressure. In the different cases that water droplets are above and below the boiling state, the evaporation model is different. In this paper, the Antoine equation was used to determine the saturated pressure and the expression is
log 10 p sat = A B T + C 273.15
where A, B, and C are constant coefficients.
The mass transfer in the evaporation model is related to the liquid phase temperature. Above the boiling state, the rate of mass transfer is determined by the convective heat transfer:
d m p d t = π d p λ N u ( T T p ) h f g
Below the boiling state, the rate of mass transfer equation is showed as follows:
d m p d t = π d p ρ v D v S h M v M log ( 1 f p 1 f )
where ρ V and D V represent the vapor density and diffusivity coefficient, respectively. M V and M are respectively representing the molecular weights of the water vapor and wet air mixture in the continuous phase. f p and f are the molar fraction of the water droplets and wet air mixture, respectively. Sh is the Sherwood number and given as follows:
S h = 2 + 0.6 R e 0.5 ( μ ρ v D v ) 1 / 3

2.2. Secondary Aerodynamic Breakup Model of Water Droplet

The CAB model (Cascade Atomization and Breakup) is selected to simulate the aerodynamic breakup of water droplets and it is developed from the TAB (Taylor Analogy Breakup model) model, which assumes that droplet deformation can be described as a spring-mass system of one-dimensional, forced, and damped resonance. Droplet deformation is expressed as dimensionless deformation and can be described as y = 2 ( x / r ) , where, x represents the deviation that the equatorial position of water droplets deformed compared to the original position, and r is the droplet radius and the morphological change under the action of aerodynamic breakup, as shown in Figure 2. Assuming that the droplet viscosity is the damping force, the surface tension is the restoring force, and the pneumatic drag is the external force on the system, the droplet deformation and motion equation can be expressed as
y ¨ = 8 σ ρ p r 3 y + 5 μ p ρ p r 2 y ˙ + 2 ρ g V slip 2 3 ρ p r 2
The particle deformation-time is obtained by integrating the equation above
y ( t ) = W e C + e ( t / t d ) [ ( y 0 W e C ) cos ( ω t ) + 1 ω ( y ˙ 0 + y 0 W e C ω t D ) sin ( ω t )
where,
t D = 2 ρ p r 2 C d μ p , ω 2 = C k σ ρ p r parent , W e C = W e C f C k C b   and   y 0 = y ( 0 ) .
The Weber number is defined as:
W e = ρ V slip 2 d p σ
The CAB model uses the same mechanism of droplet deformation as the TAB model, but the relationship of the droplet breaking process is different. The rate of child droplet generation is proportional to the amount of child droplets:
d ( n t ) d t = 3 K b r ( n t )
The size ratio of child to parent droplets is shown as follows:
r Child r Parent = e K b r t
where K b r is the breakup constant and defined as
K b r = { k 1 ω 5 < W e < 80 k 2 ω W e 80 < W e < 350 k 3 ω W e 3 / 4 350 < W e
The child droplet inherits the vertical velocity component of the parent droplets when the parent droplets are crushed, as shown in the following equation:
u N = A x ˙
where A is a constant and determined by the energy balance.
A 2 = 3 [ 1 r Child r Parent + 5 C D W e / 72 ] ω 2 y ˙ 2
Therefore, the velocity of the child droplet can be determined by the following equation:
u P , child = u P , parent + u N

2.3. Droplets Breakup Model When Impacting on the Blade Surface

In the process of water droplets spraying against the wall, the phenomenon of deposition, splashing, rebounding, and instantaneous evaporation may occur according to the different parameters when the droplet directly collides with the wall surface or the liquid film on the wall [33,34].
According to the spray impact model proposed by Bai and Gossman [34], the impact morphology of the water droplets/blades in the compressor can be categorized as follows:
(1)
Adhesion: water droplets adhere to the wall in a nearly spherical form.
(2)
Rebounding: water droplets bounce off the wall after hitting against it.
(3)
Spread: water droplets spread out on the wall to form a fluid film.
(4)
Splashing: several smaller droplets are formed when the water droplets collide with the wall and some remain on the wall.
W e s is the Weber number of critical crushing, and is defined as:
W e S = A W L a 0.18
where A W is the empirical coefficient relating to wall roughness, and L a is the Laplace number and defined as follows:
L a = ρ p σ D p μ l 2
In the actual situation, there are many complicated factors, such as impact angle, impact velocity, droplet size, and blade material, that influence the size and velocity distribution of new water droplets after the old droplets are crushed with the surface of the blade. In this paper, the axial velocity of the droplets is set as 50 m/s so that the phenomenon of splashing between the droplets and blade is the most violent. According to the different impacting angles, it is assumed that new droplets of a uniform size are formed after the old droplet is impinged with the blade wall proceeding from a simple consideration. The normal and tangential momentum recovery coefficient is set to 0.5 by considering the momentum loss. The equation can be written as follows:
d new d old = { l / 3.0 , 75 α impact , l / 2.5 , 45 α impact 75 , l / 2.0 , 45 α impact 60 , l / 1.5 , 20 α impact 45 , l , α impact < 20 ,

2.4. Calculation Model

2.4.1. Configuration of the Compressor

In this study, an eight-stage subsonic axial compressor is taken as the research object. The compressor consists of 17 blade rows that include one row of the inlet guide vane, eight rows of the rotor blade, and eight rows of the stator blade. The number along the circumferential of the inlet guide vanes is 54, and the numbers along the circumferential of each rotor and stator blades are 43 and 60, respectively. The geometric configuration of the multistage compressor is created by CFX-Bladegen and meshed by CFX-Turbogrid, as shown in Figure 3. In this paper, simulations of dry and wet cases were performed by using a single periodic blade passage. The tip-clearance of each rotor blade is set at a fixed value of 0.4 mm. A 12-layer O-type grid along the span-wise direction over the tip is considered and the multi-block structured grid is adopted to discretize the compressor computational domain. A high-quality H-type grid is used for the inlet and outlet domain and local grid refinement near the leading and trailing edge on the blade was adopted with a consideration of the improving calculation accuracy. According to the grid independence, the total number of grid cells is determined to be about 4.11 million, and the computational element numbers of each stage are shown in Table 1.
The effects of mesh size on the computational results are evaluated. The average static pressure at the compressor exit is set to 343,000 Pa. The medium mesh has 4.11 million grid cells, whereas the fine mesh examined has 9.25 million elements. The mass averaged total pressure is calculated at the compressor outlet along its span. The grid sensitivity has been studied by evaluating the total pressure at the compressor exit along its span, as shown in Figure 4. The maximum difference between the calculated values of total pressure using two different mesh sizes examined for the eight-stage compressor geometry is only 0.1%. Therefore, the two baseline meshes are considered sufficiently refined in order to obtain results which are independent of the grid size. To minimize the computational time, the medium mesh has been used for considering the eight-stage compressor in this study.

2.4.2. Turbulence Model and Boundary Conditions

The standard κ-ε turbulence model [32,33] is adopted to calculate the turbulent in this study, which is a two-path turbulence model proposed by Launder and Spalding [35] in 1972. The model has a good stability and computation accuracy advantage, so is widely used in engineering calculations.
There is a large velocity gradient in the normal direction of the fluid near the wall flow and two methods are usually used to calculate the flow field near the wall area. One uses the wall-function method and the other encrypts the grid near the wall area. Selection of the two methods should be judged by the dimensionless wall distance parameter y+, and the equation of y+ is as follows:
y + = ρ Δ y u τ μ
where u τ = τ ω / ρ is the friction velocity; τ ω is the wall shear stress; Δ y is the wall distance; and ρ and μ represent the density and dynamic viscosity coefficient of the fluid, respectively.
The region of y+ < 5 at the boundary layer is called the viscous sub-layer and is usually used with the encrypting grid near wall area, which requires a large amount of calculation [36]. In this paper, the wall-function method that is widely used in industrial flow problems is adopted instead of paying attention to the details of the viscous sub-layer and 30 < y+ < 300. The Scalable wall functions can be consistent solutions for any encrypted grid and avoid the deterioration of computing results when y+ < 15 [37].
The total pressure and total temperature at the inlet and the circumferential averaged static pressure at the outlet are given in the boundary conditions of the eight-stage axial compressor. Before spray, the mass flow rate of dry air is 44 kg/s and the total pressure ratio is 4.03 when the compressor operates at the design point. No slip and adiabatic conditions are specified on the hub, shroud, and blade wall. The mixing approximation method is used to exchange the data of interfaces between two adjacent domains in the steady simulation. For the wet cases, water injects at the compressor inlet in the form of a random position and the water diameter distribution follows the regular one of Rosin-Rammler. The injecting rate is defined as the ratio of the mass flow rate of water mist to that of dry air. Details of the boundary conditions are given in Table 2 above.

3. Results and Discussions

A suitable turbulence model should be selected carefully to simulate the complicated turbulent flows accurately in the multistage axial subsonic compressor. The κ-ε turbulence model is chosen for its extensive validation in a wide range of flows, with the scalable wall function for the treatment of the near-wall flow regions, as shown in Figure 5.
It can be seen that under 6180 rpm, the total pressure ratio shows a small difference in the whole mass flow region. The performance of the left line near the stall condition of the κ-ε model is consistent with the experimental data and the performance of the right line near the chocking condition is also compatible due to a very small difference in mass flow. Thus, the numerical results are considered to be in reasonably good agreement with the available actual compressor performances and the κ-ε turbulence model for numerical computation is reasonable in this study.
In this numerical simulation study, it is assumed that the water droplets are impinged with the blade surface and then break into small droplets (the droplets impacting angle described in Section 2.3 was mainly considered in the method of discrete phase impacting on the blade wall). When considering the water droplets momentum loss during the process of droplets impact on the blade surface, the perpendicular and parallel coefficients were set to 0.5. The CAB model described in Section 2.2 using one of the secondary aerodynamic breakup models is adopted in this paper.

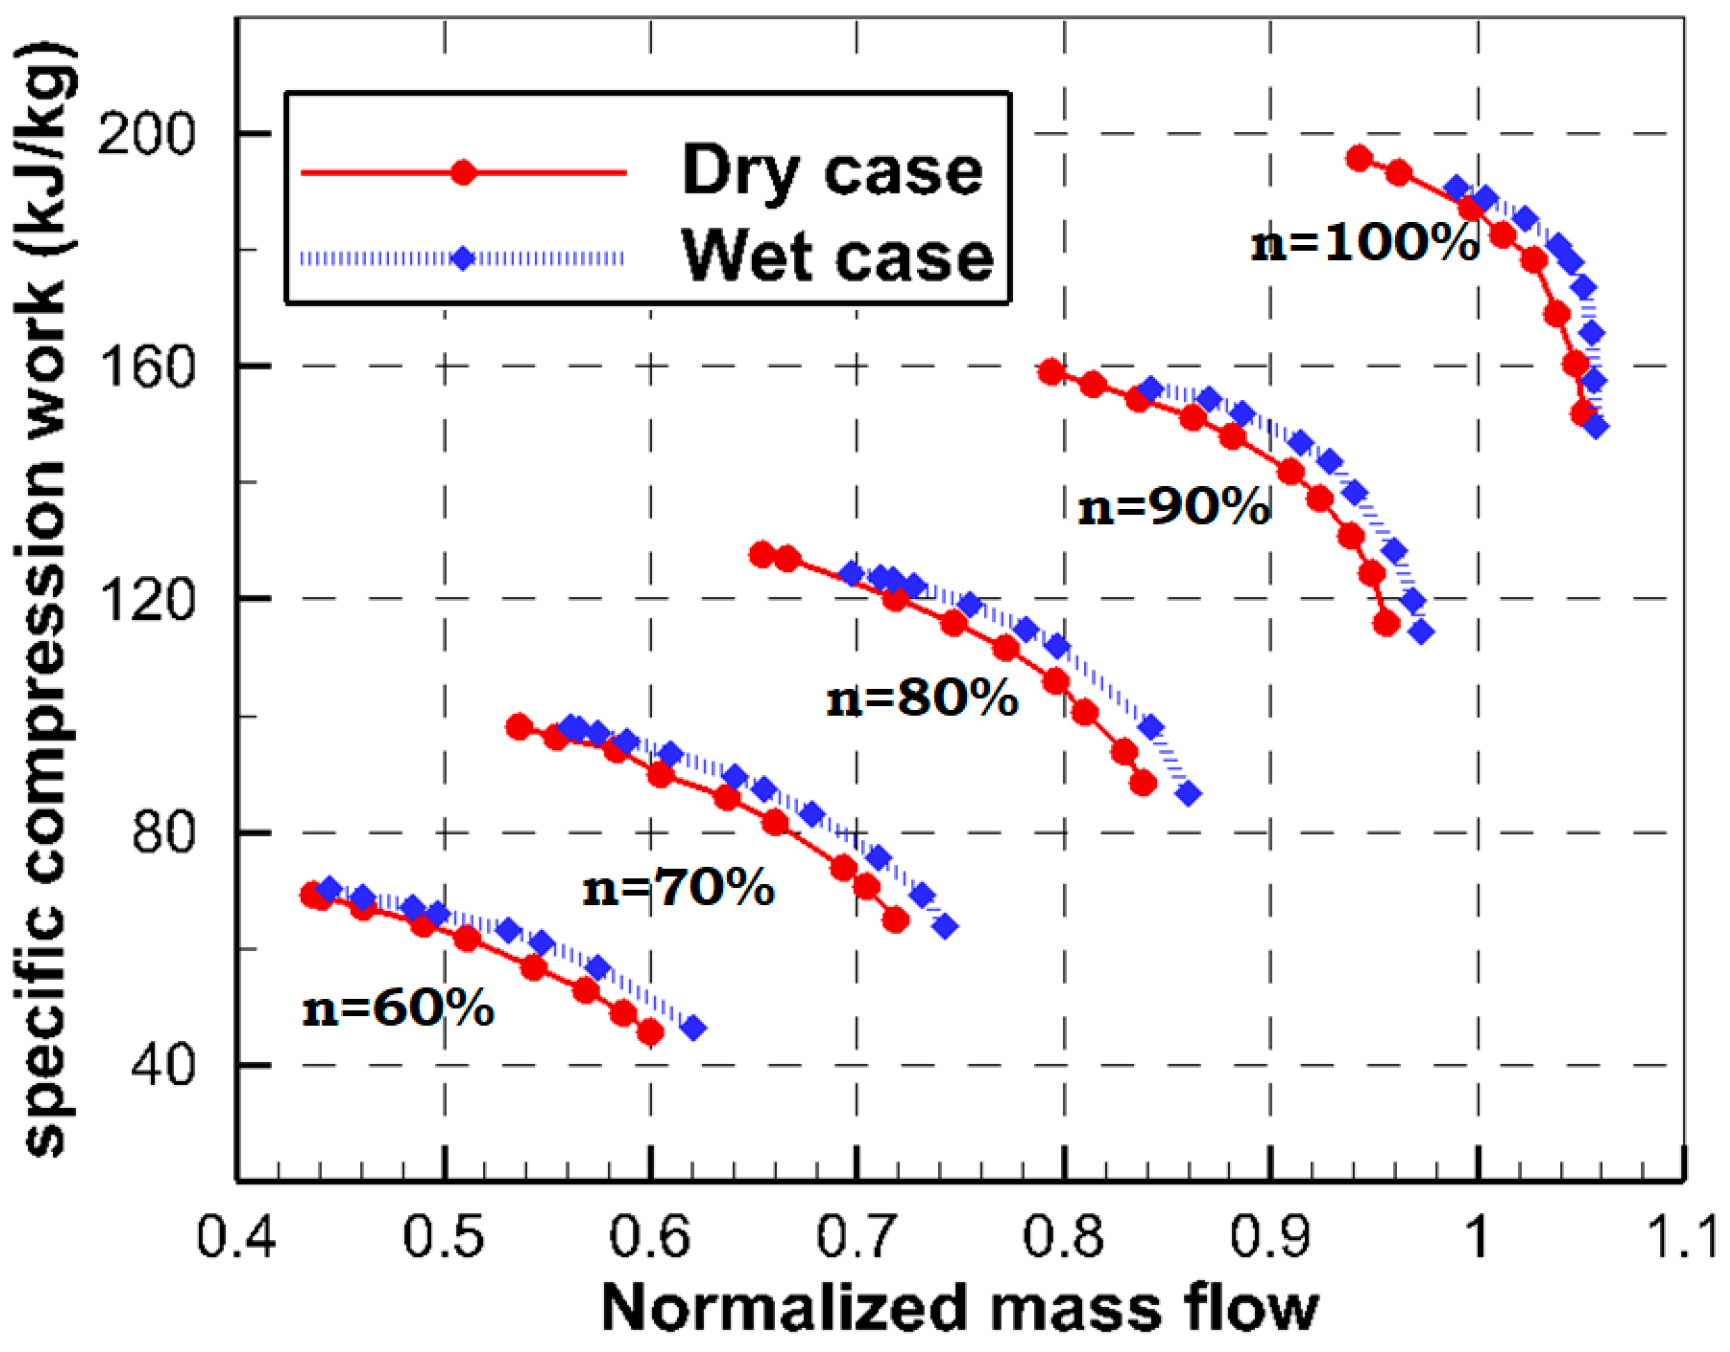
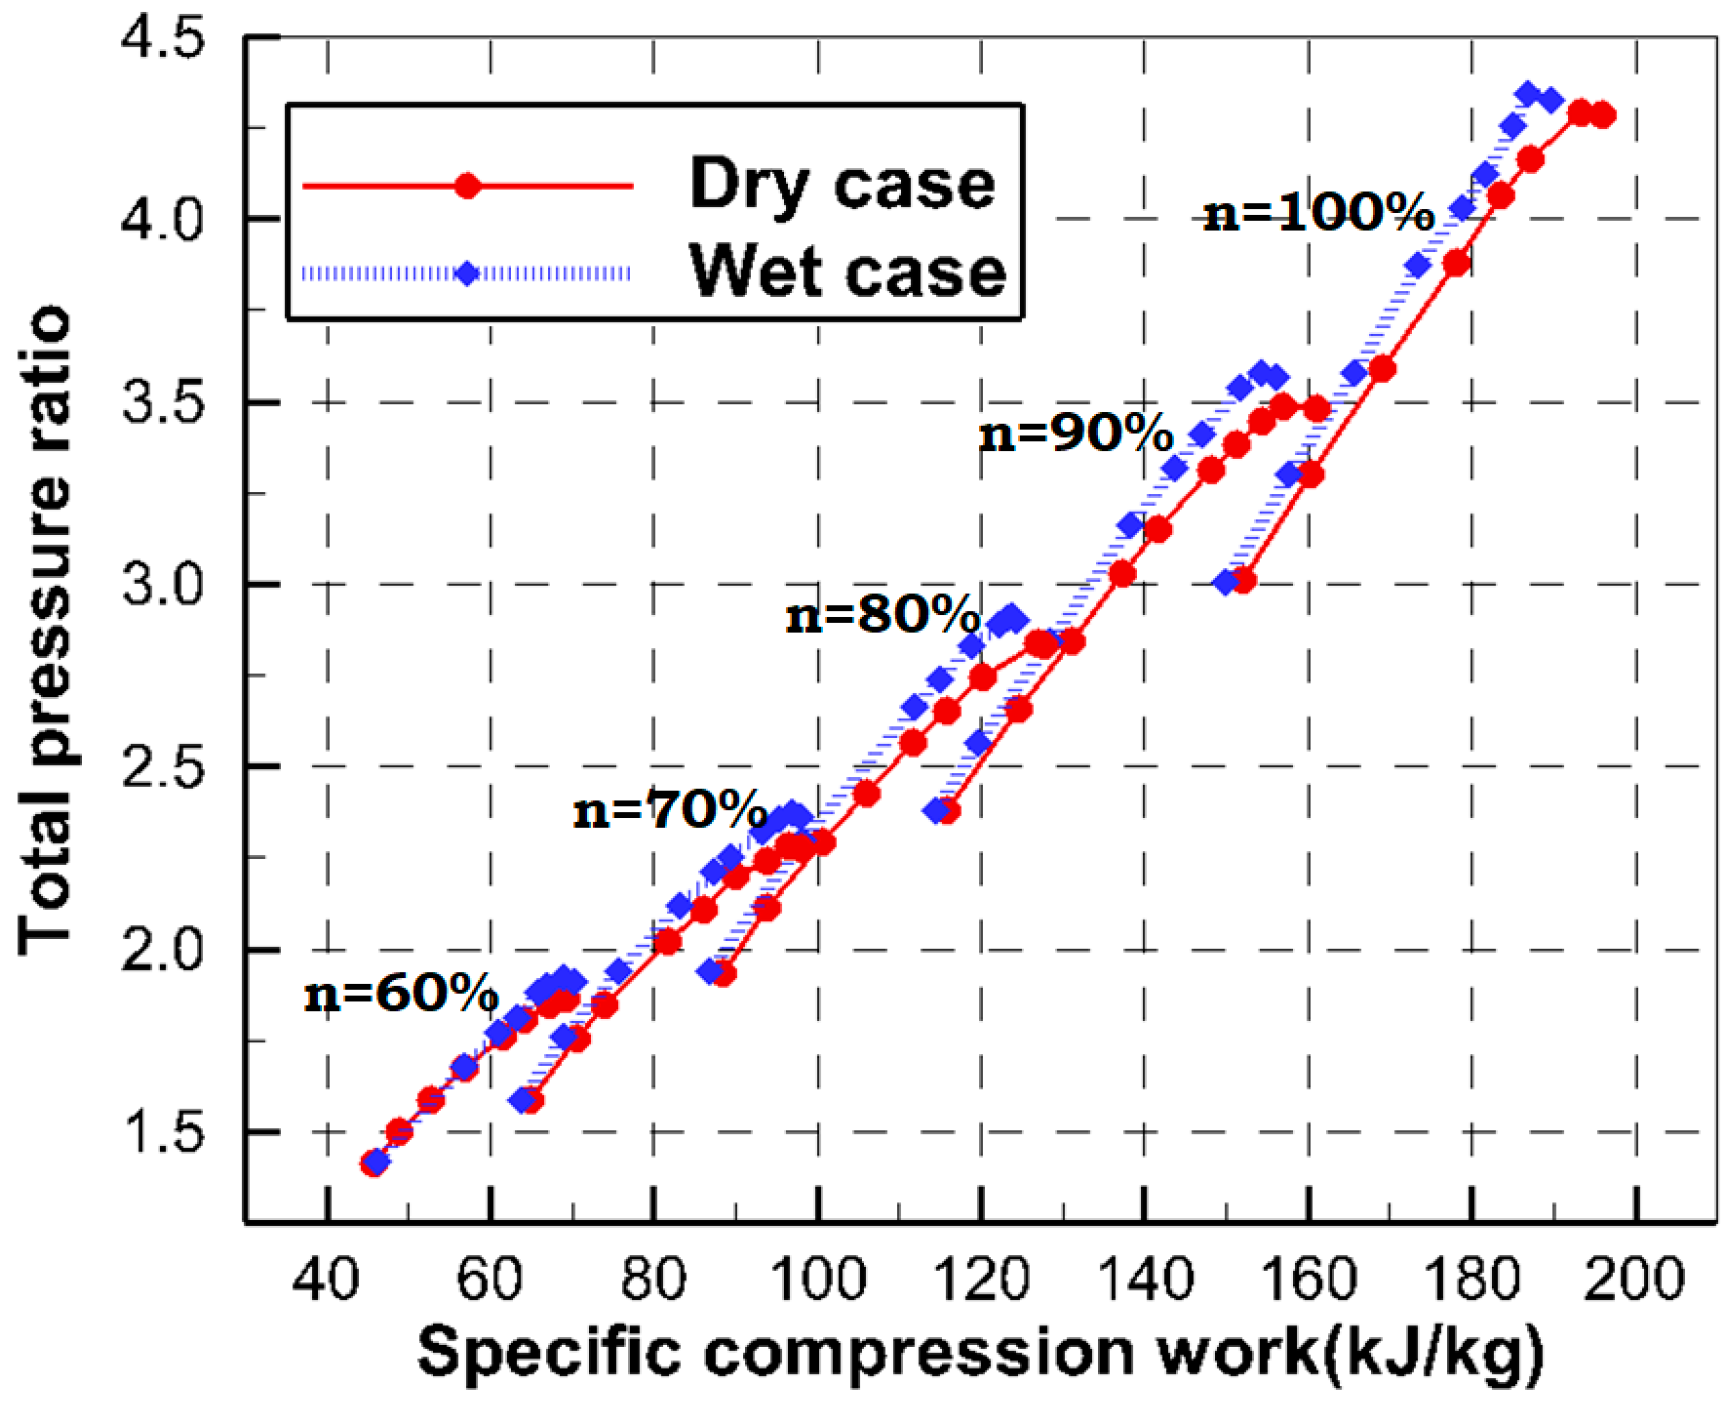
3.1. The Influence of Wet Compression Under the Different Working Condition

The dry and wet compression characteristics of the multistage compressor under different rotational speeds are analyzed in this section. The rotational speed range is selected to be between a 60% and 100% rotating speed. In the wet compression simulation part, it is assumed that the average water droplet size is 10 μm, the injecting flowrate is 1 percent of the inlet mass flow rate, the water injection velocity is 50 m/s, and the initial temperature is 298.15 K.
Figure 6 shows that the outlet/inlet total temperature ratio changes with mass flow rate in dry and wet compression cases under different rational speeds. Flow normalization is carried out according to that value of design point in this figure and following several figures. As shown in this figure, it can be seen that all the wet compression temperature ratio characteristic lines are below the dry conditions under different rotating speeds and the evaporative cooling effect of the water droplets is fully reflected under the compression process. To determine the chocking flow and rotating stall conditions by a numerical solution, the calculation starts with the lowest stator outlet static pressure so the calculated flowrate is close to the measured maximum flowrate under this condition and this operating point can be defined as the chocking flow point. Then, the stator outlet static pressure is increased step-by-step until the calculation cannot go on, so the rotating stall point can be found using this method.
As is shown in the figure, the difference value of temperature ratio between the wet case and dry case near the rotating stall condition is higher than near the chocking boundary, so that compared to other operating conditions, the evaporative cooling is the most effective near the rotating stall boundary. At a 90% design rotational speed, the values of the temperature ratio for the dry and wet case near the rotating stall point are 1.524 and 1.406, respectively. Compared to the dry case, with of temperature ratio value 1.468 under the case of mass flowrate 40 kg/s, the wet case value decreased by 0.094 and this means that the outlet temperature dropped by 28.5 K. Additionally, the temperature ratio value dropped by only 0.086 (outlet temperature dropped by 26 K when using wet compression) near the chocking boundary at a 90% design rotational speed. The values of the temperature ratio near the rotating stall boundary at a 100%, 80%, 70%, and 60% design rotating speed are 0.127, 0.106, 0.093, and 0.084, respectively, which can be translated into the temperature difference values (38.5 K, 32.1 K, 28.2 K, and 25.5 K, respectively) between the dry and wet case at the compressor outlet.
The total pressure ratio can be improved due to the water droplets evaporation. As shown in Figure 7, spraying water droplets cannot change the tendency of the compressor characteristic line and wet compression characteristic to follow the general rule of the compressor characteristic line. It can be seen that all the total pressure ratio characteristic lines are above the dry conditions under different rotating speeds due to the effect of the droplets evaporative cooling. Compared to the dry case, the improvement values of the total pressure ratio under a 100%, 90%, 80%, 70%, and 60% design rotating speed can reach 0.07, 0.057, 0.044, 0.038, and 0.031, respectively. In this figure, it can be seen that the total pressure ratio can be improved by spraying small size droplets under the same flow rate with the dry case. That is to say, employing the same pressure ratio, the wet compression can bring more air into the compressor than the dry compression. The evaporating cooling effect can be improved with the increasing rotating speed so that inlet mass flow improvement under the influence of droplet spraying at a high rotating speed is larger than that at a low rotating speed. For the same rotating speed characteristic line, such as the dry and wet case under a 100% rotating speed, the inlet mass flow improvement with droplet injection near the rotating stall point is larger than that near the chocking boundary. Compared to the dry case, the mass flow improvement values near the rotating stall and chocking boundary under a 100% rotating speed are about 2.102 kg/s and 0.281 kg/s, respectively, and near the stall boundary at a 90%, 80%, 70%, and 60% rotating speed, the improvement values can reach 2.03 kg/s, 1.91 kg/s, 1.08 kg/s, and 0.35 kg/s, respectively.
The change of the compressor adiabatic efficiency characteristic line under different working conditions with the effect of droplets evaporation is shown in Figure 8. As shown in this figure, the characteristic lines of wet compression are all above those of the dry case and that is to say, the adiabatic efficiency with water injection is higher than that of the dry case for the same inlet mass flow condition. Compared to the dry case, with an inlet mass flow of 44 kg/s under a 100% rotating speed, 40 kg/s under a 90% rotating speed, 34 kg/s under an 80% rotating speed, and 28 kg/s under a 70% rotating speed, the efficiency value can be improved by 1.7%, 1.6%, 1.4%, and 1.35% with wet compression. The maximum efficiency improves with wet compression to some extent in contrast with the dry case.
Figure 9 and Figure 10 show the change of specific compression work under different rotating speeds with the mass flow and total pressure ratio, respectively. The specific compression work includes the air/vapor consumption part and the additional part of water impacting on the rotor blade. Figure 7 shows that the specific compression work for wet cases is higher than that for dry cases because the total pressure ratio with wet compression is larger than that of dry compression under the same air intake condition, so it is not enough to explain the real relationship of specific compression work between dry and wet cases under the same mass flow.
As shown in Figure 10, under any rotating speed conditions, the consumption of specific compression work with wet compression is obviously lower than that of dry compression when using the same total pressure ratio, and a higher compression ratio can be obtained by water droplet spraying than dry compression under the case of the same specific compression work consumption. In the above figures, it can be seen that the decreasing value of specific compression work between dry and wet cases under the same pressure ratio condition and the capability to improve the pressure using wet compression under the same consumption of specific compression work are relatively larger in the left range of the compressor characteristic line. It can be judged that the compressor performance improvement because of the water evaporating effect is higher in the left range of the compressor characteristic line than that of the remaining part under different rotating speeds. In the condition of the same specific compression work, consumption has a value of 180 kJ/kg, compared to the dry case, which has a total pressure ratio value of 3.85, and the pressure ratio for the wet case can reach 4.0 under the 100% rotating speed. Spraying water droplets into the compressor can decrease the specific compression work (decreasing from 182.3 kJ/kg to 178.8 kJ/kg with the same pressure ratio value of 4.03) and generate more mass flow (the increasing value is 1.43 kg/s under the same pressure ratio value of 4.03). According to the analysis in the above figures, compared to the dry compression under the same pressure ratio condition, at a high rotating speed, wet compression can result in low specific compressor work consumption and large inlet mass flow so that the gas turbine output can be greatly improved.

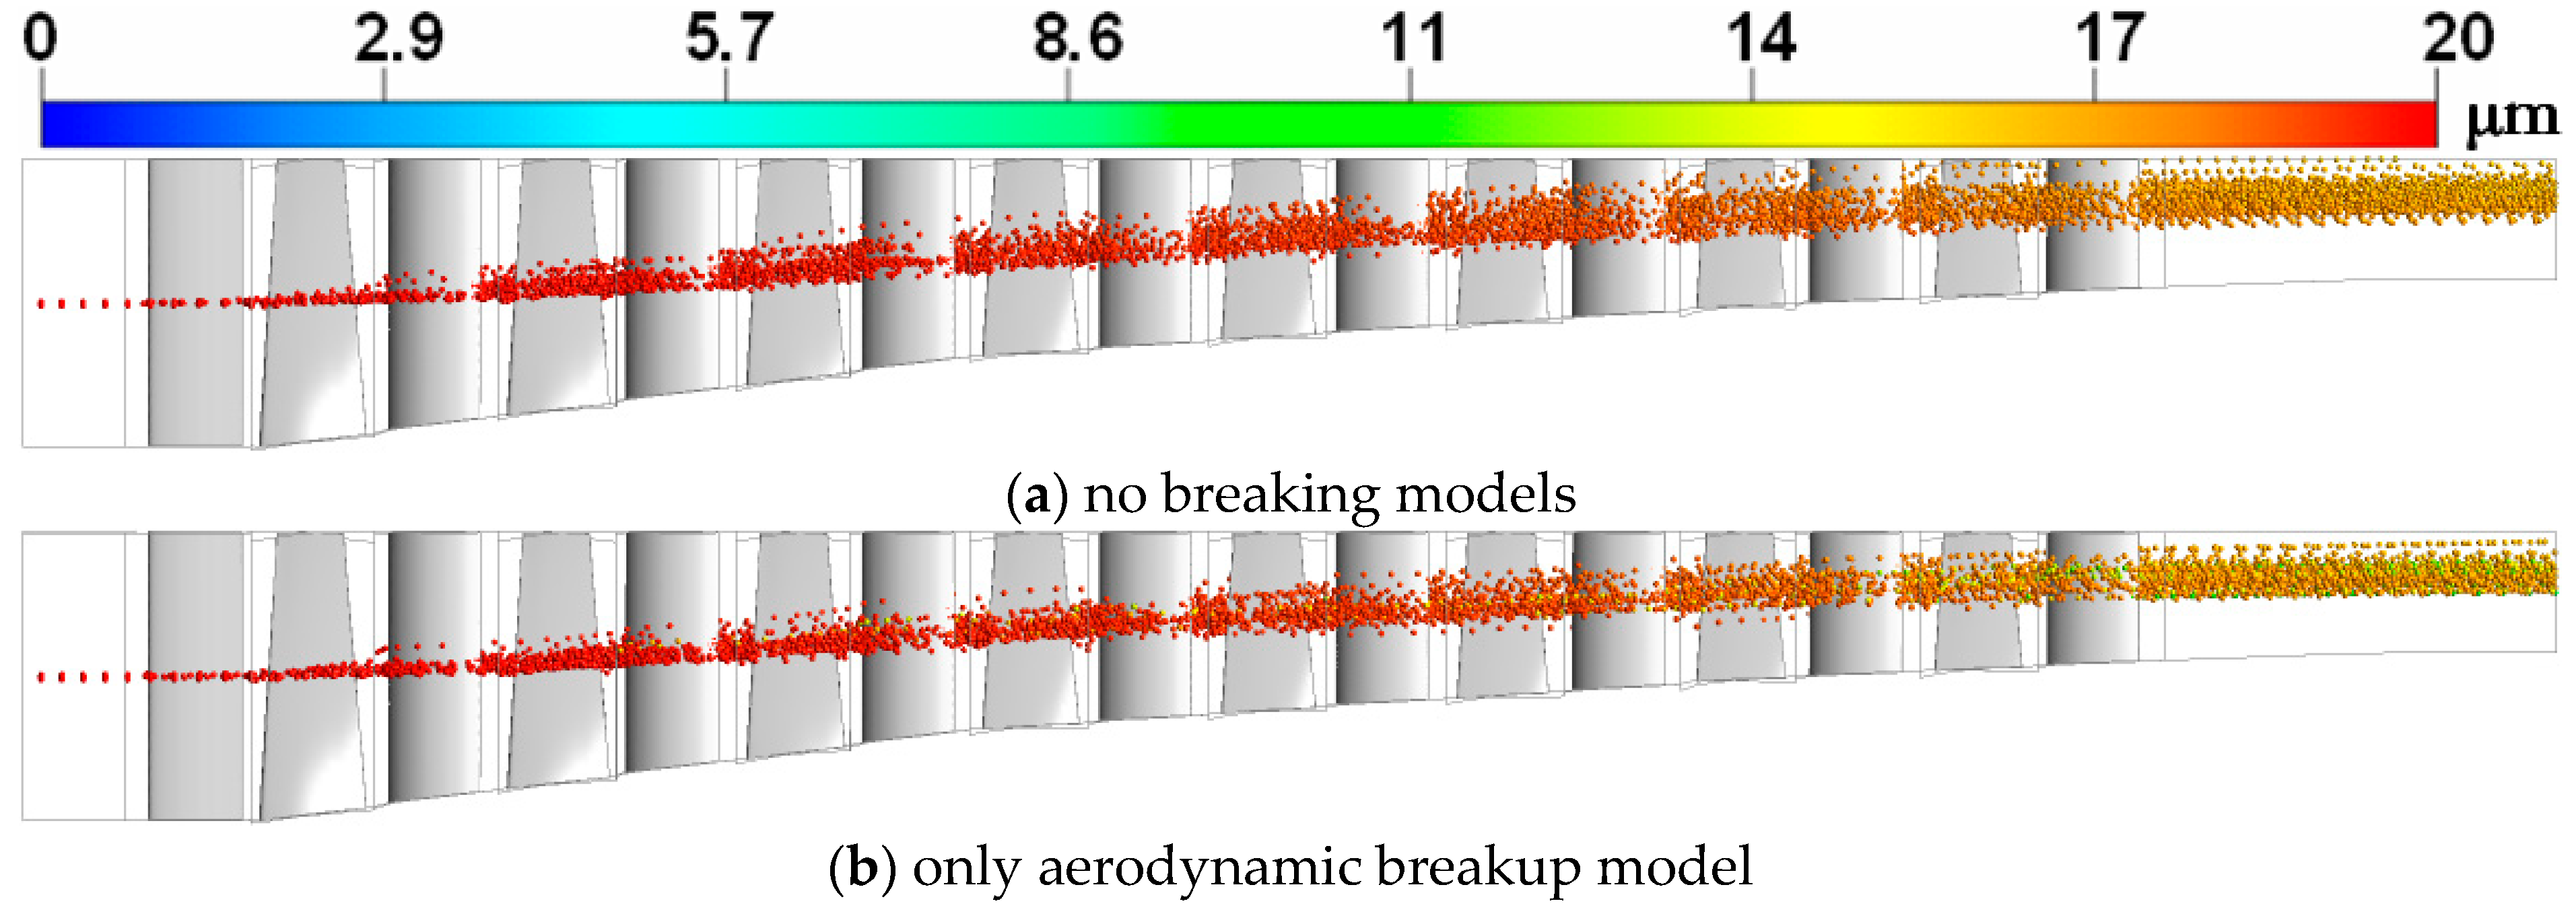
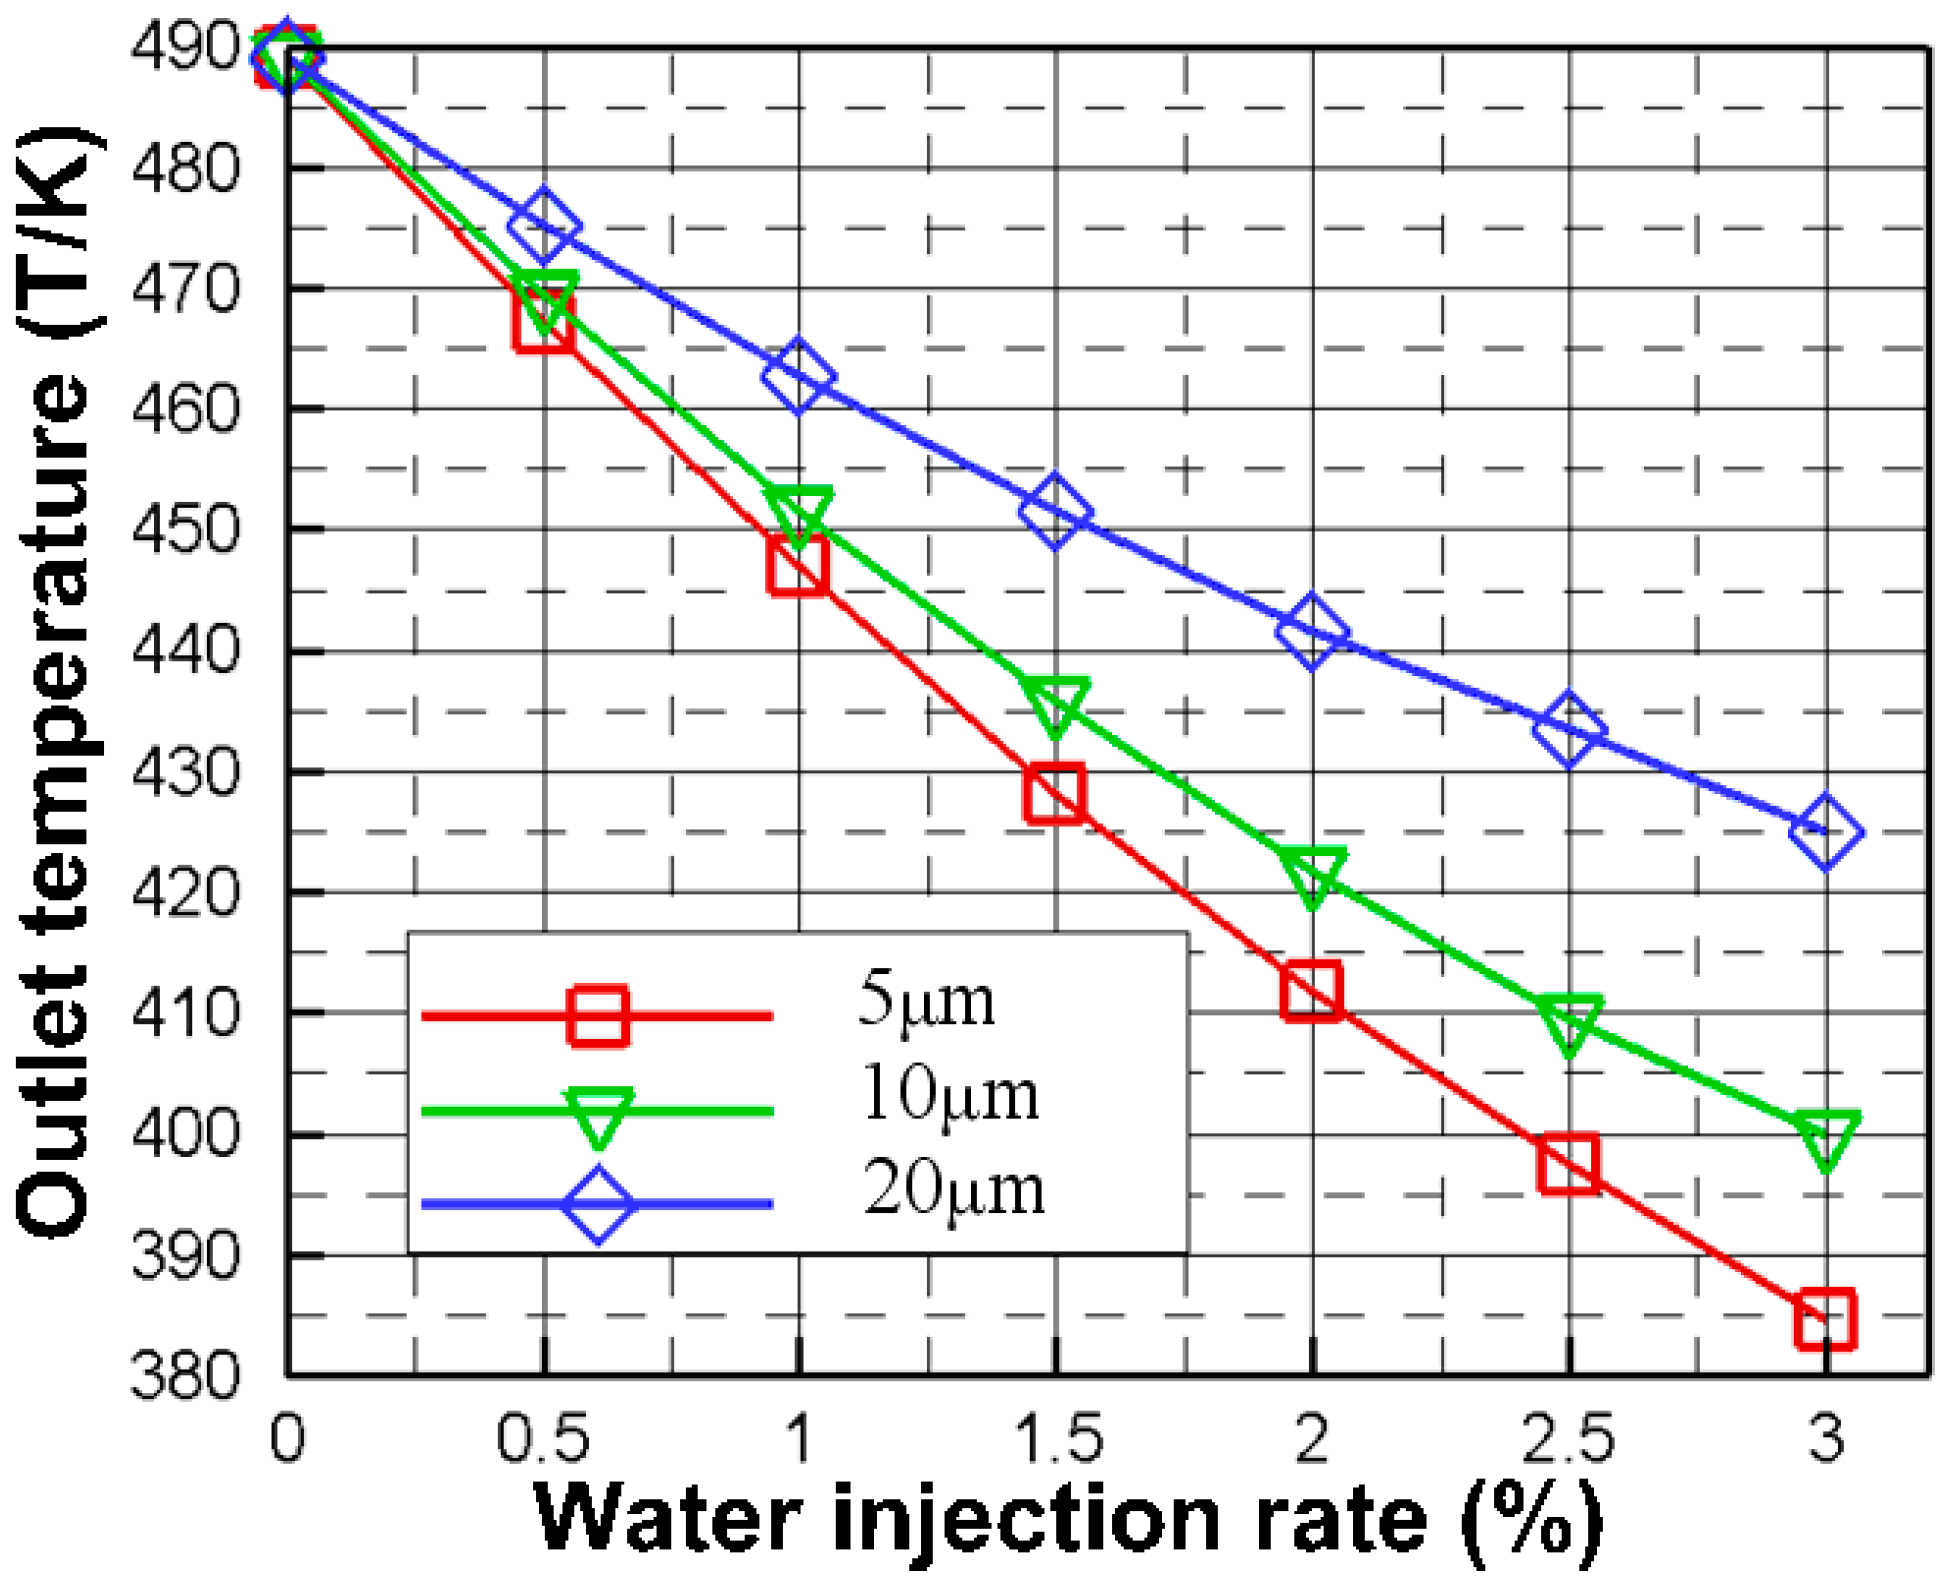
3.2. Movement and Evaporation of Water Droplets in the Multistage Axial Compressor

In this part, in order to study the movement and evaporation of water droplets inside the compressor, the droplet injecting position is stetted from a 50% span at the inlet and the injecting mass flow rate is 0.5% inlet air mass flow for the different water droplet size groups.
Figure 11 shows the trajectories for a droplet size of 5 μm under different design rotating speeds, considering the wall breakup model for droplets impinged with the blade. It can be seen that water droplets evaporate gradually and have a regular distribution along the axial direction, indicating that small size droplets can better follow the airflow. Although a water droplet size of 5 μm can evaporate completely at the compressor outlet under different design rotating speeds, the evaporation effect is quite different. As shown in the figure, the higher the rotating speed, the higher the position of droplets that evaporate completely. This is due to the fact that a higher rotating speed has a larger pressure ratio and temperature ratio in the compressor, signifying a higher air/droplet turbulent fluctuation to contribute to the droplet evaporation efficiency. Simultaneously, since a higher centrifugal force can also result in a larger air/droplet velocity and a stronger turbulence fluctuation, the droplet evaporation efficiency at a high position is higher than that at a low position.
Trajectories of three groups with the same droplet size of 5 μm are presented in Figure 12. Figure 12a,c show the water droplets trajectories with no broken models, only the aerodynamic breakup model, and only droplets-blade wall breakup model, respectively. It can be seen that there is almost no difference in Figure 12a,b. That is to say, the influence of aerodynamic breakup is relatively weaker, so the water evaporation and movement display almost no change when the droplet size is 5 μm. From Figure 12a,c, water droplets vaporize completely in the front of the eighth rotor row of the compressor. When comparing before and after adding the wall breakup model, the effect of evaporation cooling is relatively larger in the case of adding the wall breakup model due to the droplets crushing phenomenon. It can also be seen that the influence of aerodynamic crushing can be ignored because of the injecting droplet size being so small in the compression process. Similar results can be found in Figure 13a–c. The large size of droplets cannot follow the airflow very well and the trend of radial movement increases stage-by-stage due to the large size. The effect of aerodynamic crushing can be ignored and the influence of droplets impinged with the blade surface should be considered so that, to a certain degree, it can affect the droplet evaporation in the whole flow channel. It can also be seen that the radial migration quantity decreased with the decreasing droplet size, so that most of the smaller size droplets remained in the flow path; that is to say, the evaporation cumulative effects of smaller size droplets can produce a better result than that of larger size droplets.
Figure 14 presents the droplet trajectories for three droplet sizes of 5 μm, 10 μm, and 20 μm with no breaking models, only the aerodynamic breakup model, and only the droplets-blade wall breakup model, respectively. As depicted in the figure, with no breaking model (Figure 14a) and with only the aerodynamic breakup model (Figure 14b), a larger amount of large particle sizes evaporated incompletely in the compressor, signifying a weak droplet evaporation efficiency for these cases. However, the flow field considered with only the droplets-wall breakup model (Figure 14c) presents a higher droplet evaporation efficiency. This phenomenon can be ascribed to the fact that large droplets are more readily being caught by the end wall, and large droplets then break into small droplets to increase the droplet surface area of evaporation.

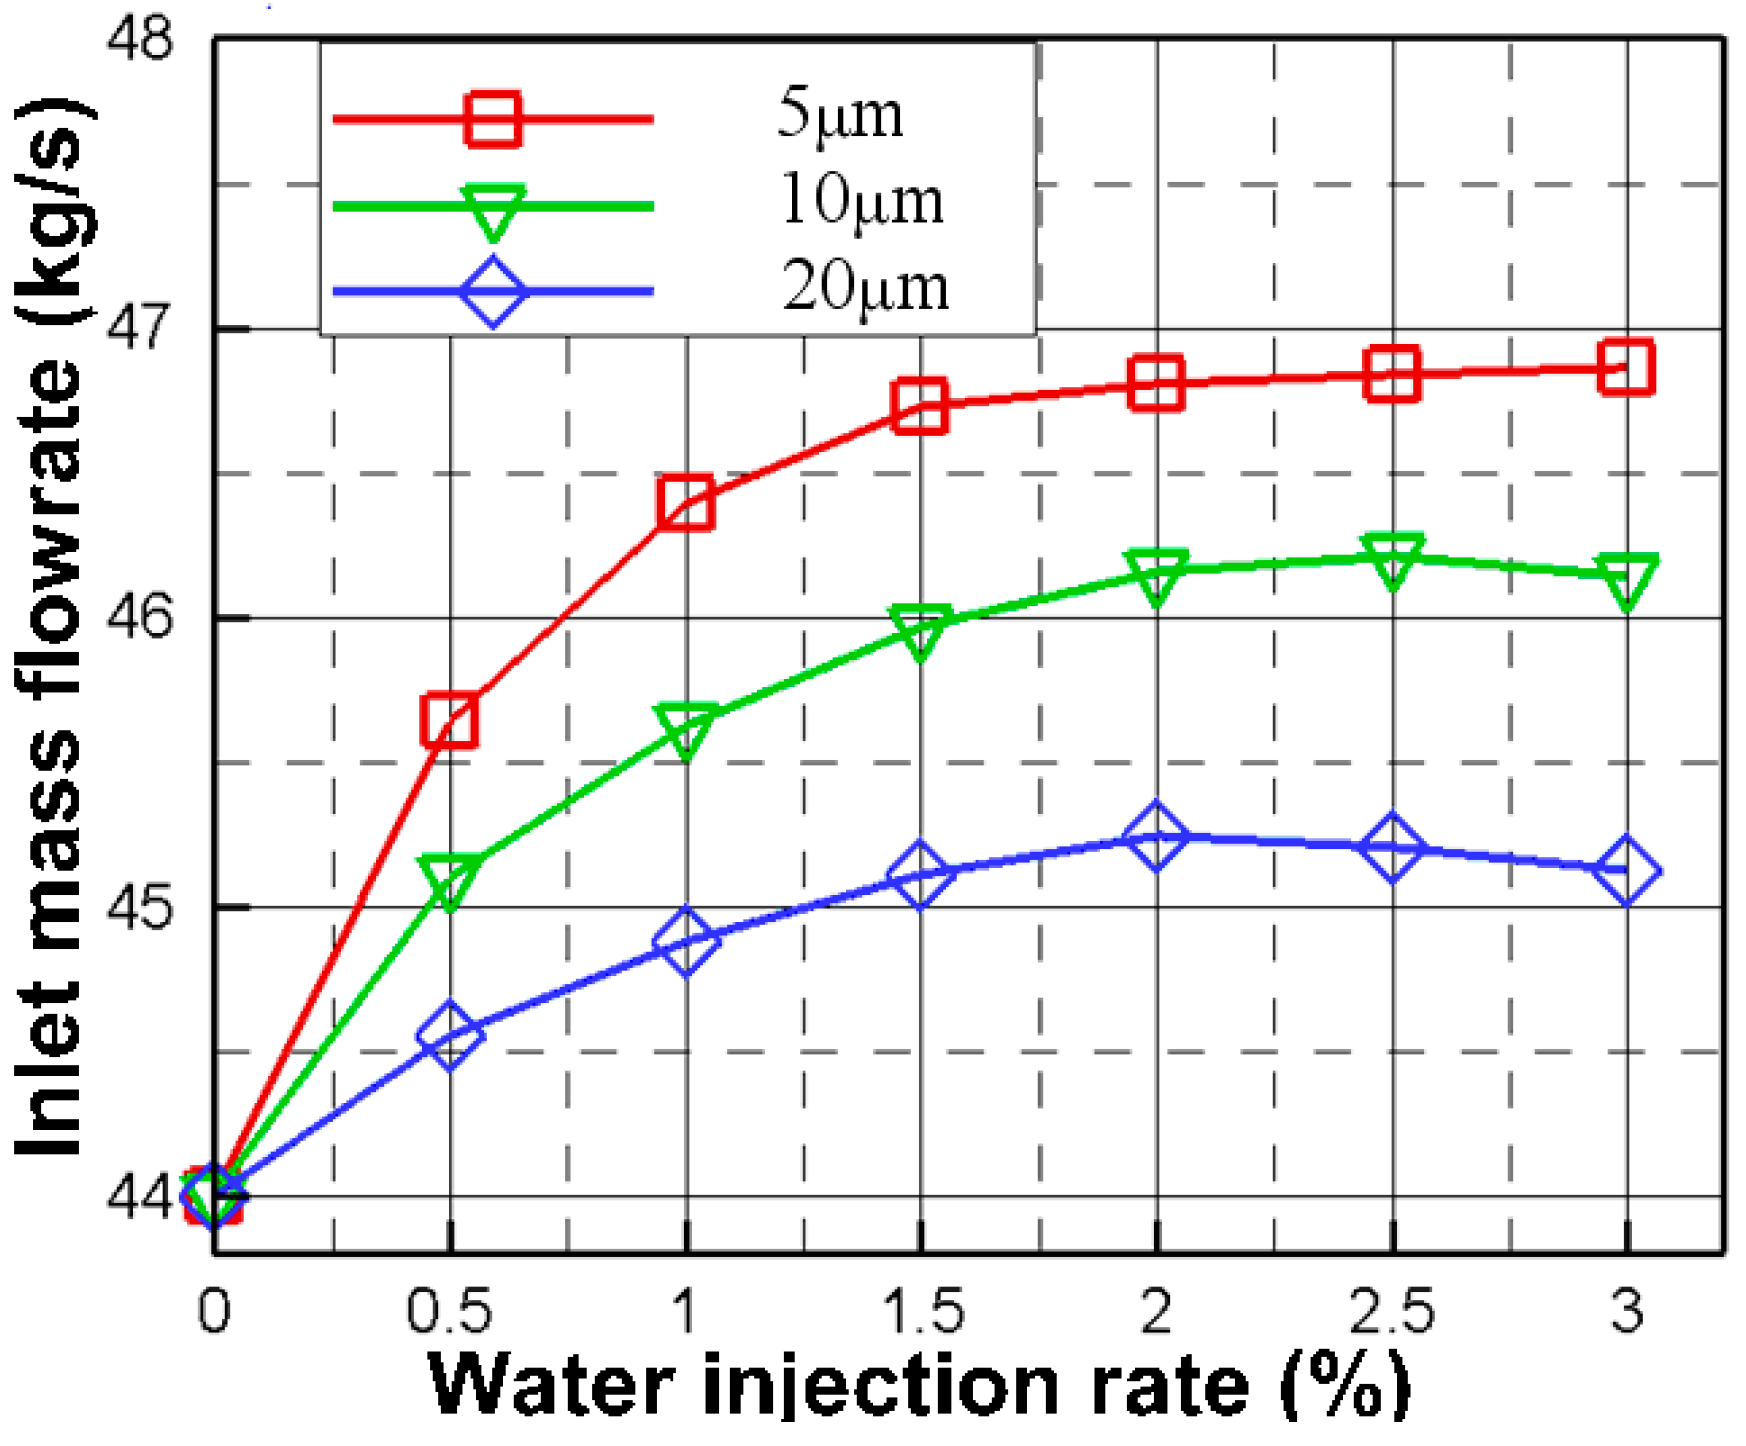
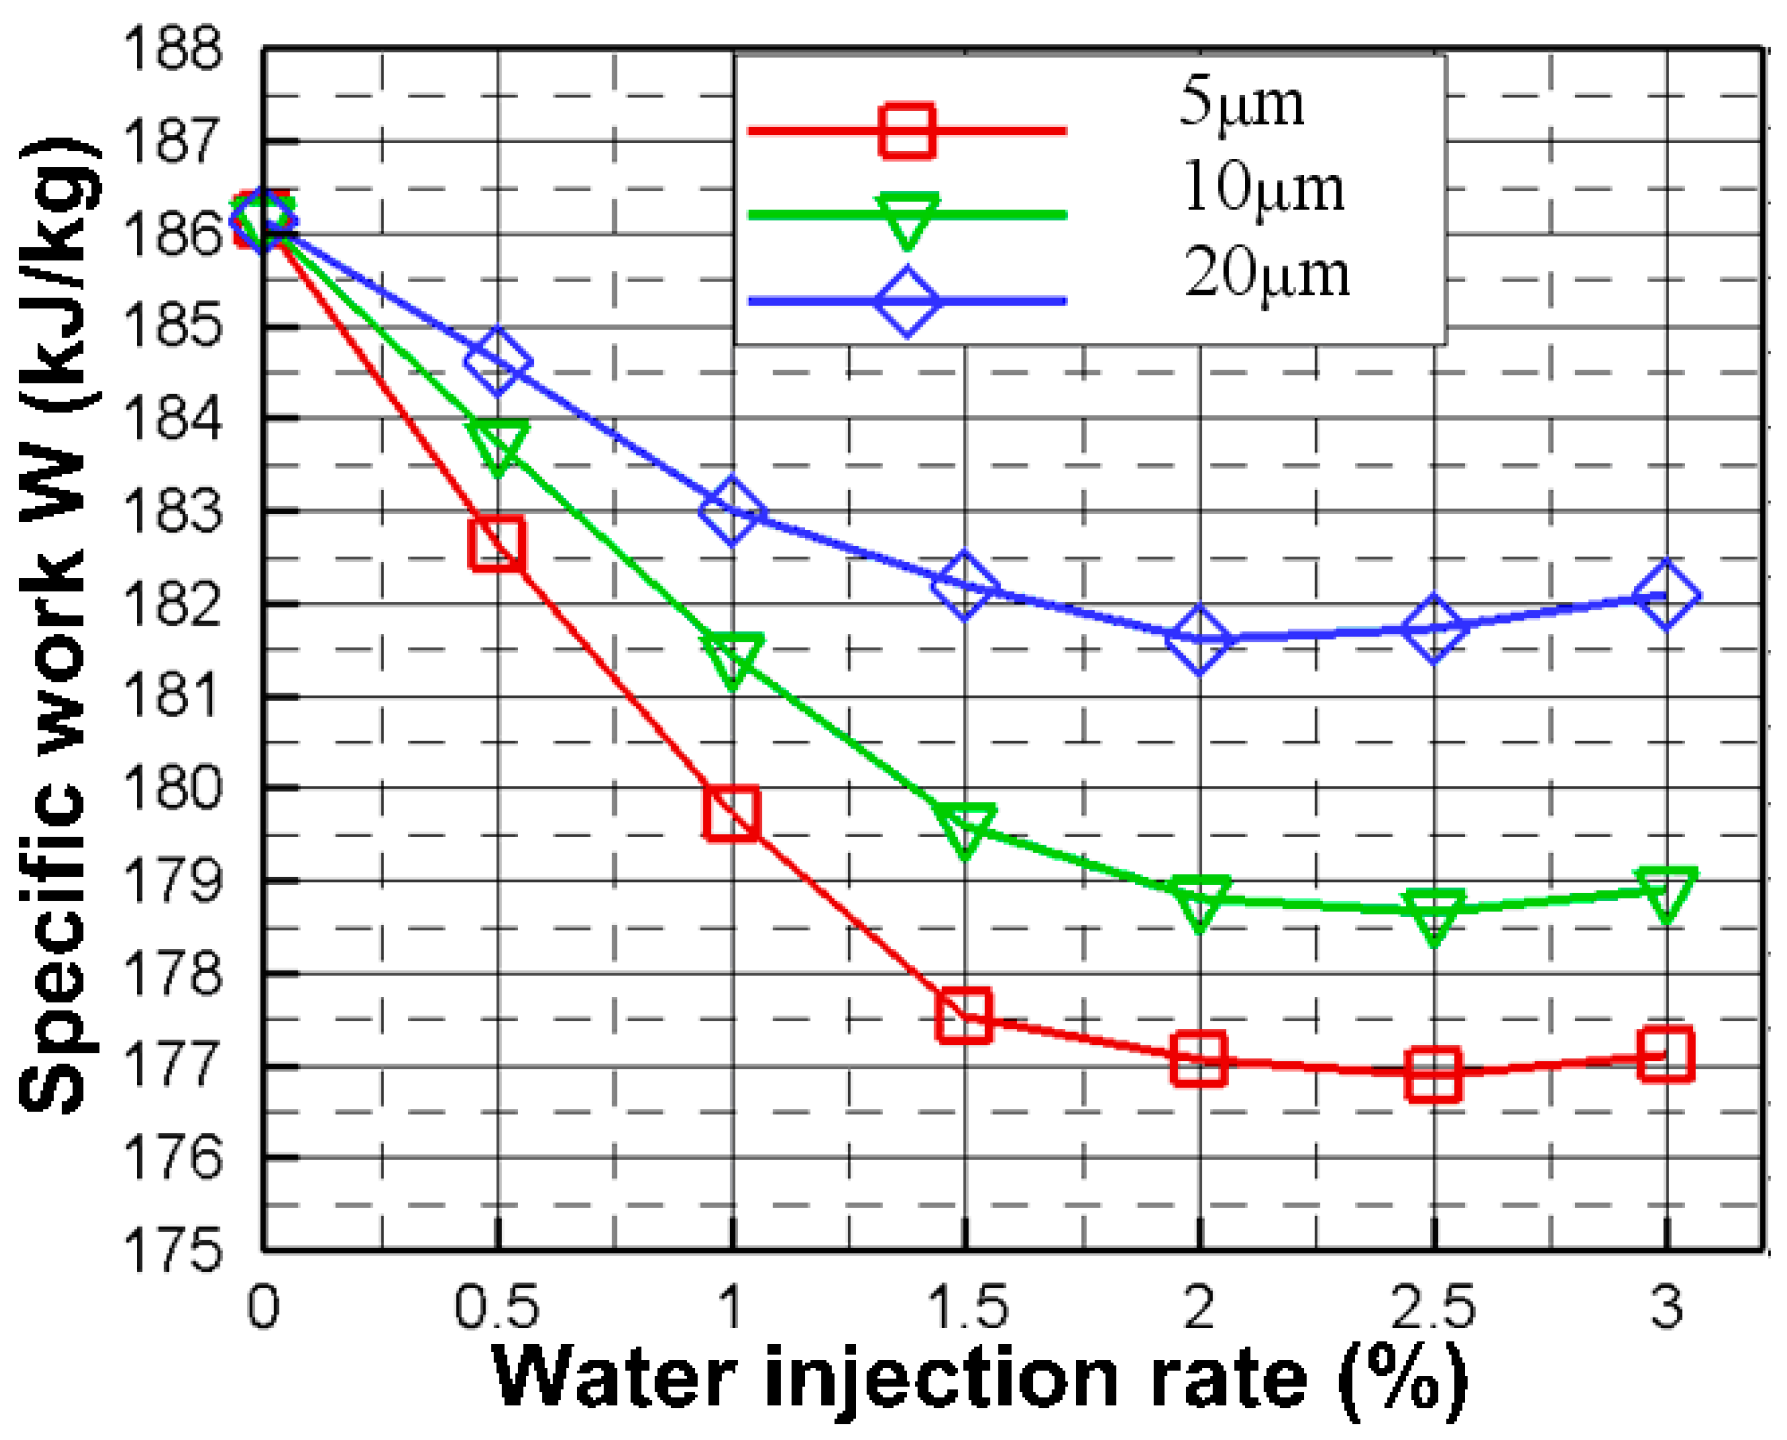
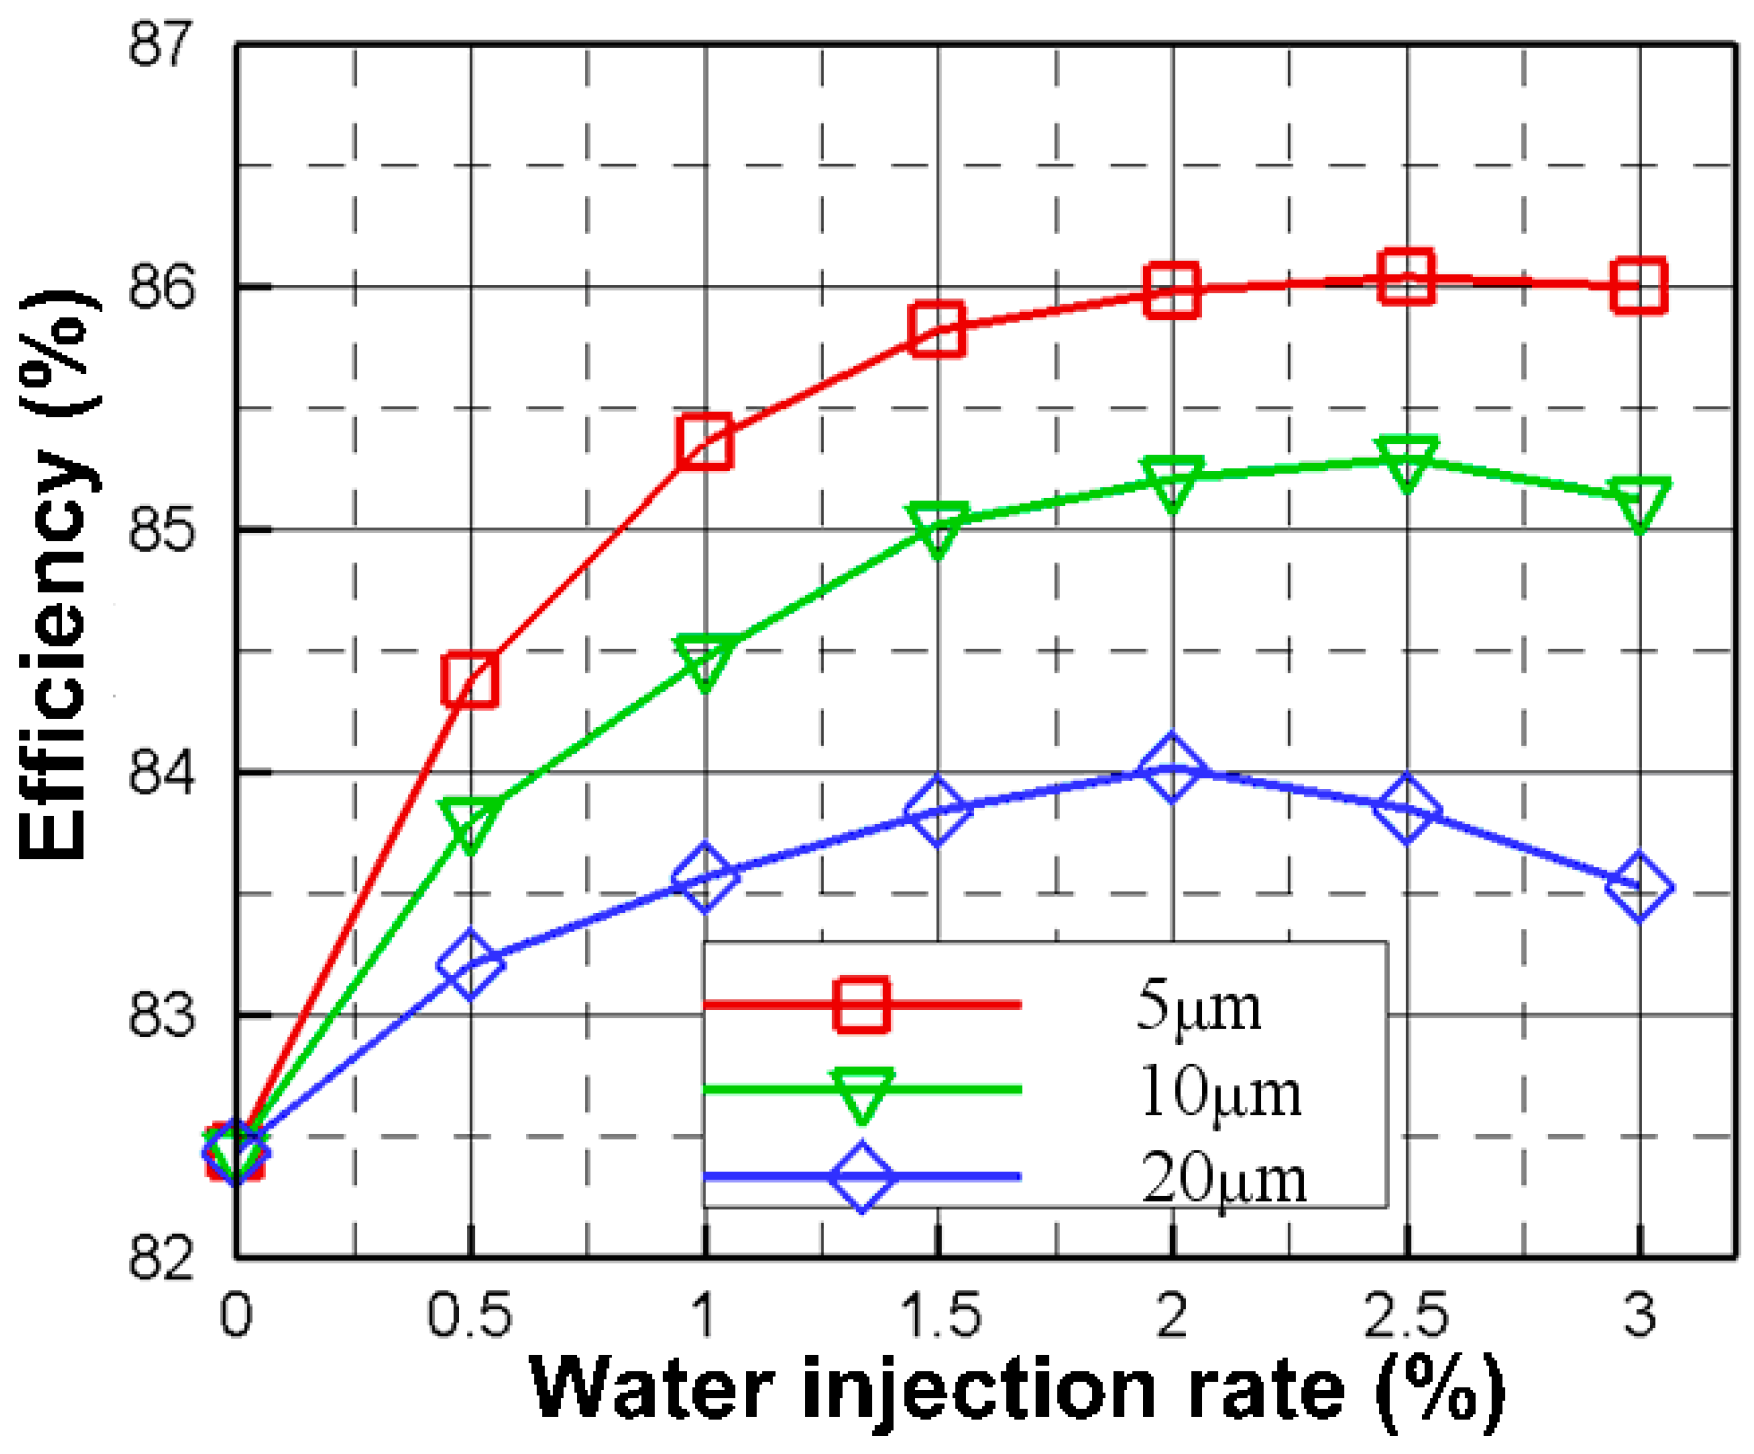
3.3. Compressor Performance Analysis at the Design Operating Condition with Different Wet Compression Cases

The effect of water injection at the design operating point has been studied in this part. Total pressure and total temperature boundary are given at the inlet of the compressor and the average static pressure (the value is given according to the air mass flow rate of 44 kg/s) is given at the outlet of the compressor. The simulations of wet compression are implemented at the inlet for different droplet sizes of 5 μm, 10 μm, and 20 μm, the injecting rate ranges from 0.5% to 3% and increases by a 0.5% inlet mass flow rate, and the injecting velocity is 50 m/s. The aerodynamic breakup model and droplets-blade wall breakup model are considered in this simulation.
Figure 15 shows the outlet temperature changing with the different wet compression conditions. It can obviously be seen that the evaporation cooling effect improves with the increasing water injecting rate and the decreasing droplet size so that the outlet temperature can be largely reduced by the wet case of the small droplet size and large injecting rate. Compared to the dry case, the compressor outlet total temperature reduces by 22 K, 42 K, 78 K, and 105 K for the wet case with a droplet size of 5 μm and injecting rates of 0.5%, 1%, 2%, and 3%, respectively. It can also be seen that the droplets number increases with the increasing droplet injecting rate, so the lost energy of airflow that carries droplets and impinged with the blade surface increases largely. The curvature decreases with the increase of the injecting rate, showing that the temperature dropping level in the flow path decreases by the effect of those cases.
Figure 16 shows the compressor inlet air mass flow rate with different wet compression conditions. The inlet mass flow rate for the dry case is 44 kg/s. Although the inlet mass flow increases with the increasing injecting rate, the ascending range decreases. Compared to the dry case, the inlet mass flow for the wet cases with the droplet size 20 μm and injecting rates of 0.5%, 1%, 1.5%, 2%, 2.5%, and 3%, increases by 1.27%, 2.01%, 2.52%, 2.82%, 2.74%, and 2.55%, respectively. Compared to the wet case with a droplet size 20 μm and injecting rate of 2%, increasing the injecting rate results in the inlet mass flowrate presenting a decreasing trend because of the inert resistance of the larger size droplets and the evaporation effect is relatively small. These phenomena can mainly be ascribed to the fact that, after water injection into the compressor, the temperature of air decreases, resulting in an enhancement in the air density, which in turn increases the mass flow that can enter into the compressor. Then, an increment in mass flow at the compressor inlet is dependent on the decreasing amount of air temperature. Thus, the inlet mass flowrate for small droplets is higher than for large droplets.
The total pressure ratio for dry and wet cases is shown in Figure 17. It can be seen that for the same injecting rate, a smaller droplet size can obtain a relatively large total pressure ratio. Compared to the dry case value of 4.135, the wet compression total pressure ratio for the injecting rate of 1% and droplet sizes of 20 μm, 10 μm, and 5 μm, can reach 4.138, 4.141, and 4.147, respectively. The change of total pressure ratio with wet compression should be balanced among the following factors: the positive effects of evaporation cooling of the droplets, and the negative effects of particles resistance and droplet impinged with blade wall. When the water injecting rate reaches a certain degree (for example, wet cases with a droplet size 20 μm, and an injecting rate of 2.5% and 3%), the negative effects of the droplet’s inert resistance and droplets impinged with the blade surface are larger than the effect of evaporation cooling, so the total pressure decreases.
As shown in Figure 18, the change tendency of the compressor specific work under different water injection conditions can be seen. Compared to the dry case, whose specific work value is 186.26 kJ/kg, the specific work value for the wet cases of the injecting rate 2%, with a droplet size of 20 μm, 10 μm, and 5 μm, can reach 181.61 kJ/kg, 178.81 kJ/kg, and 177.11 kJ/kg, respectively. The value can be reduced to 184.61 kJ/kg, 182.99 kJ/kg, and 181.61 kJ/kg for the wet cases with a droplet size 20 μm, and injecting rates of 0.5%, 1%, and 2%, respectively. From this figure, it can also be seen that the tendency of compressor specific work begins to increase when the water injecting rate surpasses 2%. It can be judged that the change of compressor specific work is determined by the degree of temperature drop brought about by water droplet evaporation, the increased value of enthalpy in the phase change process, and water inert factors. A relatively large water droplet size and injecting amount may lead to the increase of specific work because the water inert factors, such as the effect of airflow transpiration, aerodynamic breakup, and impinged with the blade wall, are relatively large.
Figure 19 shows the change of adiabatic efficiency with wet compression cases. The efficiency increases remarkably with the decreasing droplet size (compared to the dry case, the efficiency increasing values for the wet cases with an injecting rate of 2% and the droplet size of 20 μm, 10 μm, and 5 μm, can be improved by 1.52%, 2.74%, and 3.33%, respectively). For the same droplet size, the tendency of the efficiency curve is first increasing and then decreasing with an increasing injecting rate (compared to the dry case, the efficiency increasing values for the wet cases with a droplet size of 10 μm, and an injecting rate of 0.5%, 1%, 1.5%, 2%, and 3%, can reach 1.32%, 1.99%, 2.54%, 2.76%, and 2.63%, respectively).

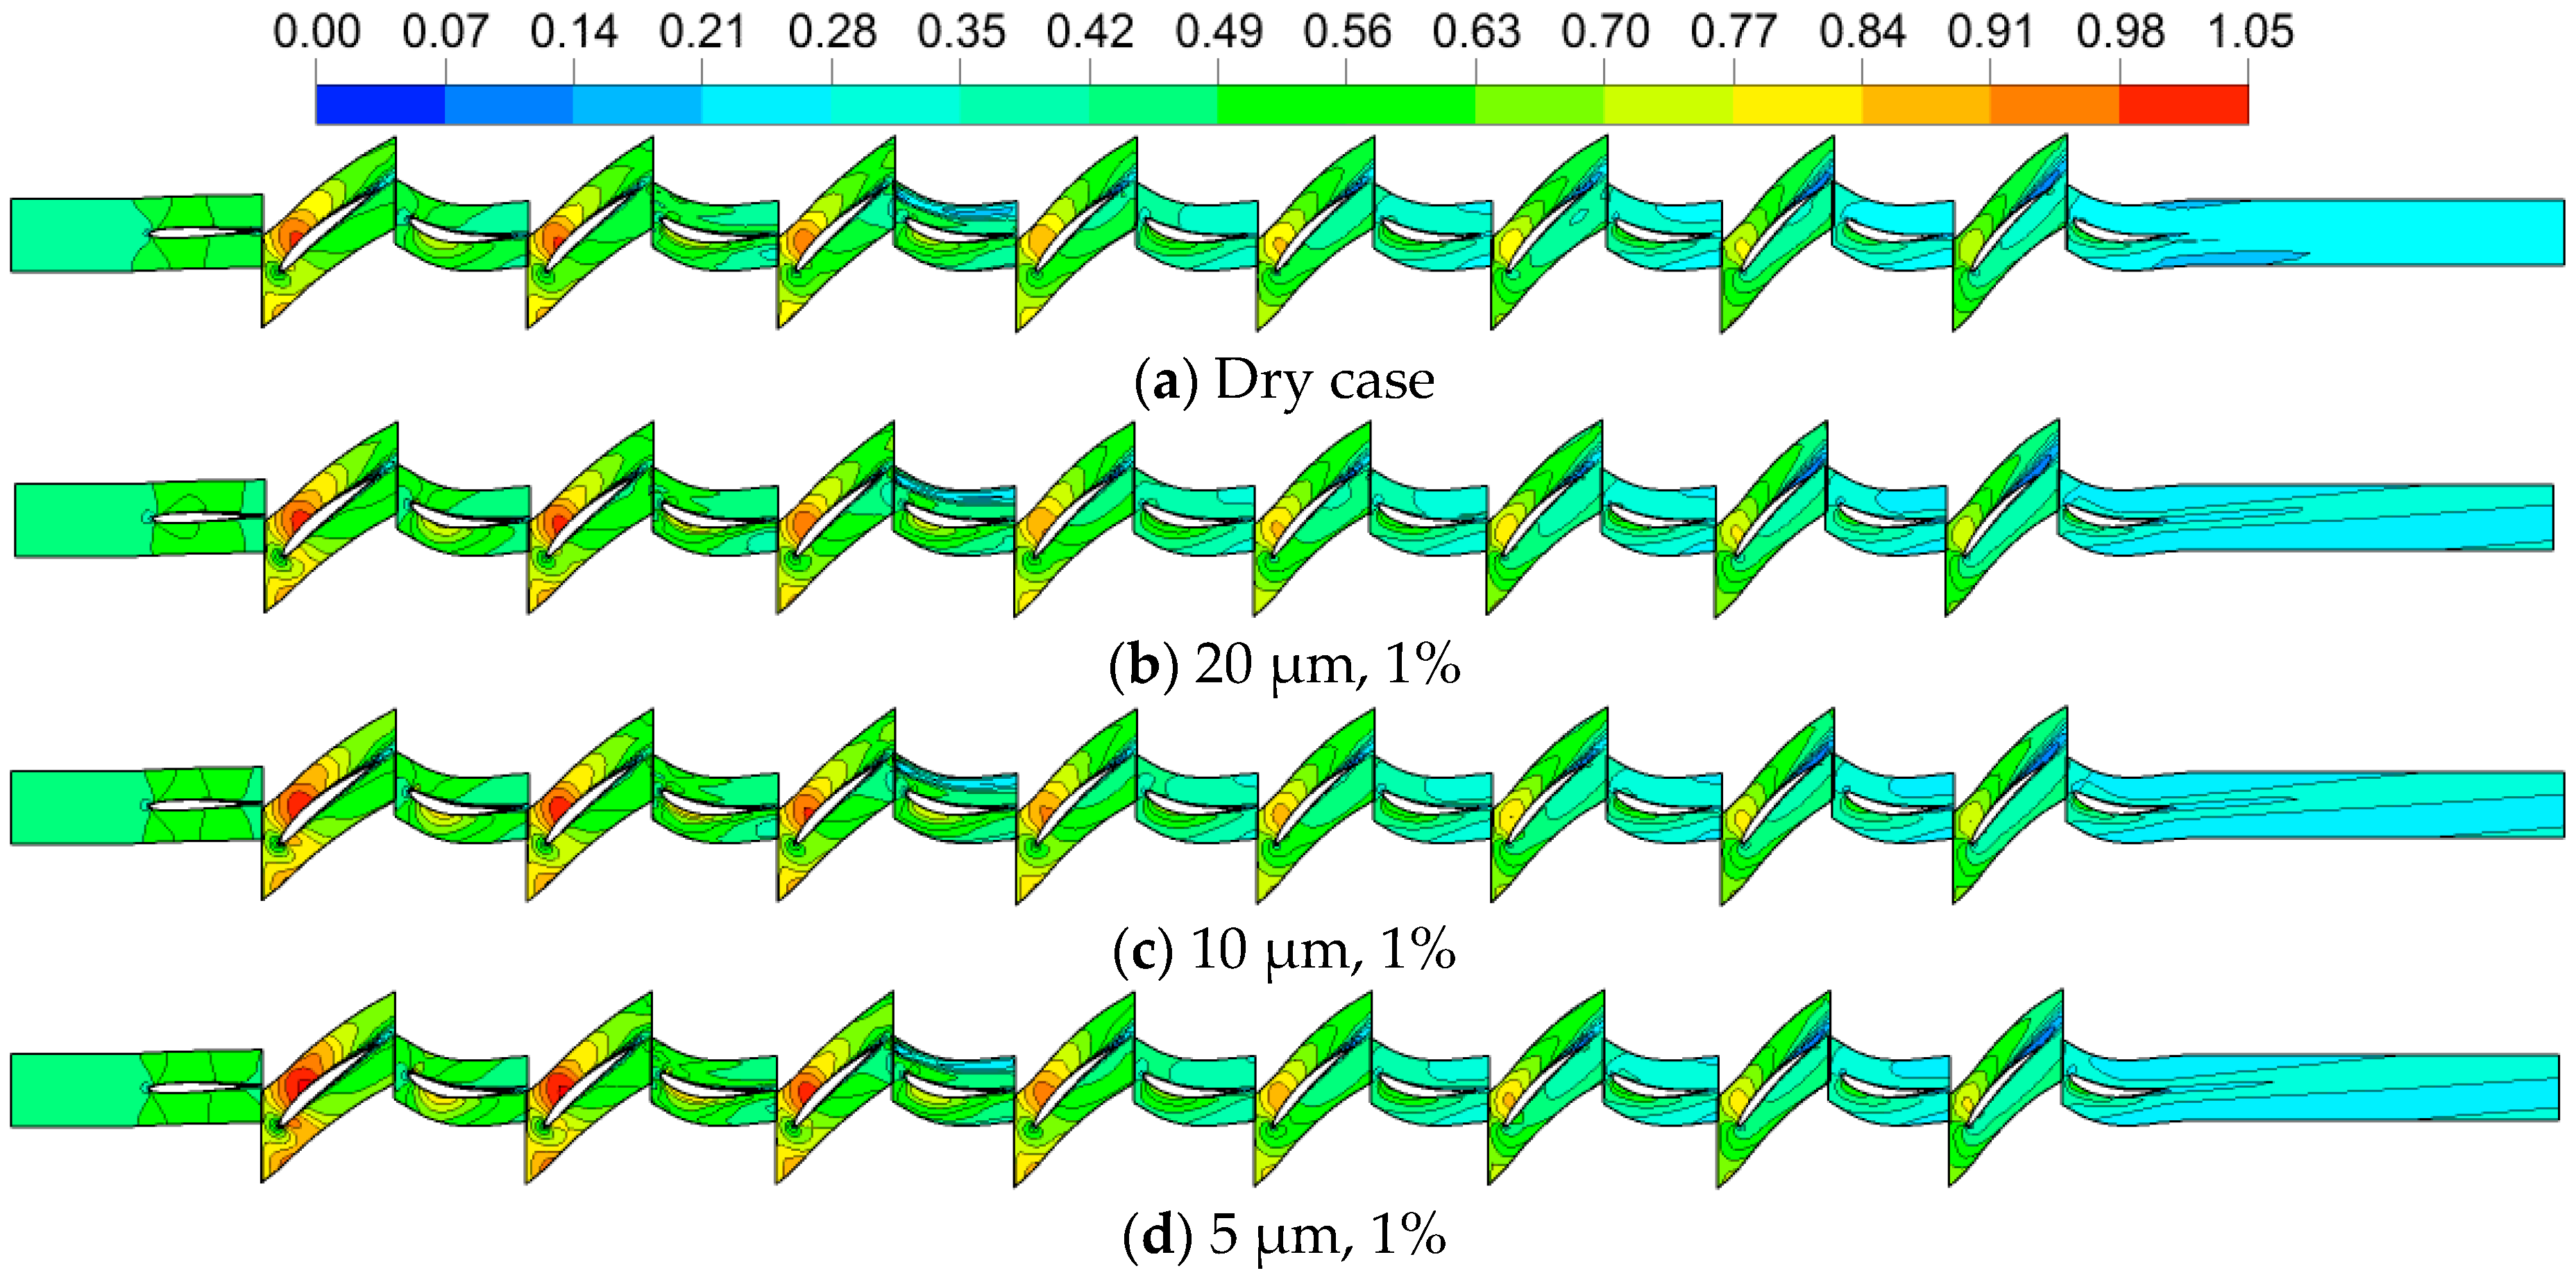
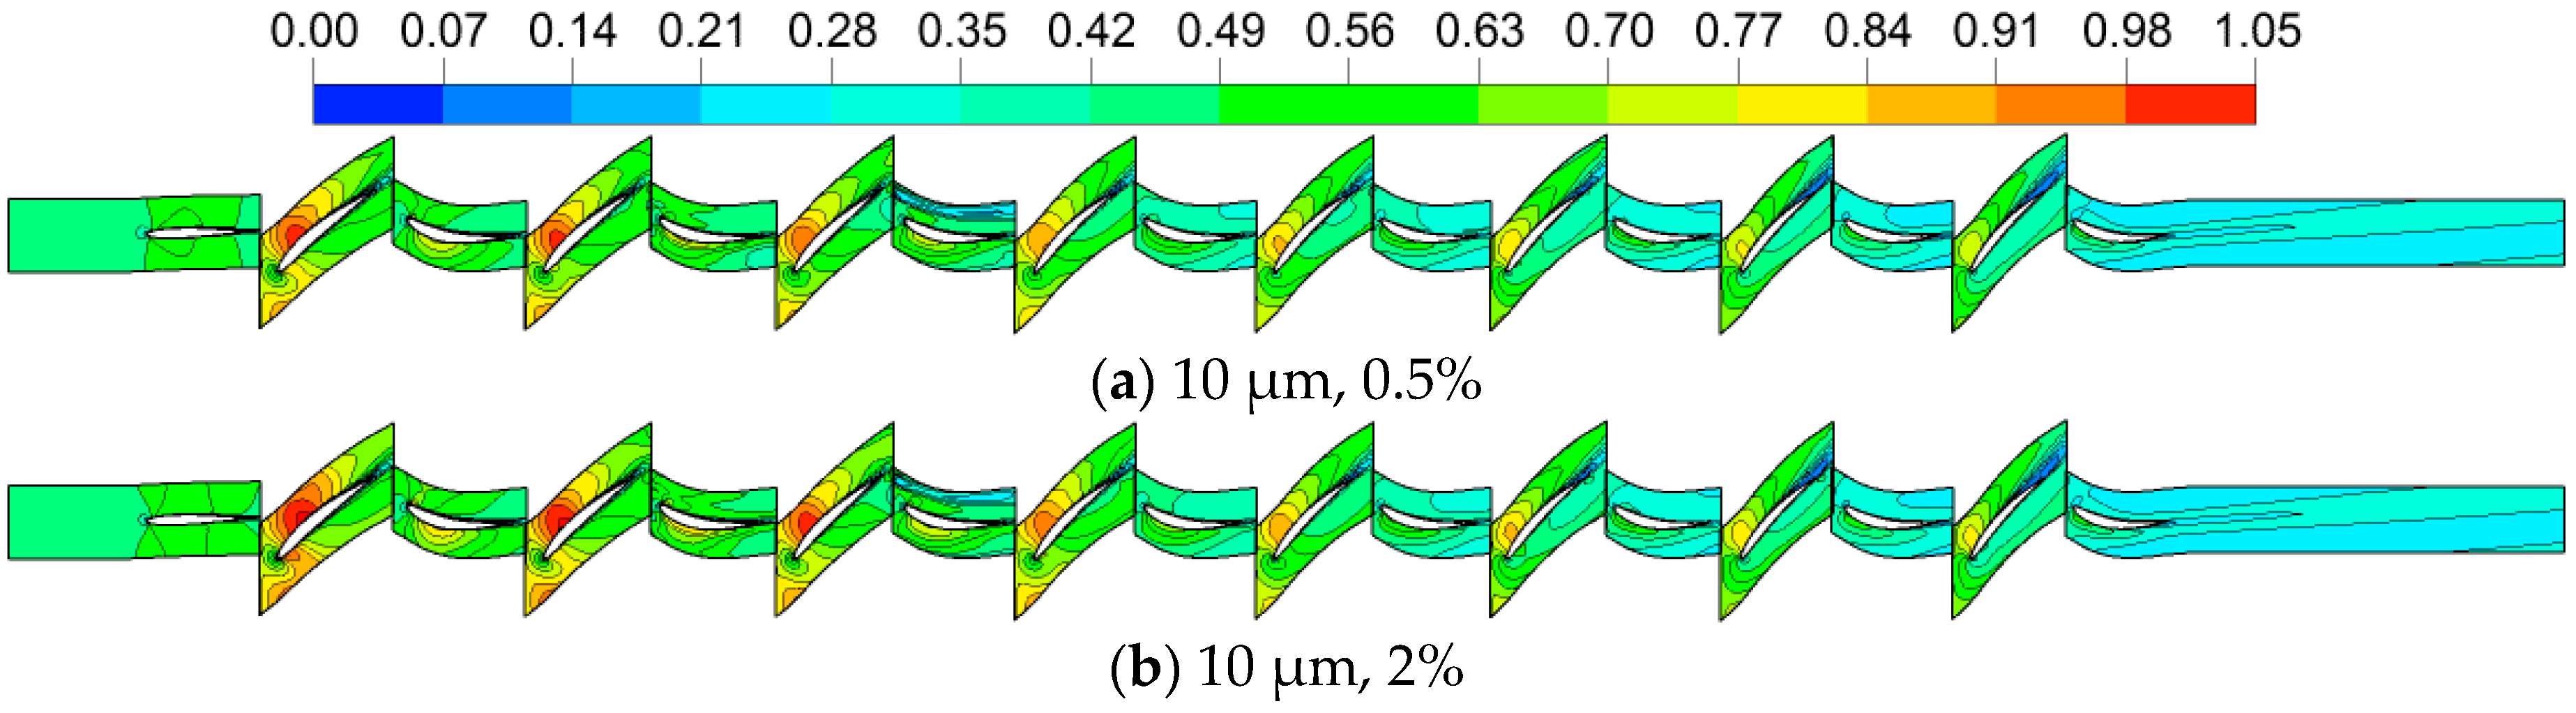
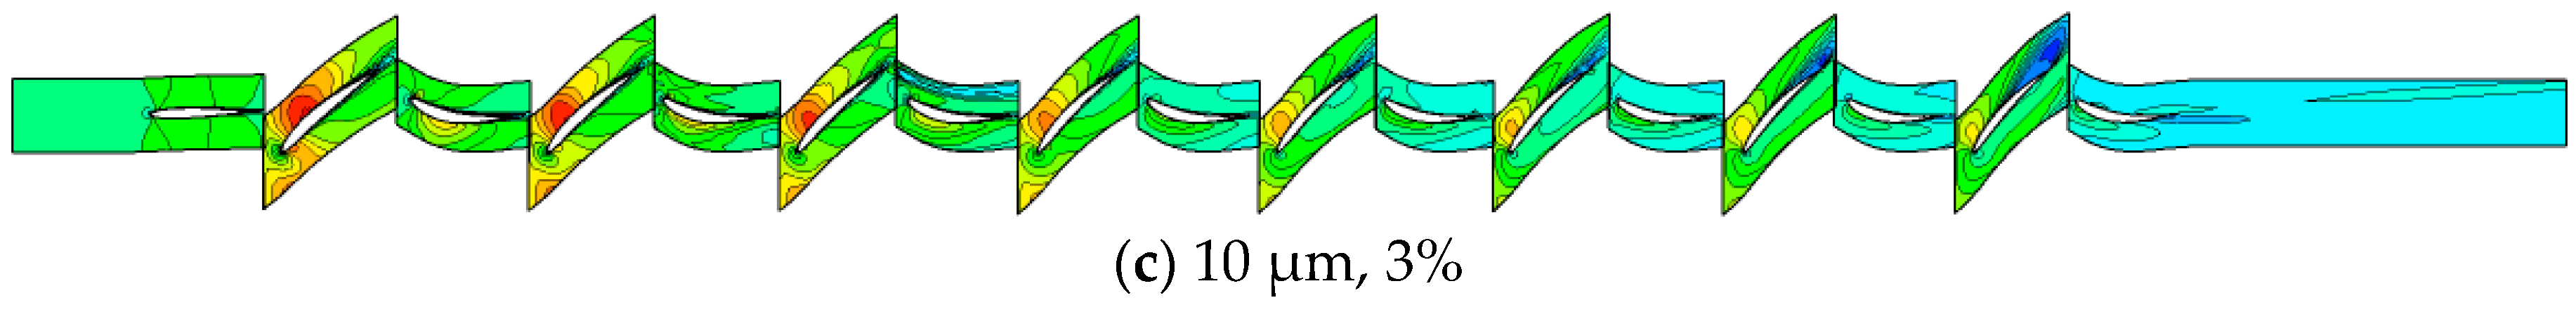
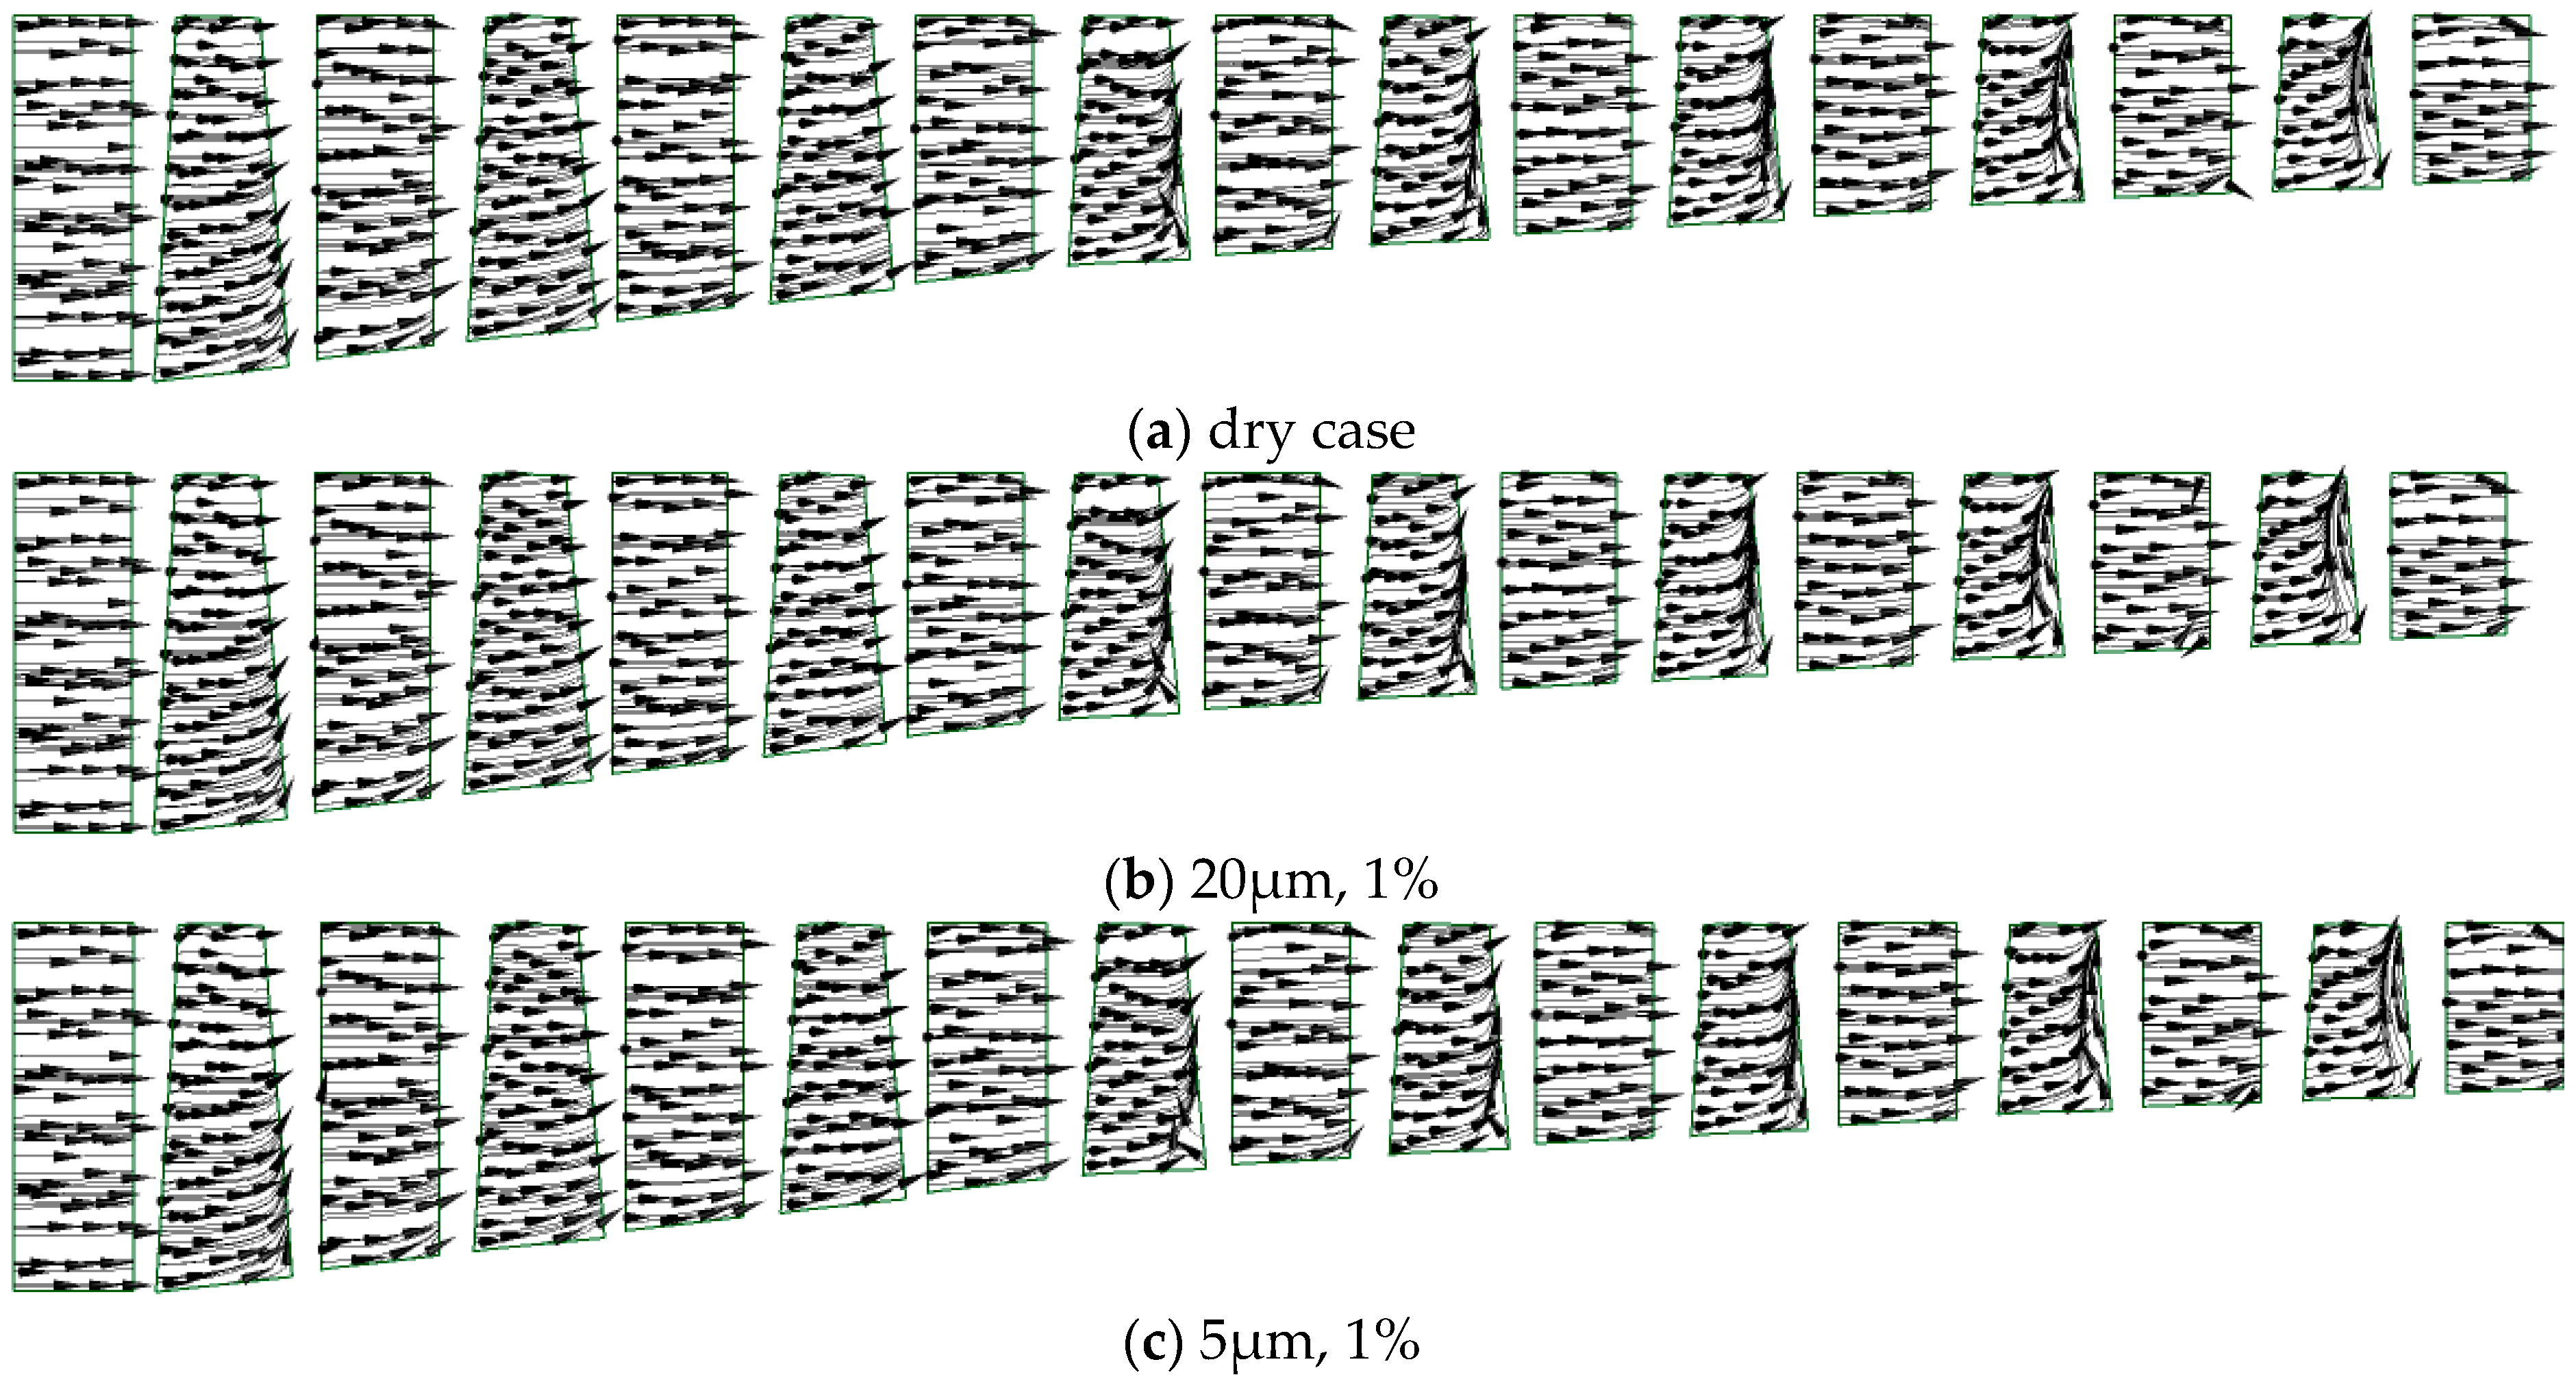
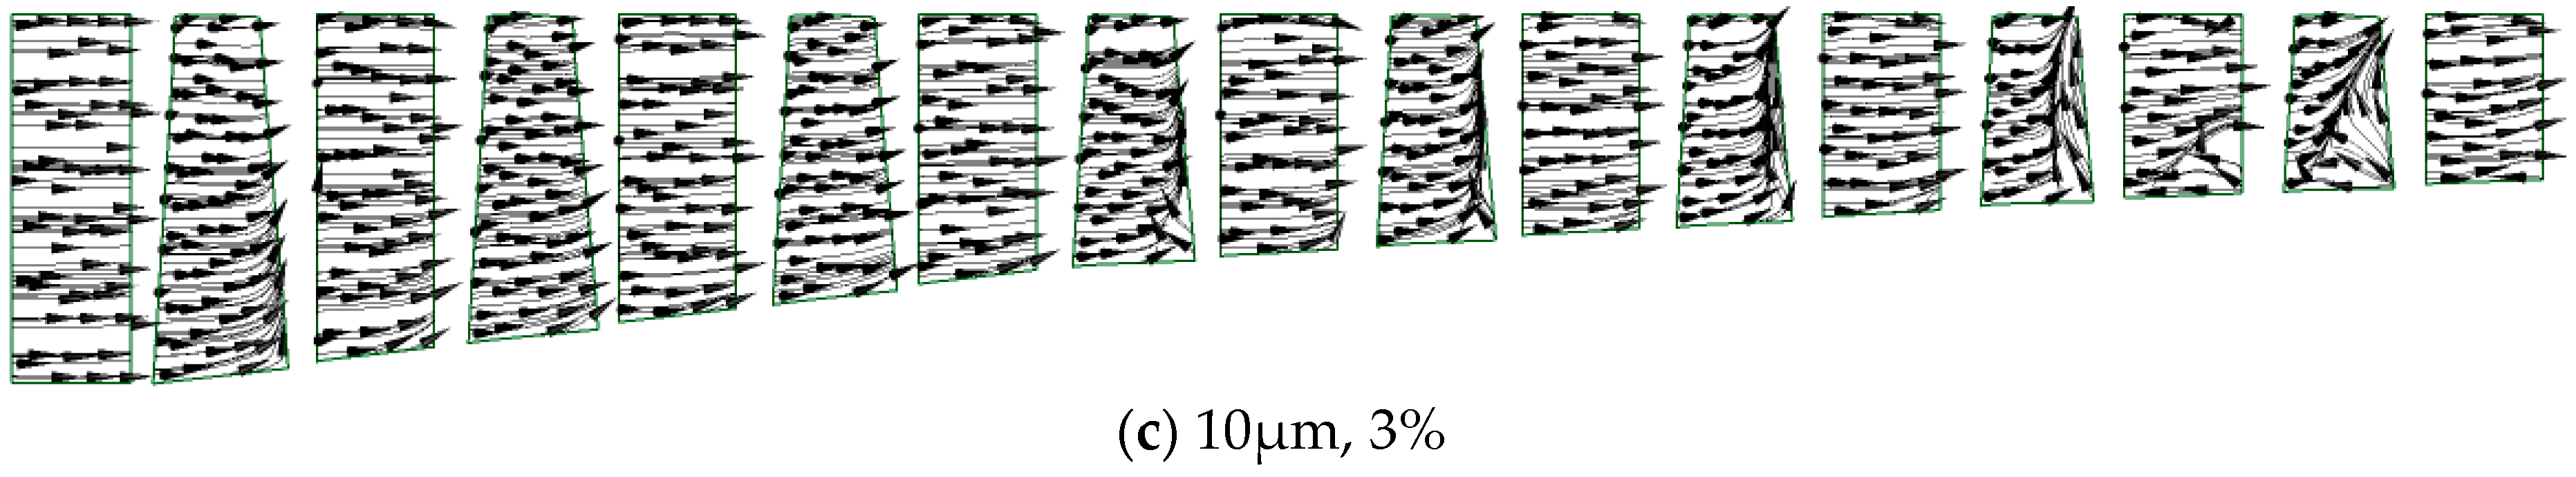
3.4. Analysis of Compressor Flow Distribution and Streamline at the Design Operating Condition with Different Wet Compression Cases

Figure 20 shows the temperature contours of a 50% span for the dry and different wet cases. It can be seen that the evaporation cooling effect of the water droplet is well represented during the whole compression process and the cooling effect can be improved with the decreasing of droplet size and increasing of the water injecting rate. In the front stages, the temperature is relatively lower, the evaporation cooling effect of the water droplet is relatively weaker, and the loss caused by airflow transpiration and droplets impinged with the blade wall is relatively large, so the cooling effect is not obvious. In the back stages, the decreasing temperature along the flow field can be sufficiently represented due to the large evaporation cooling effect of water droplets.
Figure 21 and Figure 22 show the Mach number contours on the blade to blade surfaces of a 50% span with wet cases under different droplet sizes and water injecting rates, respectively. Compared to the dry case, the Mach number in the front stages can be improved obviously, especially nearby the leading edge of the first rotor. From Figure 21 and Figure 22, moreover, it can be found that a better flow field is present for small size water droplets and a large water injecting rate to decrease the Mach number. It can be noted that, within the back stages (especially for the eighth rotor), the wet case with an injecting rate of 3% (Figure 22c) can result in a larger low-energy area nearby the trailing edge relative to 0.5% (Figure 22a) and 2% (Figure 22b) spray flow rates. It can be revealed that the overlarge injecting rate can lead to the formation of a low energy area, which means that the air of the front stages is not able to smoothly cross the compressor and can even block the whole flow passage. Hence, the benefit of spray flowrate on compressor characteristics is marginal, and there exists an appropriate spray flowrate.
Figure 23 and Figure 24 show the movement of streamlines on the suction surface under dry and different water injecting cases. In Figure 23, it can be seen that the air flow condition is relatively gentle in the front three stages, but appears to separate inordinately at the rotor root from the fourth to the eighth rotor, and even injecting small size water droplets cannot restrain the occurrence of air channeling. From Figure 24, we can see that the tendency of air channeling at the rotor blade suction surface from bottom to top, especially of the seventh and eighth rotor, becomes more acute with the increasing injecting rate. Compared to the dry case at the eighth rotor, the separated area can be enlarged to about 1/2 of the blade surface area in Figure 24c. The result indicates that the extent of pressure recovery in the back stages is relatively large as a result of the water evaporation cooling accumulative effect and the reversed pressure gradient in the back stages, so the phenomenon of air channeling at the rotor blade from bottom to top is strongly enhanced.

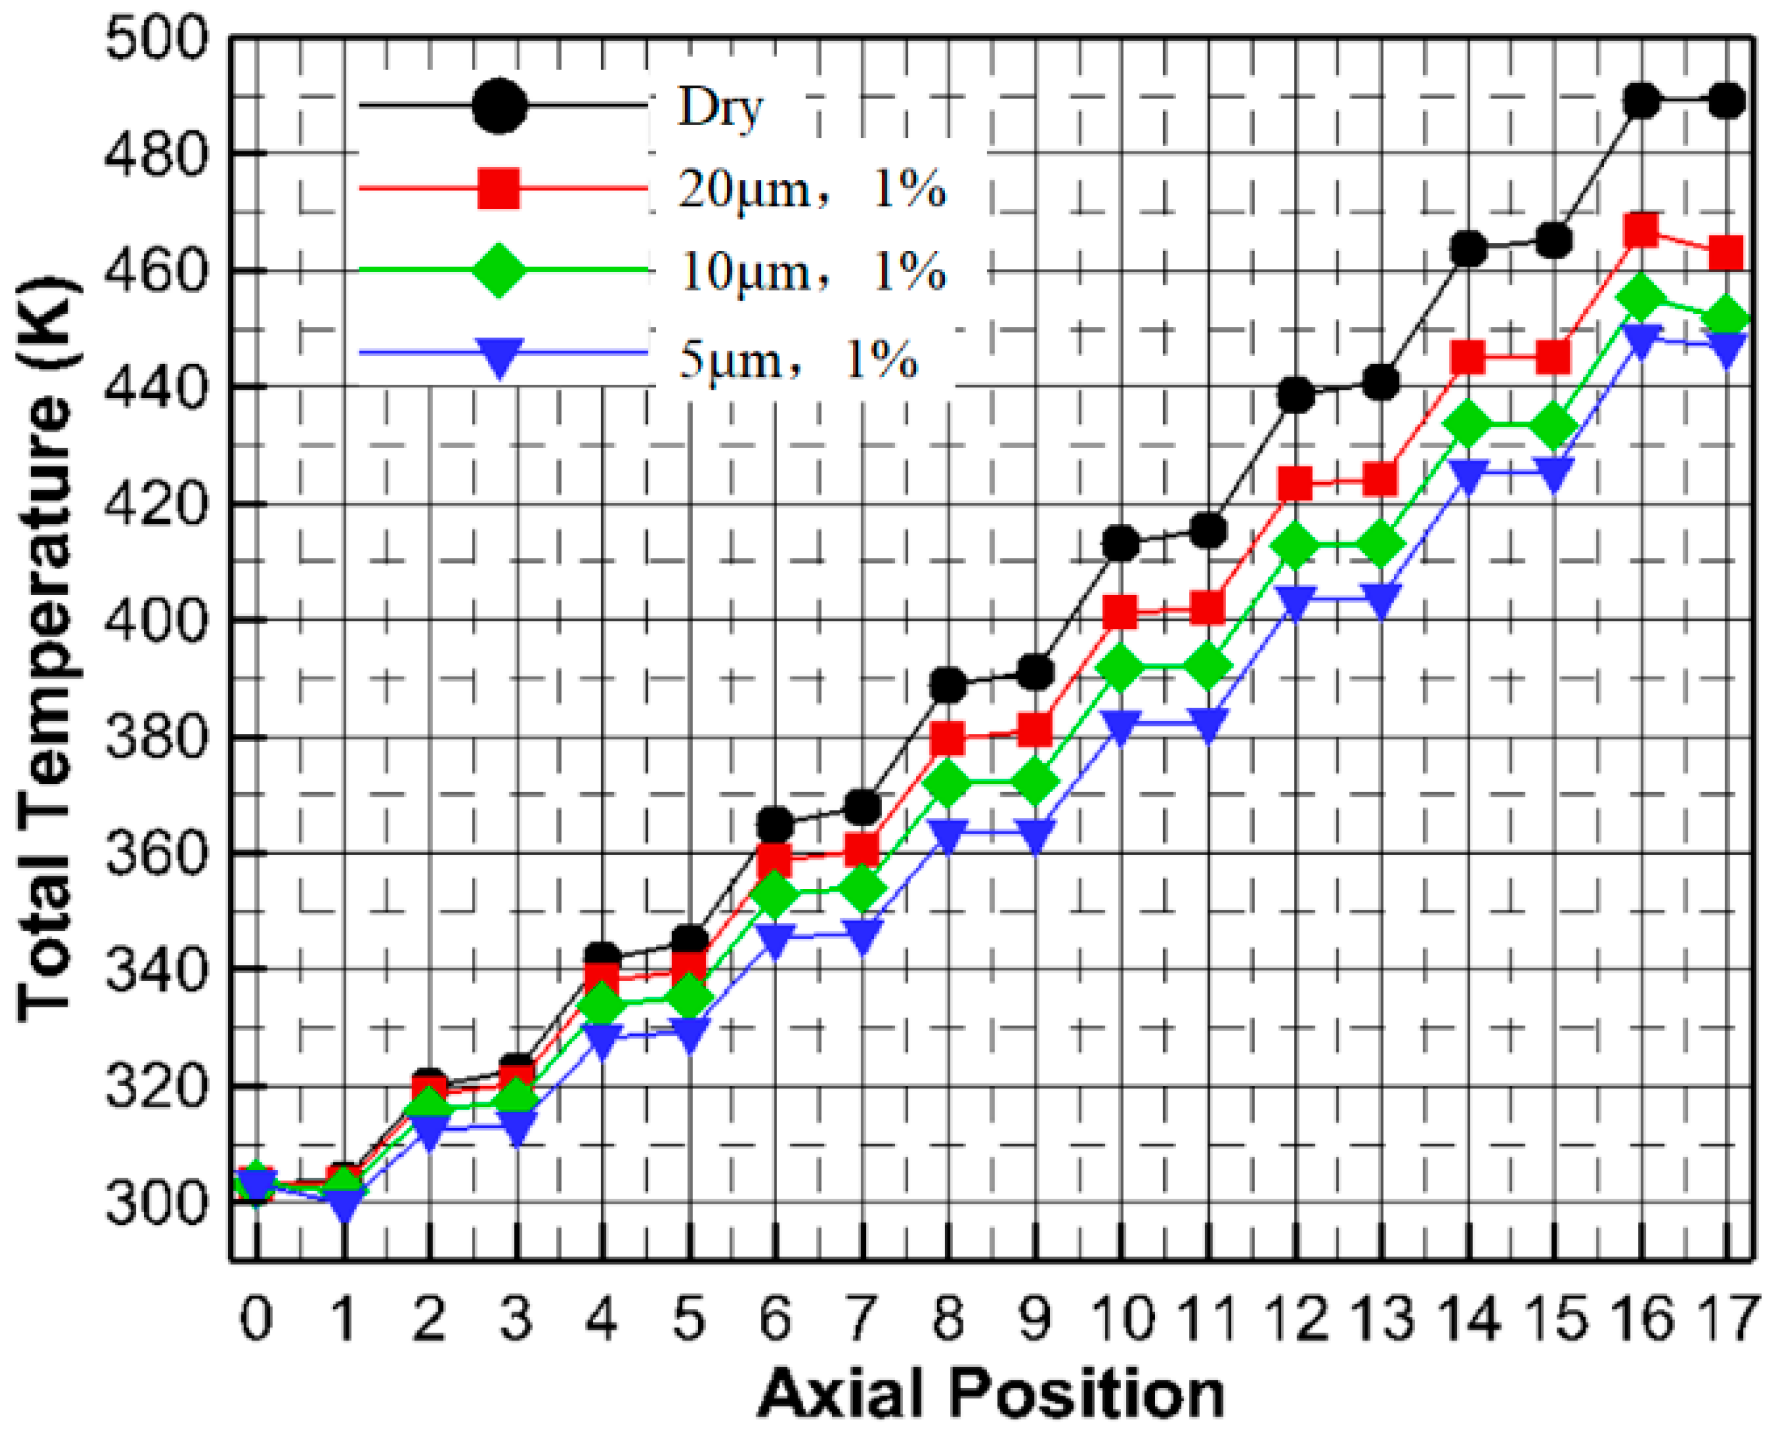
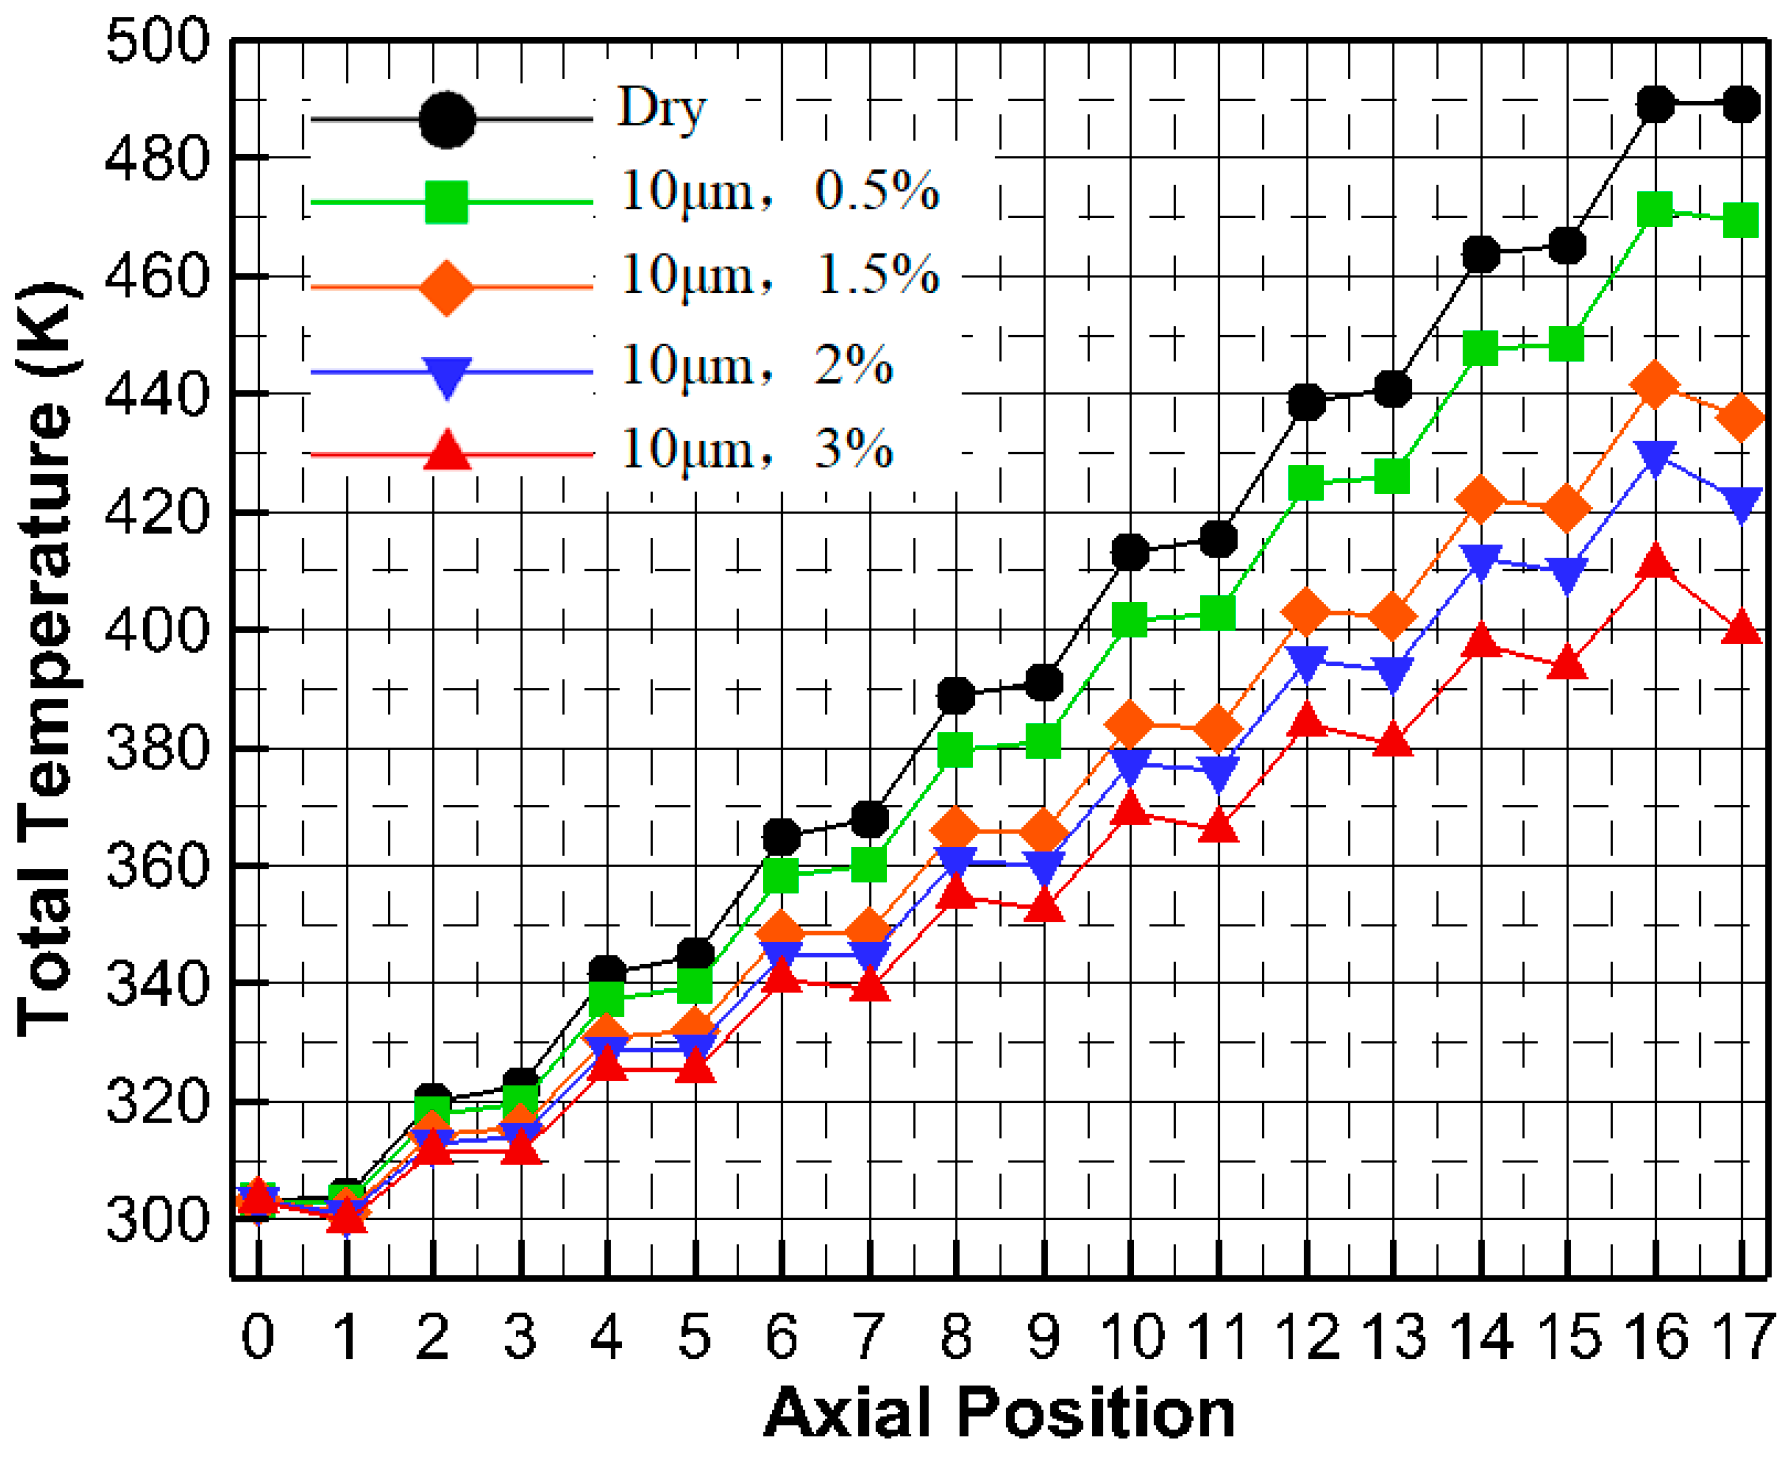
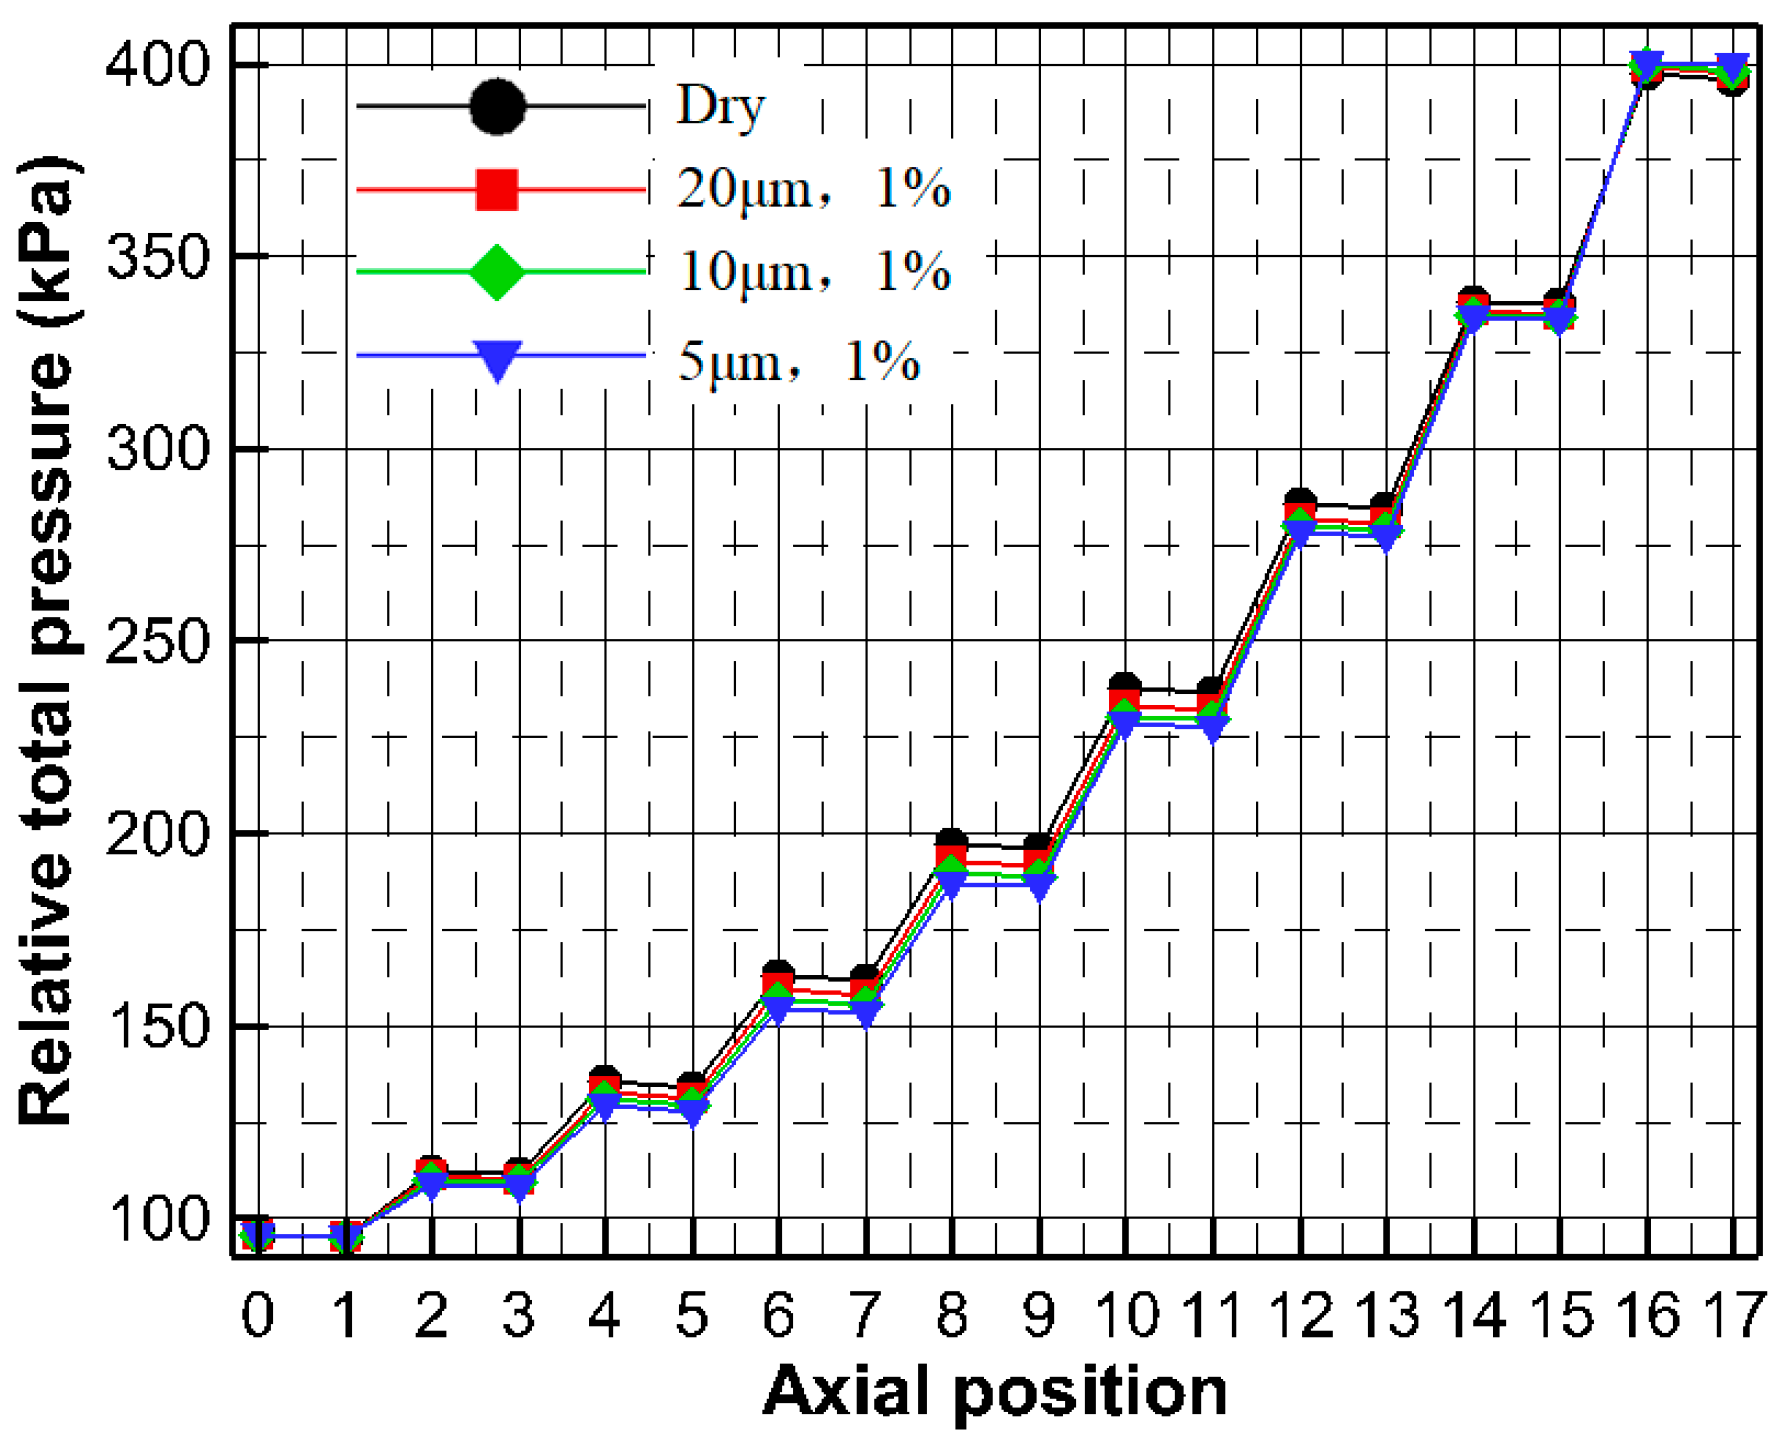
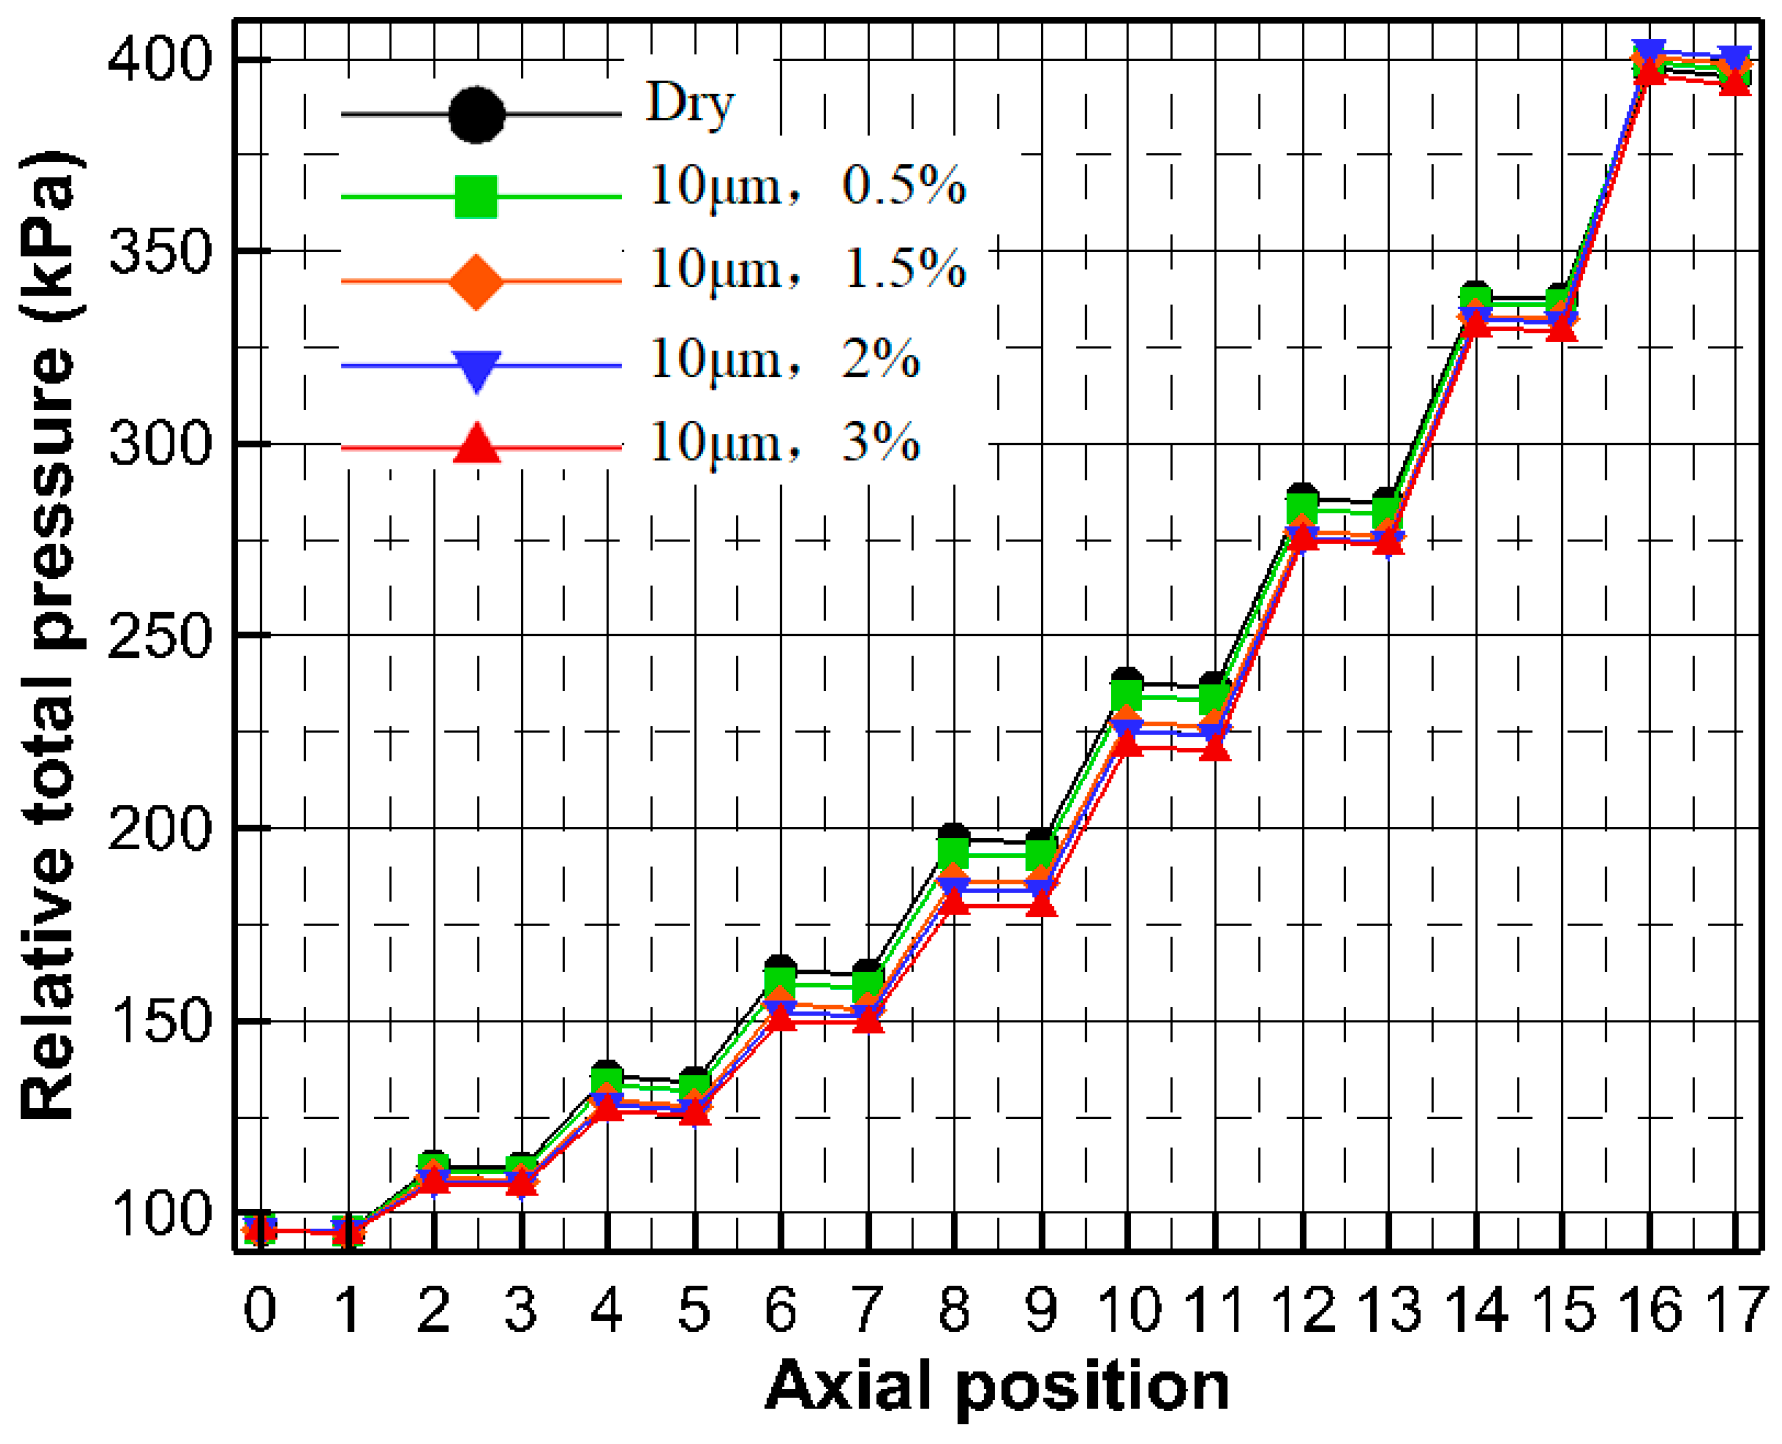
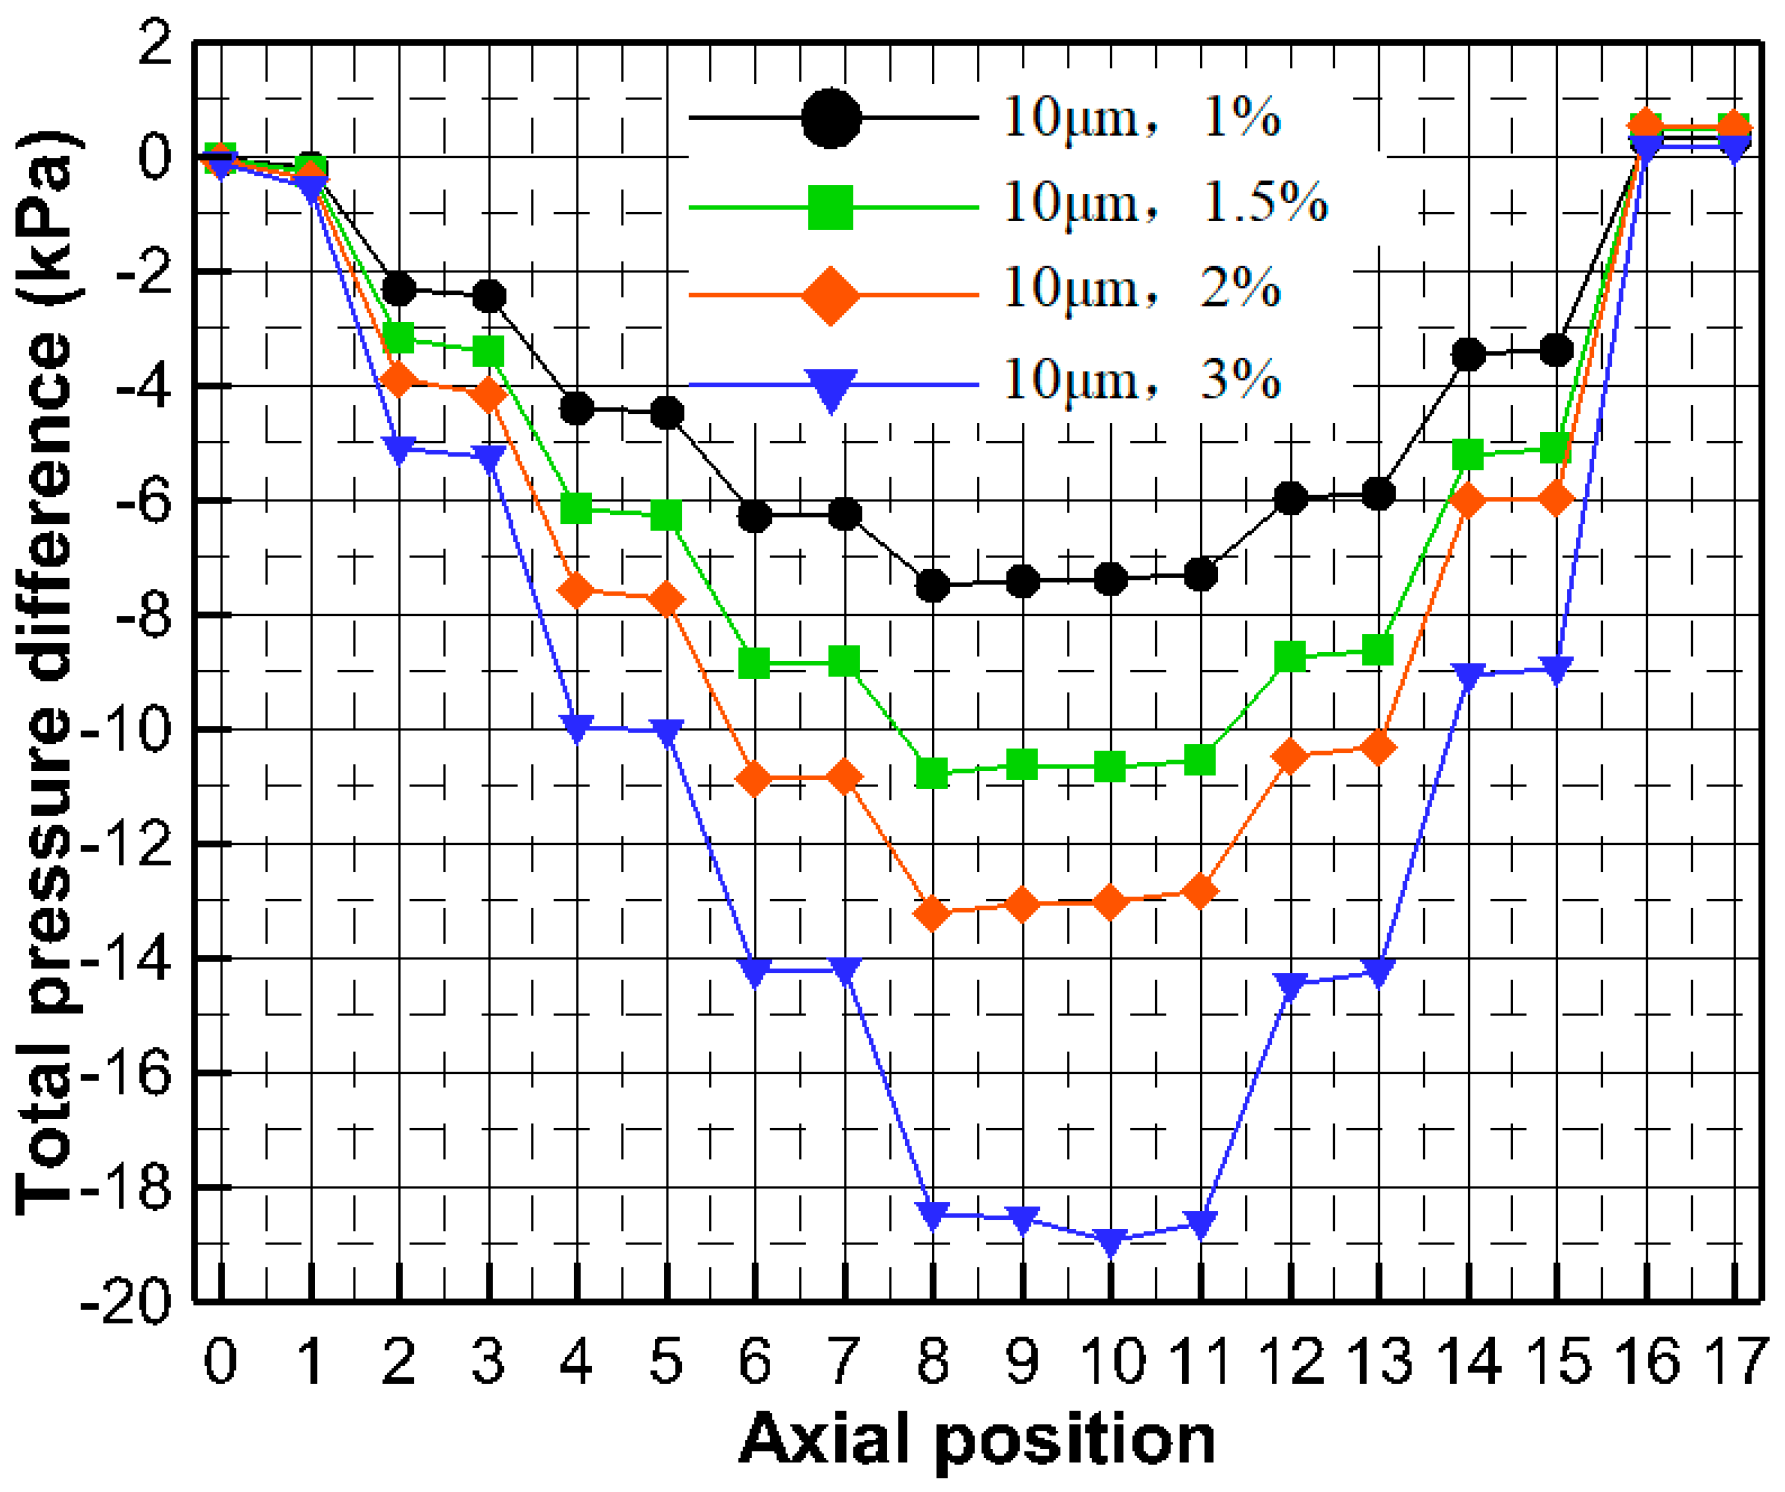
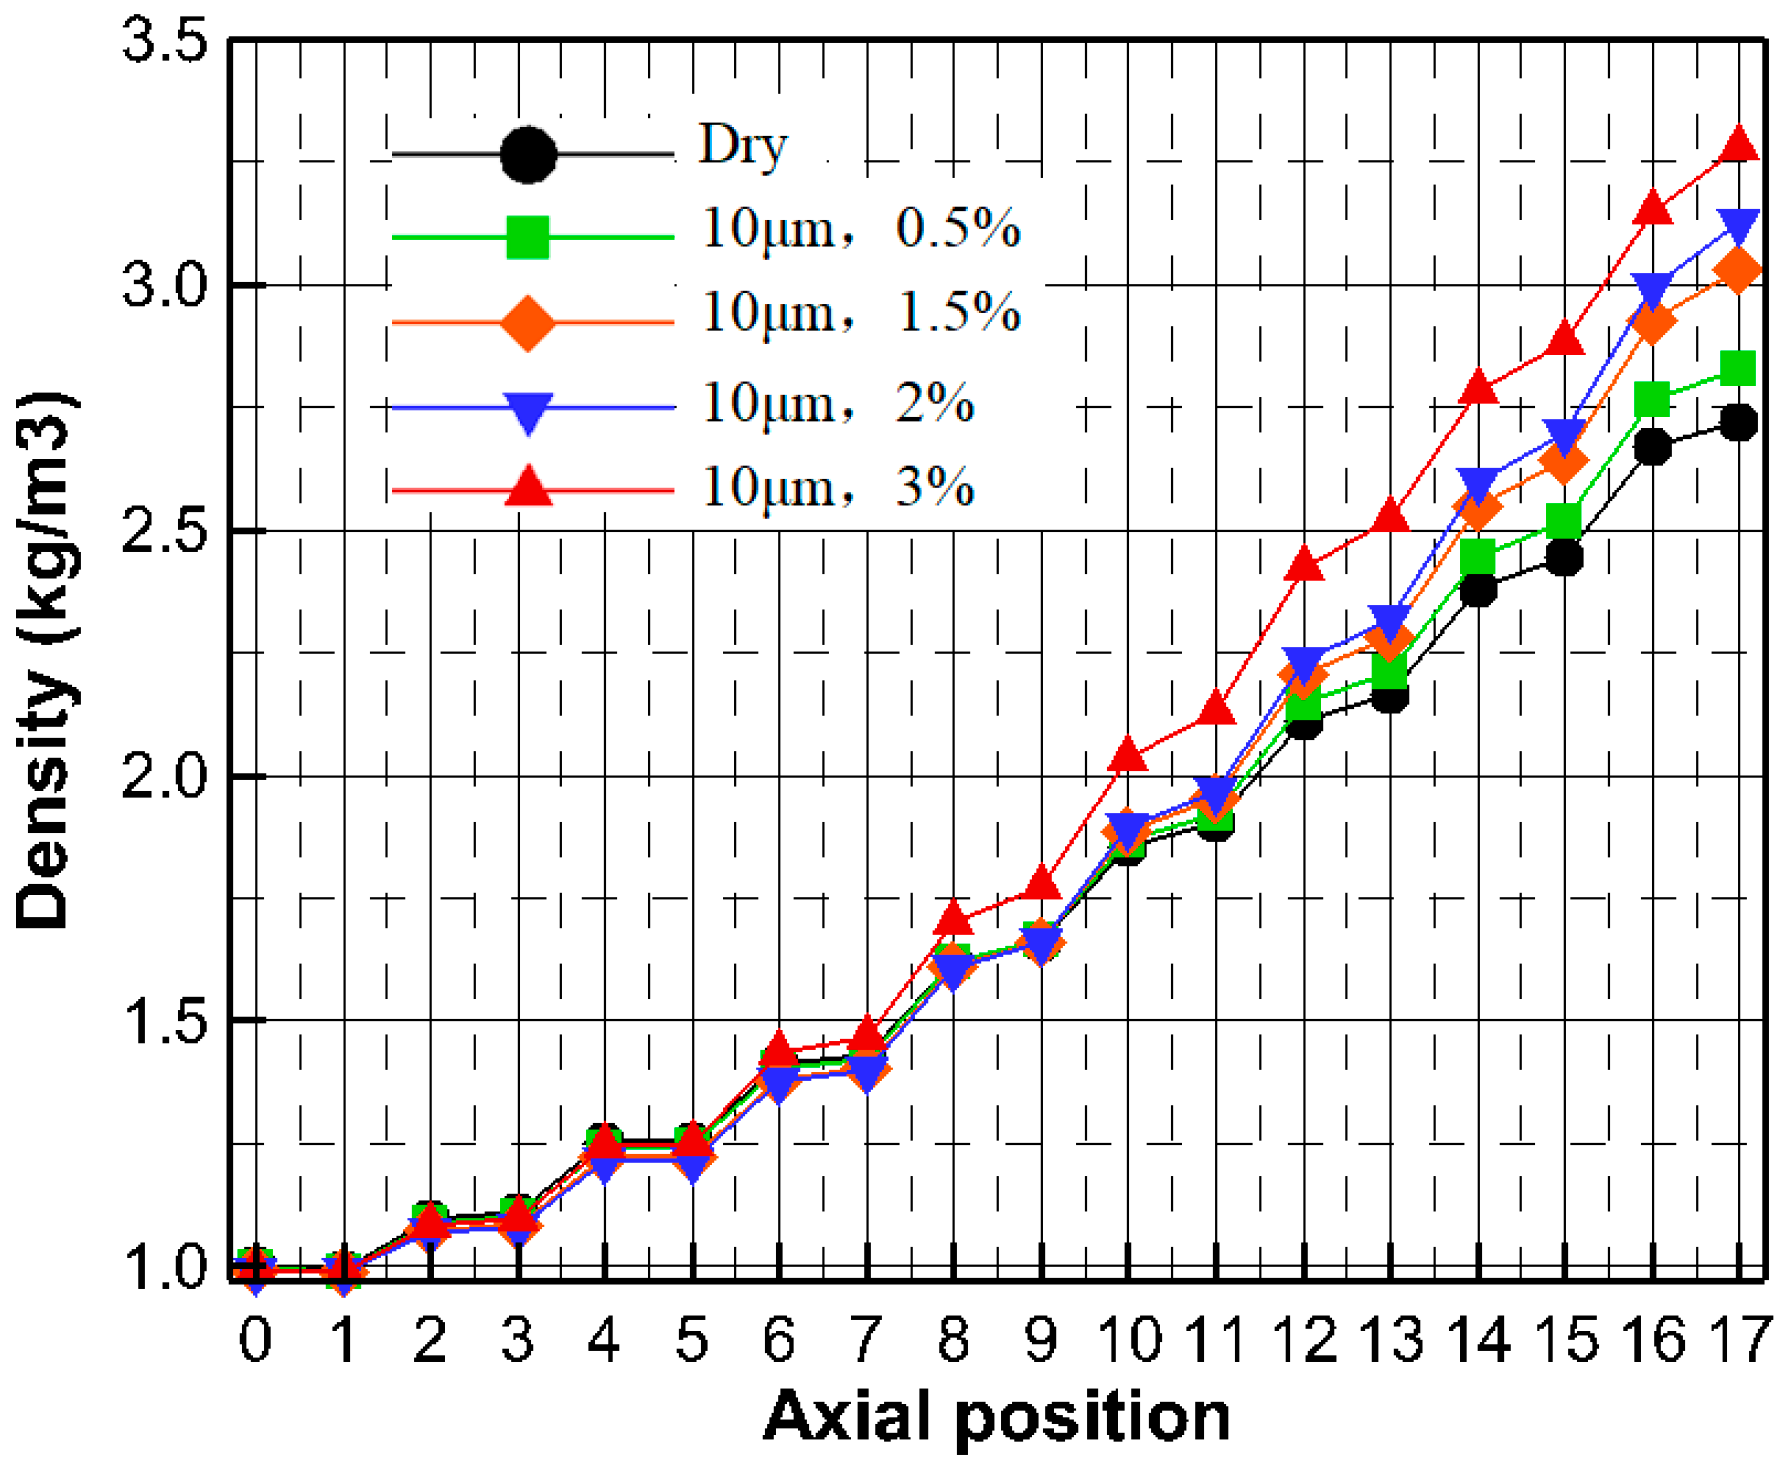
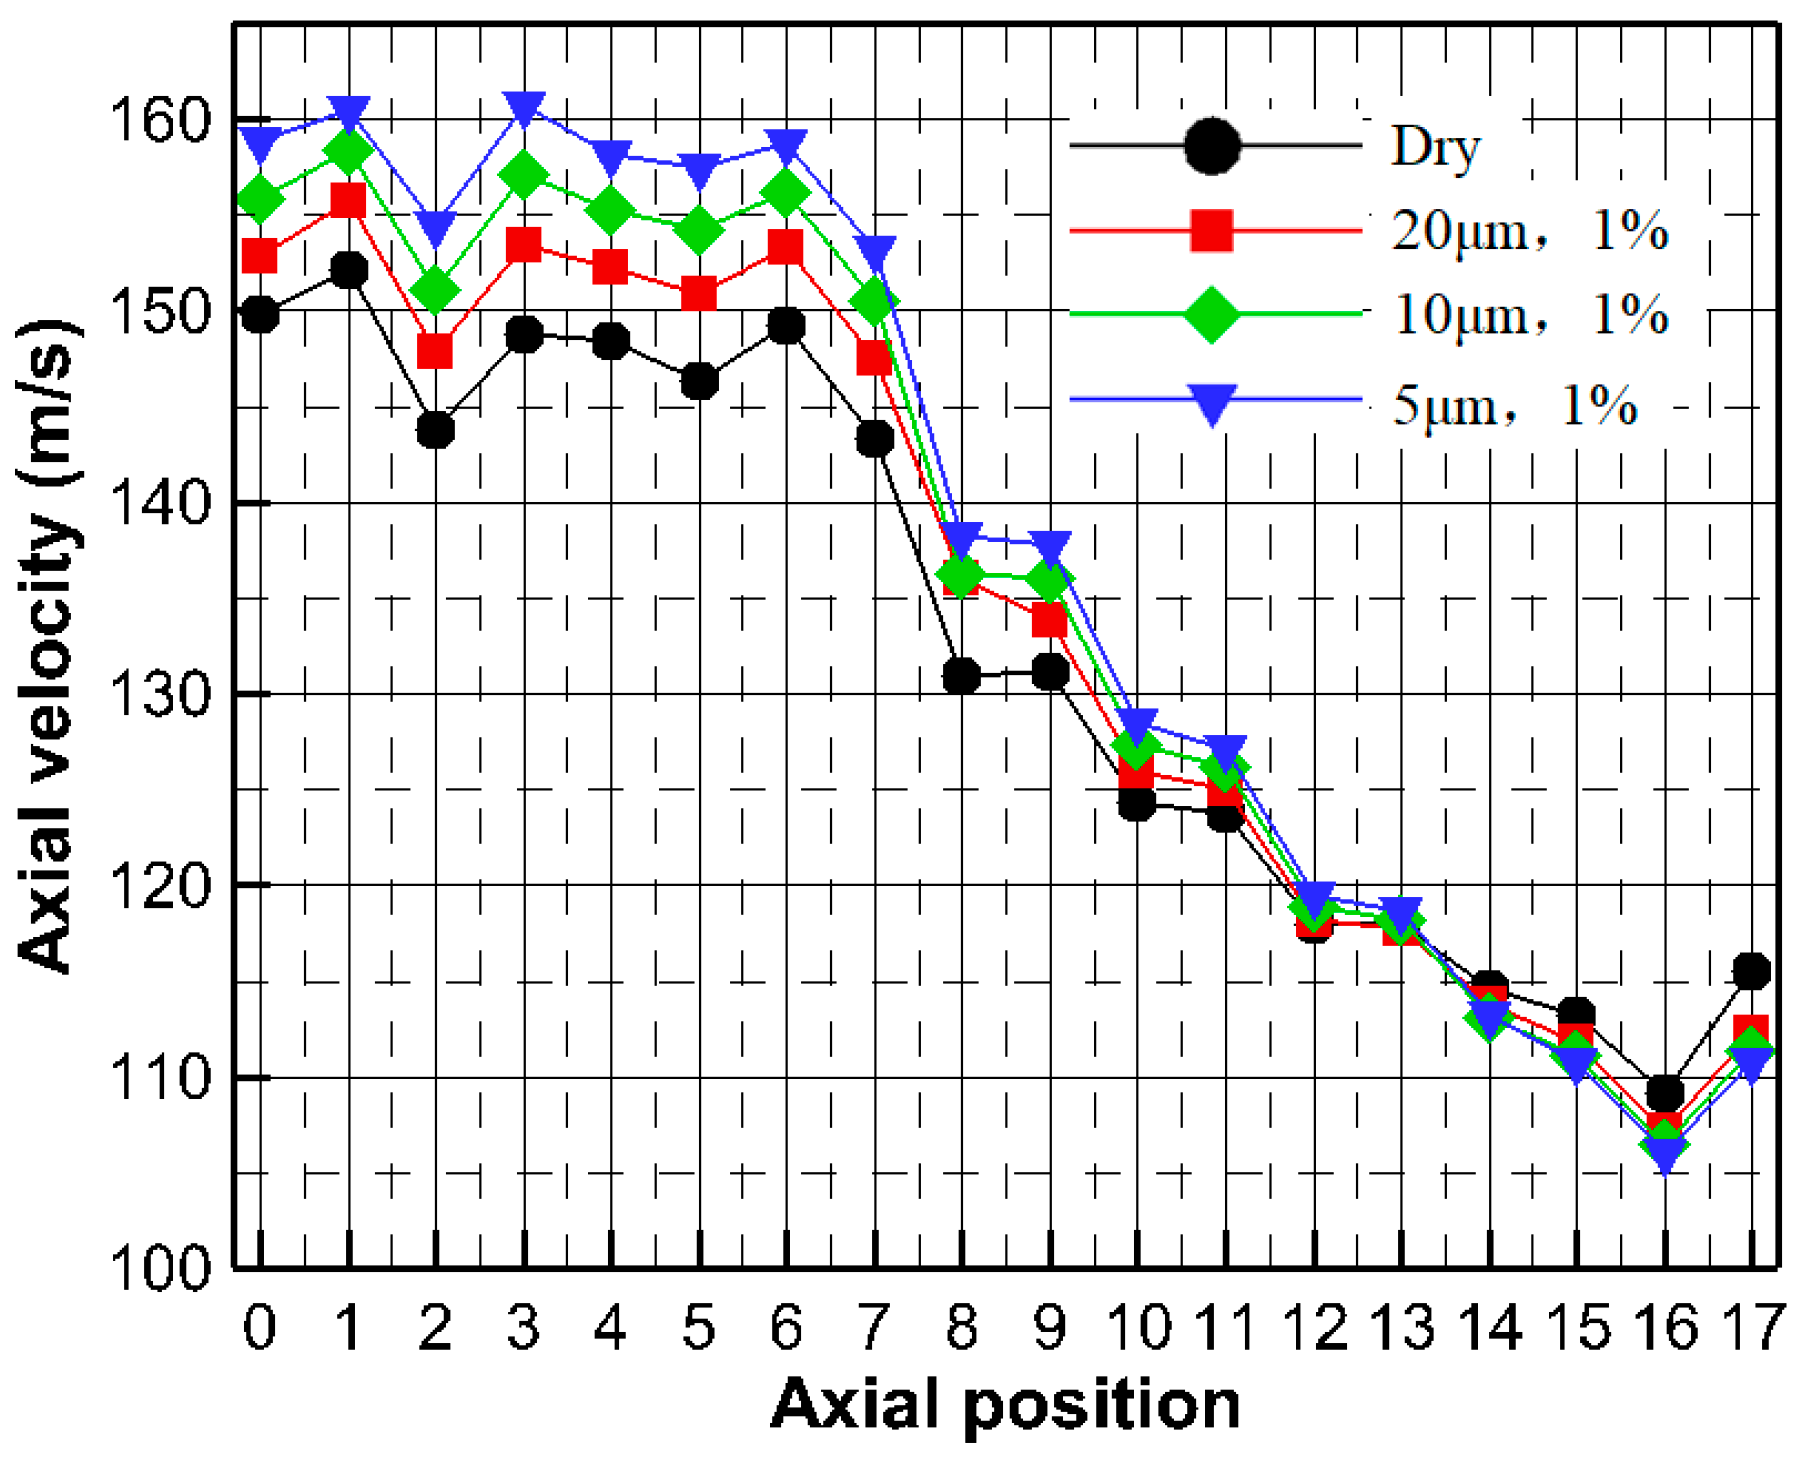
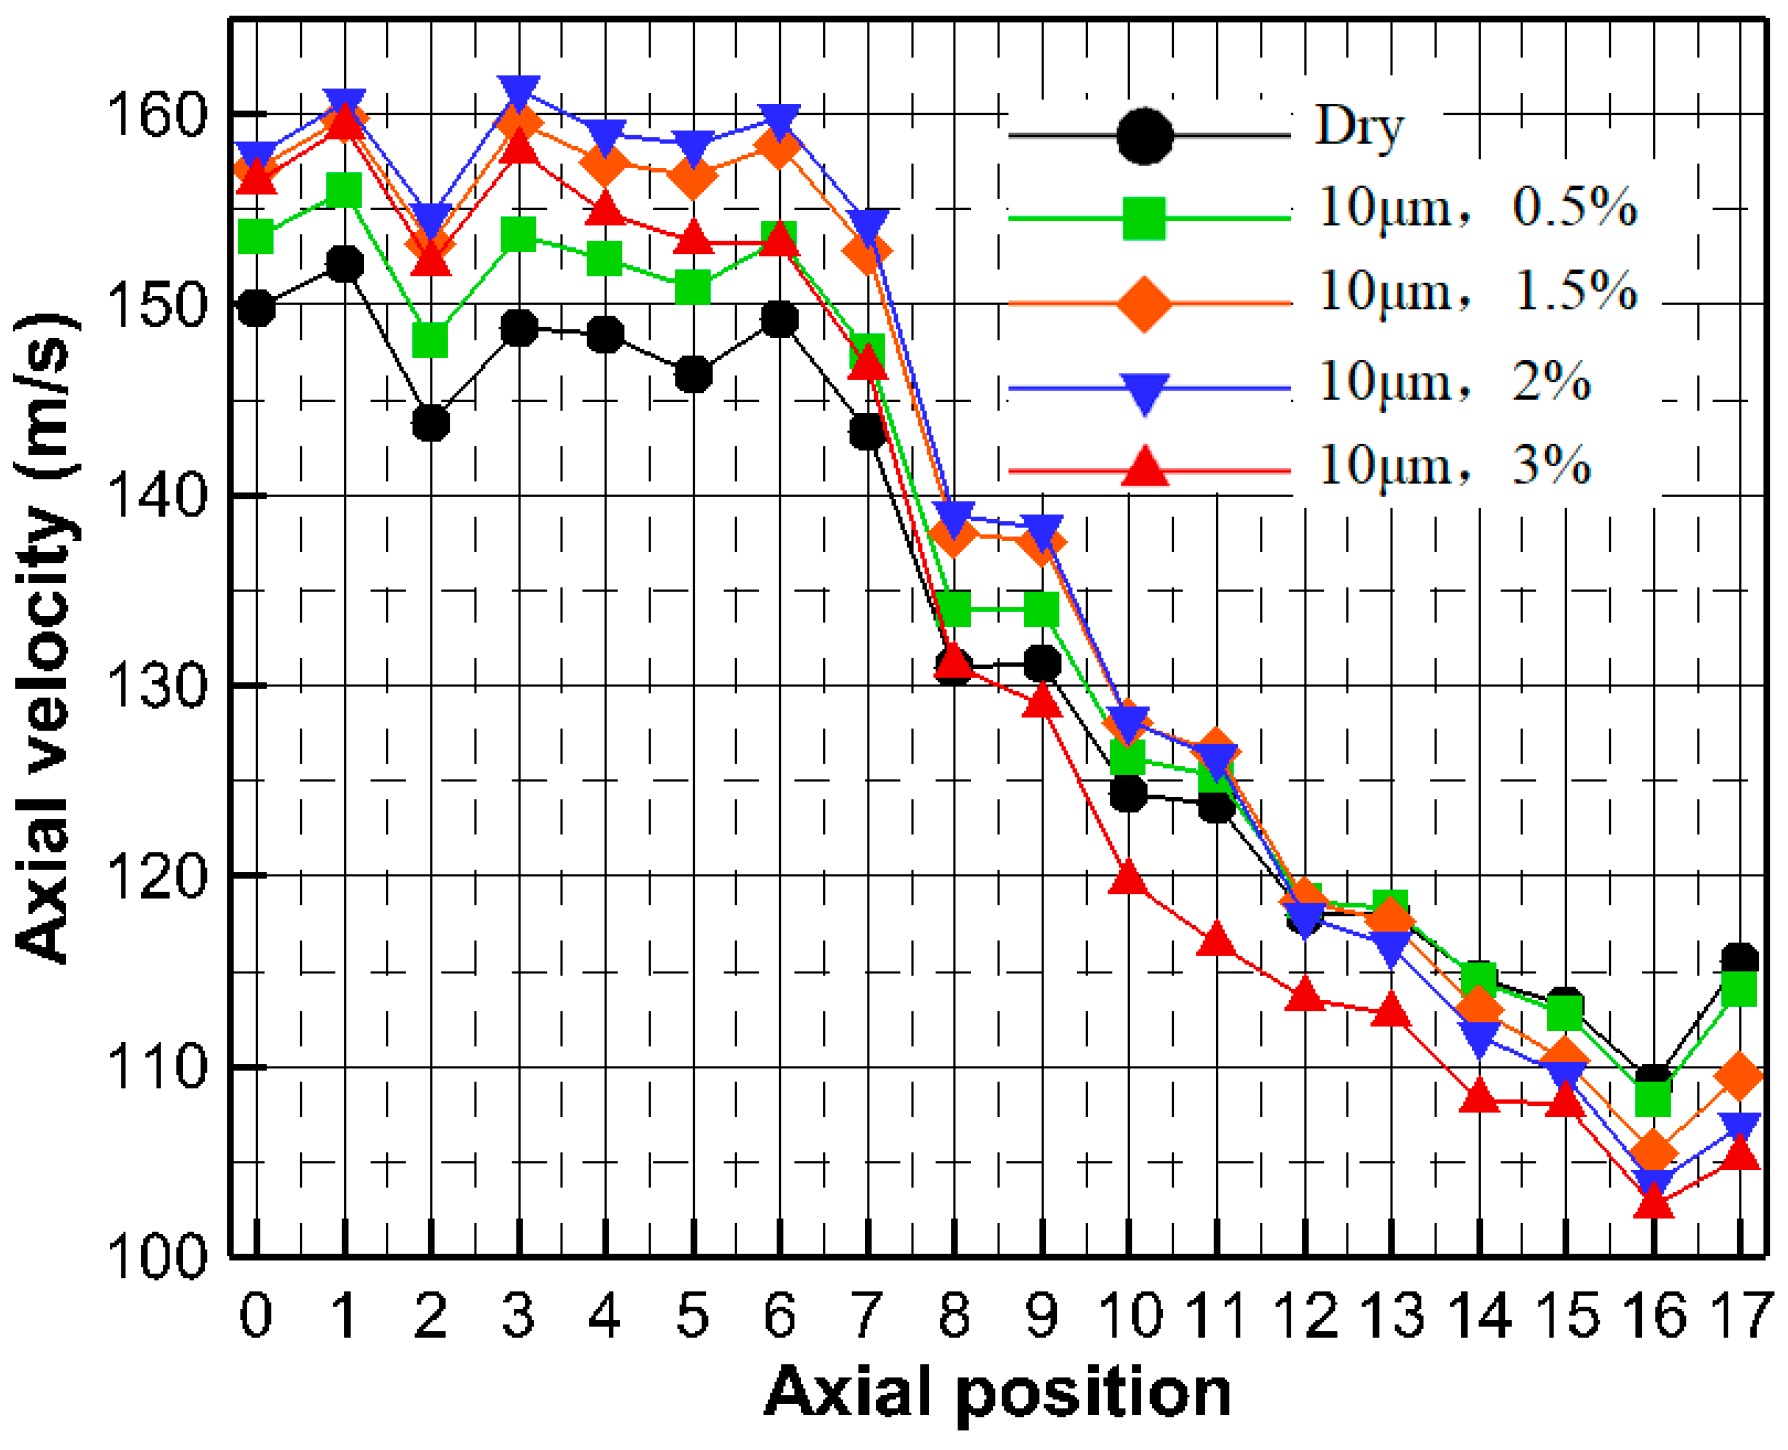
3.5. Compressor Stage-by-Stage Performance at the Design Operating Condition with Different Wet Compression Cases

The water droplet evaporation process is progressive in the multi-stage compressor. According to the different wet compression conditions, injecting water droplets can bring losses to a different extent. At the initial injecting time, the vaporization is relatively weak and there are so many unevaporated droplets with a very large size in the front stages that can bring about a large loss, such as resistance loss (the loss of airflow velocity) caused by the drag of droplets on the air flow and droplet-blade wall-impinged loss. The water droplets evaporation effect is relatively large in the back stages, the amount of evaporation drops is much higher in the back stages than in the front stages, and even initial injecting of a relatively small size is completely evaporated before the position of the compressor outlet. Whether injecting water droplets can improve the performance of a multi-stage compressor is determined by the evaporation cooling effect and the loss that droplets bring. Figure 25 and Figure 26 present the total temperature along the flow direction under different wet compression cases. Average total temperature is taken at each section in the rotor and stator passage. From the figures, we can see that the evaporation cooling effect of the water droplets to the air flow is relatively large in the back stages and the tendency increases with the decreasing of droplet size. It indicates that the evaporation cooling cumulative effect of smaller size droplets can fully be developed. From Figure 26, it can be seen that the evaporation cooling effect in the back stages increases and then declines with the increasing water injecting rate, and as a result of the loss of water droplets, increases stage-by-stage.
Figure 27 and Figure 28 show the relative total pressure distribution of each section at the rotor and stator passage along the axial direction under different wet injecting cases. From these two figures, it can be seen that the changing tendency of relative total pressure is lower in the front stages and higher in the back stages than that of the dry case and the extent is increases with a decreasing droplet size and increasing injecting rate. The total pressure difference of each wet case and dry case reaches its maximum at the outlet section of the fourth and fifth stage (corresponding to the 8th, 9th, 10th, and 11th blade row) as a result of the inert loss that water droplets bring. The evaporation cooling effect develops in the back stages and it recovers the total pressure so that the total-pressure drop decreases with the decreasing in droplet size and the increasing in water injection rate.
Figure 29 and Figure 30 present the total pressure difference at each section between different wet compression and dry cases. The total pressure difference values are all negative in the front seven stages and are positive at the final stages of the outlet, except for the wet case with a droplet size 10 μm and water injecting rate of 3%. The results indicate that the total pressure ratio of the wet cases is always lower in the front stages than that of the dry cases and forereach that of the dry case in the back stages. A large size and number of water droplets can bring relatively large losses under the same water injecting rate. Figure 29 shows that the tendency of total pressure drop in the front stages increases with the decreasing droplet size as a result of larger losses caused by the large number of water droplets, especially in the case of an injecting rate of 1% and droplet size of 5 μm (the maximum total pressure drop value reaches 10.15 kPa). In the back three stages, the evaporative cooling effect of relatively smaller size droplets is so large that it can make up for the losses brought about by the water droplets and thus the total pressure improves obviously. The results in Figure 30 indicate that the accumulative effect of evaporative cooling in the back stages can compensate for the inert loss brought about by water droplets with the wet cases, which have an injecting rate below 3%. It can be inferred that when the water injecting rate increases above 3%, further negative effects of droplets develop. Although the evaporative cooling effect is reflected in the back stages, this is not enough to compensate for the loss brought about by the droplets, so the total pressure at the compressor outlet with wet cases will be lower than that of the dry cases.
Figure 31 and Figure 32 show the variation of the gas density along the axial direction of each section of the blade passage under the dry and wet compression cases. It can be seen that the water evaporative process is progressive in the compression, so the gas medium density in the wet cases is larger than that in the dry cases and the tendency increases stage-by-stage. The improvement of gas medium density increases with the increasing injecting rate and the decreasing droplet size. The density elevation of the air-vapor mixture is reflected in the back four stages under the influence of different droplet sizes, but reflected in the back five stages under the influence of different water injecting rates. Compared to the dry case, the density of the air-vapor mixture in the compressor outlet only increases by 4.9%, 6.9%, and 7.8% with an injecting rate of 1% and droplet sizes of 20 μm, 10 μm, and 5 μm, respectively, and can reach 11.3%, 14.8%, and 20.4% with the droplet size of 10μm and injecting rates of 1.5%, 2%, and 3%, respectively.
Figure 33 and Figure 34 show the axial velocity change of gas medium in each section along the axial direction in the dry and wet compression cases. The change in the axial velocity of gas medium in the wet compression process can directly reflect the change law of the volume flow rate along the flow direction. The variation tendency of the axial velocity is the same with the volume flow rate under the same rotating speed, so we can observe the characteristic between the dry and wet compression cases using the change of axial velocity instead of the volume flow rate. From these two figures, it can be seen that inlet water injecting can make the front stages operating condition similar to the dry case, with relatively large flows. The results in these figures are consistent with the result of the total pressure characteristic. The increasing number of water droplets and water injecting rate can generate a much greater total pressure loss and in the front stages, the evaporative effect is relatively poor, so cannot compensate for the loss by water droplets. However, in the back stages, due to the evaporative capacity of water largely increasing, the evaporative effect is sufficient to compensate for the pressure loss. That is to say, the total pressure increment in the back stages is larger than that in the front stages, so it can make the back stages operating condition similar to the dry cases, which have a relatively small flowrate. It seems that the operating state with wet compression is opposite to the compressor operating near the surge boundary, which presents the phenomenon of “former surged and back blocking”. In the wet case with an injecting rate of 3%, compared to the wet case with an injecting rate that is relatively small (injecting rate 2%), it can be seen that when the water injecting rate increases by a certain degree, the number of unevaporated water droplets increases, in spite of the fact that the evaporative cooling effect is relatively large and the axial velocity of air-vapor medium decreases as a result of the large inert resistance generated by vast unevaporated water droplets.

4. Conclusions

In this paper, the influence of water injecting at an eight-stage compressor inlet has been studied by considering the effect of secondary aerodynamic breakup and droplet-blade impinged breakup under different injecting rates and droplet sizes. The water droplet movement and evaporative condition with different breakup models have been studied under different rotating speeds. The changes of the multistage compressor performance with wet compression at its design operating point and the 3-D flow distribution in the whole passage have been investigated. Finally, the compressor stage-by-stage performance at the design operating condition with different wet compression cases has been studied. Based on the research and results, the following conclusions can be made.
For a multistage compressor, the inlet mass flow near the stall and chocking boundary can be improved with water droplet injecting. The evaporative cooling effect is remarkable in the wet compression process. The consumption of specific compression work with wet compression with an appropriate injecting rate is obviously lower than dry compression when using the same total pressure ratio. Moreover, the compressor can operate with a relatively high efficiency in a wide working range.
According to the movement and evaporative condition of water droplets in the compressor under different rotating speeds and different breakup models, the effect of aerodynamic breakup can be ignored when the droplet size less than 20 μm and the effect of water droplet impinged with the blade wall needs to be taken into account when the droplet size is larger than 5 μm. A relatively small size water droplet can completely evaporate upstream or at the position of the compressor outlet and the completely evaporative position becomes further forward with an increasing rotating speed. The phenomenon of radial migration is obvious, especially with the case of relatively large size droplets and the radial migration tendency of large size droplets increases with the increasing rotating speed.
Whether injecting water droplets improves the performance of a multi-stage compressor is determined by the evaporation cooling effect and the inert loss that droplets bring. The accumulated evaporative cooling effect can fully reflect the compressor back stages. As measured in the axial velocity or volume flow rate of the air-vapor mixture, injecting water at the compressor inlet can make the working condition in the front stages close to the dry case of relatively large flow rates and that in back stages close to the dry case of relatively small flow rates. This working condition is more significant with an increasing injecting rate and decreasing droplet size. In addition, the operating state with wet compression is opposite to the compressor operating near the surge boundary, which presents the phenomenon of “former surged and back blocking”. It is therefore shown that inlet injecting water can be used as a technology for controlling the rotating stall in the compressor.

Author Contributions

Conceptualization, M.L., C.L., Q.Z., Y.J. and Q.W.; Methodology, M.L., C.L. and Q.Z.; Validation, M.L.; Analysis, M.L., C.L. and A.L.; Supervision, Q.Z.; Writing—original draft, M.L. and C.L.; Writing—review and editing, A.L. and M.L.; Funding acquisition, M.L.

Acknowledgments

This work has been supported by Fundamental Research Funds for the Central Universities of China (No: HEUCFJ180301), which is gratefully acknowledged.

Conflicts of Interest

We declare that we have no conflict of interest.

References

  1. Zheng, Q.; Sun, Y.; Li, S.; Wang, Y. Thermodynamic analyses on wet compression process in the compressor of gas turbine. In Proceedings of the ASME Turbo Expo 2002, Amsterdam, The Netherlands, 3–6 June 2002. ASME Paper No: GT2002-30590. [Google Scholar]
  2. Meher-Homji, C.B.; Chaker, M. Parametric analysis of combined cycles equipped with inlet fogging. In Proceedings of the ASME Turbo Expo 2013, San Antonio, TX, USA, 3–7 June 2013. ASME Paper No: GT2013-94526. [Google Scholar]
  3. Chiang, H.W.D.; Wang, P.Y. Gas turbine power augmentation by inlet fogging. Int. J. Turbo Jet-Eng. 2006, 23, 259–276. [Google Scholar] [CrossRef]
  4. Bhargava, R.; Meher-Homji, C.B. Parametric analysis of existing gas turbines with inlet evaporative and overspray fogging. In Proceedings of the ASME Turbo Expo 2002, Amsterdam, The Netherlands, 3–6 June 2002. ASME Paper No: GT2002-30560. [Google Scholar]
  5. De Lucia, M.; Lanfranchi, C.; Boggio, V. Benefits of compressor inlet air cooling for gas turbine cogeneration plants. J. Eng. Gas Turbines Power 1996, 118, 598–603. [Google Scholar] [CrossRef]
  6. Sexton, W.R.; Sexton, M.R. The effects of wet compression on gas turbine engine operating performance. In Proceedings of the ASME Turbo Expo 2003, Atlanta, GA, USA, 16–19 June 2003. ASME Paper No: GT2003-38045. [Google Scholar]
  7. Najjar, Y.S.H. Enhancement of performance of gas turbine engines by inlet air cooling and cogeneration system. Appl. Therm. Eng. 1996, 16, 163–173. [Google Scholar] [CrossRef]
  8. Sun, L.; Zheng, Q.; Luo, M.; Li, Y.; Bhargava, R.K. Understanding behavior of water droplet in a transonic compressor rotor with wet compression. In Proceedings of the ASME Turbo Expo 2010: Power for Land, Sea, and Air, Glasgow, UK, 14–18 June 2010. ASME Paper No. GT2010-23141. [Google Scholar]
  9. Bhargava, R.K.; Meher-Homji, C.B.; Chaker, M.A.; Peretto, A.; Bianchi, M.; Melino, F.; Ingistov, S. Gas turbine fogging technology—A state-of-the-art review, part I: Inlet evaporative fogging—Analytical and experimental aspects. J. Eng. Gas Turbines Power 2007, 129, 71–82. [Google Scholar] [CrossRef]
  10. Cao, L.; Lin, A.; Li, Y.; Xiao, B. Optimum tilt angle of flow guide in steam turbine exhaust hood considering the effect of last stage flow field. Chin. J. Mech. Eng. 2017, 30, 866–875. [Google Scholar] [CrossRef]
  11. Bianchi, M.; Melino, F.; Peretto, A.; Spina, P.R.; Bhargava, R.; Ingistov, S. A parametric study of interstage injection on GE frame 7 EA gas turbine. In Proceedings of the ASME Turbo Expo 2004: Power for Land, Sea, and Air, Vienna, Austria, 14–17 June 2004. ASME Paper No. GT2004-53042.. [Google Scholar]
  12. Lin, A.; Zheng, Q.; Yang, L.; Zhang, H. Effect of inlet air pre-cooling of water injection on compressor performance at high flight Mach. J. Appl. Fluid. Mech. 2019, 12, 421–431. [Google Scholar]
  13. Kleinschmidt, R.V. Value of wet compression in gas-turbine cycles. Mech. Eng. 1947, 69, 115–116. [Google Scholar]
  14. Roumeliotis, I.; Mathioudakis, K. Evaluation of water injection effect on compressor and engine performance and operability. Appl. Energy 2010, 87, 1207–1216. [Google Scholar] [CrossRef]
  15. Horlock, J.H. Compressor performance with water injection. In Proceedings of the ASME Turbo Expo 2001, New Orleans, LA, USA, 4–7 June 2001. ASME Paper No: 2001-GT0343. [Google Scholar]
  16. Moon, S.; Li, T.; Sato, K.; Yokohata, H. Governing parameters and dynamics of turbulent spray atomization from modern GDI injectors. Energy 2017, 127, 89–100. [Google Scholar] [CrossRef]
  17. Agarwal, A.; Trujillo, M.F. A closer look at linear stability theory in modeling spray atomization. Int. J. Multiph. Flow 2018, 109, 1–13. [Google Scholar] [CrossRef]
  18. Anez, J.; Ahmed, A.; Hecht, N.; Duret, B.; Reveillon, J.; Demoulin, F.X. Eulerian–Lagrangian spray atomization model coupled with interface capturing method for diesel injectors. Int. J. Multiph. Flow 2018. [Google Scholar] [CrossRef]
  19. Bhargava, R.; Meher-Homji, C.B. Parametric analysis of existing gas turbines with inlet evaporative and overspray fogging. J. Eng. Gas Turbines Power 2005, 127, 145–158. [Google Scholar] [CrossRef]
  20. Lin, A.; Sun, Y.; Zhang, H.; Lin, X.; Yang, L.; Zheng, Q. Fluctuating characteristics of air-mist mixture flow with conjugate wall-film motion in a compressor of gas turbine. Appl. Therm. Eng. 2018, 142, 779–792. [Google Scholar] [CrossRef]
  21. Bhargava, R.; Meher-Homji, C.B.; Chaker, M.A.; Bianchi, M.; Melino, F.; Peretto, A.; Ingistov, S. Gas turbine fogging technology: A state-of-the-art review—Part II Overspray fogging-Analytical and experimental aspects. J. Eng. Gas Turbines Power 2007, 129, 454–460. [Google Scholar] [CrossRef]
  22. Härtel, C.; Pfeiffer, P. Model analysis of high-fogging effects on the work of compression. In Proceedings of the ASME Turbo Expo 2003, Atlanta, GA, USA, 16–19 June 2003. ASME Paper No: GT2003-38117. [Google Scholar]
  23. Bardon, M.F. Modified Brayton cycles utilizing alcohol fuels. J. Eng. Power 1982, 104, 341–348. [Google Scholar] [CrossRef]
  24. Bardon, M.F.; Fortin, C. Methanol dissociative intercooling in gas turbines. In Proceedings of the ASME 1982 International Gas Turbine Conference and Exhibit, London, UK, 18–22 April 1982. Paper No. 82-GT-176. [Google Scholar]
  25. Hill, P.G. Aerodynamic and thermodynamic effects of coolant injection on axial compressors. Aeronaut. Q. 1963, 14, 331–348. [Google Scholar] [CrossRef]
  26. Wang, T.; Khan, J.R. Overspray and interstage fog cooling in compressor using stage stacking scheme—Part I: Development of theory and algorithm. In Proceedings of the ASME Turbo Expo 2008: Power for Land, Sea, and Air, Berlin, Germany, 9–13 June 2008. ASME Paper No. GT2008-50322. [Google Scholar]
  27. Wang, T.; Khan, J.R. Overspray and interstage fog cooling in compressor using stage stacking scheme—Part II: A case study. In Proceedings of the ASME Turbo Expo 2008: Power for Land, Sea, and Air, Berlin, Germany, 9–13 June 2008. ASME Paper No. GT2008-50323. [Google Scholar]
  28. Abdelwahab, A. An investigation of the use of wet compression in industrial centrifugal compressors. In Proceedings of the ASME Turbo Expo 2006, Barcelona, Spain, 8–11 May 2006. ASME Paper No: GT2006-90695. [Google Scholar]
  29. Kim, K.H.; Perez-Blanco, H. An assessment of high-fogging potential for enhanced compressor performance. In Proceedings of the ASME Turbo Expo 2006, Barcelona, Spain, 8–11 May 2006. ASME Paper No: GT2006-90482. [Google Scholar]
  30. Sun, L.; Li, Y.; Zheng, Q.; Bhargava, R. Understanding effects of wet compression on separated flow behavior in an axial compressor stage using CFD analysis. J. Turbomach. 2011, 133, 031026. [Google Scholar] [CrossRef]
  31. Luo, M.; Zheng, Q.; Sun, L.; Deng, Q.; Chen, J.; Wang, J.; Bhargava, R. The effects of wet compression and blade tip water injection on the stability of a transonic compressor Rotor. ASME J. Eng. Gas Turbines Power 2012, 134, 092001. [Google Scholar] [CrossRef]
  32. Luo, M.; Zheng, Q.; Sun, L.; Deng, Q.; Li, S.; Liu, C.; Bhargava, R. The numerical simulation of inlet fogging effects on the stable range of a transonic compressor stage. In Proceedings of the ASME Turbo Expo 2011, Vancouver, BC, Canada, 6–10 June 2011. ASME Paper No: GT2011-46124. [Google Scholar]
  33. Schmehl, R.; Rosskamp, H.; Willmann, M.; Wittig, S. CFD analysis of spray propagation and evaporation including wall film formation and spray/film interactions. Int. J. Heat Fluid Flow 1999, 20, 520–529. [Google Scholar] [CrossRef]
  34. Bai, C.; Gossman, A.D. Development of Methodology for Spray Impingement Simulation; SAE Technical Paper: New York, NY, USA, 1995. [Google Scholar]
  35. Launder, B.E.; Spalding, D.B. Splashing Mathematical Models of Turbulence; Academic Press: Cambridge, MA, USA, 1972. [Google Scholar]
  36. Besharat, M.; Tarinejad, R.; Aalami, M.T.; Ramos, H.M. Study of a compressed air vessel for controlling the pressure surge in water networks: CFD and experimental analysis. Water Resour. Manag. 2016, 30, 2687–2702. [Google Scholar] [CrossRef]
  37. Chedevergne, F. Analytical wall function including roughness corrections. Int. J. Heat Fluid Flow 2018, 73, 258–269. [Google Scholar] [CrossRef]
Figure 1. Heat transfer and compression work in the wet compression system.
Energies 12 00301 g001
Figure 2. Particle distortion for the TAB model.
Energies 12 00301 g002
Figure 3. Computational geometric model and grids.
Energies 12 00301 g003
Figure 4. Grid sensitivity analysis for the mass averaged total pressure at compressor exit along its span.
Energies 12 00301 g004
Figure 5. Comparison between numerical simulation results and experimental data.
Energies 12 00301 g005
Figure 6. Contrast diagram of temperature ratio under dry and wet cases in a multistage compressor.
Energies 12 00301 g006
Figure 7. Contrast diagram of pressure ratio under dry and wet cases in a multistage compressor.
Energies 12 00301 g007
Figure 8. Contrast diagram of adiabatic efficiency under dry and wet cases in a multistage compressor.
Energies 12 00301 g008
Figure 9. Contrast diagram of special work under dry and wet cases in a multistage compressor.
Energies 12 00301 g009
Figure 10. Correlation of pressure ratio with specific compression work for dry and wet cases.
Energies 12 00301 g010
Figure 11. Droplets trajectories inject from inlet 50% span under the wet cases (RR size 5 μm, injecting mass flowrate 0.5%).
Energies 12 00301 g011
Figure 12. Droplets trajectories of 5 μm inject from inlet 50% span under 90% rotating speed.
Energies 12 00301 g012
Figure 13. Droplets trajectories of 20 μm inject from inlet 50% span under 90% rotating speed.
Energies 12 00301 g013aEnergies 12 00301 g013b
Figure 14. Three group of droplets trajectories inject from inlet 50% span under 90% rotating speed.
Energies 12 00301 g014
Figure 15. Comparison of outlet temperature under dry and water injection cases.
Energies 12 00301 g015
Figure 16. Comparison of inlet mass flowrate under dry and water injection cases.
Energies 12 00301 g016
Figure 17. Comparison of total pressure ratio under dry and water injection cases.
Energies 12 00301 g017
Figure 18. Comparison of specific compression work per mass under dry and water injection cases.
Energies 12 00301 g018
Figure 19. Comparison of total specific compression work under dry and water injection cases.
Energies 12 00301 g019
Figure 20. Temperature contours of 50% span on the blade to blade surface under different water injecting cases.
Energies 12 00301 g020aEnergies 12 00301 g020b
Figure 21. Mach Number contours of 50% span on the blade to blade surface under injecting water of different droplet sizes.
Energies 12 00301 g021
Figure 22. Mach Number contours of 50% span on the blade to blade surface under water of different injecting rate.
Energies 12 00301 g022aEnergies 12 00301 g022b
Figure 23. Limiting streamlines on suction surfaces of the compressor blades and injecting water of different droplet sizes.
Energies 12 00301 g023
Figure 24. Limiting streamlines on suction surfaces of the compressor blades under water of different injecting rates.
Energies 12 00301 g024aEnergies 12 00301 g024b
Figure 25. Axial variation of total temperature under injecting water of different droplet sizes.
Energies 12 00301 g025
Figure 26. Axial variation of total temperature under water of different injecting rates.
Energies 12 00301 g026
Figure 27. Axial variation of relative total pressure under injecting water of different droplet sizes.
Energies 12 00301 g027
Figure 28. Axial variation of relative total pressure under water of different injecting rates.
Energies 12 00301 g028
Figure 29. Axial variation of total pressure difference under injecting water of different droplet sizes.
Energies 12 00301 g029
Figure 30. Axial variation of total pressure difference under water of different injecting rates.
Energies 12 00301 g030
Figure 31. Axial variation of gas density under injecting water of different droplet sizes.
Energies 12 00301 g031
Figure 32. Axial variation of gas density under water of different injecting rates.
Energies 12 00301 g032
Figure 33. Axial variation of axial velocity under injecting water of different droplet sizes.
Energies 12 00301 g033
Figure 34. Axial variation of axial velocity under water of different injecting rates.
Energies 12 00301 g034
Table 1. Computational element numbers of each compressor stage.
IGVStage NO.1Stage NO.2Stage NO.3Stage NO.4Stage NO.5Stage NO.6Stage NO.7Stage NO.8Total Number
198,064483,932472,072488,088491,524486,700476,848486,124531,0804,114,432
Table 2. Parameter settings of boundary conditions for the multistage axial compressor.
Boundary ConditionsShaft Speed (rpm)6180, 5562, 4944, 4326, 3708
Compressor inletTotal pressure (Pa)95708
Total temperature (K)303.15
Flow directionaxial
Compressor exitAverage static pressure (Pa)-
Water injection at compressor inletInjecting rate0.5%, 1%, 1.5%, 2%, 2.5%, 3%
RR mean diameter (μm)5, 10, 20
Velocity (m/s)50
Temperature (K)298.15

