Article

Analysis of the Day-ahead Deviation Plan and Research on the Real-time Scheduling of Photovoltaic Greenhouses Based on Exergy Theory

1
College of Information and Electrical Engineering, China Agricultural University, Beijing 100083, China
2
Electric Power Research Institute, State Grid Beijing Electric Power Company, Beijing 100075, China
*
Author to whom correspondence should be addressed.
Energies 2019, 12(20), 3849; https://doi.org/10.3390/en12203849
Submission received: 19 September 2019 / Revised: 3 October 2019 / Accepted: 4 October 2019 / Published: 11 October 2019

Abstract

:
For the correction problem of day-ahead plan deviation caused by energy prediction deviation in day-ahead scheduling stage of photovoltaic greenhouses, an exergy analysis method is used to propose the deviation model of heat required for photovoltaic greenhouses. Based on the deviation model, a real-time optimization scheduling model is established. The deviation model not only considers the non-negligible exergy loss during heating process of pipes, but also considers the difference between heat and thermal exergy affected by the actual indoor temperature. The goal of the real-time scheduling model is to minimize the absolute value of the difference between the energy supply and demand prediction deviation to be corrected and the adjustment of multi-form energy storage and electric loads, so that develop the real-time adjustment plan of energy storage and electric loads. The analysis results of the actual photovoltaic greenhouse show that of the heat required by a greenhouse based on the exergy theory calculation, the exergy loss of the heating process accounts for about 10%–20% of the total thermal exergy required and it cannot be ignored, so the calculation results can reflect the actual heat required more accurately and the greenhouse temperature is more suitable for plant growth. Moreover, the proposed real-time scheduling model can correct the deviation of the day-ahead plan and improve local consumption. The promotion ratio can reach 7%. Finally, the farmers’ electricity purchases cost is reduced. Thereby the effectiveness of the proposed heat deviation model and real-time scheduling model is verified.

1. Introduction

Integrated energy systems are an important development direction for future energy systems. They couple multiple energy sources such as electric energy and thermal energy to achieve synergy between the multiple sources [1]. At present, integrated energy systems are commonly used in park-type integrated energy systems, household-type micro-integrated energy systems, photovoltaic greenhouse micro-integrated energy systems derived from the background of poor photovoltaic alleviation [2,3,4] and so on. Generally, the photovoltaic greenhouse micro-integrated energy system includes electric energy, thermal energy, potential energy and so on. In some remote rural areas, solar energy resources are relatively abundant. However, due to the lack of long-distance transmission channels for electric energy and the saturation of the main network for new energy consumption, local consumption of photovoltaic power is particularly important [3,4]. Therefore, how to analyze the energy of micro-integrated energy systems to respond to the change rules of the output power of the photovoltaic power and achieve the maximum local consumption of the photovoltaic power has become the key to the implementation of the systems.
At present, the energy analysis method for integrated energy systems is mainly based on the first law of thermodynamics, that is, the conservation of energy. In addition, there is an exergy analysis method based on the second law of thermodynamics [5]. Exergy refers to the part of energy that can be converted into useful work in the surrounding environment [6]. When using the exergy analysis method to analyze systems, one can fully consider how the energy of each link of the system is affected by the surrounding environment [7,8] and more accurately find ways to improve the energy efficiency of the system [9,10]. Therefore, the exergy analysis method is a more accurate and effective method for energy analysis. In terms of energy analysis, [11] analyzed the equivalent conversion of electric energy, thermal energy and other energy in micro energy grids based on the conservation of energy; reference [12] presented the exergy index of building energy consumption. The reference used the exergy analysis method to analyze the energy utilization, specifically of building energy; reference [13] analyzed the conversion of various energy forms in a park integrated energy system based on the conservation of energy and proposed an energy quality coefficient conversion method based on exergy analysis. However, the exergy analysis method was not used to analyze the energy conversion process of each link in the system. Overall, among the current literature based on exergy analysis relatively few works analyze each link of the integrated energy system.
The research on energy optimization scheduling of integrated energy systems can be summarized into three scheduling strategies for different time scales, namely day-ahead plan, rolling plan and real-time scheduling plan. Reference [14] considered the factors such as electric loads, thermal loads and wind power prediction accuracy and proposed multi-time scale rolling scheduling strategies for heat and power systems and built a multi-time scale optimal scheduling model; reference [15] considered the behaviors of users and proposed a two-stage day-ahead economic scheduling model of an integrated energy system that included electricity, gas and heat; reference [16] proposed a real-time optimal scheduling method for microgrids in day-ahead plan following the energy storage state of charge (Soc).
The above research provides a reference for energy scheduling problem of photovoltaic greenhouse micro-integrated energy systems. Therefore, the authors of this paper first conducted and published their research on making a day-ahead plan [2]. In this literature, a day-ahead energy optimization scheduling model is established with the goal of minimizing the squared sum of the difference between the energy used by load and the photovoltaic power generation. By making the input and output energy plans of multi-form energy storage and the working state plans of various time-shifting loads in each time period of the next day, the maximum local consumption of photovoltaic power was achieved, but the literature didn’t consider the deviation between the output energy of the devices and the exergy required of the system caused by the actual indoor temperature [17]. The deviation can be obtained from the analysis of exergy theory [18,19]. It also didn’t take into account the exergy loss during the heating process of greenhouse pipes when calculating the heat required for the greenhouse. Both deviations mentioned above can be corrected during the real-time scheduling stage. Because the prediction accuracy is inversely proportional to time span, the real-time scheduling plan will play the role of correcting the deviation left over from the day-ahead plan.
Therefore, learning from the idea of real-time scheduling linking and supplementing the day-ahead plan in the multi-time scale energy scheduling system, this paper studies the real-time scheduling problem of photovoltaic greenhouse micro-integrated energy systems based on [2]. Firstly, based on an exergy analysis method, a deviation model of the heat required for a photovoltaic greenhouse is proposed after taking into account exergy loss during the heating process of the pipes and the heat and thermal exergy affected by actual indoor temperature environment. Secondly, it builds the real-time scheduling model of the photovoltaic greenhouse. The goal of the real-time scheduling model is to minimize the absolute value of the difference between the energy supply and demand prediction deviation to be corrected and the adjustment of multi-form energy storage and electric loads. Finally, the effectiveness of the deviation model and the real-time scheduling model for photovoltaic greenhouses are verified by a practical example.

2. Heat Deviation Model of a Photovoltaic Greenhouse Micro-Integrated Energy System Based on Exergy Analysis

Exergy is based on the environment and has an automatic balance with the environment. For photovoltaic greenhouse micro-integrated energy systems containing electric energy, potential energy and thermal energy, the thermal energy is the key energy type of the system and is most affected by the surrounding environment (temperature). Therefore, an exergy analysis method can be used to analyze and model the thermal energy part to reflect the actual heat required by the greenhouse more accurately. For simplicity, energy for the thermal part is referred to as heat, and exergy for the thermal part is referred to as exergy or thermal exergy. Their units are both kWh.
The relationship between thermal exergy and heat affected by the change of ambient temperature can be expressed by the Carnot cycle formula [9], as shown in Equation (1):
Q x = E x 1 T 0 T
where E x is the accepted thermal exergy of the system, kWh; Q x is the heat of the system taken from the heat source, kWh; T is the temperature of the heat source, K; T 0 is the reference temperature. Generally, the system exists in an environment and the temperature of the environment is selected as the reference temperature [5], K.
It can be seen from the above formula that the heat and thermal exergy of the system are strongly related to the ambient temperature. Therefore, for a photovoltaic greenhouse system, there is a heat required deviation Δ Q t + 1 between day-ahead plan and real-time scheduling at the same moment because the actual indoor temperature at each time of the day is uncertain. That is:
Δ Q t + 1 = Q D , t + 1 Q R , t + 1
where Q D , t + 1 is heat required for greenhouse in the t + 1 time period of day-ahead plan, kWh. That is the energy for thermal loads in the literature [1]; Q R , t + 1 is heat required in the next scheduling period (that is t + 1 period) during real-time scheduling stage, kWh.
The heat required Q R , t + 1 for the greenhouse during the t + 1 scheduling period consists of two parts. One part is the heat loss Q s u n , t + 1 from the heat source to the greenhouse pipes terminal during the heating process. The other part is the demand heat Q x u , t + 1 for the greenhouse. That is:
Q R , t + 1 = Q s u n , t + 1 + Q x u , t + 1
Exergy analysis theory is used to introduce the calculation models of these two parts in detail.

2.1. Exergy Loss Model During the Heating Process of Photovoltaic Greenhouse Pipes

During the heating process of photovoltaic greenhouse pipes, there are generally heat sources, heating pipes, thermal energy storage devices and so on.
The heating process from heat source to the pipes terminal in a photovoltaic greenhouse is shown in Figure 1. Driven by electric energy, the working substance in the heat source is activated and releases energy at the same time. The heat generated by the working substance is transferred to water in the heating pipes through the heat exchange part, and an exergy loss E 1 , t + 1 will exist in this heat transfer process.The water in the heating pipes provides heat to the greenhouse and there is an exergy loss E 2 , t + 1 caused by the friction of water flowing in the heating pipes. When heat needs to be stored in a thermal energy storage device, there is also a certain exergy loss E 3 , t + 1 of the heat transferred to the working substance in the thermal energy storage device. When the thermal energy storage device releases heat, the stored heat in the working substance transfers heat to the water in the heating pipes. This heat transfer process has an exergy loss E 4 , t + 1 . From the abovementioned heating process from heat source to the greenhouse pipes terminal, there are two types of exergy loss in the heating process of pipes. One is the exergy loss of heat transfer between the two working substances, such as E 1 , t + 1 , E 3 , t + 1 and E 4 , t + 1 .The other is friction exergy loss E 2 , t + 1 of water flowing in the heating pipes.
Therefore, the exergy loss E s u n , t + 1 align correctly from the heat source to the pipes terminal of photovoltaic greenhouse micro-integrated energy system is:
E s u n , t + 1 = E 1 , t + 1 + E 2 , t + 1 + E 3 , t + 1 + E 4 , t + 1
Heat loss Q s u n , t + 1 from the heat source to the greenhouse pipes terminal during the heating process correspondingly is:
Q s u n , t + 1 = Q 1 , t + 1 + Q 2 , t + 1 + Q 3 , t + 1 + Q 4 , t + 1
According to Equation (1), each part of the heat loss can be obtained from the exergy loss, that is:
Q 1 , t + 1 = E 1 , t + 1 1 T 0 , t T r 1 , t
Q 2 , t + 1 = E 2 , t + 1 1 T 0 , t T r 2 , t
Q 3 , t + 1 = E 3 , t + 1 1 T 0 , t T r 1 , t
Q 4 , t + 1 = E 4 , t + 1 1 T 0 , t T r 3 , t
where T 0 , t is the reference temperature. Since the pipe heating system is generally located in the greenhouse, the indoor temperature of the greenhouse is selected as the environmental reference temperature. This means the indoor temperature of greenhouse during the t period (current time), K; T r 1 , t , T r 2 , t and T r 3 , t are the working substance temperature in the heat source, the hot water temperature in the pipes and the working substance temperature in the thermal energy storage device during the t period, K.

2.1.1. Exergy Loss Model of Heat Transfer Between Two Working Substances

For the exergy loss of heat transfer between two working substances, this paper uses the exergy loss E 1 , t + 1 as an example to build model. The exergy loss E 1 , t + 1 is caused by the transfer of heat from the heat resource to water in the heating pipes.
When the working substance flow transforms reversibly from the initial state to the reference state, the unit mass of working substance will have some reduced enthalpy. The reduced enthalpy can produce the greatest technical work that is the enthalpy exergy of the working substance flow. If the working substance’s mass is m, the enthalpy exergy E x h is [9]:
E x h = ε m c ρ [ ( T h T h , 0 ) T h , 0 ln T h T h , 0 ]
where ε is the conversion factor of kJ to kWh, and it is 2.778 × 10⁻⁴; c ρ is the specific heat capacity at constant pressure of working substance, kJ/(kg·K); T h is the initial thermodynamic temperature of working substance, K; T h , 0 is the thermodynamic temperature of reference state. Generally, the average value of the ambient environment at which the system is located is selected as the reference temperature, K.
For working substance a, it has different enthalpy exergy values at two different temperatures. The enthalpy exergy change Δ E x a of working substance a is the difference between the two different temperatures. Similarly, the enthalpy exergy change Δ E x b of working substance b can be obtained. When working substance a transfers heat to working substance b, the enthalpy exergy reduction of the working substance a is greater than the enthalpy exergy increase of the working substance b, so there is a difference between the enthalpy exergy change of the two working substances. The difference is the exergy loss when the working substance a transfers heat to the working substance b [20], that is:
E x s u n = Δ E x a Δ E x b
It can be seen that the exergy loss E 1 , t + 1 when the working substance of heat source transfers heat to the water in the heating pipes is:
E 1 , t + 1 = Δ E x t + 1 L Δ E x t + 1 S
where Δ E x t + 1 L is the difference of enthalpy exergy before and after heat transfer of working substance in heat source, kWh; Δ E x t + 1 S is the difference of enthalpy exergy before and after heat transfer of water in heating pipes, kWh.
For the working substance in heat source, the enthalpy exergy difference before and after heat transfer is:
Δ E x t + 1 L = E x C , t + 1 L E x M , t + 1 L
where E x C , t + 1 L and E x M , t + 1 L are the enthalpy exergy of the working substance in heat source before and after heat transfer, kWh.
For the water in heating pipes, the enthalpy exergy difference before and after heat transfer is:
Δ E x t + 1 S = E x M , t + 1 S E x C , t + 1 S
where E x C , t + 1 S and E x M , t + 1 S are the enthalpy exergy of water before and after heat transfer, kWh.
According to Equation (10):
E x C , t + 1 L = ε m L c L , ρ [ ( T C , t L T 0 , t ) T 0 , t ln T C , t L / T 0 , t ] E x M , t + 1 L = ε m L c L , ρ [ ( T M , t L T 0 , t ) T 0 , t ln T M , t L / T 0 , t ] E x C , t + 1 S = ε m S c S , ρ [ ( T C , t S T 0 , t ) T 0 , t ln T C , t S / T 0 , t ] E x M , t + 1 S = ε m S c S , ρ [ ( T M , t S T 0 , t ) T 0 , t ln T M , t S / T 0 , t ]
where ε is same as in Equation (10); m L and m S are the mass of the working substance in the heat source and the water in heating pipes, kg; c L , ρ and c S , ρ are the specific heat capacity at constant pressure of the working substance in heat source and the water in heating pipes, kJ/(kg·K); T C , t L and T M , t L are the temperature of the working substance in heat source before and after heat transfer during t period, K; T C , t S and T M , t S are the temperature of the water in heating pipes before and after heat transfer during t period, K; T 0 , t is the indoor temperature of greenhouse during the t period, K.

2.1.2. Exergy Loss Model of Water Friction in the Heating Pipes

The exergy loss E 2 , t + 1 of water friction in heating pipes is:
E 2 , t + 1 = ε c s , ρ h f , t + 1 S ρ s Δ T t
where ε is that same as in Equation (10); c s , ρ is the same as in Equation (15); S is the cross-sectional area of the heating pipes in the greenhouse, m2; ρ s is the density of the water, kg/m3; Δ T t is the difference between the supply and return water temperature of the heating pipes, K; h f , t + 1 is the pressure drop along the heating pipes during t + 1 period, m. The calculation formula is [21]:
h f , t + 1 = λ L V t 2 D 2 g
where L is the length of the heating pipes, m; D is the inner diameter of the heating pipes, m; V t is the flow rate of the water in the heating pipes during t period, m/s; g is the gravitational acceleration, m/s2; λ is the Darcy coefficient, λ = 64 / Re , Re is the Reynolds number which is dimensionless.

2.2. The Demand Thermal Exergy Model of Photovoltaic Greenhouse Micro-Integrated Energy System

As shown in Equation (3), the demand heat Q x u , t + 1 of the photovoltaic greenhouse micro-integrated energy system can be obtained from the demand thermal exergy E x u , t + 1 of greenhouse with Equation (1). That is:
Q x u , t + 1 = E x u , t + 1 1 T 0 , t T r 2 , t
where T 0 , t is same as in Equation (6); T r 2 , t is the temperature of the HVAC pipes’ water, K.
The demand thermal exergy E x u , t + 1 of photovoltaic greenhouse micro-integrated energy system is mainly composed of four parts. The first part E 1 , t + 1 x is the thermal exergy of natural heat dissipation from the greenhouse to the outside. The second part E 2 , t + 1 x is the increased thermal exergy in the greenhouse because of solar radiation. The third part E 3 , t + 1 x is the demand thermal exergy to warm the indoor air in the greenhouse to a temperature suitable for plant growth. The last part E 4 , t + 1 x is the thermal exergy that is to be provided for the reservoir and biogas digester so we can get irrigation water at a certain temperature and warm the biogas slurry in the biogas digester. That is:
E x u , t + 1 = E 1 , t + 1 x E 2 , t + 1 x + E 3 , t + 1 x + E 4 , t + 1 x
The thermal exergy model for each part is described below.

2.2.1. The Thermal Exergy Model of Natural Heat Dissipation from the Greenhouse to the Outside

The thermal exergy of natural heat dissipation from the greenhouse to the outside is composed of three parts. The first part E o u t 1 , t + 1 is the thermal exergy loss caused by heat dissipation of the greenhouse enclosure structures. The second part E o u t 2 , t + 1 is the thermal exergy loss of air infiltration. The last part E o u t 3 , t + 1 is the thermal exergy loss of ground heat transfer. That is:
E 1 , t + 1 x = E o u t 1 , t + 1 + E o u t 2 , t + 1 + E o u t 3 , t + 1
1 The thermal exergy loss caused by heat dissipation of greenhouse enclosure structures
The thermal exergy loss caused by heat dissipation of greenhouse enclosure structures is mainly the exergy loss of the greenhouse cover, walls and other enclosure structures caused by indoor and outdoor temperature difference. That is:
E o u t 1 , t + 1 = l = 1 n l K s t r , l A s t r , l ( T i n , t + 1 T o u t , t ) Δ t 10 3
where n l is the number of layers of the enclosure structures; K s t r , l is the heat transfer coefficient of the l -th layer, W·m−2·°C−1; A s t r , l is the enclosure structures’ heat transfer area of the l -th layer, m2; T i n , t + 1 is the design temperature of greenhouse that is suitable for plant growth during t + 1 scheduling period, °C; T o u t , t is the outdoor temperature during t period, °C; Δ t is the scheduling duration, h.
2 The thermal exergy loss of air infiltration
The cold air outside the greenhouse will enter the greenhouse through the gaps of the structures and insulation materials or other opening and closing operations. It is necessary to heat the cold air from the outdoor temperature to the indoor temperature. This part of the thermal exergy is the thermal exergy loss of air infiltration. That is:
E o u t 2 , t + 1 = c a i r V N a i r r a i r ( T i n , t + 1 T o u t , t )
where c a i r is the air specific heat capacity coefficient, kWh / (kg·°C); V is the internal volume of the greenhouse, m3; N a i r is the number of air changes per hour; r a i r is the bulk density of air under outdoor temperature condition, kg/m3; T i n , t + 1 and T o u t , t are same as (21).
3 The thermal exergy loss of ground heat transfer
The thermal exergy loss of ground heat transfer is caused by the temperature difference between inside and outside the greenhouse. It is mainly the thermal exergy loss of indoor soil near the outer wall. As the temperature outside the greenhouse has different effects on ground heat transfer in the greenhouse, the ground inside the greenhouse is divided into different areas when calculating the exergy loss. The thermal exergy loss of ground heat transfer is:
E o u t 3 , t + 1 = K s o i l , z A s o i l , z ( T i n , t + 1 T o u t , t ) Δ t 10 3
where K s o i l , z is the heat transfer coefficient of area z, W·m-2·°C -1; A s o i l , z is the heat transfer area for area z, m2; T i n , t + 1 and T o u t , t are same as in Equation (21).

2.2.2. The Increased Thermal Exergy in the Greenhouse Because of Solar Radiation

The increased thermal exergy in the greenhouse because of solar radiation is composed of two parts. One part is the thermal exergy E s o i l , t + 1 of soil absorption in the greenhouse. The other part is the thermal exergy E w a l l , t + 1 of wall absorption of the greenhouse. That is:
E 2 , t + 1 x = E s o i l , t + 1 + E w a l l , t + 1
1 The thermal exergy of soil absorption in the greenhouse
Assume that solar radiation is evenly distributed throughout the soil in the greenhouse:
E s o i l , t + 1 = η s o i l I s o i l , t A s o i l Δ t
where η s o i l is the light absorption efficiency of soil; I s o i l , t is the solar radiation at the soil during t period, kW/m2; A s o i l is the soil area in the greenhouse, m2.
2 The thermal exergy of wall absorption of the greenhouse
Assume that solar radiation is evenly distributed throughout the greenhouse wall:
E w a l l , t + 1 = η w a l l I w , t + 1 A w a l l Δ t
where η w a l l is the light absorption efficiency of wall; I w , t o u t is the solar radiation at the outside wall of the greenhouse during t period, kW/m2; A w a l l is the wall area of the greenhouse that receives solar radiation, m2.
3 The demand thermal exergy to warm the indoor air of greenhouse
The demand thermal exergy caused by the difference between the actual air temperature of greenhouse and the target temperature for plant growth is:
E 3 , t + 1 x = { c a i r ρ a i r V ( T i n , t + 1 T i n , t ) , T i n , t + 1 T i n , t 0 , T i n , t + 1 < T i n , t
where c a i r is the same as (22); ρ a i r is the air density, kg/m3; V is same as in Equation (22); T i n , t + 1 is the same as in Equation (21), T i n , t is the actual indoor temperature of the greenhouse at current moment (t time period), °C.
4 The demand thermal exergy of the biogas digester and reservoir
E 4 , t + 1 x = E 4 , t + 1 Z + E 4 , t + 1 X
where E 4 , t + 1 Z is the demand thermal exergy for warming the biogas slurry in biogas digester, kWh; E 4 , t + 1 X is the demand thermal exergy for warming the water in the reservoir to the target temperature during the t + 1 scheduling period, kWh:
E 4 , t + 1 Z = ε c Z , ρ m Z , ρ ( T Z , t + 1 T Z , t )
E 4 , t + 1 S = ε c S , ρ m S , ρ ( T S , t + 1 T S , t )
where ε is same as in Equation (10); c Z , ρ is the specific heat capacity of biogas slurry in biogas digester, kJ /(kg·°C) ; c S , ρ is the specific heat capacity of water in the reservoir, kJ /(kg·°C) ; m Z , ρ is the mass of biogas slurry in biogas digester, kg; m S , ρ is the mass of water in the reservoir, kg; T Z , t + 1 is the design target temperature of biogas slurry in biogas digester during t + 1 scheduling period, °C; T S , t + 1 is the design target temperature of water in the reservoir during t + 1 scheduling period, °C; T Z , t is the temperature of biogas slurry in biogas digester during t period, °C; T S , t is the temperature of water in the reservoir during t period, °C.

3. Real-Time Scheduling Based on Deviation Correction of the Day-Ahead Plan

3.1. Objective Function

Energy scheduling based on energy supply and demand forecast is greatly affected by the prediction accuracy. The prediction accuracy is inversely proportional to the time span. The prediction deviation of energy required in this paper mainly refers to the deviation of the heat required Δ Q t + 1 for the greenhouse analyzed in Section 2. The prediction deviation of energy supply mainly refers to the difference between the day-ahead predicted value and the real-time predicted value of photovoltaic power generation during the t + 1 period. The real-time scheduling plan should be able to correct the deviation left by the day-ahead plan. This deviation is simply referred to as the day-ahead plan deviation. Therefore, this paper proposes a real-time scheduling model whose objective function is the minimum absolute value of the difference during the scheduling stage. The difference is between the energy supply and demand deviation and the adjustment of energy storage and electric loads:
min | ( Δ L p v , t + 1 + Δ Q t + 1 ) ( Δ E t + 1 + Δ E e , t + 1 ) |
where Δ Q t + 1 is the deviation of the heat required for the greenhouse analyzed in Section 2. The deviation is between the day-ahead plan and the real-time scheduling plan during the t + 1 period, which is expressed in formula (2); Δ L P V , t + 1 is the difference between the real-time predicted value and the day-ahead predicted value of photovoltaic power generation during the t + 1 period, kWh ; Δ E t + 1 is the adjustment of the multi-form energy storage during the t + 1 period. And the adjustment is for the day-ahead plan during the real-time scheduling stage. The increase is positive and the decrease is negative, kWh. Δ E e , t + 1 is the adjustment of the electric loads during the t + 1 period aiming at the day-ahead plan. Similarly, the increase is positive and the decrease is negative, kWh.

3.2. Constraints

1 Multi-form energy storage adjustment constraint:
E de _ max , t + 1 Δ E t + 1 E ad _ max , t + 1
where E ad _ max , t + 1 and E de _ max , t + 1 are the maximum input and output energy of the multi-form energy storage, kWh.
The adjustable range of multi-form energy storage is composed of the maximum input energy and the maximum output energy during the t + 1 scheduling stage. It means the maximum allowable increased energy and decreased energy of the multi-form energy storage during the real-time scheduling stage based on the day-ahead plan. The calculation formula is as follows:
E ad _ max , t + 1 = { min [ E Im a x , A E t ] , ( E I t + 1 = E O t + 1 = 0 ) min [ E Im a x , A E t ] + E O t + 1 , ( E O t + 1 > 0 ) min [ E Im a x , A E t ] E I t + 1 , ( E I t + 1 > 0   and min [ E Im a x , A E t ] E I t + 1 ) 0 , min [ E Im a x , A E t ] < E I t + 1 E de _ max , t + 1 = { min [ E O max , E t ] , ( E I t + 1 = E O t + 1 = 0 ) min [ E O max , E t ] + E I t + 1 ,     ( E I t + 1 > 0 ) min [ E O max , E t ] E O t + 1 , ( E O t + 1 > 0 min [ E O max , E t ] E O t + 1 ) 0 , min [ E O max , E t ] < E O t + 1
where E I t + 1 and E O t + 1 are the input energy and output energy of multi-form energy storage in the day-ahead plan during the t + 1 period, kWh; E Im a x and E O max are got by the maximum input and output power of multi-form energy storage multiplied by the real-time scheduling duration Δt, kWh. It means multi-form energy storage can be reached the input and output energy value after the real-time scheduling duration Δt when working at the maximum input and output power; A is the energy storage space of multi-form energy storage; E t is the stored energy of multi-form energy storage during the t period (current time period), kWh.
2 Electric loads adjustment constraint
E e load _ max , t + 1 de Δ E e , t + 1 L E e load _ max , t + 1 a d
where E e load _ max , t + 1 de and E e load _ max , t + 1 ad are the maximum decrease and the maximum increase of the electric loads, kWh.
The adjustable range of electric loads is composed of the maximum increased power consumption and the maximum decreased power consumption. In the photovoltaic greenhouse, the electric loads such as LED fill light, space electric field dehumidification and so on can be appropriately increased or decreased within a certain range. The increased or decreased electric loads have little negative impact on plant growth. Such electric loads are the increased or decreased electric loads. The adjustable range of electric loads means the maximum allowable increased power consumption and decreased power consumption during the real-time scheduling stage based on the day-ahead plan. That is:
{ E e load _ max , t + 1 ad = i = 1 m E i e load _ max , t + 1 ad E e load _ max , t + 1 de = i = 1 m E i e load _ max , t + 1 de
where m is the number of electric loads that can be increased or decreased in photovoltaic greenhouse; E i e load _ max , t + 1 ad and E i e load _ max , t + 1 de are the maximum increased power consumption and the maximum decreased power consumption of the i-th electric load, kWh.

3.3. Solution Flow Chart

The flow chart of the real-time scheduling plan is shown in Figure 2. The specific solution steps are as follows:
1
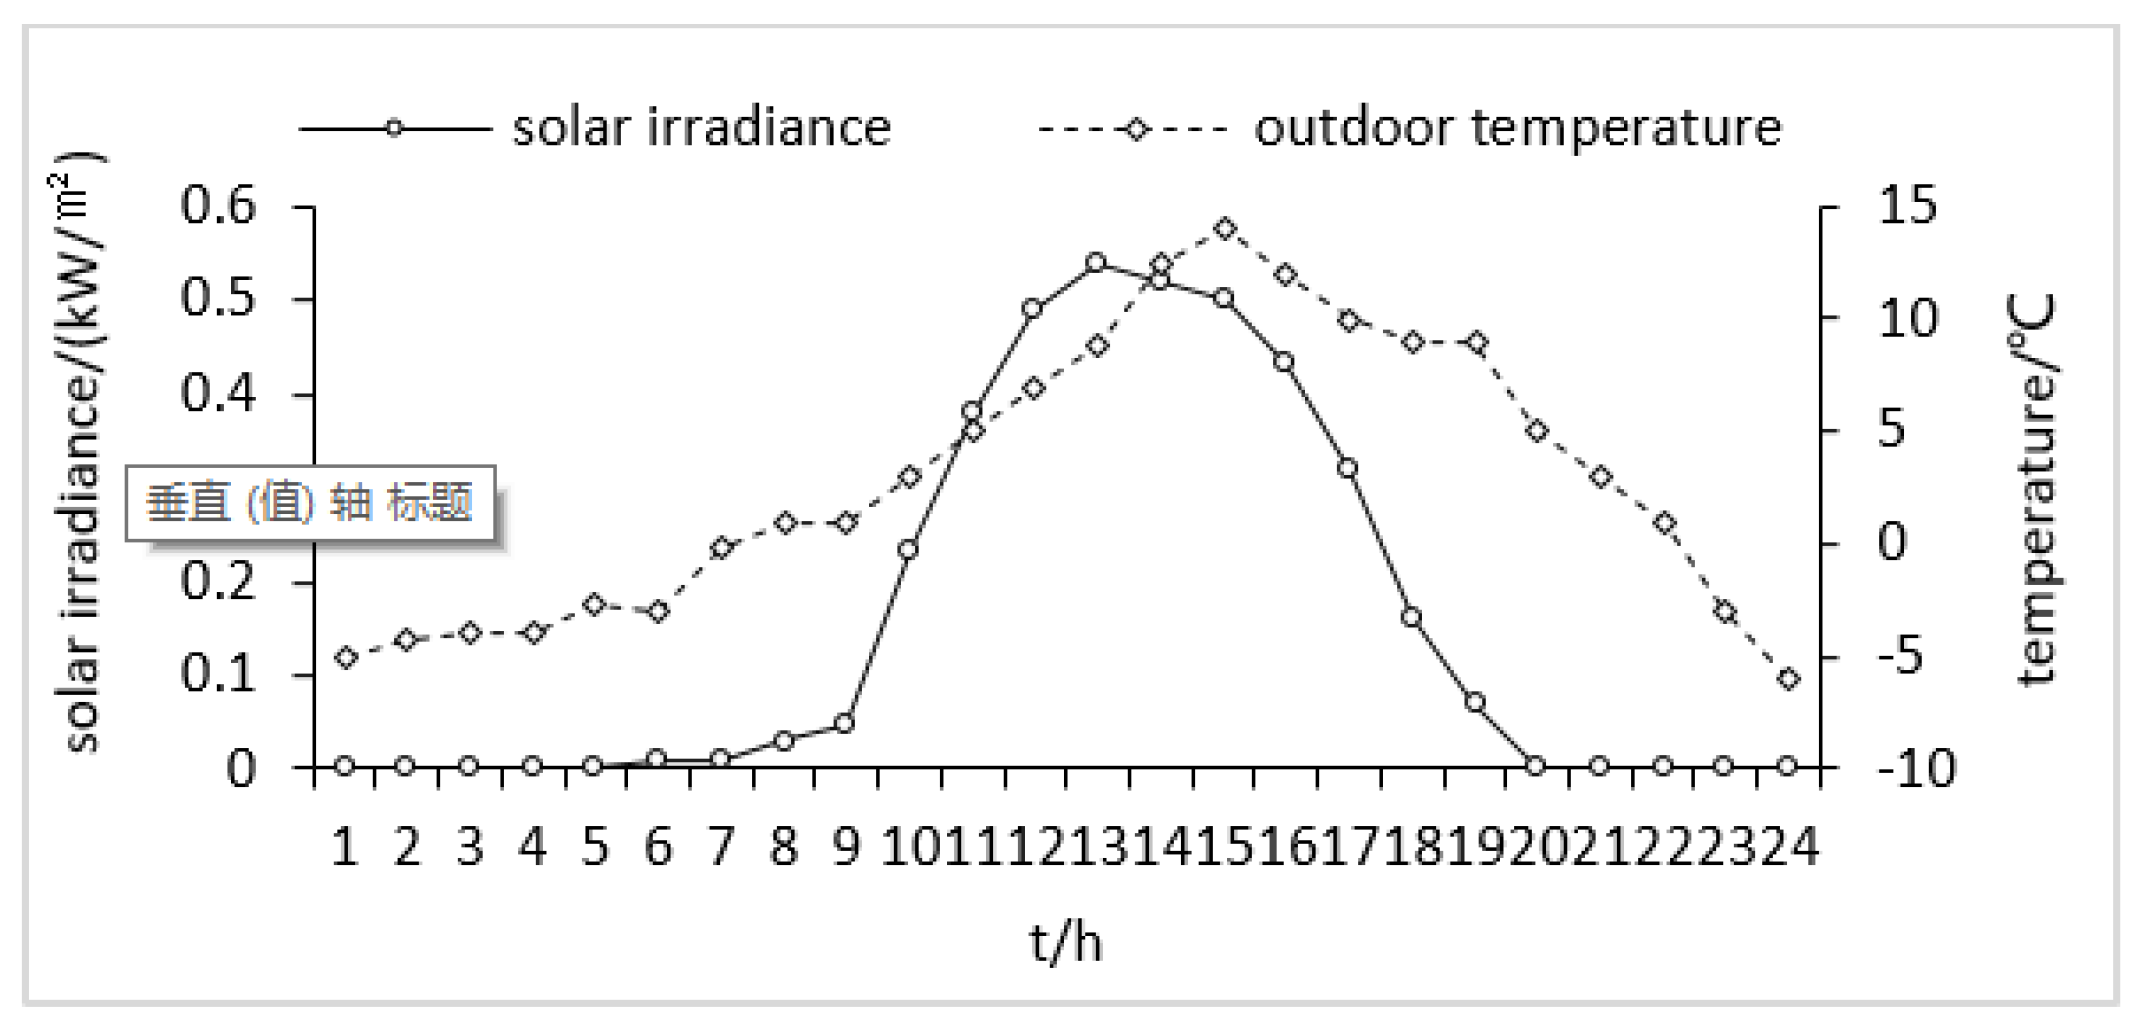
Input day-ahead and real-time solar irradiance, outdoor temperature, electric loads, thermal loads and other data, and input various parameters required in the calculation model;
2
Calculate the heat required deviation Δ Q t + 1 , photovoltaic power generation deviation Δ L P V , t + 1 and adjustable range of multi-form energy storage in the real-time stage;
3
Judge whether the heat required deviation and photovoltaic power generation deviation in the real-time stage can be offset through the electric-thermal link (the electric-thermal link is the far-infrared heating device by default in this paper). If the offset happens, the multi-form energy storage will not be adjusted.
4
If Δ Q t + 1 + Δ L pv , t + 1 > 0 , it indicates that there is excess energy. The excess energy will be stored within the increased adjustable range of multi-form energy storage. If Δ Q t + 1 + Δ L pv , t + 1 < 0 , it indicates that multi-form energy storage is required to provide the part of energy that is insufficient in the greenhouse. The insufficient energy will be provided within the decreased adjustable range of multi-form energy storage, so as to make the objective function as optimal as possible.
5
Output the adjustment of multi-form energy storage and electric loads.

4. Example

4.1. Basic Data of System and Example Design

An actual photovoltaic greenhouse micro-integrated energy system in rural areas of western China is used as an example. The system structure is shown in Figure 3.
For the photovoltaic greenhouse micro-integrated energy system, the external part is connected to the distribution network. The internal part is mainly composed of photovoltaic power, particle energy heat source, multi-form energy storage, heating radiator and various types of loads. The power of the system are photovoltaic power and external distribution network. It can provide the electric energy required by various electric loads of the system. The heat source of the system is mainly particle energy machine that consumes electric energy, so it is both heat source and electric load. It can provide the heat to heat up the greenhouse and store excess energy in the phase change thermal storage device.The multi-form energy storage includes reservoir, biogas digester, storage battery and phase change thermal storage device. The electric loads are mainly particle energy machine, water pump, physical insecticide, LED fill light, space electric field dehumidification, far infrared heating, water and fertilizer integrated fertilization and so on. The heat load is mainly the heat required to warm the greenhouse. The parameters of the main equipment are shown in Table 1.
In rural areas of western China, sunny days account for about two-thirds in winter. According to the historical weather conditions, the paper selects the actual production activities of photovoltaic greenhouse on a winter sunny day (November 10, 2018) as a typical example, so the selected data has a certain representativeness. For the typical day, the paper performs a two-part analysis:
1
The thermal exergy calculation and analysis of the photovoltaic greenhouse micro-integrated energy system is performed to verify the effectiveness of the deviation model for a photovoltaic greenhouse.
2
The paper selects one hour as the scheduling duration and performs the real-time scheduling analysis based on [2]. By doing these, the paper corrects the deviation of the day-ahead plan and verifies the effectiveness of the real-time scheduling model.

4.2. Example Results and Analysis

4.2.1. Basic Data of the Example

The example selects the actual production activities of a photovoltaic greenhouse on a winter sunny day. The solar irradiance curve obtained according to the historical weather data and the measured outdoor ambient temperature curve of the winter sunny day are shown in Figure 4.
It can be seen from Figure 4 that the solar irradiance on the winter sunny day has no obvious fluctuation, but has an obvious peak period. It reaches the peak at 12:00–13:00. Before 12:00, the solar irradiance increases hour by hour, and after 13:00, the solar irradiance decreases hour by hour. For the outdoor temperature on the winter sunny day, the temperature difference between day and night is relatively large. At around 14:00, the temperature reaches the highest value, while the temperature at night reaches below zero.
Based on the solar irradiance and outdoor temperature of the winter sunny day mentioned above, the comparison curves between the day-ahead stage and the real-time scheduling stage of photovoltaic power generation are shown in Figure 5.
It can be seen from the Figure 5 that the trend of photovoltaic power generation curve is basically consistent with the trend of the solar irradiance curve because there is a linear relationship between photovoltaic power generation and solar irradiance. On this winter sunny day, the deviation of photovoltaic prediction is mainly concentrated between 9:00–13:00. Because the predicted value of the day-ahead photovoltaic power generation is greater than the real-time predicted value during 9:00–10:00, the photovoltaic predicted deviation is negative. The photovoltaic predicted deviation is positive during 11:00–13:00. During the remainder of the period, the day-ahead photovoltaic prediction curve basically coincides with the real-time photovoltaic prediction curve. Overall, the trend of the real-time photovoltaic prediction curve is basically same as the day-ahead curve, and there is no significant fluctuation.

4.2.2. The Thermal Exergy Analysis of the Photovoltaic Greenhouse Micro-Integrated Energy System

According to the analysis in Section 2, the thermal exergy required for the photovoltaic greenhouse is composed of the thermal exergy loss during the heating process of pipes and the demand thermal exergy of the greenhouse. During the heating process of pipes, the exergy loss is related to the indoor temperature of the greenhouse. The suitable temperature for plant growth in the greenhouse is about between 20 °C–30 °C. Each part of the thermal exergy has different change under different indoor temperature. In order to analyze it, this paper selects three different indoor temperatures at three different moments. The three different moments are 10 o'clock (indoor temperature is 20 °C), 20 o’clock (indoor temperature is 25 °C) and 14 o'clock (indoor temperature is 30 °C) of the winter sunny day. Under the above conditions, it calculates the each part of the thermal exergy. The calculated results are shown in Table 2.
It can be seen from the Table 2 that there are two types of loss during the heating process of the pipes. They are the exergy loss of the heat transfer between two working substances and the friction exergy loss of water in the heating pipes. The exergy values of heat transfer between the two working substances are different under different indoor temperatures. The higher the indoor temperature, the smaller the exergy loss of the heat transfer between the two working substances (such as E 1 , t + 1 , E 3 , t + 1 and E 4 , t + 1 ).
This is determined by Equations (11) to (15). For one of the losses, the values are almost the same at different temperatures. For the three losses, the value of E 1 , t + 1 is relatively large, but the values are almost the same at the same temperature.The friction exergy loss of water E 2 , t + 1 in the heating pipes doesn’t change with the indoor temperature. This is because it is mainly affected by the flow rate and the temperature difference between the supply water and return water. The friction exergy loss doesn’t change when the two factors are certain. Therefore, the exergy loss during the heating process of the pipes will decrease as the indoor temperature increases of the greenhouse. During the whole heating process of the pipes, the exergy loss accounts for about 10%–20% of the total thermal exergy required. Apparently, this part of the exergy loss cannot be ignored.Among the demand thermal exergy of the greenhouse, the thermal exergy of natural radiating E 1 , t + 1 x from the greenhouse to the outside is the largest among the various components, accounting for the main part of the greenhouse demand thermal exergy. Since the thermal exergy of natural radiating is related to the indoor temperature and the outdoor temperature, the value is not significantly related to the indoor temperature change. Then it is the demand thermal exergy E 4 , t + 1 x of the biogas digester and reservoir to warm the biogas slurry and water to the target temperature. And it is also a major component of the greenhouse demand thermal exergy. The value is second only to the natural radiating. Since the E 4 , t + 1 x is related to the temperature of the liquids in the biogas digester and the reservoir during the t scheduling period and the t + 1 scheduling period, the value is not significantly related to the indoor temperature change. For the demand thermal exergy to warm the indoor air of the greenhouse E 3 , t + 1 x , its value is uncertain because it is affected by the current indoor temperature and design temperature of the next scheduling period (t + 1 period) (Equation (27)). It can be seen from the Table 2 that since the current temperature in the greenhouse is the same as the preset required temperature for the t+1 period, the E 3 , t + 1 x is zero at 14:00. The solar radiation belongs to the heat source for the greenhouse. So the thermal exergy value E 2 , t + 1 x of radiation should take a negative value. Because of relating to the solar irradiance, the thermal exergy of solar radiation is even more than E 1 , t + 1 x and E 4 , t + 1 x at 14:00 when the solar radiation is strong. The value is zero at 20:00 because the solar radiation is zero. Overall, at three indoor temperatures suitable for plant growth, the total demand thermal exergy of the greenhouse accounts for about 80%–90% of the total thermal exergy required. It is the main part of the thermal exergy required of the greenhouse. From the above analysis, it can be seen that the exergy loss during the heating process of the pipes accounts for 10%–20% of the total thermal exergy required for the greenhouse. This part of the exergy loss cannot be ignored and the analysis verifies the necessity of taking into account the exergy loss during the heating process of the pipes.
In order to obtain the heat required deviation of the greenhouse between the day-ahead plan and the real-time scheduling stage, the paper performs calculation of the day-ahead prediction and the real-time prediction aiming at the typical winter sunny day. Finally, the paper gets the heat required curve of the photovoltaic greenhouse during the day-ahead stage (referred to as the heat required of the day-ahead plan), the thermal exergy required curve during the real-time scheduling stage (referred to as the thermal exergy required of the real-time scheduling) and the corresponding heat curve (referred to as the heat required of the real-time scheduling). The compared curves are as shown in Figure 6.
It can be seen from Figure 6 that the curve of the thermal exergy required of the real-time scheduling is lower than the curve of the heat required of the real-time scheduling. This is determined by Equation (1). Equation (1) expresses the relationship between the heat and the thermal exergy affected by the ambient temperature. Then due to the outdoor temperature decreases at night, the indoor temperature also decreases. The greenhouse must provide more thermal exergy to maintain the indoor temperature suitable for plant growth, so the heat required for the real-time scheduling stage of the greenhouse at night is more. In addition, the heat required of the day-ahead plan is lower than the heat required of the real-time scheduling even lower than the thermal exergy required of the real-time scheduling. The reason is that from the point of view of the exergy analysis of this paper, the heat required of the photovoltaic greenhouse during the day-ahead stage is the demand thermal exergy of the photovoltaic greenhouse. During the real-time scheduling stage, the thermal exergy required of the photovoltaic greenhouse not only includes demand thermal exergy of the photovoltaic greenhouse, it also takes into account the exergy loss that is not ignored during the heating process of the pipes. Therefore, the heat required during the day-ahead stage is lower than the thermal exergy required of greenhouse during the real-time scheduling stage. And the heat required of the greenhouse during the real-time scheduling stage based on the thermal exergy required takes into account the effect of the actual indoor temperature. In a word, the analysis of the heat deviation based on the exergy theory helps to calculate the heat required of the greenhouse more accurately and make the energy scheduling plan more accurately for the photovoltaic greenhouse micro-integrated energy system.

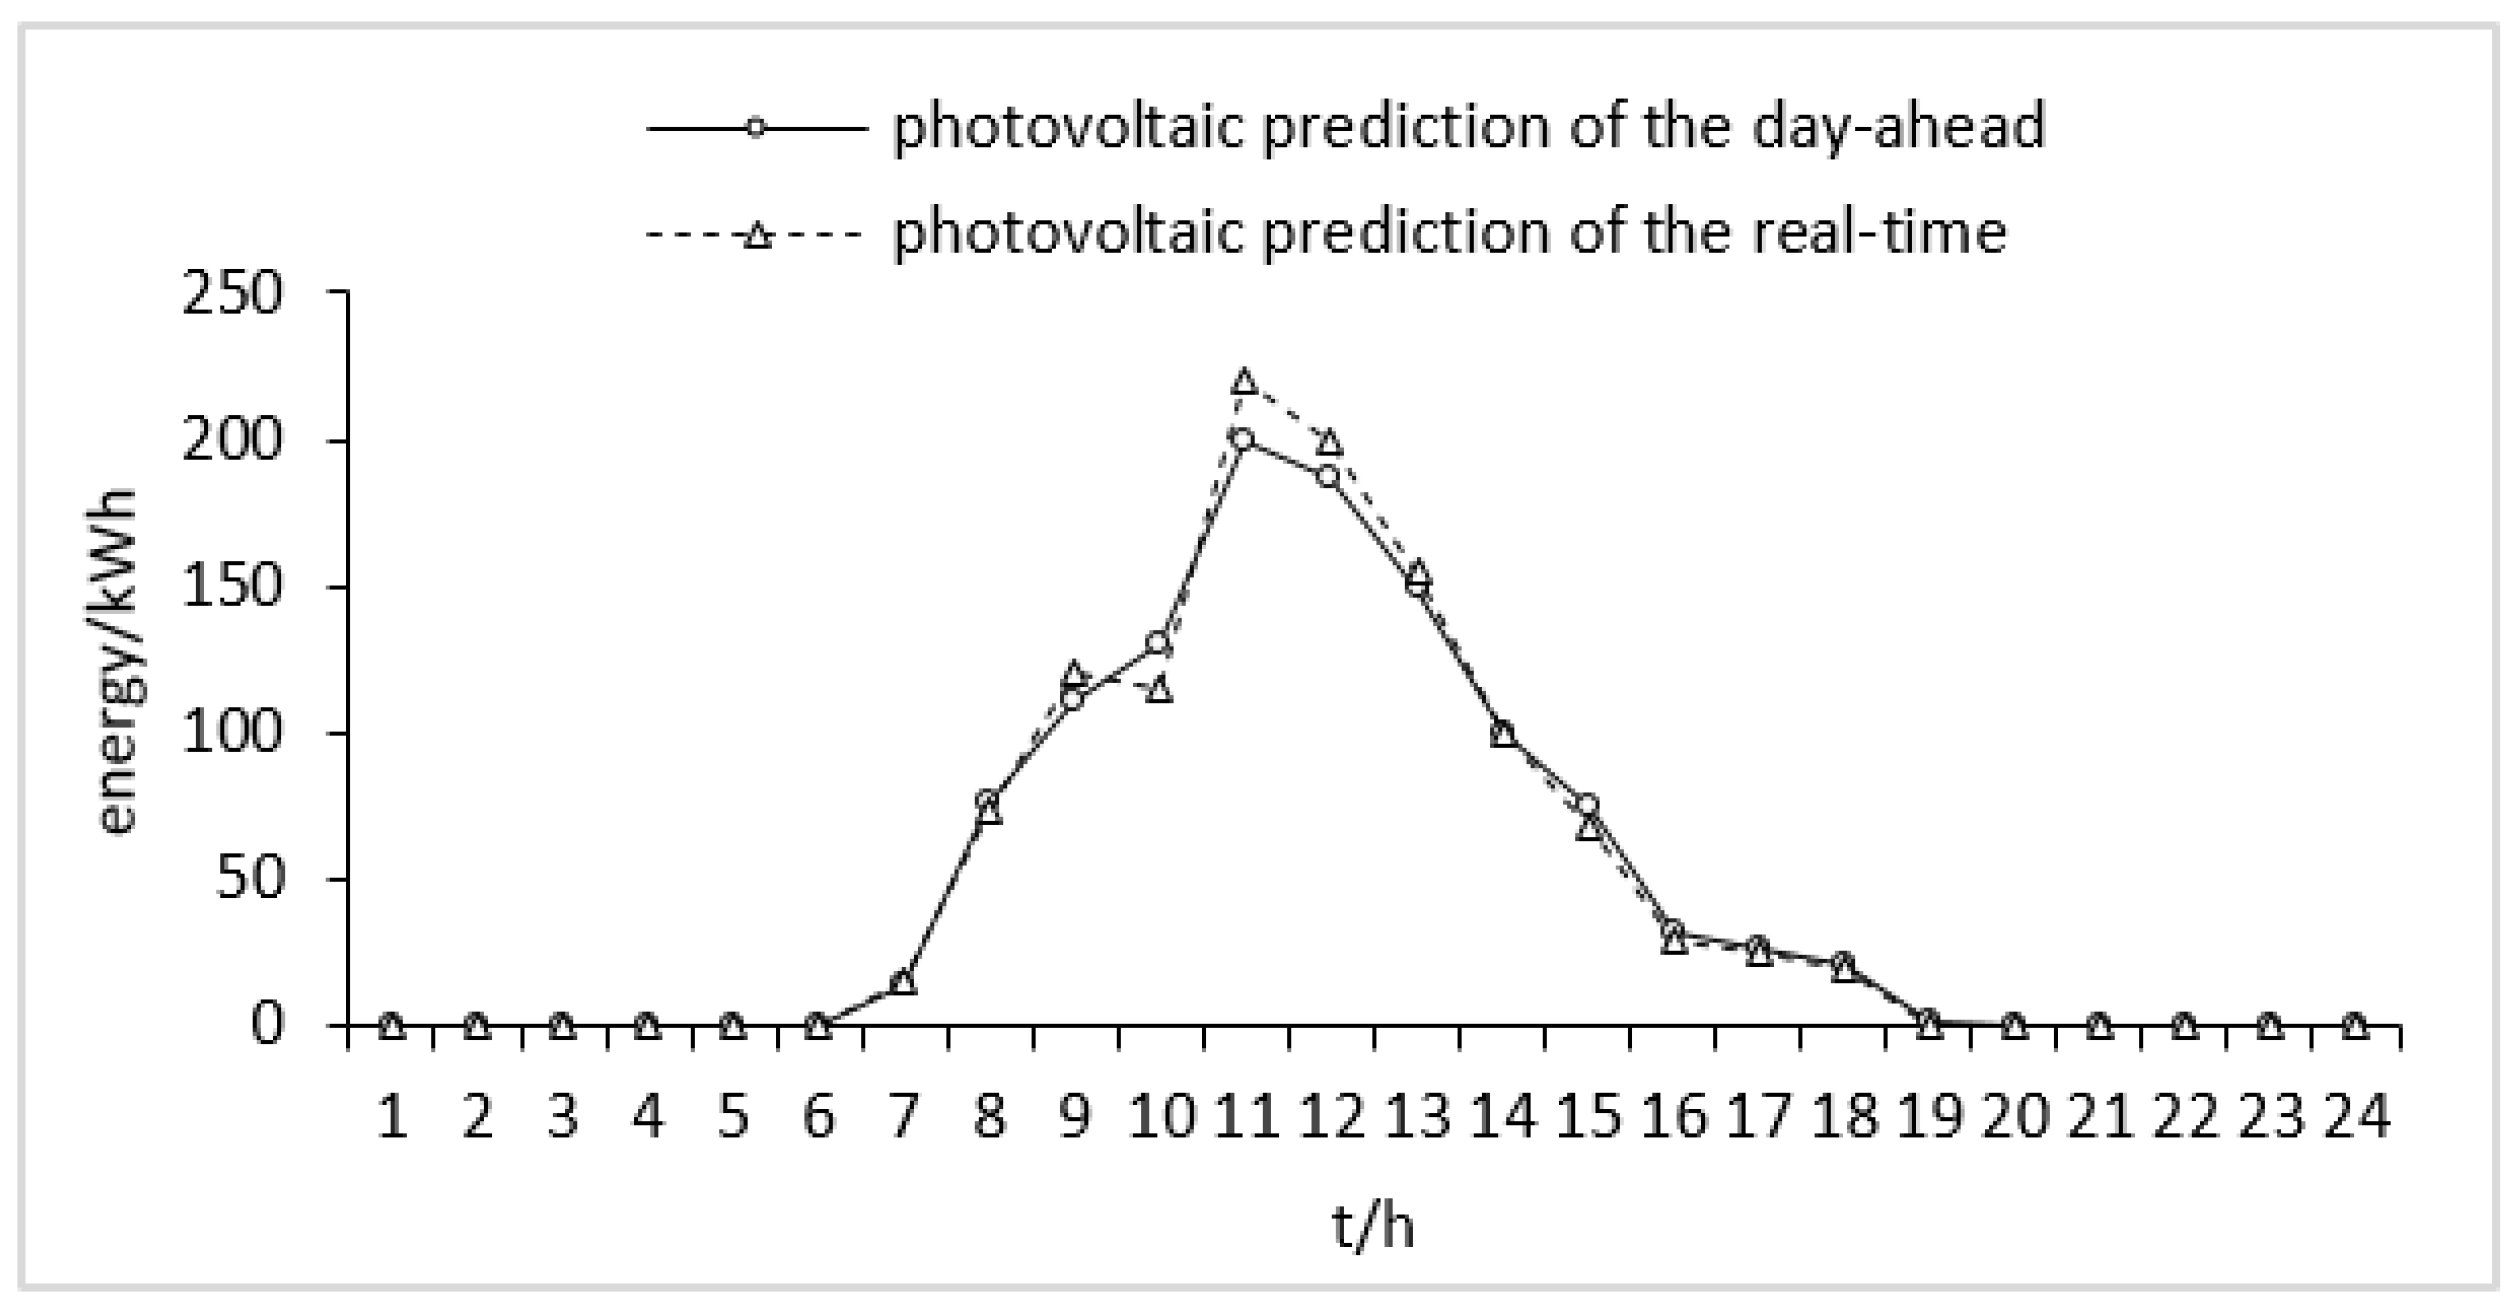
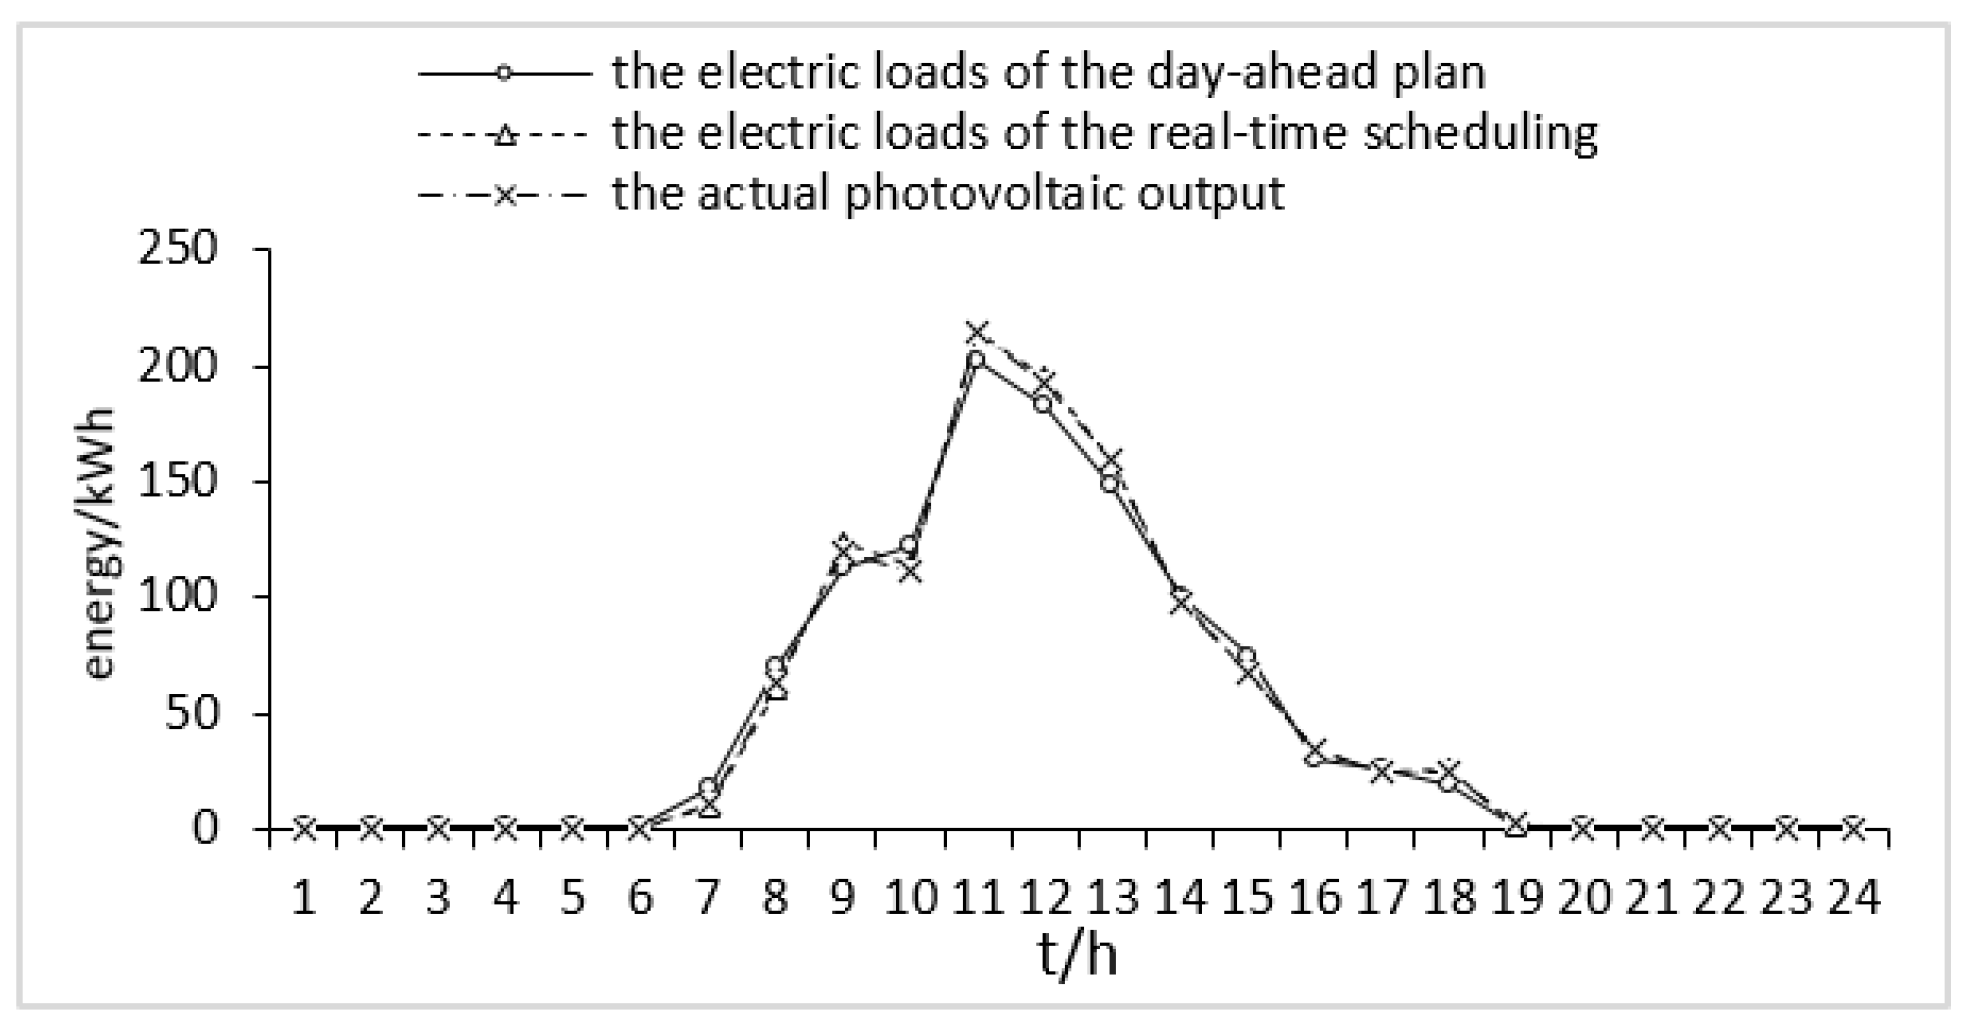
4.2.3. The Real-Time Scheduling Analysis of the Photovoltaic Greenhouse Micro-Integrated Energy System

In order to verify the correction effect during the real-time scheduling for the day-ahead plan deviation, the paper first takes a time section as an example to analyze the real-time scheduling of the typical winter sunny day.The time section selected in this paper is 11:00. The stored energy of the multi-form energy storage of the photovoltaic greenhouse micro-integrated energy system at 10:00 is shown in Table 3. The working status of the day-ahead multi-form energy storage and the far infrared heating device (electric heating device) at 11:00 are shown in Table 4. In addition, the deviation of the heat required Δ Q t + 1 and the deviation of the photovoltaic power generation Δ L pv , t + 1 are also shown in Table 4.
Table 3 lists the stored energy of multi-form energy storage in the last scheduling period. According to the stored energy, the adjustable range of multi-form energy storage can be obtained. Table 4 lists the working status of the multi-form energy storage in the day-ahead plan, the heat required deviation of the greenhouse and photovoltaic power generation deviation. It can be seen that the heat required deviation of the greenhouse is –21.8 kWh during the real-time scheduling period, indicating that it is necessary to provide 21.8 kWh of heat to the greenhouse to maintain the temperature suitable for plant growth at 11 o'clock. The photovoltaic prediction deviation is 20 kWh, indicating that the photovoltaic prediction is more 20 kWh than the day-ahead plan at 11:00.
According to the real-time scheduling model and the day-ahead plan, the adjustment during the real-time scheduling stage of the multi-form energy storage is shown in Table 5.
It can be seen from Table 5 in combination with Table 4, that the real-time stage is 20 kWh more than the day-ahead plan at 11:00 of the photovoltaic power generation. The heat required of the greenhouse is more than 21.8 kWh. Firstly, from the perspective of the energy offset of electric heating, the excess photovoltaic power generation can offset a part of the heat required of the greenhouse. According to the control strategy, the energy offset link of electric heating is to turn on the far infrared heating device. The far infrared heating device is both the electric load and the heat source. The far infrared heating device converts the excess 20 kWh of photovoltaic power generation into heat for the greenhouse. Then the input energy of the biogas digester is reduced by 1.8 kWh to offset the remaining heat required of the greenhouse. Therefore, the input heat of the biogas digester is adjusted from the 113 kWh of the day-ahead plan to the 111.2 kWh of real-time plan. The real-time plan of this period makes the objective function value reach a minimum value of zero. The result completely corrects the deviation of the day-ahead plan. Compared to the day-ahead plan, not only does the local consumption of the photovoltaic power increase by 20 kWh, but it also leads to the indoor temperature closer to the target temperature that is suitable for plant growth.
The real-time scheduling calculation of the typical winter sunny day is carried out for the photovoltaic greenhouse micro-integrated energy system. In order to compare with the day-ahead plan, this paper draws electric loads curves of the day-ahead plan and the real-time scheduling and the curve of the actual photovoltaic output. They are shown in Figure 7. Figure 8 not only shows the stored energy of the phase change thermal storage device and the biogas digester, but also shows the comparison between the day-ahead plan and the real-time scheduling of the phase change thermal storage device and the biogas digester. Figure 9 not only shows the stored energy of the storage battery and the reservoir, but also shows the comparison between the day-ahead plan and the real-time scheduling of the storage battery and the reservoir. Table 6 summarizes the day-ahead and real-time local consumption of the photovoltaic power and the savings in electricity purchases.
According to the Figure 7, the day-ahead electric loads curve and the real-time scheduling electric loads curve are basically consistent with the actual photovoltaic output curve. Because there is a deviation of the photovoltaic output between the day-ahead plan and the real-time scheduling, the use of electric loads in photovoltaic greenhouse have also been adjusted with the change of the photovoltaic output. As a result, the usage curve of the electric loads is more consistent with the actual photovoltaic output curve. In addition, the local consumption of the photovoltaic power has improved.
According to Figure 8, the phase change thermal storage device has different amplitude of modification from the day-ahead plan in each scheduling period. Compared with the day-ahead plan, the adjustment of biogas digester in 10:00–12:00 and 20:00–24:00 is relatively large, while in the other time periods it is relatively small. This is because phase change thermal storage device and biogas storage are directly related to the photovoltaic greenhouse heat control. Due to the need to correct the deviation of the day-ahead plan, the stored energy real-time curves of both of them are adjusted more than the day-ahead curves. According to the Figure 9, for the storage battery, in 00:00–7:00, the real-time curve is basically in accordance with the day-ahead plan. From 7:00–14:00, the stored energy in the battery remains basically unchanged, illustrating that during this period the battery hardly works. From 14:00–15:00, the stored energy in the battery is reduced. Then the stored energy in the battery remains basically the same, illustrating that the battery is hardly used. The adjustment of reservoir energy storage is the smallest among all energy storage, and the fluctuation of stored energy real-time curve is the smallest. Combined with Figure 8 and Figure 9, for the multi-form energy storage, the overall trend of the stored energy real-time curves are still similar to the day-ahead curves. It not only ensures the all-day optimality of energy scheduling, but also corrects the day-ahead deviation during the partial periods.
As can be seen from Table 6, the local consumption of the photovoltaic power in the day-ahead plan is 956 kWh and the percentage of local consumption is 85%. According to the deviation model of heat required and the real-time scheduling model, the local consumption of the photovoltaic power in the real-time plan is 1052 kWh and the percentage of local consumption is 92%. The real-time local consumption has increased by 96 kWh and the percentage of the local consumption has increased by 7%. It shows that the local consumption of photovoltaic power can be improved by using the models proposed in this paper.
In rural areas of western China, the standard electricity price is 0.49 yuan per kilowatt hour. In the case of only carrying out the day-ahead plan, the cost of purchasing electricity is 468.5 yuan lower than the ordinary greenhouse. In the case of carrying out the day-ahead plan and the real-time plan, the cost of purchasing electricity is 515.5 yuan lower than the ordinary greenhouse. This shows that the latter saves 47 yuan more than the former. It shows that the models proposed in this paper can reduce the electricity purchases cost of farmers. Let's make some assumptions. There are ten similar greenhouses in the rural area. According to the historical weather conditions, winter sunny days account for about two-thirds in rural areas of western China. Based on the above assumptions, in the case of carrying out the day-ahead plan, the cost of purchasing electricity throughout the winter is saves about 281,100 yuan. In the case of carrying out the day-ahead plan and the real-time plan, the cost of purchasing electricity throughout the winter saves about 309,300 yuan.
In summary, using the proposed real-time scheduling model to make the energy scheduling plan for the photovoltaic greenhouse micro-integrated energy system can make full use of the adjustment ability of the multi-form energy storage. In addition, it can correct the deviations of the day-ahead plan effectively. The proposed models can not only meet the suitable temperature for plant growth and effectively improve the local consumption of the photovoltaic power, but also reduce the cost of electricity purchases of the greenhouse.

5. Conclusions and Outlook

In this paper, the exergy analysis method is used to analyze a photovoltaic greenhouse micro-integrated energy system. The deviation model of the heat required and the real-time scheduling method are proposed of the system. The main conclusions and outlook are as follows:
1
This paper proposes a deviation model of heat required for photovoltaic greenhouse based on the exergy analysis method. The model not only accounts for the non-negligible exergy loss during the heating process of the pipes, but also considers the difference between the heat and thermal exergy affected by the actual indoor temperature. It can reflect the actual heat required more accurately, so that the greenhouse temperature is more suitable for plant growth. Based on the above analysis, the real-time optimization scheduling model is established. The goal of the real-time scheduling model is to minimize the absolute value of the difference between the energy supply and demand prediction deviation to be corrected and the adjustment of multi-form energy storage and electric loads.
2
The example shows that compared with [2], the heat required of greenhouse during the real-time scheduling stage based on the exergy theory can more accurately reflect the actual heat required. The proposed real-time optimal scheduling model can make full use of the characteristics of multi-form energy storage and adjustable loads. As a result, it corrects the day-ahead plan deviation so that the temperature is more suitable for plant growth and agricultural production is promoted. In addition, it improves the local consumption of photovoltaic power effectively and reduces the cost of farmers.
3
For other polymorphic source-storage-load micro-integrated energy systems with similar configurations, the models proposed in this paper are equally applicable. In addition, this paper is an energy optimal scheduling of the interior of the greenhouse. Micro-integrated energy system community is formed by multiple regional-level photovoltaic greenhouses. The next step to be studied is the energy mutual aid scheduling between communities.

Author Contributions

X.D. and H.N. performed the method and wrote the manuscript; Y.D. contributed to analysis and manuscript preparation; Y.W. participated in translation and supervised.

Funding

This research received no external funding.

Conflicts of Interest

The authors declare no conflicts of interest.

Nomenclature

The nomenclature used in the paper is summarized in the following table:
NotationSpecification
T the temperature of the heat source, °C
T 0 the reference temperature, °C
T 0 , t the indoor temperature of greenhouse during the t period (current time), °C
T r 1 , t , T r 2 , t , T r 3 , t the temperature of heat resource’s working substance, water and thermal energy storage equipment’s working substance during the t period, °C
T h the initial thermodynamic temperature of working substance, °C
T h , 0 the thermodynamic temperature of reference state, °C
Δ T t the difference between the supply and return water temperature, °C
T i n , t + 1 the design temperature of greenhouse during t + 1 scheduling period, °C
T o u t , t the outdoor temperature during t period, °C
T Z , t + 1 , T S , t + 1 the design target temperature of biogas slurry and water during t + 1 scheduling period, °C
T Z , t , T S , t the temperature of biogas slurry and water during t period, °C
E x the accepted thermal exergy of the system, kWh
E 1 , t + 1 exergy loss of heat transfer process from the heat resource to the water, kWh
E 2 , t + 1 exergy loss of water friction, kWh
E 3 , t + 1 exergy loss of heat transfer process from the heat resource to the thermal energy storage equipment, kWh
E 4 , t + 1 exergy loss of heat transfer process from the thermal energy storage equipment to the water, kWh
E x h the enthalpy exergy of working substance’s which mass is m, kWh
Δ E x a , Δ E x b The enthalpy exergy change of working substance a and b, kWh
E x s u n the exergy loss when the working substance a transfers heat to b, kWh
Δ E x t + 1 L , Δ E x t + 1 S the enthalpy exergy difference of the heat resource’s working substance and the pipes’ water, kWh
E x C , t + 1 L , E x M , t + 1 L the enthalpy exergy of the heat resource’s working substance before and after heat transfer, kWh
E x C , t + 1 S , E x M , t + 1 S the enthalpy exergy of water before and after heat transfer, kWh
E x u , t + 1 the demand thermal exergy of greenhouse, kWh
E 1 , t + 1 x the thermal exergy of natural radiating, kWh
E 2 , t + 1 x the increased thermal exergy in the greenhouse because of solar radiation, kWh
E 3 , t + 1 x the demand thermal exergy to warm the indoor air of greenhouse, kWh
E 4 , t + 1 x the thermal exergy that is to be provided for reservoir and biogas digester, kWh
E o u t 1 , t + 1 the thermal exergy loss caused by enclosure structures’ radiating, kWh
E o u t 2 , t + 1 the thermal exergy loss of air infiltration, kWh
E o u t 3 , t + 1 the thermal exergy loss of ground heat transfer, kWh
E s o i l , t + 1 , E w a l l , t + 1 the thermal exergy of soil absorption and wall absorption, kWh
E 4 , t + 1 Z , E 4 , t + 1 X the demand thermal exergy for warming the biogas slurry and the water to the target temperature, kWh
Δ E t + 1 the adjustment of the multi-form energy storage during the t + 1 period, kWh
E ad _ max , t + 1 the maximum input energy of the multi-form energy storage, kWh
E de _ max , t + 1 the maximum output energy of the multi-form energy storage, kWh
E I t + 1 , E O t + 1 the input and output energy of the multi-form energy storage in the day-ahead plan during the t + 1period, kWh
E Im a x , E O max the maximum input and output energy values of the multi-form energy storage after the real-time scheduling duration Δt, kWh
E e load ad _ max , t + 1 the maximum increase and of the electric loads, kWh
E e load de _ max , t + 1 the maximum decrease of the electric loads, kWh
Δ E e , t + 1 L the adjustment of electric loads during the t + 1 period, kWh
E t the stored energy in the multi-form energy storage during the t period (current time period), kWh
E i e load ad _ max , t + 1 the maximum increased power consumption of the i-th electric load, kWh
E i e load de _ max , t + 1 the maximum decreased power consumption of the i-th electric load, kWh
Q x the heat of the system taken from the heat source, kWh
Δ Q t + 1 heat required deviation, kWh
Q D , t + 1 heat required in the t + 1 time period of day-ahead plan, kWh
Q R , t + 1 heat required in the next scheduling period (that is t + 1 period) during real-time scheduling stage, kWh
Q s u n , t + 1 heat loss from heat source to greenhouse pipes terminal during the heating process, kWh
Q x u , t + 1 demand heat for greenhouse, kWh
Q 1 , t + 1 energy loss of heat transfer process from the heat resource to the water, kWh
Q 2 , t + 1 energy loss of water friction, kWh
Q 3 , t + 1 energy loss of heat transfer process from the heat resource to the thermal energy storage equipment, kWh
Q 4 , t + 1 energy loss of heat transfer process from the thermal energy storage equipment to the water, kWh
h f , t + 1 the pressure drop along the HVAC pipes during t + 1 period, m
Δ L pv , t + 1 the difference of photovoltaic power generation between real-time predicted value and day-ahead predicted value during the t + 1 period, kWh
A the energy storage space of the multi-form energy storage, kWh

References

  1. Wei, H.; Liangjun, G.; Liangliang, H. Day-ahead Optimal Scheduling of Regional Integrated Energy System Participating in Dual Market. AEPS 2019, 43, 68–82. [Google Scholar]
  2. Wang, Y. An Optimization Method for Local Consumption of Photovoltaic Power in a Facility Agriculture Micro Energy Network. Energies 2018, 11, 1503. [Google Scholar] [CrossRef]
  3. Weizhou, W.; Fuchao, L.; Jianhua, Y. Optimization of the Micro Energy Grid of PV Intelligent Agricultural Greenhouse Based on Time-shifting Agricultural Load. J. CAU 2018, 23, 160–168. [Google Scholar]
  4. Xin, Z.; Man, Z.; Weizhou, W. Scheduling optimization for rural micro energy grid multi-energy flow based on improved crossbreeding particle swarm algorithm. Trans. CSAE 2017, 33, 157–164. [Google Scholar]
  5. Yanfei, G.; Qiang, W.; Lin, C. Efficiency analysis model of integrated energy system based on the exergy efficiency. RES 2017, 35, 1387–1394. [Google Scholar]
  6. Leilei, L. Energy and Exergy Analysis of Air-conditioning Room in Summer. Master’s Thesis, Donghua University, Shanghai, China, 2016. [Google Scholar]
  7. Lei, W. Exergy Analysis of Energy Transformation Process for the Energy Storage System Combined Cooling and Heating. Master’s Thesis, Dalian University of Technology, Dalian, China, 2006. [Google Scholar]
  8. Geidl, M.; Andersson, G. Optimal power flow of multiple energy carriers. IEEE Trans. Power Sys. 2007, 22, 145–155. [Google Scholar] [CrossRef]
  9. Qiushi, H. Exergy Analysis of Ground Source Heat Pump Systems Based on TRNSYS. Ph.D. Thesis, Huazhong University of Science and Technology, Wuhan, China, 2017. [Google Scholar]
  10. Ishaq, H.; Dincer, I. Exergy analysis and performance evaluation of a newly developed integrated energy system for quenchable generation. Energy 2019, 179, 1191–1204. [Google Scholar] [CrossRef]
  11. Tengfei, M.; Junyong, W.; Liangliang, H. Energy Flow Modeling and Optimal Operation Analysis of Micro Energy Grid Based on Energy Hub. Power Syst. Technol. 2018, 42, 179–186. [Google Scholar]
  12. Yang, L.; Song, D.; Jintao, L. Exergy-based Energy Conservation Evaluation of Building Energy System. BEE 2019, 47, 83–86. [Google Scholar]
  13. Hong, L.; Yue, Z.; Xiaoou, L. Comprehensive Energy Efficiency Assessment of Park-level Multi-energy System Considering Difference of Energy Grade. Power Syst. Technol. 2019, 43, 2835–2843. [Google Scholar]
  14. Jiale, D.; Linxian, H.; Shiqi, S. Multi-Time Scale Rolling Scheduling Method for Combined Heat and Power System. Power Syst. Technol. 2016, 40, 191–198. [Google Scholar]
  15. Tao, Z.; Jiaying, Z.; Lingyun, W. Day-ahead Economic Dispatch of Electricity-Gas-Heat Integrated Energy System Considering User Behaviors. AEPS 2019, 43, 1–9. [Google Scholar]
  16. Xiaoli, M.; Huanna, N.; Dongli, J. Real-time energy optimal dispatch for microgrid based on day-ahead scheduling of charge state. Trans. CSAE 2016, 32, 155–161. [Google Scholar]
  17. Yan, Z. Research on the Building Heating and Cooling System with Exergy Analysis. Ph.D. Thesis, Hunan University, Changsha, China, 2013. [Google Scholar]
  18. Haiqing, Q. Exergoeconomic Analysis of Combined Cooling, Heating and Power System Based on Energy Level Concept. Ph.D. Thesis, Chinese Academy of Sciences, Beijing, China, 2016. [Google Scholar]
  19. Haizhu, Z.; Neng, Z.; Caixia, Y. Comprehensive Performance Evaluation Method of Hybrid Renewable Energy System Based on Exergy Theory. BEE 2018, 46, 47–52. [Google Scholar]
  20. Ahern, J.E. The Exergy Method of Energy Systems Analysis; China Machine Press: Beijing, China, 1984; pp. 84–113. [Google Scholar]
  21. Peng, W. Based on the calculation of friction loss of PCCP pipeline in large-scale water transmission project. Technol. Super. Water Res. 2019, 2, 129–131, 139. [Google Scholar]
Figure 1. Schematic diagram of exergy loss during the heating process of greenhouse pipes.
Energies 12 03849 g001
Figure 2. Solution flow chart.
Energies 12 03849 g002
Figure 3. Photovoltaic greenhouse micro-integrated energy system structure.
Energies 12 03849 g003
Figure 4. The curves of the solar irradiance and outdoor temperature.
Energies 12 03849 g004
Figure 5. The comparison curves between the day-ahead stage and the real-time scheduling stage of photovoltaic power generation on the winter sunny day.
Energies 12 03849 g005
Figure 6. The day-ahead and real-time scheduling stage compared curves of the heat and thermal exergy of the photovoltaic greenhouse.
Energies 12 03849 g006
Figure 7. Compared curves of the day–ahead electric loads, the real-time electric loads and the actual photovoltaic output.
Energies 12 03849 g007
Figure 8. Day-ahead and real-time stage stored energy compared curves of the phase change thermal storage device and biogas digester.
Energies 12 03849 g008
Figure 9. Day-ahead and real-time stage stored energy compared curves of the storage battery and reservoir.
Energies 12 03849 g009
Table 1. The parameters of the main equipment.
EquipmentCapacity/PowerEquipmentCapacity/Power
photovoltaic power280 kWpphysical insecticide0.025 kW
particle energy machine50 kWLED fill light0.05 kW
phase change thermal storage device300 kWhspace electric field dehumidification0.024 kW
biogas digester600 kWhfar infrared heating0.2 kW
reservoir storage battery200 kWh
48 kWh
water and fertilizer integrated fertilization1.5 kW
water pump2 kWPlasma nitrogen fixation0.5 kW
Table 2. The each part thermal exergy value and proportion of the photovoltaic greenhouse.
Time 10:00 (Indoor Temperature is 20 °C)20:00 (Indoor Temperature is 25 °C)14:00 (Indoor Temperature is 30 °C)
Value
E 1 , t + 1 /kWh0.190.160.15
E 2 , t + 1 /kWh0.180.180.18
E 3 , t + 1 /kWh0.160.140.13
E 4 , t + 1 /kWh0.140.130.11
the pipes’ total exergy loss and proportion0.670.610.57
11.36%9.58%19.86%
E 1 , t + 1 x /kWh3.93.14.5
E 2 , t + 1 x /kWh−3.020−4.8
E 3 , t + 1 x /kWh1.150.460
E 4 , t + 1 x /kWh3.22.22.6
the total demand thermal exergy and proportion5.235.762.3
88.64%90.42%80.14%
the total thermal exergy required /kWh5.96.372.87
Table 3. The stored energy of the multi-form energy storage at 10:00.
Phase Change Thermal Storage Device/kWhBiogas Digester
/kwh
Reservoir
/kwh
Storage Battery
/kwh
1102716038
Table 4. The working status of energy storage and the far infrared heating device, the deviations of the heat required and the photovoltaic power generation at 10:00.
Phase Change Thermal Storage DeviceBiogas DigesterReservoirStorage BatteryFar Infrared Heating DeviceThe Deviation of the Heat to be SuppliedThe Deviation of the Photovoltaic Prediction
not workinginputnot workingnot workingnot working−21.8kWh20 kWh
Table 5. Comparison of the day-ahead plan and real-time plan scheduling value of the electric heating load and the multi-form energy storage.
TypePhase Change Thermal StorageBiogas DigesterReservoirStorage BatteryFar Infrared Heating Device
day-ahead plannot workinginput 113 kWhnot workingnot workingnot working
real-time plannot workinginput 111.2 kWhnot workingnot working20 kWh
Table 6. The table of the day-ahead and real-time local consumption of photovoltaic power and the savings in electricity purchases.
TypeDay-Ahead PlanReal-Time PlanThe Increase of the Real-Time Plan over the Day-Ahead Plan
Value
consumption/kWh956105296
percentage of consumption85%92%7%
savings in electricity purchases468.5515.547

