Article

High-Resolution Household Load Profiling and Evaluation of Rooftop PV Systems in Selected Houses in Qatar

1
Division of Sustainable Development, College of Science and Engineering, Hamad Bin Khalifa University. Doha 34110, Qatar
2
Qatar Environment and Energy Research Institute, Hamad Bin Khalifa University, Doha 34110, Qatar
*
Author to whom correspondence should be addressed.
Energies 2019, 12(20), 3876; https://doi.org/10.3390/en12203876
Submission received: 29 April 2019 / Revised: 19 June 2019 / Accepted: 11 July 2019 / Published: 14 October 2019

Abstract

:
Even though Qatar’s per capita electricity consumption is one of the highest in the world, little is currently known about behind-the-meter power consumption. The residential sector is the largest consumer of electricity, accounting for approximately 59% of the overall consumption of electricity. As energy subsidies lead to budget deficits and overconsumption of carbon resources, there is a pressing need to examine the residential load profile to better understand consumption patterns and uncover potential solutions for more efficient usage. Residential load profiles are typically influenced by seasonal and socio-economic factors. Furthermore, household load profiles can be used to examine the viability of rooftop photovoltaic (PV) systems. In this study, a total of 10 houses in Qatar were chosen, and their power demand was monitored for over a year using smart energy monitors. This empirical research was conducted to achieve the following goals: (1) creation of the first high-resolution residential load profiles in Qatar and in the Gulf region; (2) analyses of the acquired load profiles and the determining factors that affect energy consumption; and (3) calculation of self-consumption values, analysis of the viability of household rooftop PV systems, and discussing potential use-cases for energy storage systems. Investigation of this topic is particularly important for Qatar as the country is adopting a sizable portion of PV systems (5% by 2021) and promotes sustainable energy options as a part of a national development strategy. Results show that there are significant differences between per-household and per-capita consumption due to factors such as electricity subsidies, household income and size, and air-conditioner type. Moreover, due to high electricity consumption, distributed energy storage units for bill management applications have limited applicability with current pricing tariffs. To the best of authors’ knowledge, this is the first study conducted in Qatar and in the Gulf region where a growing amount of interest is given to measure and improve building energy performance.

1. Introduction and Background

The demand for electricity in the State of Qatar has been increasing over the last few years because of subsidized electricity tariffs, fast urbanization, the increased need for air conditioning, and population growth [1,2]. According to Qatar’s electric utility company (Kahramaa) [3], the residential sector is the largest consumer of electricity, with approximately 59% of the overall consumption [3]. Figure 1 presents the percentage of power consumption by sector for the year 2016. In line with the growth, the government has been expanding electricity generation capacity: from 5.3 GW in 2009 to 8.5 GW in 2017, and to 11 GW in 2019 [2]. However, the budget deficit arising from the decline in oil prices and the opportunity cost stemming from the use of domestic natural gas resources to generate electricity necessitate finding new and sustainable solutions to meet growing demand. Therefore, the country aims to implement policies to reduce and manage electricity consumption especially in residential sector. To devise effective tools, there is a pressing and ubiquitous need to understand the way individuals consume electricity. The newly attained knowledge regarding residential electricity consumption behavior holds the key to enabling the future application of residential load demand reduction programs.
The factors that influence power consumption patterns include socio-economic factors, seasonal impacts, and load types [4]. These factors can be analyzed through an empirical study that involves the load monitoring of a residential sample over a sufficient period of time. Moreover, there exists a global movement in the direction of renewable energy source capitalization, and Qatar has initiated plans to generate a sizable portion of its electricity through renewable photovoltaic (PV) systems; the targets are set to 700 MW by 2021 and to reach 900 MW generation capacity in the upcoming years [5,6]. Subsequently, Qatar may also look into initiating and permitting the deployment of residential household rooftop PV systems. This, in turn, introduces a number of challenges in power system operations such as overvoltage issues due to bidirectional power flow and rapid aging of transformers. To identify such issues, simulation-based studies, which take load and PV profiles as inputs, are conducted to examine PV-hosting capacity of distribution networks [7]. It is important to note that PV-impacts are ultimately related to the temporal coincidence of residential load and PV generation, Hence, depending on the statistics of these two parameters, system operators can examine the economic viability of energy storage systems that could be integrated at the customer premises to store excess electricity generation. It is noteworthy that PV rooftop and energy storage systems are capital-intensive projects with a typical lifetime of 20 years or more. Therefore, one-time decision regarding the acquisition of such system needs to be carefully taken using actual datasets for the specific project.
To that end, the aims of this research are to (1) acquire high-resolution residential load profiles of 10 households that were chosen according to the Qatar census; (2) evaluate the role of socio-economic factors, seasonal impacts, and load classification in shaping electricity load profiles; and (3) calculate PV self-consumption rates for various cases and determine the size of energy storage units to minimize bi-directional power flows. To the best of our knowledge, this is the first empirical study of its kind conducted in Qatar and the Gulf Cooperation Council (GCC) region. It is important to note that, in addition to demand-side management (DSM) and PV-rooftop systems, the presented datasets will be a base for a number of untapped research efforts in the region such as (1) energy economics and policy; (2) energy research and social sciences; and (3) power systems operations and control. Moreover, the paper presents insights into how electricity is consumed in a highly subsidized, carbon-rich, tax-free country residing in an arid climate.

2. Literature Review

Related literature spans topics from load profiling, demand-side management, and PV adoption studies. The load profiling section presents existing studies, the methods used to measure electricity consumption, and the factors affecting the electricity consumption. Electricity consumption measurement studies are ultimately related to DSM and PV-rooftop system design studies. By analyzing the consumption behavior of households (e.g., seasonal patterns, appliance usage, etc.), decision-makers can identify opportunities to maximize energy saving. PV-rooftop studies, on the other hand, deal with how PV generation and electricity consumption align and propose ways (e.g., DSM, energy storage) to improve it. Our review further discusses the unique challenges faced in Qatar and in the GCC region. Details are presented in the next three subsections.

2.1. Load Profiling

The load profile of a residential unit can be obtained through an intrusive or a non-intrusive load monitoring technique [
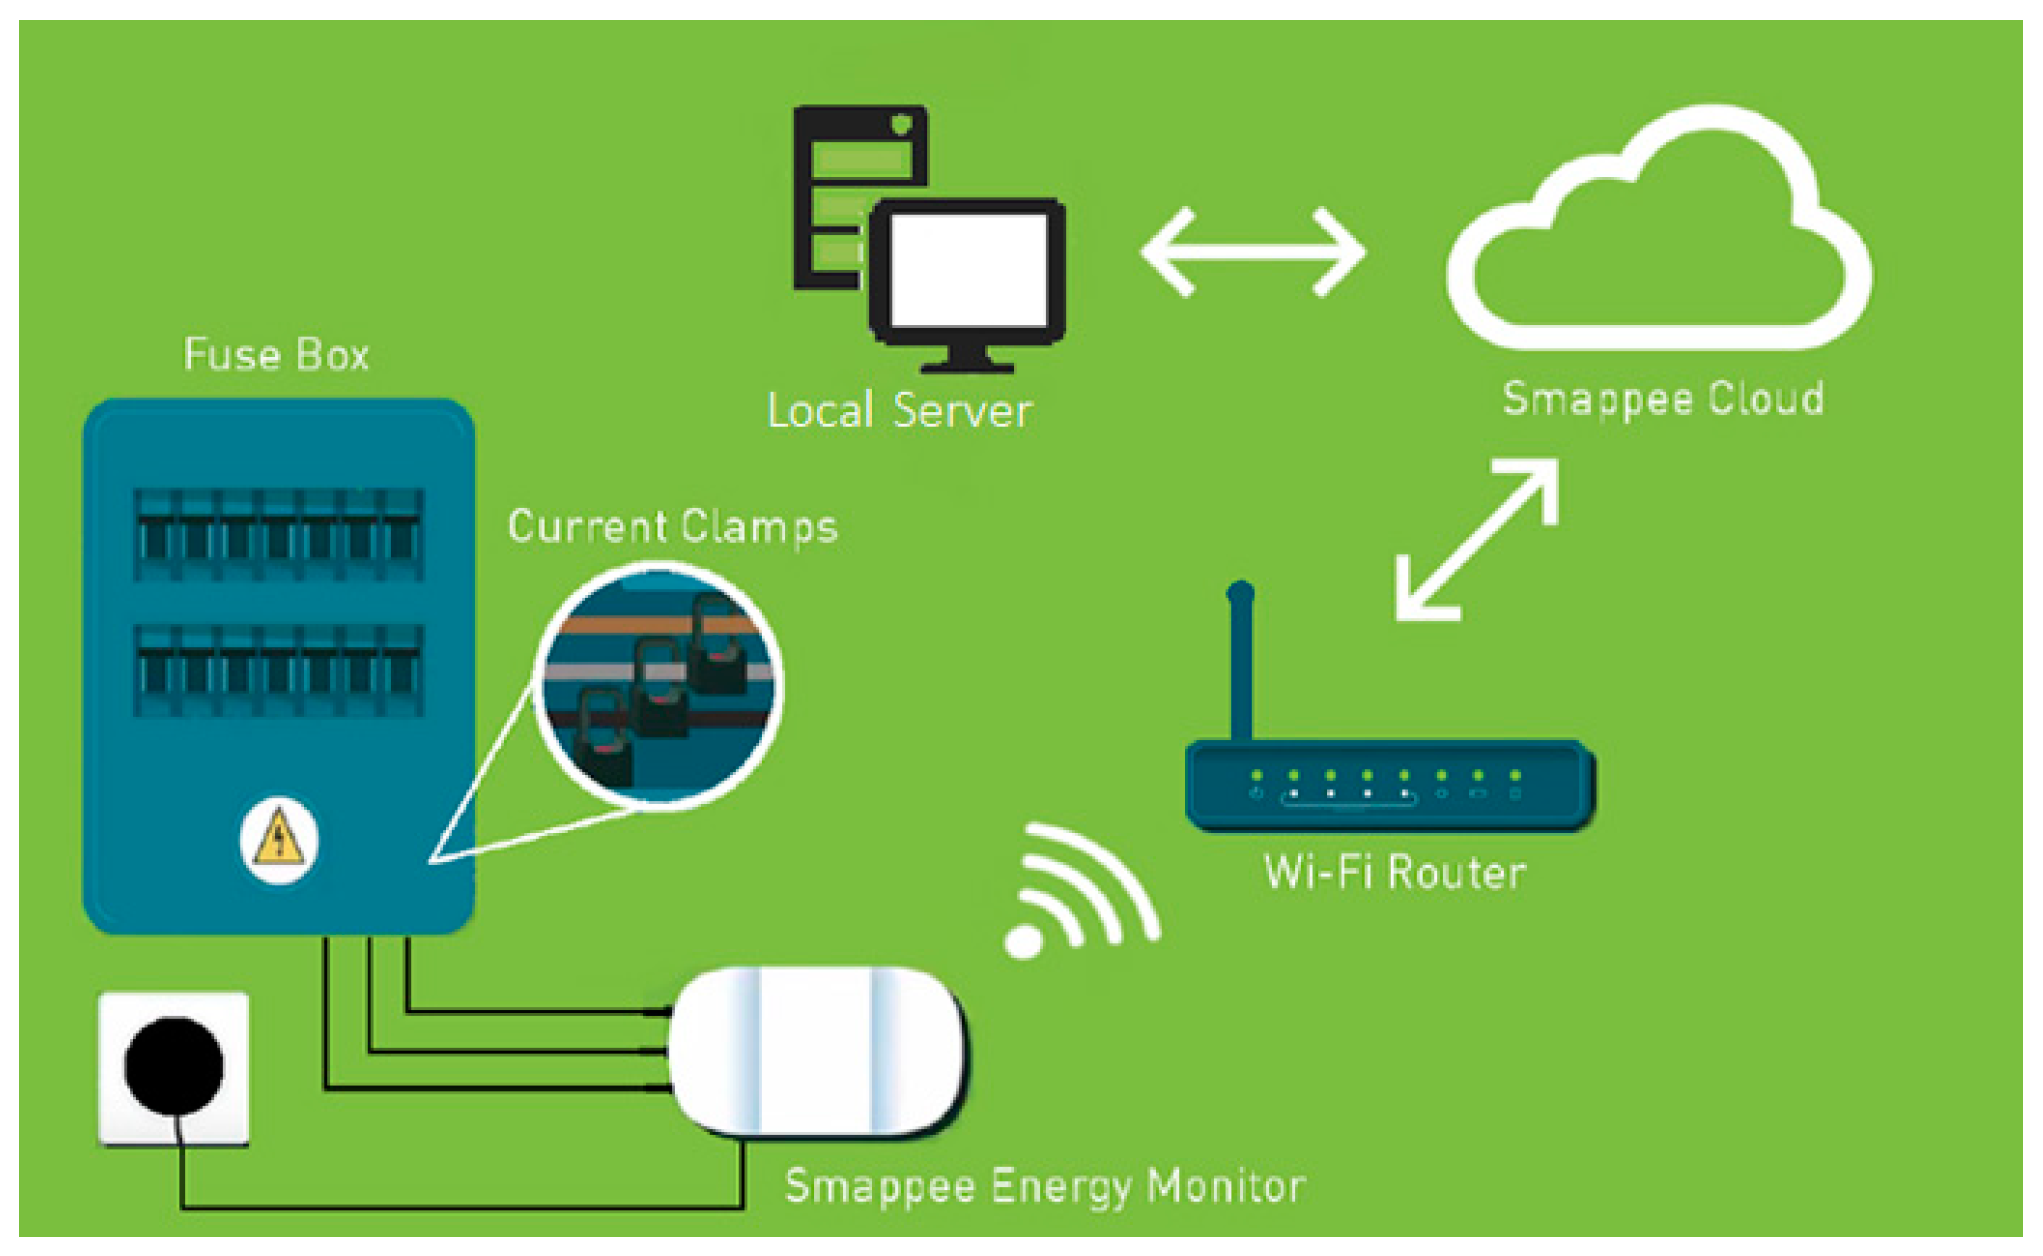
8]. In intrusive load monitoring, each appliance is monitored separately via measurement devices. This method is precise and allows the monitoring of each appliance individually. Intrusive load monitoring has two major issues. First, this method is very costly, as it requires dedicated monitoring equipment for each load. The other issue is that it creates greater discomfort to the occupants as it takes longer to install and dismantle, and occupies more physical space. The second method, non-intrusive power monitoring (NIPM), overcomes the discomfort issue at the cost of losing load identification precision. NIPM requires a single meter at the point of the household supply, typically at the main incoming feeder, and logs the total incoming power supply. In NIPM, individual appliance recognition is typically conducted by analyzing the electrical signatures of electrical loads via machine learning algorithms [9]. However, in order to perform a high accuracy appliance detection, it is critical to have a high sampling rate, e.g., 1 s to 1 min, for disaggregating algorithms to extract electrical signatures [10]. A list of publicly available datasets is presented in Table 1. It is important to note that most studies presented in the table aim to gather information about appliance type (e.g., resistive, inductive, non-linear, etc.) and usage patterns. Datasets serve as case studies to improve the accuracy of data mining and appliance detection algorithms. For instance, dataset REDD (Reference Energy Disaggregation Dataset) [11] includes 10 to 24 individual monitoring plugs dedicated to each major appliance at each house. However, a similar approach has minor significance in Qatar due to the fact that majority of the total load is dominated by AC loads while the remaining appliances add up to a small portion of the total load.
Residential load profiles are subject to a number of factors that influence and shape the load curve. Those factors can be classified into three different categories: socio-economic, climate, and technological. The socio-economic category includes factors such as the dwelling size and type, number of occupants [12], working status, level of income, and age of the responsible occupants [13]. Climate-related factors determine the required energy to heat or cool the house and keep hot or chilled water at desired temperatures. Technological factors that are related are the efficiency of the appliances and the amount of energy required to perform tasks. Globally, several studies have been conducted in an attempt to represent residential load profiles on a local scale. A study in Ottawa, Canada, with a sample size of 12 houses, investigated the impact of socio-economic and seasonal factors on load profiles [14]. Analysis of the measured data led to the indication that both lighting and appliances, aside from heating, ventilation, and air conditioning (HVAC), significantly impact the total load profile and cannot be neglected. Some of these appliances, such as refrigerators, are controlled by a thermostat. There was no direct relationship between the annual consumption of appliances and house size. On the other hand, there was a strong correlation between appliance use and the number of occupants. Another notable outcome of the study is the strong correlation between house size and HVAC load magnitude. Because the weather in Canada is cold for a large part of the year, air conditioning (AC) loads are notably significant and exhibit specific patterns.
A second study [15] was performed in Lochiel Park, Australia, with a sample size of 60 houses. The study concluded that HVAC loads are crucial to the occupants, even if electricity demand is reduced. It was found that the HVAC loads account for approximately 30% of the total consumption load. A study by Cetin (2014) [16] in Austin, Texas, with a sample size of 40 houses, found that the patterns of use of appliances are similar to the patterns indicated in a study from 1989 [17]. Appliances that are automated, such as a thermostat, are similar in different households. However, user-dependent appliance loads have significantly varying patterns among houses. Weekday and weekend use patterns of appliances are similar, but weekdays patterns, on average, have a lower standard deviation, indicating that they are more predictable due to routine lifestyle. Weekday use patterns, as well as those of households where no one stays at home during working or school hours, have more predictable, consistent electricity use patterns. In contrast, homes with occupants at home during working hours experience a large increase in overall appliance use. Washer and dryer use are influenced by the weather. Refrigerator and dishwasher energy use being affected by whether or not it is a weekday or a weekend. Most appliances use more than 25% of their daily energy use during peak use times, demonstrating the potential to reduce peak use on the electric grid. Table 2 is a summary of selective studies that focus on load profiling and factors that influence the load profile. The diversity in presented results suggests that electricity consumption patterns are region-specific, and there is a need for residential load profiling study in Qatar to analyze factors affecting energy usage patterns.
Electrical loads in the residential sector can be classified by a number of such as physical properties (e.g., resistive, inductive, etc.) and size (e.g., home, building, etc.). Another classification methodology is by job type, which can be split into two categories [18]. The first category includes an elastic load that can be flexible for the user to operate at various times. Wet appliances and HVAC loads are typically considered as flexible loads. These loads play a role in determining the shape of the profile and the extent of the degree to which it can be changed and play a critical role in demand-side management activities. The second type is an inelastic or uncontrollable load that has priority, impacting the comfort level of the user, and, thus, cannot be shifted. Cooking and lighting loads are considered to be part of this group.
Even though high-resolution power and energy measurement studies are rare, a few studies have presented the impacts of retrofitting [19] and occupant behavior [20] on the energy performance in neighboring countries. In these studies, the impact assessment is made based on monthly energy consumption figures gathered from electricity bills. Another commonly used method is to design building envelopes and develop simulation-based models to examine various energy saving studies [
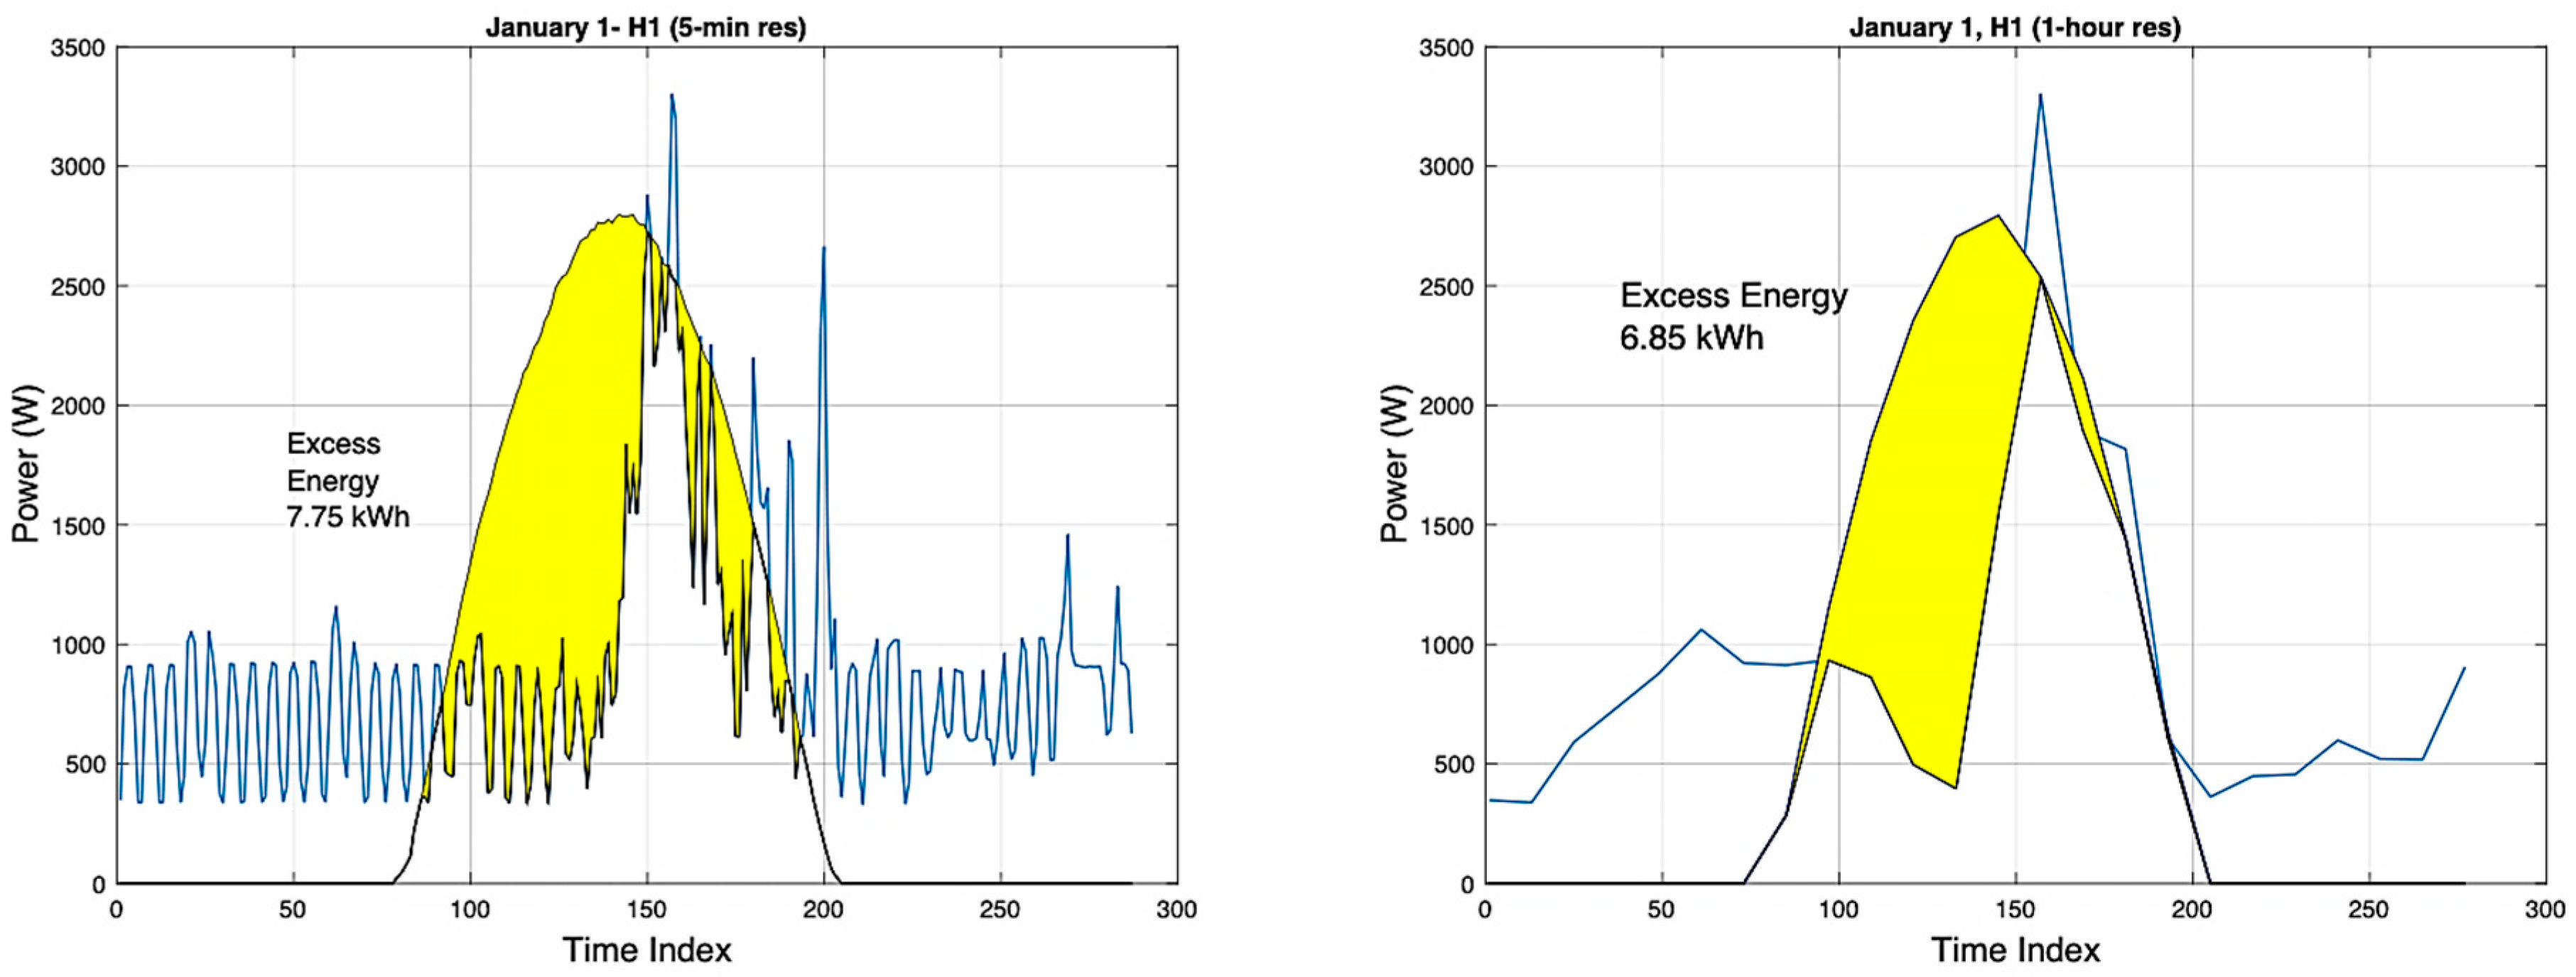
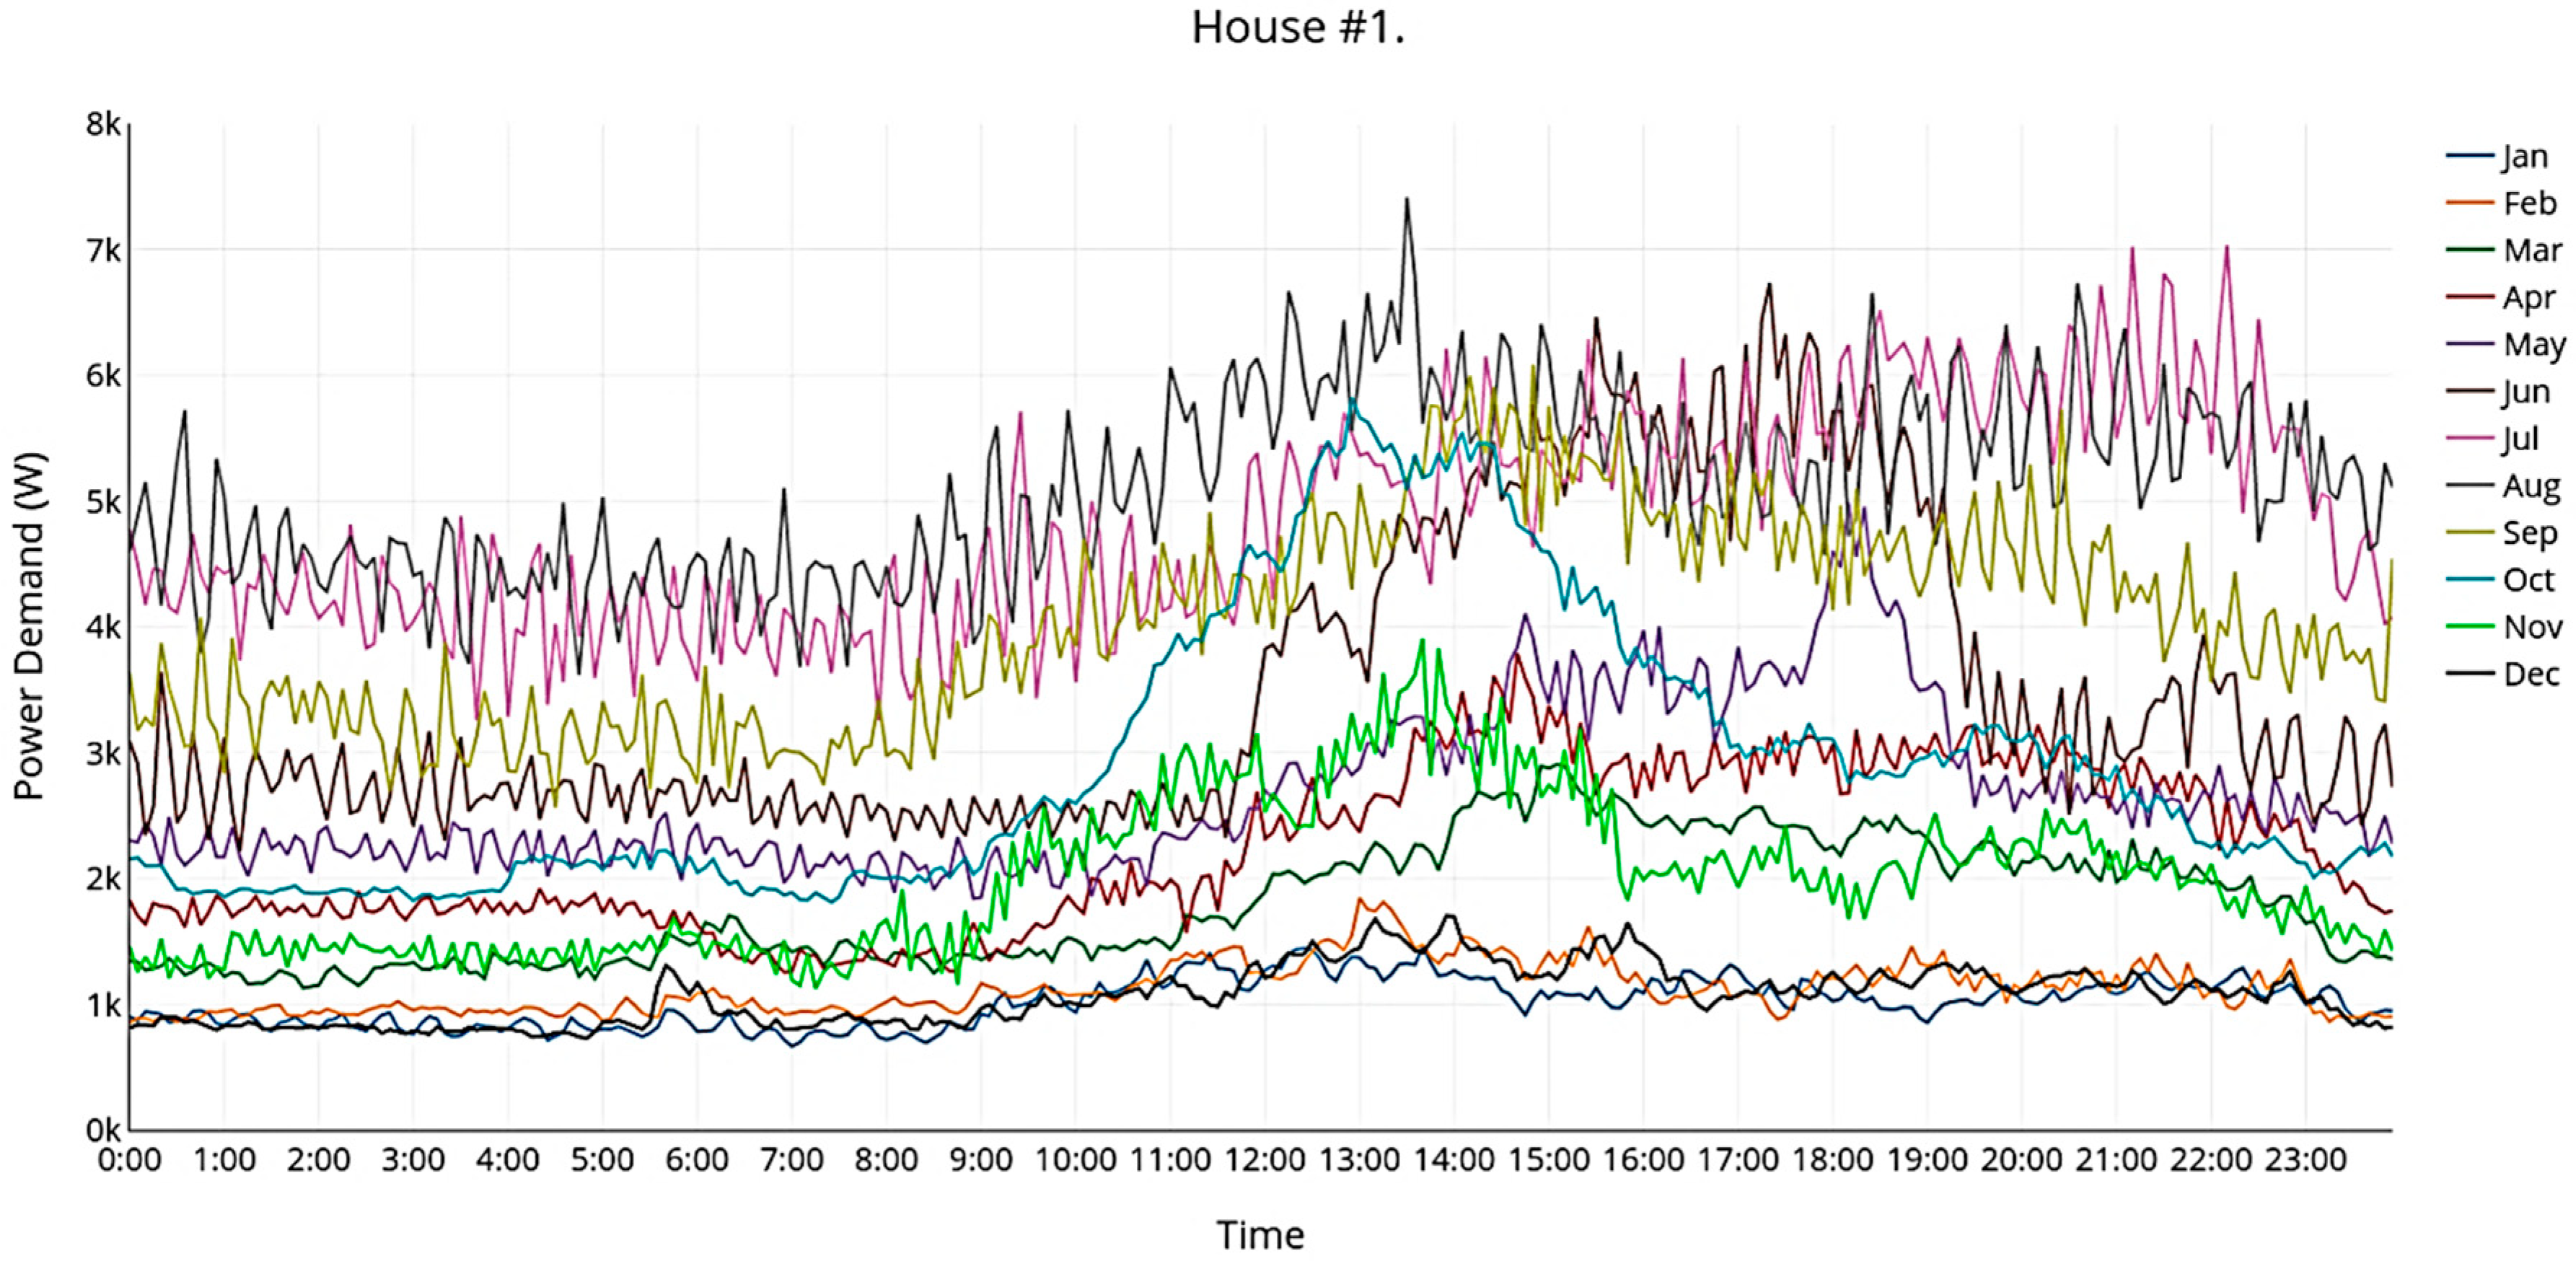
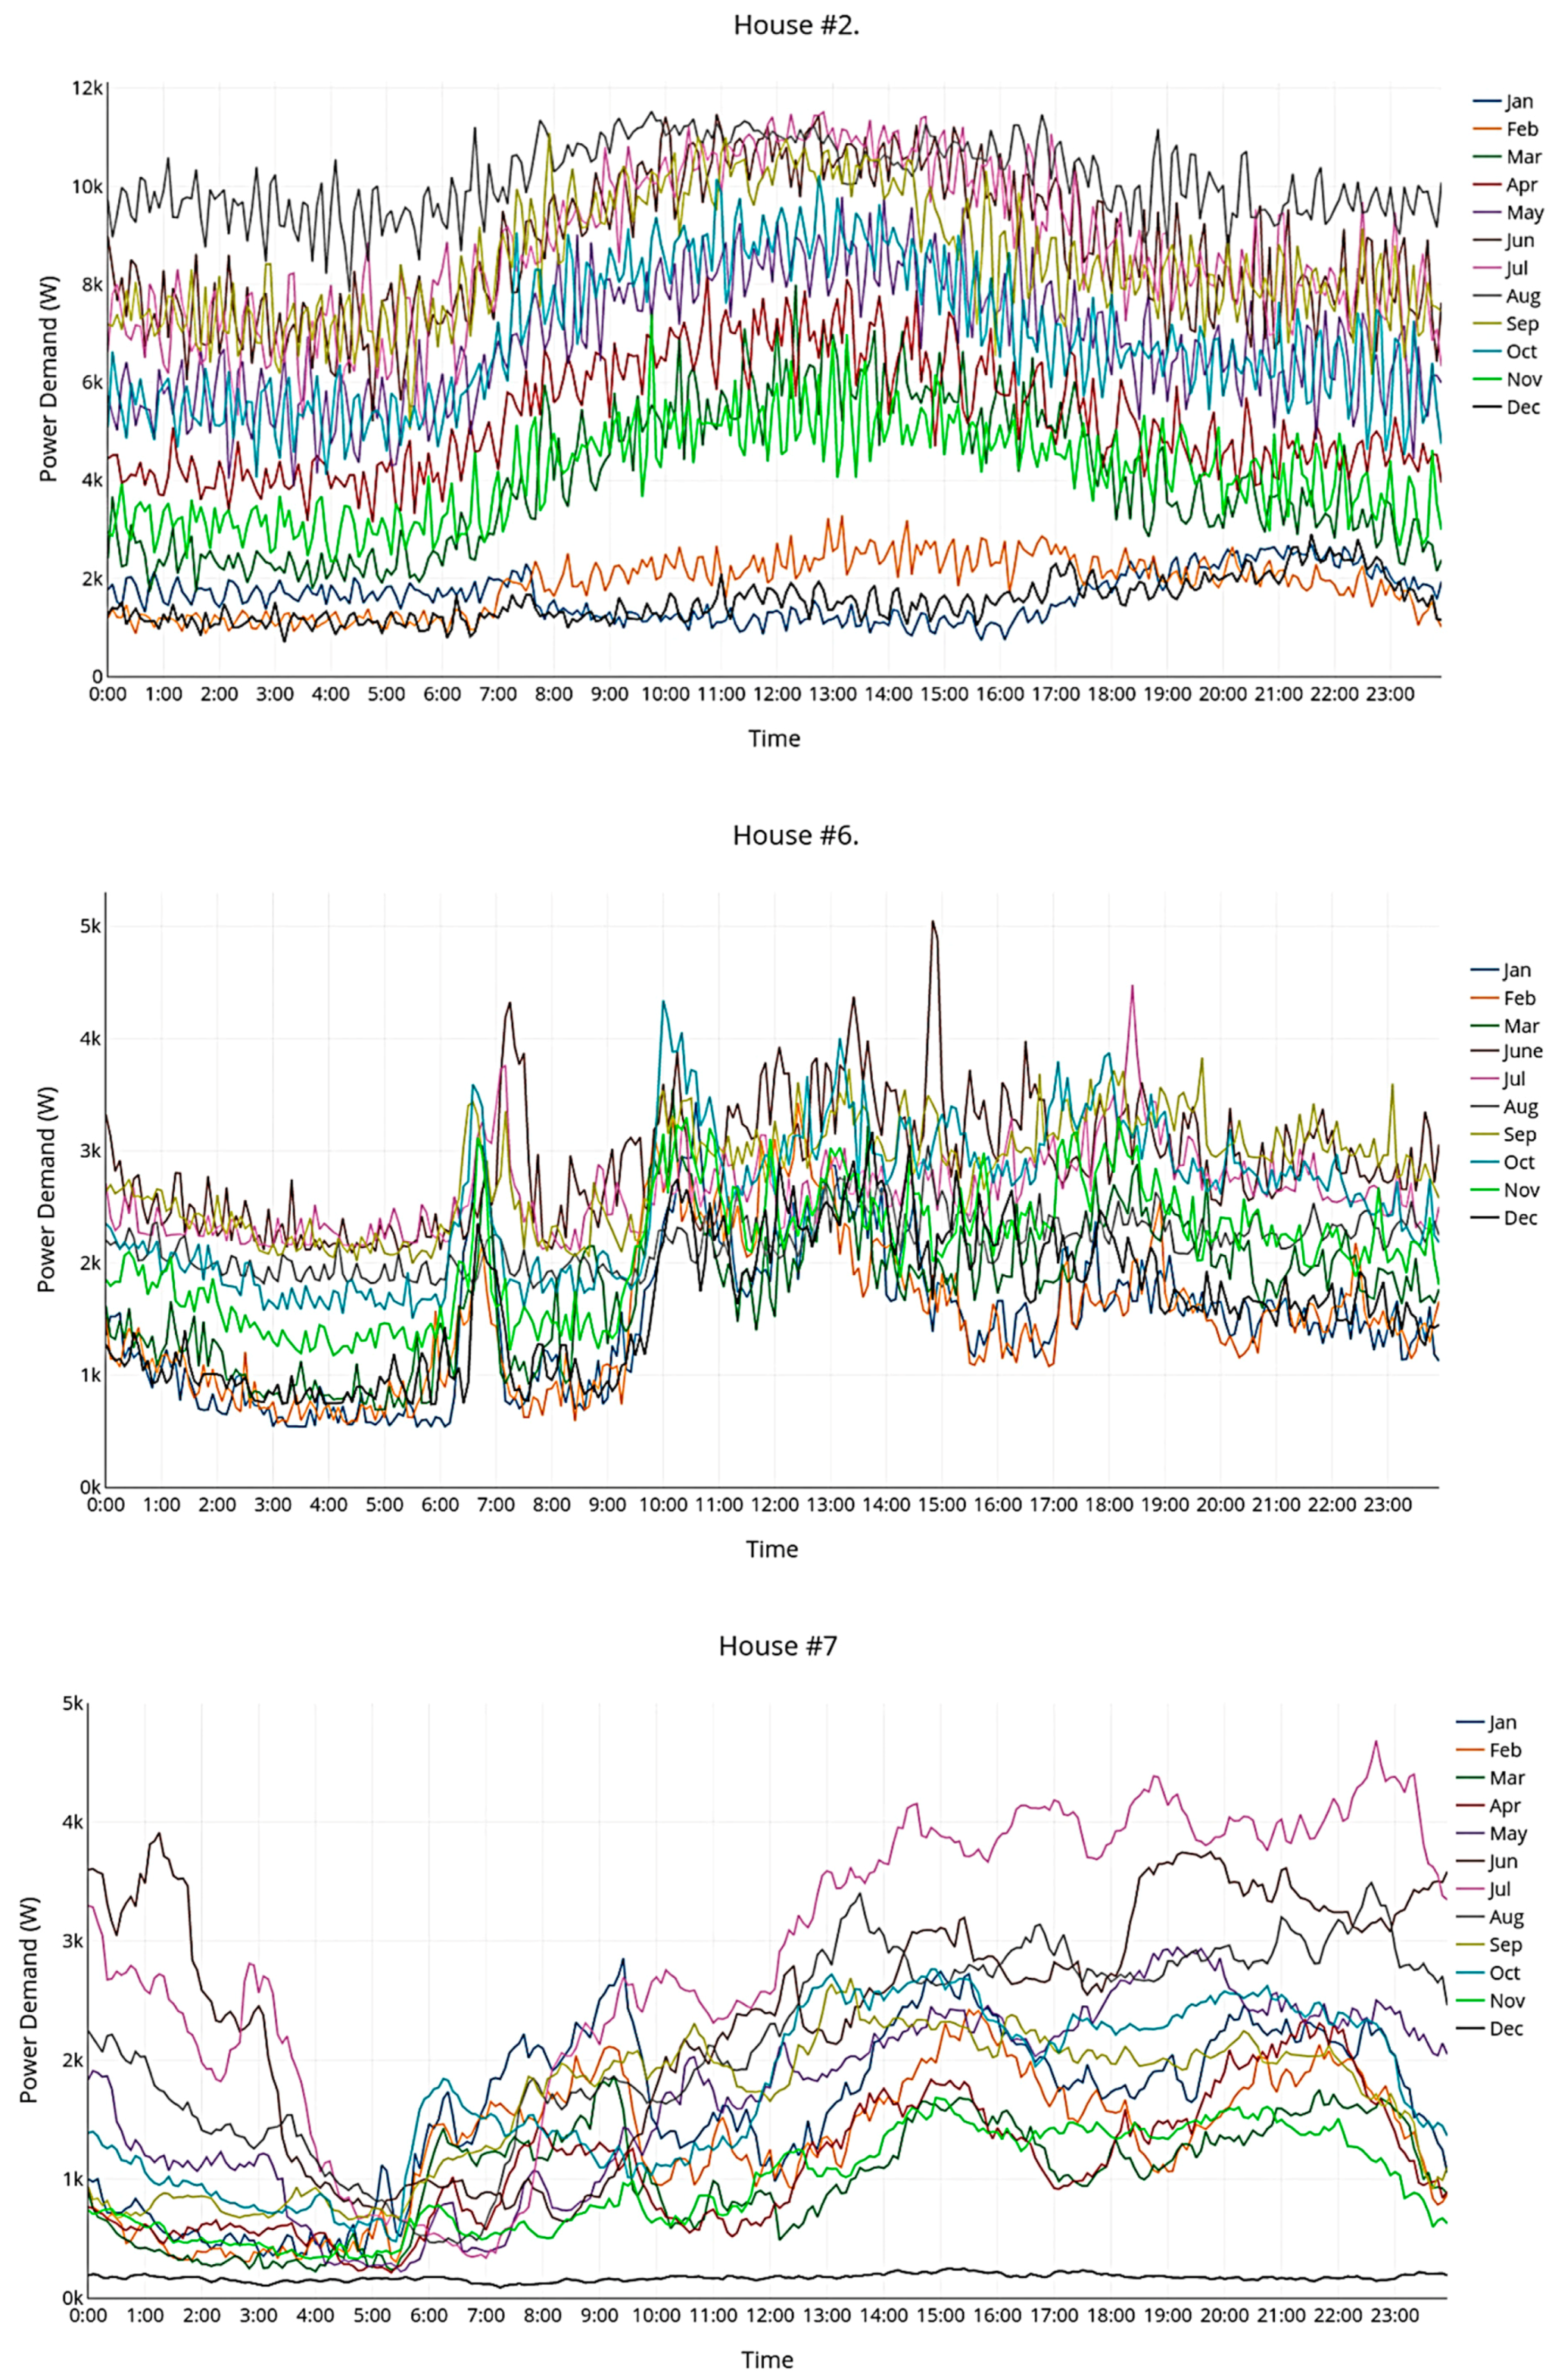
21]. Our study not only provides daily and monthly energy consumption profiles, but also presents five-minute resolution power demand, which is critical for PV and power system studies.

2.2. Demand-Side Management (DSM)

Load profiling studies are closely related to demand side management, which can be described as the set of activities that manage the timing and amount of energy consumed by the customer in a cost-effective manner [22]. DSM uses different measures to control electric loads, such as pricing-based, incentive-based, and remote load control [23]. In this sense, DSM is known to be a very successful method in cutting energy generation and enhancing electrical efficiency [24]. The process of evaluating and selecting the DSM method to implement requires a detailed understanding of how the customer is consuming electricity. The energy consumption is generally read from the electricity meter of the residence, store, business, or factory. The value taken from the meter represents the overall consumption and, therefore, submetering may be required to identify curtailable loads. Hence, monitoring and profiling the load is essential to evaluate the applicability of a particular demand-side management approach. In a related publication that is part of our study [25], a direct load control of air-conditioner unit experiments were conducted in a villa in Qatar. The experimental result show that nearly 10 kW of demand can be reduced from the testbed villa for 15 to 30 minutes duration without violating customer comfort.
Although demand-side management has gained a global appeal, countries in the GCC region lag behind, with only a few implementations of this type of management. The studies by Al-Iriani21 and Alasseri et. al. [26] are good examples for taking the initiative to introduce DSM to United Arab Emirates (UAE) and Kuwait. They discuss the possible and feasible forms of DSM that can be applied in their respected countries. Moreover, these references argue that the lack of broader DSM implementation is due to the abundance of domestic fossil fuel, which discourages energy conservation policies. On the other hand, rising global awareness about sustainability, and the analysis of the GCC growing population and energy demand have motivated the region to invest in sustainability. The projected depletion of fossil fuels and natural gas in the region is another strong driver to transform the current energy systems into a renewable, clean, and sustainable one.
In Qatar, DSM implementation is limited to energy efficiency measures, a national program called “Tarsheed,” which is Arabic for “awareness,” was launched in 2012 by the local utility company Kahramaa. It is estimated that the program succeeded in reducing the per capita consumption of electricity and water in Qatar by 17% and 18%, respectively, by the end of 2017 [27]. The program works through the enforcement of regulations that targets household appliance energy efficiency. However, the implementation of demand response programs, both price-based and incentive-based, faces the following issues: (1) electricity prices are subsidized; low electricity bills and employee benefits where bills are paid by employers lead to overconsumption of electricity; (2) the climatic conditions necessitate the need for the continuous and heavy use of AC and water; (3) high disposable annual income limits the applicability of monetary incentives capitalized by price-based DSM techniques. To that end, the analyses of consumption data presented in the current study will be a basis for future research efforts to quantify theoretical demand response potential of the country.

2.3. PV Rooftop Adoption

Residential load profiles can also be used in studies addressing PV integration in low-voltage systems and assessing the viability of PV rooftop-energy storage systems. The integration of PV energy sources can cause a number of issues to the power grid. Some of these issues are related to overloading network capacity, voltage issues, harmonics, and islanding detection, among other technical issues. Major relevant voltage issues are: (1) voltage fluctuation; (2) voltage unbalance; and (3) voltage rise [28]. Such issues may arise because traditional power grids are designed for one-way power flow, while the production from PVs causes bidirectional power flow. Traditional DSM system may not work as per the requirement with the integration of PV systems. Therefore, fast-response storage units can be more effective from the technical side. In Qatar, PV adaptation on a domestic level faces a greater challenge on the economic aspect, primarily due to the lack of incentives and regulations that promotes PV adoption. For example, due to the absences of income tax, tax credits are not applicable. Furthermore, there is no feed-in tariff to allow residential PV systems owners to sell back to the grid. Finally, electricity is highly subsidized for expatriates and businesses and free for citizens in Qatar [29]. In her study [30], Mohandes shows how residential PV adoption is strongly influenced by the introduction of a carbon tax, falling cost of PV, reduction of electricity subsidies and the extension of the electricity tariff to Qatari households. Furthermore, in a different study [31], it was found that market-based policies and government intervention is needed to influence public attention toward increasing energy efficiency. On the other hand, it is the mandate for the public utility operator to provide continuous electric service to residents. Therefore, energy storage units emerge as a solution to support PV penetration. Although this paper focuses on the design viability aspect of the rooftop PV-storage systems in Qatar, our future research will investigate the economic viability of such systems under various scenarios.

3. Methods and Procedures

In this section, the methodology performed to conduct the study objectives is discussed. A total of 10 houses in Qatar were chosen, and their electricity demand was monitored for a 12-month period to cover the various seasonal impacts on load power consumption. Moreover, the high-resolution global horizontal index of Doha was obtained from Hamad Bin Khalifa University’s (HBKU) outdoor test facility (OTF) to analyze the correlation between PV generation of different sizes and seasonal electricity consumption.

3.1. Monitored Houses

The candidate houses were selected based on (1) sample size of previous studies that were conducted without governmental support (e.g., 12 houses in Canada (see reference Saldanha and Beausoleil-Morrison)); (2) number of available volunteers available; and (3) the census of the population in Qatar (e.g., apartments and villas, number of occupant, etc.) [32]. Table 3 demonstrates census results conducted in 2015 and presents Qatar’s households and individuals, segregated by accommodation type and number of occupants. Table 3 further demonstrates a sample of the houses under study, segregated by accommodation type and number of occupants after standardization. The selection process of candidates for the study aimed at representing various socioeconomic backgrounds. According to the 2015 Census, 85% of the population resides in apartments and villas, with the number of occupants ranging from 1 to 10+. Another important parameter was the type of cooling, as cooling represents the largest chunk of the residential load. Therefore, houses with different cooling technologies such as central, split-unit, and district cooling were chosen. Electricity subsidies, whether the occupants pay the electricity bill or not, was also a critical factor. In Qatar, a significant portion of the population’s electricity bills is either subsidized or paid by their employers as part of a benefits package. Hence, we considered this situation when determining target households. In Table 4, a more detailed overview of monitored houses is presented. Other socio-economic factors, such as accommodation size and age, highest education level of household decision-makers, and a number of occupants under 18 years old, are shown in the table. Because the research conducted in this research involved monitoring lifestyle and details related to human subjects, an Institutional Review Board approval was necessary to protect the rights and welfare of human subjects.
A natural question arises whether the selected population is a representative of the population in Qatar, especially by considering the education levels of the selected population. Social demographics in Qatar exhibits unique characteristics as locals are a minority (~14%) in the country, while the expat population has been increasing over the last decade. Another noteworthy statistic is that 60% of the entire population is composed of construction workers who live in labor camps and are not considered in this study [33]. According to the Qatar Ministry of Development and Statistics [34], 40% of the population’s educational status is high school degree and above. It is reasonable to assume that most of the construction workers have a lower educational level. Then, by normalizing the population statistics, it can be concluded that the education level of the sample houses is a good representative of the population in Qatar.

3.2. Monitoring System Structure

Electricity in Qatar is rated at 240 V, 50 Hz, following the UK standard, and is usually supplied in three phases to the residential sector. Because of its compliance, we chose the Smappee energy monitor [35] and installed it on the main circuit panel at the electrical supply of each house. Energy monitors measure the current using clamp meters and do not require direct contact with the electrical current. The energy monitor requires a plug-in power supply to power the monitor and Wi-Fi connectivity to upload readings. Because it involves NIPM, power measurement is only required at a single point at the main supply of the household. Voltage and current parameters are used to determine the power and energy consumption values of the building, and the monitor logs the readings every five minutes. The data can be accessed through the cloud using the company’s web portal, where users can display real-time electricity consumption and download historic (two-week) data in csv format [35]. To automate periodical readings from the server, a web portal and a local server were created using Smappee web services. Figure 2 demonstrates the monitoring system structure architecture used to achieve energy profiling.
The power measurement accuracy depends on the clamp meter capacity and power factor of the load. The clamp meters that were used have a 50-A rating. The Smappee technical team demonstrates the accuracy details of the clamp meters to assess the accuracy of the readings. Kahramaa regulations and power correction facilities maintain the power factor of the residential sector well above 0.9; hence, it was deduced that at a nominal current, the accuracy and percentage error of the energy monitor is around 0.9% of the reading. It is noteworthy that the local utility company owns all network equipment from the meter to the generation side and does not allow measurements to be taken on their equipment. Hence, using energy monitors attached to customer’s distribution boards is the only way to take measurements in the country.
The solar data used in this study were collected from the Solar Test Facility located at Qatar Science and Technology Park (QSTP). The 35,000 m2 test site is operated by the Qatar Environment and Energy Research Institute, in collaboration with Hamad Bin Khalifa University. The data include global horizontal irradiation (GHI) values in W/m2 for the year 2016, in one-minute intervals. To visualize the PV generation demand curves, the GHI data are used for PV panels with 15% efficiency and an area of 1.6 m2, and it is assumed that 5, 10, 15, or 20 panels could be installed at rooftops. It is noteworthy that calculations losses due to dust deposition, ambient heat, inverter losses, and partial shading are excluded. Hence, the presented results act as an upper envelope for PV production.

3.3. Research Obstacles

During the course of the measurement study, we encountered several challenges in addition to the previously discussed server limitations. By far, the most challenging part was to convince participants to take part in the study. Our initial target was to obtain measurements in a larger number of houses. However, to avoid delay, we decided to proceed with 10 units. Moreover, due to Internet outages, occupant vacations, and server downtime, data measurements were interrupted for several weeks. When possible, to fill the missing data, energy monitoring was performed during the same dates of the next year. Finally, despite several attempts to involve locals in our study, all 10 participants were chosen from expats, which is representative of 85% of the inhabitants of Qatar.

4. Results and Discussion

During the course of the study (12 months), with 10 Smappee monitors recording every five minutes, and the solar energy data which were recorded at one-minute intervals, the total number of records has approximately reached 1.05 million and 0.5 million, respectively. Therefore, it was of high importance to systematically format and sort the data. It is noteworthy that since solar energy values were recorded at every minute, five-minute intervals were averaged to match the Smappee frequency of five minutes.

4.1. Daily Load (Power) Profiles

4.1.1. Results

In this section, we present electricity measurements recorded in 10 households. High-resolution daily load profiles are critical inputs for PV-rooftop calculations as it shows the temporal alignment between PV generation and electricity consumption. It is important to note that a lower time resolution leads to an overestimation of the PV self-consumption since fluctuations causing a mismatch between the PV generation and load profiles will be ignored. Houses with central AC units have significant fluctuations occur due to AC units’ “on” and “off” cycles. Hence, it is important to use high-resolution profiles. A number of previous studies, including [36,37,38] have investigated the impact of the time resolution on-site generation analyses. The conclusion is that sub-hourly data sets are needed to capture the behavior of high peak powers. This is further illustrated with a sample case study (depicted in Figure 3) in which five-min and 1-hour resolution PV and demand data are plotted to calculate the amount of energy sent back to the grid (illustrated with the yellow area). In power system operations, time and magnitude of PV power injected back to the distribution grid are required to detect potential faults and power quality degradations. Furthermore, daily load profiles reveal how occupant behavior is shaped by external factors such as electricity prices, weather conditions, and standby consumption during vacation and holiday periods. For each house (H1–H10), we calculated monthly-averaged daily electric profiles from July 2017 to August 2018. The results for selective houses are depicted in Figure 4.

4.1.2. Analyses

Presented results exhibit anticipated patterns between summer and winter months, where July and August have a higher power demand, while December to February displays the least power demand. In conjunction with the general trend, there are additional remarks that can be drawn from the load profile. During the summer, the load demand is dominated by air conditioning. The air conditioner is routinely switched on and off by the action of the thermostat, which leads to the creation of air-conditioning cycles, generating the rapid fluctuation that can be observed in months where air conditioning is used; meanwhile, colder months have smoother curves. Thermostats can also be found in refrigerators and freezers. Furthermore, for the months of October and June, when the average temperature is moderate, we can still observe high load demand during afternoon hours on account of the high temperatures from 12 pm to 6 pm but at much lower demand throughout the rest of the day. H2 exhibits an even more predictable seasonal impact trend, with strong proportionality to the average outside temperature, which can be seen in Figure 5. From Table 4, in comparing H1 and H2, it becomes apparent that the main reason for H2 to have a power demand almost double that of H1 is the necessity for air conditioning. H2 has a significantly larger household area and size, which explains the greater need for air conditioning. Despite the similarity in socio-economic factors, another indicator of lower energy consumption in H1 is the fact that residents pay for their own electricity and water. This is again observed in Houses 8, 9, and 10, where the residents pay electricity bills and tend to consume less electricity than residents who do not pay bills, i.e., in H2 and H4. Occupants who pay their own electricity bills are more self-aware and motivated to reduce their electricity use by taking actions such as switching off the air conditioning during cooler months outside peak hours. The results of H7 follow unexpected patterns because of the fact that the air-conditioning on the first floor is centralized and fed from an external distribution board that is not included in the monitoring. Split-unit air conditioners are merely switched on during the daytime on the ground floor. It is noteworthy that in our previous study [39], we analyzed the peak hours (when the top 5% of the daily demand occurs) for each month as follows. From April to October country-wide peak hours occur between 1 pm to 4 pm, while peak demand hours shift to 5 pm to 8 pm during the rest of the year.
H6 employs district cooling. Therefore, measurements only reflect the non-cooling demand for each month. This is why consumption levels are similar throughout the study. The results further show that each consumption level is quite different. Thus, the optimal design of PV rooftop and energy storage systems differs for each housing unit. The generation capacity of the PV system is reflected by the number of panels, and the number of panels is dictated by the load consumption, rooftop physical space availability, and household owner economic capability and willingness. In Qatar, residents take an extended summer vacation and usually leave their AC units running to prevent excessive heating. This practice is especially popular with residents who do not pay electricity bills.
To gain insight into appliance usage, a second Smappee energy monitor was installed in H2 on the air conditioning feeder circuit breaker, which exclusively monitors the energy consumption of air conditioning. Figure 6 demonstrates the daily AC vs. non-AC load energy consumption for a year. It is clear that the AC loads are affected by the climate temperature, while non-AC loads are nearly constant throughout the year. AC load is around 80–95% during May and July 2018 for H2. Therefore, it is clear that demand-response programs should focus on managing the cooling load instead of other appliances.

4.2. Daily/Monthly Energy Consumption

4.2.1. Results

Daily and monthly energy consumption data are important parameters in assessing building energy performance and energy efficiency measures. In such studies, aggregate, per-capita, and per square footage energy consumption results are used to analyze the impacts of various socio-economic factors such as income level, occupant number, and appliance usage. To that end, Figure 7, Figure 8 and Figure 9 present the comparison of measured houses for a 12-month period. It is important to note that previous studies use annual averages to compare household profiles. However, as shown in Figure 5, AC loads dominate consumption patterns; therefore, our analyses use monthly patterns.

4.2.2. Analyses

Figure 7 shows the average daily energy consumption for 10 housing units. From Figure 7, it can be observed that the highest energy consumption occurs in houses with the largest size and number of occupants, since cooling demand is dominant during the summer months. Notice that H2 and H10 have similar consumption figures even though H10 contains more occupants and is larger than H2. The only major difference between them is the fact that similar to H4, residents of H2 do not pay electricity bills, while H10 pays electricity bills. This comparison is a clear indicator of how energy subsidies lead to overconsumption. Moreover, Figure 8 demonstrates the average daily energy consumption per capita, which was obtained by dividing the consumption by the number of occupants. Notice that H2 has the highest energy consumption per capita. This can be explained as follows: H2 is a relatively large villa for only two occupants, and therefore, each occupant utilizes a larger physical space than the occupants of the other houses. Figure 9 illustrates the average daily energy consumption per unit area. H3 is a one-bedroom apartment that is both small in size and cooled by means of less energy-efficient split air conditioning units, which explains its high values. Moreover, the apartment is subject to more sunlight, as it has a single floor, leading to the necessity for greater cooling. It is notable to mention that the occupant was not present during the months of June, February, and March. In addition, the difference in average daily consumption between houses diminishes when the AC load loses its share in colder months. This can also be observed by the consumption levels of H6, which employs district cooling and has a non-AC load that does not vary much throughout the year. Overall, it can be seen from the results that summer and winter consumption vary significantly. To that end, in addition to findings presented in Figure 6, DSM policies should focus on cooling load as it represents the highest portion of the domestic consumption.
Figure 10 demonstrates a comparison of the average per occupant monthly electricity consumption in Qatar and UAE. In his paper, Giusti et. al. [20], collected the energy consumption of 13 Emirati houses (in Abu Dhabi, UAE) using electricity bills and demonstrated the mean per capita monthly electricity consumption. When comparing our results with Giusti et. al (reference [20], Figure 1), Emirati houses consume considerably more electricity for the following reasons: (1) Emirati houses in the study are larger and with a higher number of occupants on average than the houses in our study (2) sample size in both studies are small (10 houses versus 13 houses), (3) our study contains only expats, while Giusti et al. sampled all Emirati households. The comparison shows that GCC nationals tend to consume more electricity than expats. To that end, future studies that include Qatari citizens are likely to obtain higher consumption values.

4.3. Summary of Key Findings

From the presented results until here, a summary of key finds related to energy measurements can be listed as below.
  • Energy subsidies are a major driver of electricity usage. From the presented results, annual daily per-household consumption is 102 kWh, while this figure is 28.9 kWh in the United States [41] and 15.2 kWh in Australia [42].
  • In addition to subsidies, AC load represents a significant portion of the total load (>90% for House 2). Due to cooling, load summer consumption (June-Sept) could be more than fivefold higher than winter consumption (see Table 5).
  • Due to cooling, dwelling size is a multiplier of domestic consumption (see Figure 6), while central AC units consume less energy than split AC units (see Figure 8).
  • Residents who do not pay electricity bills have flatter load profiles due to “always on” loads (e.g., H4). On the other hand, residents who pay their bills tend to conserve energy and have visible load variations during the day (e.g., H7, H8).
  • Considering social, economic, and geographical similarities between Qatar and UAE, expats consume less energy than the GCC nationals by comparing our results with a measurement study conducted in Abu Dhabi, UAE.

5. Assessment of Rooftop PV Systems with Load Profiles

The presented results in the previous section are critical inputs to assess the performance of rooftop PV and energy storage systems. In this section, we use high resolution datasets (see Section 4.1) along with ground solar measurements to assess PV rooftop energy storage systems. First, measurements for solar radiation are presented. Next, self-consumption values for various PV-sizes are calculated, and excess power flow ratios are presented. Finally, based on the results, energy storage sizes are determined to minimize bi-directional power flow.

5.1. PV Power Generation

Due to the abundance of solar resources, deployment of PV systems has gained accelerated interest in the GCC region. By the end of 2021, Qatar is expected to have 700 MW solar generation [43], and rooftop PV systems are expected to grow over the next decade. The output of PV systems is determined by several factors such as solar irradiance, the efficiency of panels, inverter performance, dust deposition, aerosols, ambient temperature, etc. However, major determinants are irradiance and efficiency of panels as the weight of other parameters is usually site-specific and limited (see Reference [44]). Figure 11 demonstrates the monthly solar irradiance data collected from the solar test facility located at HBKU’s outdoor test facility [45]. Even though measured houses are located apart from each other, the fact that capital city Doha receives relatively uniform solar radiation throughout the entire year is confirmed in the International Energy Agency report [46].
Next, we present a case study to show how the residential load and PV production profiles coincide for a varying number of PV panels (from 5 to 20), given solar irradiance statistics, and aforementioned panel size assumption (15% efficiency and an area of 1.6 m2/panel). Houses H2 and H7 are chosen to represent a high-income unit with no electricity bill and a low-income who pays electricity bills, respectively. Moreover, January and July profiles are chosen to represent the minimum and maximum energy consumption months. Figure 12a shows that because of high electricity consumption in H2 in summer, the PV system does not generate enough power to meet domestic demand. On the other hand, as shown in Figure 12b, for the winter month of January, panel sizes of 10 and above lead to surplus energy. The electricity and PV profiles presented in Figure 12c,d are more similar to ones that are in Europe or the United States, as the residents are responsive to reduce their electricity bills. Hence, unlike the previous case, surplus power generation occurs for a twelve months period. In the next section, we present calculations for all 10 houses.

5.2. PV-Rooftop and Energy Storage Systems

PV production-load profiles given in the previous section are essential in distribution system planning and operation, as they reveal the amount of power that will be sent back to the grid. Moreover, as the results show, consumption patterns in Qatar are highly dependent on weather conditions, and the change in PV production does not change proportionally with the change in power demand. According to Electric Power Research Institute [47], there are four main energy storage applications for residential customers; time-of-use (TOU) energy charge reduction, demand charge reduction, power quality improvement, and power reliability (back-up) support. In the first two applications, end-users reduce their bills by storing cheap PV electricity during off-peak hours and use it during peak hours. For the case of Qatar, these applications do not seem to be practical because (1) electricity prices are mostly subsidized and too low compared to international benchmark prices; (2) there are no financial rebate programs for the promotion of PV systems; (3) most of the residents are expats who stay in the country for short amount of time. On the other hand, the last two applications may be suitable. As our results show, there are significant differences between summer and winter loads and lower self-consumption in winter causes bi-directional power. Therefore, batteries can be used during winter months at distribution networks with high PV penetration to avoid overvoltage issues and improve system reliability. This way, potential blackouts stemming from bidirectional power flows can be minimized. Considering the fact that the power grid in Qatar is a low-inertia system (low flexibility, more interruptions) with limited interconnection to neighboring grids, the role of storage units needs to be carefully investigated.
Because of high capital cost, energy storage systems need to be optimally sized to meet the predefined objectives. The size of the storage units can be determined by a confluence of drivers, including the size of the PV system, electricity prices, and consumption factors. In the case of Qatar, there are certain barriers facing PV adoption: even though there are no financial incentives in Qatar, the results presented in this study can be used as the basis for techno-economic analyses of such systems under hypothetical tariffs and incentives scenarios. Therefore, new business models are needed, and PV and storage systems are likely to be owned and/or operated by the utility company. In this research, we assume that storage units are sized to minimize the average reverse power flow, which is favorable by the utility company.
Important information regarding the potential and viability of energy storage can be deduced after calculating the self-consumption values [48]. Self-consumption rates reflect the percentage of PV production consumed locally during the daytime. From Figure 13, self-consumption ratio (0–100%) can be calculated by:
Self - consumption   =   SC SC + RP
where SC is the amount of energy consumption from solar production, RP is the amount of energy sent back to grid, and GP is the amount of energy required from the grid for the remaining load. In this example, energy demand daily demand (GP + SC + RP) is 54.67 kWh, total solar generation (RP+SC) is 24.02 kWh, and (RP) 4.82 kWh energy is sent back to the grid. Then, the self-consumption ratio can be calculated as 79.9%. In the literature, the term self-sufficiency is also used to represent the amount of energy met by solar production during 24 hours period; hence, it can be calculated by:
Self - sufficiency   =   SC SC + GP
Figure 14 presents a summary of all self-consumption values in terms of percentage using Equation (1), including all houses considered in the available monthly data, while Table 6 presents self-sufficiency calculations using Equation (2). Notice that one hundred percent self-consumption means all of the produced solar energy is consumed locally; hence, there is no excess energy. After analyzing the results, we can deduce that H2, H4, H8, and H10 have high load demand and would consume all the PV production during most months, indicating the need for energy storage redundancy. The immediate solution is to increase the number of panels; however, there are limiting factors to consider, such as the cost and availability of rooftop space.
As for the remaining houses, we can deduce the maximum storage size requirement by choosing the month with the lowest value of self-consumption, which is often found during a cold month with low load demand. By plotting the load demand against the PV power generation, the surplus area of PV generation above the load demand represents the power that can potentially be either stored or sold back to the grid. Since selling PV-generated power back to the grid is not yet a viable option in Qatar, all of the surplus power should be stored for later use. It is noteworthy to mention that we chose 20 panels of PV generation for all of the houses, except H3. H3 has a small rooftop area and small overall load demand, and thus, it would have been illogical to choose 20 PV panels. Typically, 50-volt batteries are used to store PV energy. Table 7 summarizes the maximum energy storage size requirement for selected houses in units of ampere-hours (Ah), with a 20% safety factor increase in the actual size requirement. The excess and storage energy unit is converted from kWh to Ah, as Ah is the preferred unit for energy storage design and comparison. The operation duration as a ratio out of a year period can be found after counting the days during which none of the energy is stored for each house.
It is noteworthy that determining the objective of the sizing problem is a matter of design choice. One could choose to size based on minimizing average flow, while a more conservative policy would be to size the storage unit based on a worst-case scenario (highest excess power flow day). However, if the system operator chooses a conservative policy, then, the system would be overprovisioned. In this paper, we claim that on averag, all bi-directional power flow will be stored. We further present a case study to compare sizing based on average values (average monthly and average solar) versus day-by-day comparison for H1. For the first method, storage size is determined as 17.09 kWh, while if we compare day-by-day, storage size becomes 17.30 kWh. Note that the results for day-by-day comparison can deviate next year due to factors such as a reduction in load or solar generation (e.g., due to clouds, rain, etc.).

5.3. Summary of Key Findings

In this section, we highlight the summary of key findings related to PV-rooftop energy storage systems as follows.
  • Overall, PV self-consumption levels are higher for houses who do not pay electricity bills due to high domestic consumption.
  • Published studies (see reference [48] for Sweden, reference [49] for Germany, and reference [50] for Australia) show that even for small PV systems (<10 kW), self-consumption rates are less than 50%. Results presented in this paper show that self-consumption rates in Qatar are considerably higher (more than 90%) due to both high electricity demand and the alignment between PV production and domestic consumption.
  • Motivated by time-of-use (TOU) pricing, most studies (Reference [51,52]) aim to improve self-sufficiency by employing storage units. On the other hand, for the case of Qatar even if TOU is applied, the following dilemma arises: low-income households have excess PV power to store, while for high-income ones there is limited applicability for energy storage.
  • As our results show, there are significant differences between summer and winter loads and lower self-consumption in winter causes bi-directional power. Therefore, in the current state of affairs, batteries may be needed during winter months at distribution networks with high PV penetration to avoid overvoltage issues and improve system reliability.

6. Conclusions

In this paper, we have presented a measurement based study to reveal electricity consumption habits in Qatar. We installed energy monitors in 10 households that were carefully selected to mimic the residential classification in Doha as much as possible. Data were collected over a year-long period.
From the presented results, it can be concluded that the size of the house, whether occupants pay electricity bills or not, and the air conditioning type are the main determinants of electricity consumption. The results indicate general trends in the overall behavior of the residential load profile. Generally, the load demand during the hottest summer months of July and August exhibits a five-fold increase compared to the load demand during the cold months, such as December and January. The reason for this large variance is the perpetual use of air conditioning during the warm months, which constitutes approximately 70%–95% of the total load, based on the findings of this study and similar studies that attempt to quantify the cost of cooling in Qatar [1]. Furthermore, the size of the house is the most important factor that impacts the load profile of a household by means of its role in the determination of the amount of air conditioning needed. Finally, the fact of whether or not the occupants of the house pay their energy and water bills has a marginal impact on the load profile.
The conducted study revealed a number of important insights related to the impacts of energy subsidies in a carbon-rich country residing in an arid climate. When compared to other resource-rich developed countries (e.g., the United States and Australia), energy consumption is three–five times higher in Qatar. Moreover, in comparison with GCC nationals from UAE showed that expats consume considerably less electricity than the GCC nationals.
Using high-resolution load profiles, we calculated PV self-consumption rates for a number of different scenarios. We showed that unlike many published studies (cases for Sweden, Germany, etc.) there is a good correlation between PV generation and household demand. For energy storage systems, the results showed that under current circumstances, lack of financial incentives, and abundance of energy subsidies limit the applicability of energy storage systems for end-user bill and demand management. However, penetration of PV systems may create distribution network instabilities, especially during winter months, when PV generation exceeds demand. Hence, a more realistic application scenario would be the adoption of storage unit by the utility company.
Because of the numerous challenges encountered while conducting this study, future attempts may adopt the following recommendations: (1) increase the sample size, (2) include local households to further mimic the residential classification distribution, and (3) use actual data from residential rooftop PVs rather than GHI values for evaluation. More comprehensive studies with larger samples will be effective in evaluating the direct load control to affirm the feasibility of integrating the scheme. Investigation of the technical compatibility of residential rooftop PV systems with the electric grid in Qatar is essential to avoid any faults or unnecessary tension on the grid.

Author Contributions

Data curation, O.A.; Investigation, O.A.; Methodology, I.S.B.; Project administration, I.S.B.; Software, O.A.; Supervision, I.S.B. and M.K.; Validation, O.A.; Writing—original draft, O.A.; Writing—review & editing, I.S.B, and S.G.A.-G.

Funding

The publication of this article was funded by the Qatar National Library.

Acknowledgments

This research was supported by a scholarship (210004829) from Hamad Bin Khalifa University (HBKU), a member of the Qatar Foundation (QF). Any opinions, findings, conclusions, or recommendations expressed in this material are those of the author(s) and do not necessarily reflect the views of the HBKU or QF. The publication of this article was funded by the Qatar National Library.

Conflicts of Interest

The authors declare that there is no conflict of interest.

References

  1. Saffouri, F.; Bayram, I.S.; Koc, M. Quantifying the Cost of Cooling in Qatar. In Proceedings of the 2017 9th IEEE-GCC Conference and Exhibition (GCCCE), Manama, Bahrain, 8–11 May 2017; pp. 1–9. [Google Scholar] [CrossRef]
  2. Bayram, İ.Ş.; Koç, M. Demand Side Management for Peak Reduction and PV Integration in Qatar. In Proceedings of the 2017 IEEE 14th International Conference on Networking, Sensing and Control (ICNSC), Calabria, Italy, 16–18 May 2017; pp. 251–256. [Google Scholar] [CrossRef]
  3. Kahramaa. Qatar General Electricity and Water Corporation. Statistics Report 2014; Kahramaa: Doha, Qatar, 2014; Available online: https://km.qa/MediaCenter/Pages/Publications.aspx (accessed on 1 December 2018).
  4. Jones, R.V.; Lomas, K.J. Determinants of High Electrical Energy Demand in UK Homes: Socio-Economic and Dwelling Characteristics. Energy Build. 2015, 101, 24–34. [Google Scholar] [CrossRef]
  5. Qatar General Secretariat for Development Planning. Qatar National Development Strategy; Qatar Ministry of Statistics: Doha, Qatar, 2011.
  6. Kahramaa. Sustainability Report 2016; Doha, Qatar. 2016. Available online: https://km.qa/MediaCenter/Pages/Publications.aspx (accessed on 1 December 2018).
  7. Seydali, M.; Abad, S.; Ma, J.; Zhang, D.; Shabir Ahmadyar, A.; Marzooghi, H. Sensitivity of Hosting Capacity to Data Resolution and Uncertainty Modeling. In Proceedings of the 2018 Australasian Universities Power Engineering Conference (AUPEC), Auckland, New Zealand, 19–21 November 2018. [Google Scholar]
  8. Abubakar, I.; Khalid, S.N.; Mustafa, M.W.; Shareef, H.; Mustapha, M. Application of Load Monitoring in Appliances’ Energy Management—A Review. Renew. Sustain. Energy Rev. 2017, 67, 235–245. [Google Scholar] [CrossRef]
  9. Esa, N.F.; Abdullah, M.P.; Hassan, M.Y. A Review Disaggregation Method in Non-Intrusive Appliance Load Monitoring. Renew. Sustain. Energy Rev. 2016, 66, 163–173. [Google Scholar] [CrossRef]
  10. Kolter, J.Z.; Johnson, M.J. REDD: A public data set for energy disaggregation research. In Proceedings of the Workshop on Data Mining Applications in Sustainability (SIGKDD), San Diego, CA, USA, 21–24 August 2011; Volume 25, pp. 59–62. [Google Scholar]
  11. Chen, V.L.; Delmas, M.A.; Kaiser, W.J.; Locke, S.L. What can we learn from high-frequency appliance-level energy metering? Results from a field experiment. Energy Policy 2015, 77, 164–175. [Google Scholar] [CrossRef] [Green Version]
  12. Fischer, D.; Härtl, A.; Wille-Haussmann, B. Model for Electric Load Profiles with High Time Resolution for German Households. Energy Build. 2015, 92, 170–179. [Google Scholar] [CrossRef]
  13. Godoy-Shimizu, D.; Palmer, J.; Terry, N. What Can We Learn from the Household Electricity Survey? Buildings 2014, 4, 737–761. [Google Scholar] [CrossRef]
  14. Saldanha, N.; Beausoleil-Morrison, I. Measured End-Use Electric Load Profiles for 12 Canadian Houses at High Temporal Resolution. Energy Build. 2012, 49, 519–530. [Google Scholar] [CrossRef]
  15. Lee, S.; Whaley, D.; Saman, W. Electricity Demand Profile of Australian Low Energy Houses. Energy Procedia 2014, 62, 91–100. [Google Scholar] [CrossRef] [Green Version]
  16. Cetin, K.S.; Tabares-Velasco, P.C.; Novoselac, A. Appliance Daily Energy Use in New Residential Buildings: Use Profiles and Variation in Time-of-Use. Energy Build. 2014, 84, 716–726. [Google Scholar] [CrossRef]
  17. Pratt, R.G.; Conner, C.C.; Cooke, B.A.; Richman, E.E. Metered End-Use Consumption and Load Shapes from the ELCAP Residential Sample of Existing Homes in the Pacific Northwest. Energy Build. 1993, 19, 179–193. [Google Scholar] [CrossRef]
  18. Bayram, I.S.; Ustun, T.S. A Survey on behind the Meter Energy Management Systems in Smart Grid. Renew. Sustain. Energy Rev. 2017, 72, 1208–1232. [Google Scholar] [CrossRef]
  19. AlFaris, F.; Juaidi, A.; Manzano-Agugliaro, F. Energy Retrofit Strategies for Housing Sector in the Arid Climate. Energy Build. 2016, 131, 158–171. [Google Scholar] [CrossRef]
  20. Giusti, L.; Almoosawi, M. Impact of Building Characteristics and Occupants’ Behaviour on the Electricity Consumption of Households in Abu Dhabi (UAE). Energy Build. 2017, 151, 534–547. [Google Scholar] [CrossRef]
  21. Alaidroos, A.; Krarti, M. Optimal Design of Residential Building Envelope Systems in the Kingdom of Saudi Arabia. Energy Build. 2015, 86, 104–117. [Google Scholar] [CrossRef]
  22. Vine, E.L. International DSM and DSM Program Evaluation: An Indeep Assessment. Energy 1996, 21, 983–996. [Google Scholar] [CrossRef]
  23. Al-Iriani, M.A. Climate-Related Electricity Demand-Side Management in Oil-Exporting Countries—The Case of the United Arab Emirates. Energy Policy 2005, 33, 2350–2360. [Google Scholar] [CrossRef]
  24. Dulleck, U.; Kaufmann, S. Do Customer Information Programs Reduce Household Electricity Demand?—The Irish Program. Energy Policy 2004, 32, 1025–1032. [Google Scholar] [CrossRef]
  25. Bayram, I.Ş.; Alrawi, O.; Al-Naimi, H.; Koç, M. Direct Load Control of Air Conditioners in Qatar: An Empirical Study. In Proceedings of the 2017 IEEE 6th International Conference on Renewable Energy Research and Applications (ICRERA), San Diego, CA, USA, 5–8 November 2017; pp. 1007–1012. [Google Scholar] [CrossRef]
  26. Alasseri, R.; Tripathi, A.; Joji Rao, T.; Sreekanth, K.J. A Review on Implementation Strategies for Demand Side Management (DSM) in Kuwait through Incentive-Based Demand Response Programs. Renew. Sustain. Energy Rev. 2017, 77, 617–635. [Google Scholar] [CrossRef]
  27. Peninsula, T. Available online: https://www.thepeninsulaqatar.com/article/19/04/2018/Tarsheed-initiative-helps-save-QR5bn (accessed on 10 December 2018).
  28. Karimi, M.; Mokhlis, H.; Naidu, K.; Uddin, S.; Bakar, A.H.A. Photovoltaic Penetration Issues and Impacts in Distribution Network—A Review. Renew. Sustain. Energy Rev. 2016, 53, 594–605. [Google Scholar] [CrossRef]
  29. Martín-Pomares, L.; Martínez, D.; Polo, J.; Perez-Astudillo, D.; Bachour, D.; Sanfilippo, A. Analysis of the Long-Term Solar Potential for Electricity Generation in Qatar. Renew. Sustain. Energy Rev. 2017, 73, 1231–1246. [Google Scholar] [CrossRef]
  30. Mohandes, N.; Sanfilippo, A.; Al Fakhri, M. Modeling Residential Adoption of Solar Energy in the Arabian Gulf Region. Renew. Energy 2019, 131, 381–389. [Google Scholar] [CrossRef]
  31. Barkhordar, Z.A.; Fakouriyan, S.; Sheykhha, S. The Role of Energy Subsidy Reform in Energy Efficiency Enhancement: Lessons Learnt and Future Potential for Iranian Industries. J. Clean. Prod. 2018, 197, 542–550. [Google Scholar] [CrossRef]
  32. Ministry of Development Planning and Statistics. Population and Social Statistics; Ministry of Development Planning and Statistics: Doha, Qatar, 2015.
  33. De Bel-Air, F. Demography, Migration, and Labour Market in Qatar; Gulf Labour Markets and Migration (GLMN): Florence, Italy, 2014. [Google Scholar]
  34. Education in Qatar Statistical Profile 2016; Qatar Ministry of Development and Statistics: Doha, Qatar, 2016.
  35. Smappee. Available online: https://www.smappee.com/ (accessed on 1 January 2017).
  36. Luthander, R.; Widén, J.; Nilsson, D.; Palm, J. Photovoltaic self-consumption in buildings: A review. Appl. Energy 2015, 142, 80–94. [Google Scholar] [CrossRef] [Green Version]
  37. Hoevenaars, E.J.; Crawford, C.A. Implications of temporal resolution for modeling renewables-based power systems. Renew. Energy 2012, 41, 285–293. [Google Scholar] [CrossRef]
  38. Cao, S.; Sirén, K. Impact of simulation time-resolution on the matching of PV production and household electric demand. Appl. Energy 2014, 128, 192–208. [Google Scholar] [CrossRef]
  39. Bayram, I.S.; Saffouri, F.; Koc, M. Generation, analysis, and applications of high resolution electricity load profiles in Qatar. J. Clean. Prod. 2018, 183, 527–543. [Google Scholar] [CrossRef] [Green Version]
  40. Climate & Weather Averages in Doha, Qatar. Available online: https://www.timeanddate.com/weather/qatar/doha/climate (accessed on 5 December 2018).
  41. U.S. Energy Information Administration. Available online: https://www.eia.gov/tools/faqs/faq.php?id=97&t=3 (accessed on 3 June 2018).
  42. Ausgrid. Available online: https://www.ausgrid.com.au/Industry/Innovation-and-research/Data-to-share/Average-electricity-use (accessed on 3 June 2018).
  43. Siraj Solar Energy. Available online: https://www.qewc.com/qewc/en/subsidiaries/siraj-solar-energy/ (accessed on 3 June 2018).
  44. Javed, W.; Guo, B.; Figgis, B. Modeling of photovoltaic soiling loss as a function of environmental variables. Sol. Energy 2017, 157, 397–407. [Google Scholar] [CrossRef]
  45. Foundation, Q. Solar Energy Put to the Test. Available online: https://www.qf.org.qa/content/the-foundation/issue-49/solar-energy-put-to-the-test (accessed on 3 June 2018).
  46. Inage, S. Modelling Load Shifting Using Electric Vehicles in a Smart Grid Environment; The International Energy Agency (IEA): Paris, France, 2010. [Google Scholar] [CrossRef]
  47. Rastler, D.M. Electricity Energy Storage Technology Options: A White Paper Primer on Applications, Costs and Benefits; Electric Power Research Institute: Palo Alto, CA, USA, 2010. [Google Scholar]
  48. Nyholm, E.; Goop, J.; Odenberger, M.; Johnsson, F. Solar photovoltaic-battery systems in Swedish households–Self-consumption and self-sufficiency. Appl. Energy 2016, 183, 148–159. [Google Scholar] [CrossRef]
  49. Linssen, J.; Stenzel, P.; Fleer, J. Techno-economic analysis of photovoltaic battery systems and the influence of different consumer load profiles. Appl. Energy 2017, 185, 2019–2025. [Google Scholar] [CrossRef]
  50. Khalilpour, K.R.; Vassallo, A. Technoeconomic parametric analysis of PV-battery systems. Renew. Energy 2016, 97, 757–768. [Google Scholar] [CrossRef]
  51. Quoilin, S.; Kavvadias, K.; Mercier, A.; Pappone, I.; Zucker, A. Quantifying Self-Consumption Linked to Solar Home Battery Systems: Statistical Analysis and Economic Assessment. Appl. Energy 2016, 182, 58–67. [Google Scholar] [CrossRef]
  52. Hosseini, S.S.; Agbossou, K.; Kelouwani, S.; Cardenas, A. Non-intrusive load monitoring through home energy management systems: A comprehensive review. Renew. Sustain. Energy Rev. 2017, 79, 1266–1274. [Google Scholar] [CrossRef]
Figure 1. Sectorial percentages of power consumption for the year 2016 in Qatar [3].
Energies 12 03876 g001
Figure 2. Power monitoring system structure.
Energies 12 03876 g002
Figure 3. Investigation of time-resolution on excess energy. Five-min and 1-hour data sets are used for H1 using January 1 demand and photovoltaic (PV)-20 data.
Energies 12 03876 g003
Figure 4. Daily electricity load profiles of Houses 1, 2, 6, 7 & 8 (July 2017 and August 2018).
Energies 12 03876 g004aEnergies 12 03876 g004bEnergies 12 03876 g004c
Figure 5. Seasonal temperatures in Doha, Qatar, from July 2017 to June 2018 [40].
Energies 12 03876 g005
Figure 6. Daily air conditioning (AC) versus non-AC load energy consumption (April 2018 to April 2019).
Energies 12 03876 g006
Figure 7. Average daily energy consumption per month for houses H1–H10.
Energies 12 03876 g007
Figure 8. Average daily energy consumption per occupant per month for houses H1–H10.
Energies 12 03876 g008
Figure 9. Average daily energy consumption per unit area per month for houses H1–H10.
Energies 12 03876 g009
Figure 10. Comparison of monthly mean per capita monthly energy consumption for 10 selected houses in Qatar and Abu Dhabi (bars indicate standard deviation).
Energies 12 03876 g010
Figure 11. Monthly solar irradiance in Doha 2016.
Energies 12 03876 g011
Figure 12. H2 ((a) and (b)) and H7 ((c) and (d)) power demand against 5, 10, 15, and 20 panels of PV power generation for the months of January and July 2018.
Energies 12 03876 g012aEnergies 12 03876 g012b
Figure 13. Total load power versus PV power production used for self-consumption ratio calculation.
Energies 12 03876 g013
Figure 14. Summary of self-consumption (%) values for houses H1–H10 (July 2017 to August 2018) for five different PV sizes.
Energies 12 03876 g014
Table 1. Publicly available datasets of household energy consumption [10].
DatasetNumber of HousesMeasuring Duration per HouseSampling FrequencySite
ApplianceAggregate
REDD53–19 days3 s1 s and 15 kHzUSA
BLUED18 daysEvent label12 kHzUSA
GreenD81 year1 s1 sItaly
ECO68 months1 s1 sDE
DRED16 months1 s1 sUSA
UMass Smart33 months1 s1 sUK
Pecan Street Sample107 days1 min1 minIND
HES-12612 months2–10 min2–10 minUK
AMPDs11 year1 min1 minAT/IT
iAWE173 days1–6 s1 sIND
UK-DALE43–17 months6 s1–6 s and 16 kHzCH
COMBED818 months30 s30 sNL
BERDSNA1 year20 s20 sUSA
Table 2. A selection of studies that focus on load profiling and factors that influence the load profile.
AuthorLocationNumber of HousesPurpose
N. Saldanha (2012) [14]Ottawa, Canada12Socio-economic and seasonal factors impact on load profiles
S. Lee (2014) [15]Lochiel Park, Australia60Socio-economic and seasonal factors impact on load profiles
D. Fischer (2015) [12]Germany430Socio-economic and load classification factors impact on load profiles
K.S. Cetin (2014) [16]Austin, TX40Load classification
Chen (2015)Los Angeles, CA124Load classification in university apartments
D. Godoy-Shimizu (2014) [13]UK250Socio-economic and load classification factors impact on load profiles
Table 3. Qatar households and individuals segregated by accommodation type and a number of occupants [32].
Households and Individuals by Type of Housing Unit, and Number of Household Members
Number of Households and MembersCensusStudy Sample (After Standardization)
VillaApartmentVillaApartment
1–3Households32,34953,26213
Individuals64,615103,32926
4–6Households29,85133,33011
Individuals145,223156,198116
7–9Households15,885643410
Individuals125,61149,41970
10+Households18,030285510
Individuals249,08737,210130
TotalHouseholds96,11595,88164
Individuals584,536346,1563312
Table 4. Socioeconomic details of the electricity profiling study participants (H: House).
MetricsH1H2H3H4H5H6H7H8H9H10
Size (m2)1502200–50420101–150250300+300+201–250201–250
TypeApart.VillaApart.VillaApart.Apart.VillaVillaVillaVilla
Building Age (years)11–1511–1511–1511–1511–150–55–1015+5–1011–15
Education Level (Decision Maker)Ph.D.CollegePh.D.Ph.D.Ph.D.Ph.D.High-schoolCollegeCollegeMasters
# of Occupants32176296135
# Occupants under 18 years-old1NoneNone34None3None5None
Annual Household Income (USD)101–200k101–200k0–100k200k+101–200k200k+0–100k101–200k0–s100k101–200k
Average Winter Bill (USD)0–200NoneNoneNoneNoneNoneNone0–2000–200201–1000
Average Summer Bill (USD)201–1000NoneNoneNoneNoneNoneNone0–200201–1000201–1000
Average Bill for Rest of the Year (USD)0–200NoneNoneNoneNoneNoneNone0–2000–200201–1000
Cooling TypeCentralCentralSplit UnitCentralSplit UnitDistrict CoolingSplit UnitSplit UnitSplit UnitSplit Unit
Table 5. Daily electricity consumption per capita (kWh/ca) statistics.
HouseMinimum MonthMaximum Month
MonthMeanMaxMinMonthMeanMaxMin
H1Jan8.1111.735.33Aug40.8548.0428.85
H2Dec18.3440.6613.03Jun104.97114.6397.48
H3Jan5.099.502.17Aug78.51150.5340.18
H4Jan32.1935.3329.45Jul60.8764.4756.36
H5Dec5.327.354.01Jun24.4332.311.20 1
H6Jan17.7124.1814.41Jun34.7737.6531.69
H7Nov2.565.861.63Jul7.6110.255.72
H8Jan7.459.075.69Jun34.5736.9730.89
H9Mar2.904.312.48Aug14.1415.8912.77
H10Jan8.3913.555.99Aug50.4857.3747.15
1 Residents on leave.
Table 6. Self-sufficiency: percentage (%) of energy offset by PV consumption.
H#H1H2H3H4H5H6H7H8H9H10
No. Panels20201020202010202020
Jan39254311NA4428304032
Feb4344NA13364835364330
Mar3828NA11364336313930
Apr3825401239NA39263428
May3821311030NA3522NA27
Jun3517NA924432817NA15
Jul2916258444124161914
Aug2416208264124151713
Sep3316448NA373917NA14
Oct381924933372923NA18
Nov3824349313531182522
Dec38324410333930313829
Table 7. Maximum energy storage size requirement for selected houses in Ah.
House #Excess PV Energy (Ah)Max Storage Size (Ah)Operation Duration Within a Year
H134241076%
H322627267%
H537845466%
H6274329100%
H79711683%
H930436577%

