Abstract
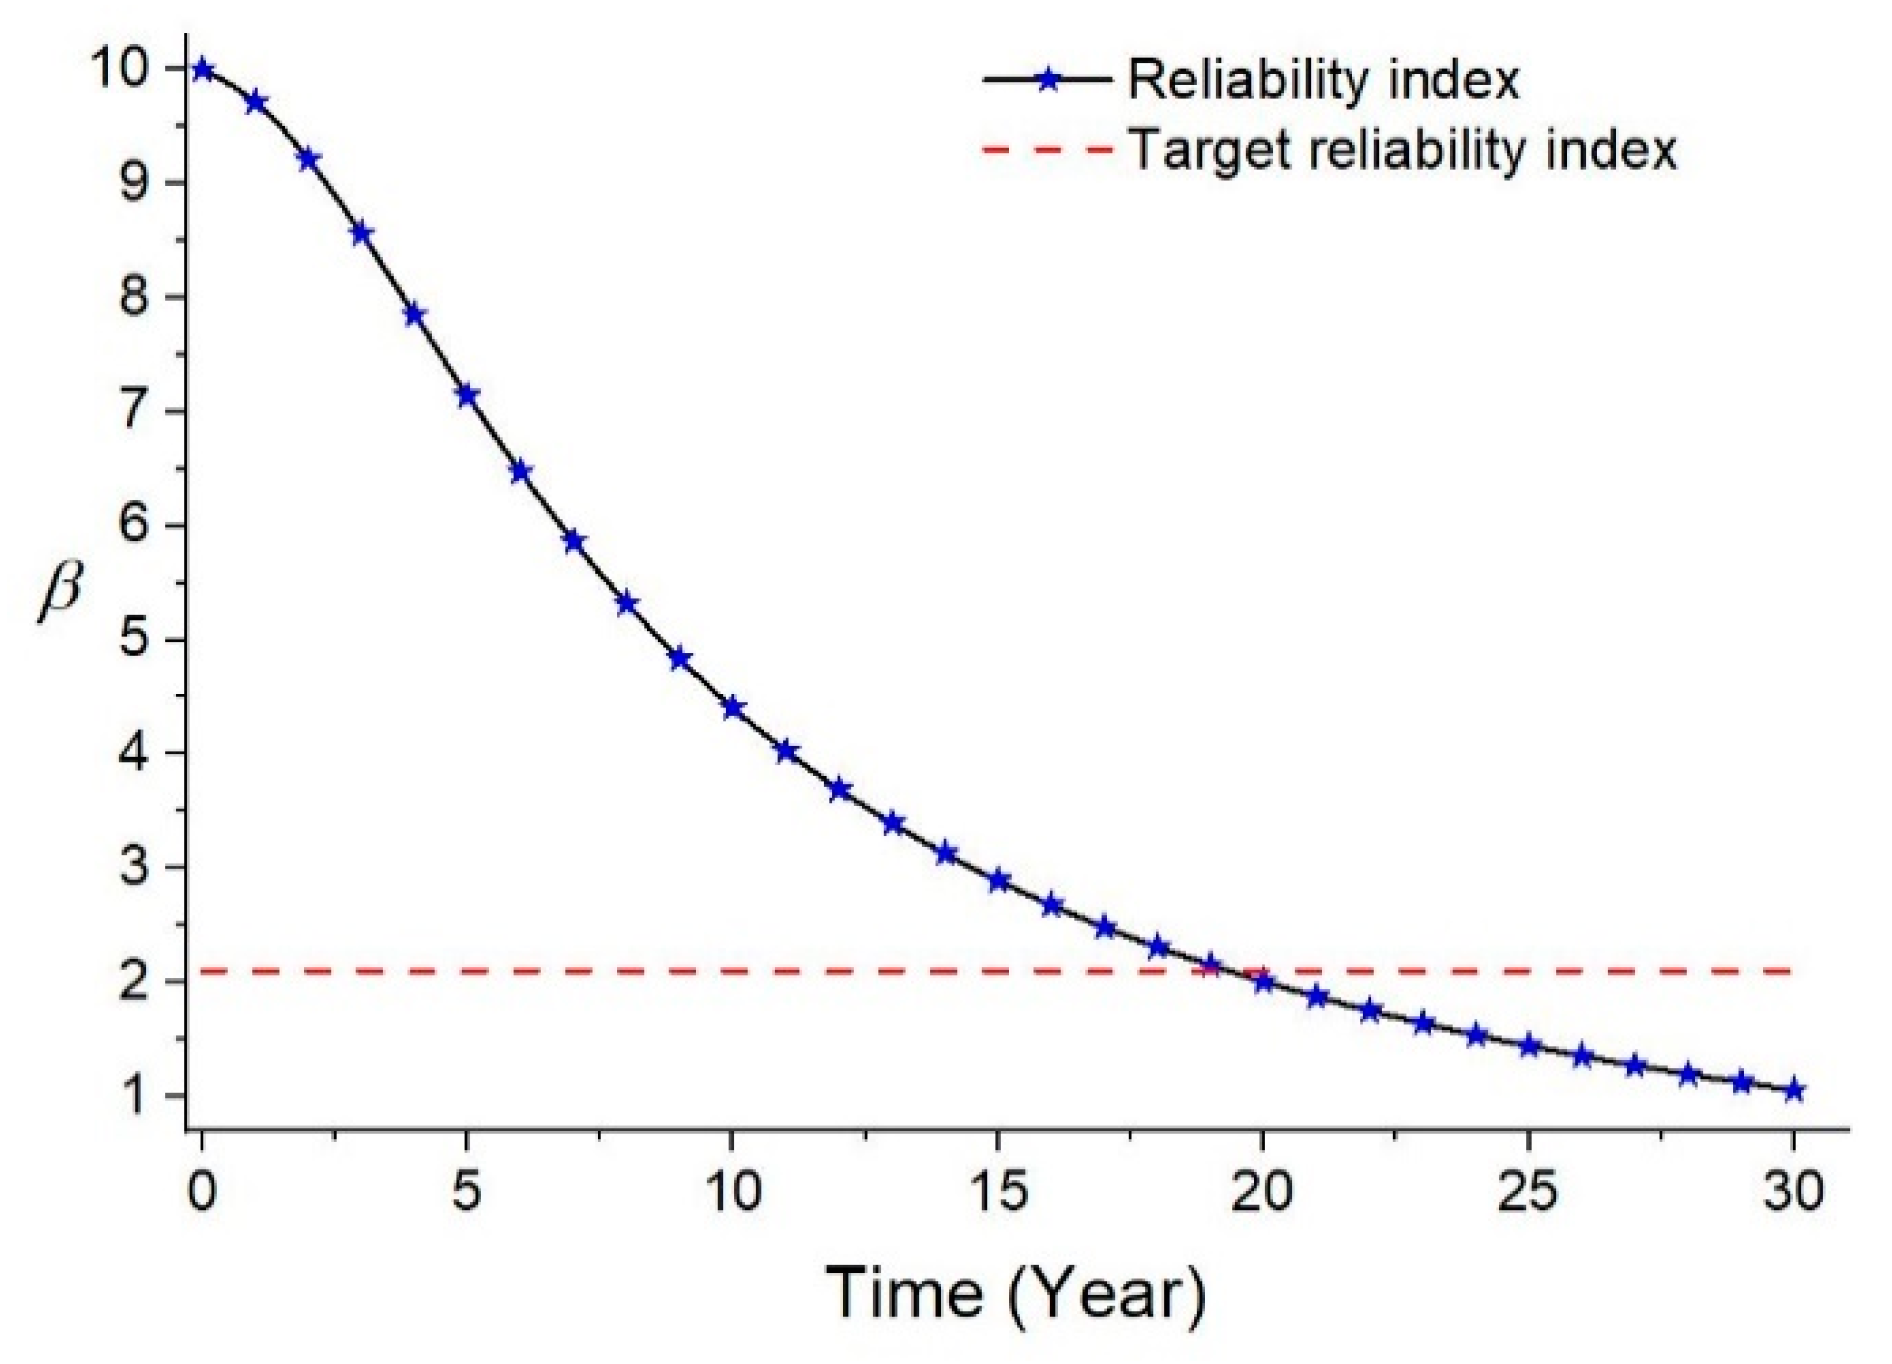
The main objective of the current paper is to determine fatigue critical details of wave-energy converters (WECs) and to evaluate their reliability. For this purpose, a new model of a water-hydraulic drive WEC is designed based on the IPS (company Interproject Service) buoy working principle, and the hydrodynamic frequency domain analysis method is carried out accordingly. A reliability assessment method, which combines the stress-number (SN) curves approach and linear damage cumulative theory, has been developed specifically for the proposed WEC. In order to obtain the stochastic wave load spectrum, 22 years of wave data of the intended deployment site (South China Sea), covering the span of 1988–2009, were analyzed, discussed and processed. A finite element analysis model is also established to calculate the maximum Von Mises stress of the fatigue critical component. The reliability indices and configuration parameters of the water hydraulic-drive WEC are obtained by applying first order reliability method, considering the uncertainty of the model parameters and the fatigue limit state. Optimization of configuration parameters is also developed based on the reliability method for the sake of approaching the expected service life. The results show that the fatigue life of the water turbine can reach the design service life of 20 years as the configuration parameters meet the specific condition. The cumulative reliability index and annual reliability index are recommended as 2.1 and 3.5, respectively.
1. Introduction
With the upgrading of energy consumption globally and rising industrialization, renewable energy development has become one of the hottest issues in the world [1]. Many countries and regions have drawn up sustainable development plans and have committed to the development of marine renewable energy resources [2]. Wave energy is regarded as having the greatest potential for development [3,4], and the technologies harvesting energy from waves have received more consideration in the last decade [5]. Ocean wave energy is clean and free from pollution, and the world’s largest estimated reserves reach 80,000 TW h/year [6]. Wave energy has the characteristics of good predictability and high energy density, which makes wave energy utilization favored on coastal regions.
Wave energy is produced by wind action and has only a small energy loss even if it travels thousands of kilometers. The magnitude of wave energy is often represented in terms of power per unit wave-front (kW/m), and the main parameters representing wave-energy potential are the significant wave height and average energy period [7]. The evaluation of wave-energy resources is the premise for the exploitation and utilization and the design of relevant devices [8]. Research on wave climate characteristics had been carried out before for other objective and many scholars have conducted in-depth studies on wave-energy resource assessment. Chen et al. evaluated the near shore wind and wave characteristics based on experimental data for coastal area of the South China Sea in Shenzhen [9]. Omar et al. presented a theoretical prediction of wave-energy resources in the South China Sea using a satellite altimeter [10]. Zheng et al. [11] and Wang et al. [12] simulated the distribution characteristics of wave-energy resources in the South China Sea using the third-generation wave model WAVEWATCH-III (WW3).
Wave-energy converters (WECs) are complex mechanical devices that absorb ocean waves’ energy and have ability to produce electricity. According to statistics, there are about 150 projects that have been carried out at full scale, which is comparable to the offshore wind industry [13]. When classified through the working principle of power take-off (PTO) system, WECs can be categorized into four main groups: hydraulic drive WECs, air turbine-drive WECs, water hydraulic-drive WECs, and direct drive WECs [14,15]. Among them, the water hydraulic-drive WECs, equipped with a water turbine as PTO element, directly use seawater as a working fluid, and are widely used in overtopping devices containing a low-head (generally 3–4 m at a global size) turbine, e.g., Wave Dragon [16], and oscillating-body devices containing a high-head (usually tens of meters or even hundreds of meters) turbine, e.g., AquaBuOY [17]. These water turbines can achieve a peak efficiency of nearly 0.9, which is conducive to the use of speed-regulating generators [8].
Fatigue failures, which are usually caused by corrosion and defects of critical components, are a common failure mode of offshore structures [18]. The magnitude of environmental load and the material properties are determined in a mature design approach. However, marine installations in particular require offshore assembly, which are more sensitive to uncertainties due to complex designs [19]. The uncertainties related to configuration variables should be considered by establishing a stochastic model. A stochastic model using limit-state equations combined with a SN (stress-number) curves method and PM (Palmgren-Miner) rules considering linear damage accumulation is widely applied in the fatigue design of marine structures [18,20,21]. The probabilistic method based on reliability is applied to reflect the system response to the input parameters change and improve the reliability level of the devices [22].
Both experiments and FEA (finite-element analysis) are two important methods for modeling the structure of a wave-energy converter. The approach of experiments can ensure the accuracy and avoid the uncertainty in the modeling process by using the sensors for direct measurement. However, the FEA method performs the system behaviors through computer simulation and supports a flexible combination of multiple scenarios. Taking full advantage of the FEA method with computer technology can save a lot of capital and time costs on the basis of ensuring high flexibility and fidelity [23]. In the present work, the FEA method is used to establish the structural model of the fatigue critical component of a WEC.
Generally, the reliability analysis methods can be broadly categorized into analytical and stochastic methods. The first kind of reliability analysis method mainly consists of the first-order reliability method (FORM) [24] and second-order reliability method (SORM) [25]. The maximum likelihood probability value of the limit state function is calculated by the FORM, which has become the most common approach of reliability assessment due to both computational efficiency and accuracy. SORM, considering the second-order Taylor series, has higher precision in non-linear systems, while the both of them have almost identical results in other cases. The second method of reliability analysis mainly refers to MCS (Monte Carlo simulation) [26], which can reduce uncertainty in the results due to the benefits of direct simulations. However, MCS is constrained in assessing the reliability of highly complex structures. Considering that the study of WECs in the present paper is still in the preliminary design stage, FORM was eventually selected as the most suitable approach to develop.
The scope of this paper is to assess appropriate reliability indices for fatigue critical component that go into failure earlier. A new model of water hydraulic drive WEC is designed based on the IPS buoy working principle [27,28], and the hydrodynamic frequency domain analysis method is carried out accordingly. The purpose of this work is to perform a reliability assessment method for a water hydraulic-drive WEC and calibrate a preliminary scheme and system reliability index.
The paper is organized in six sections: Section 1 introduces the background, methods and research purpose of the problem. The structural design and hydrodynamic analysis of the water hydraulic drive WEC are illustrated in Section 2. Section 3 presents the reliability model of fatigue failure. Wave characteristics of the target sea area and fatigue-critical details of the present WEC are carried out in Section 4. The results are developed and discussed in Section 5, followed by conclusions in Section 6.
2. Theoretical Analysis of the Water Hydraulic Drive Wave-Energy Converter (WEC)
2.1. Structural Design
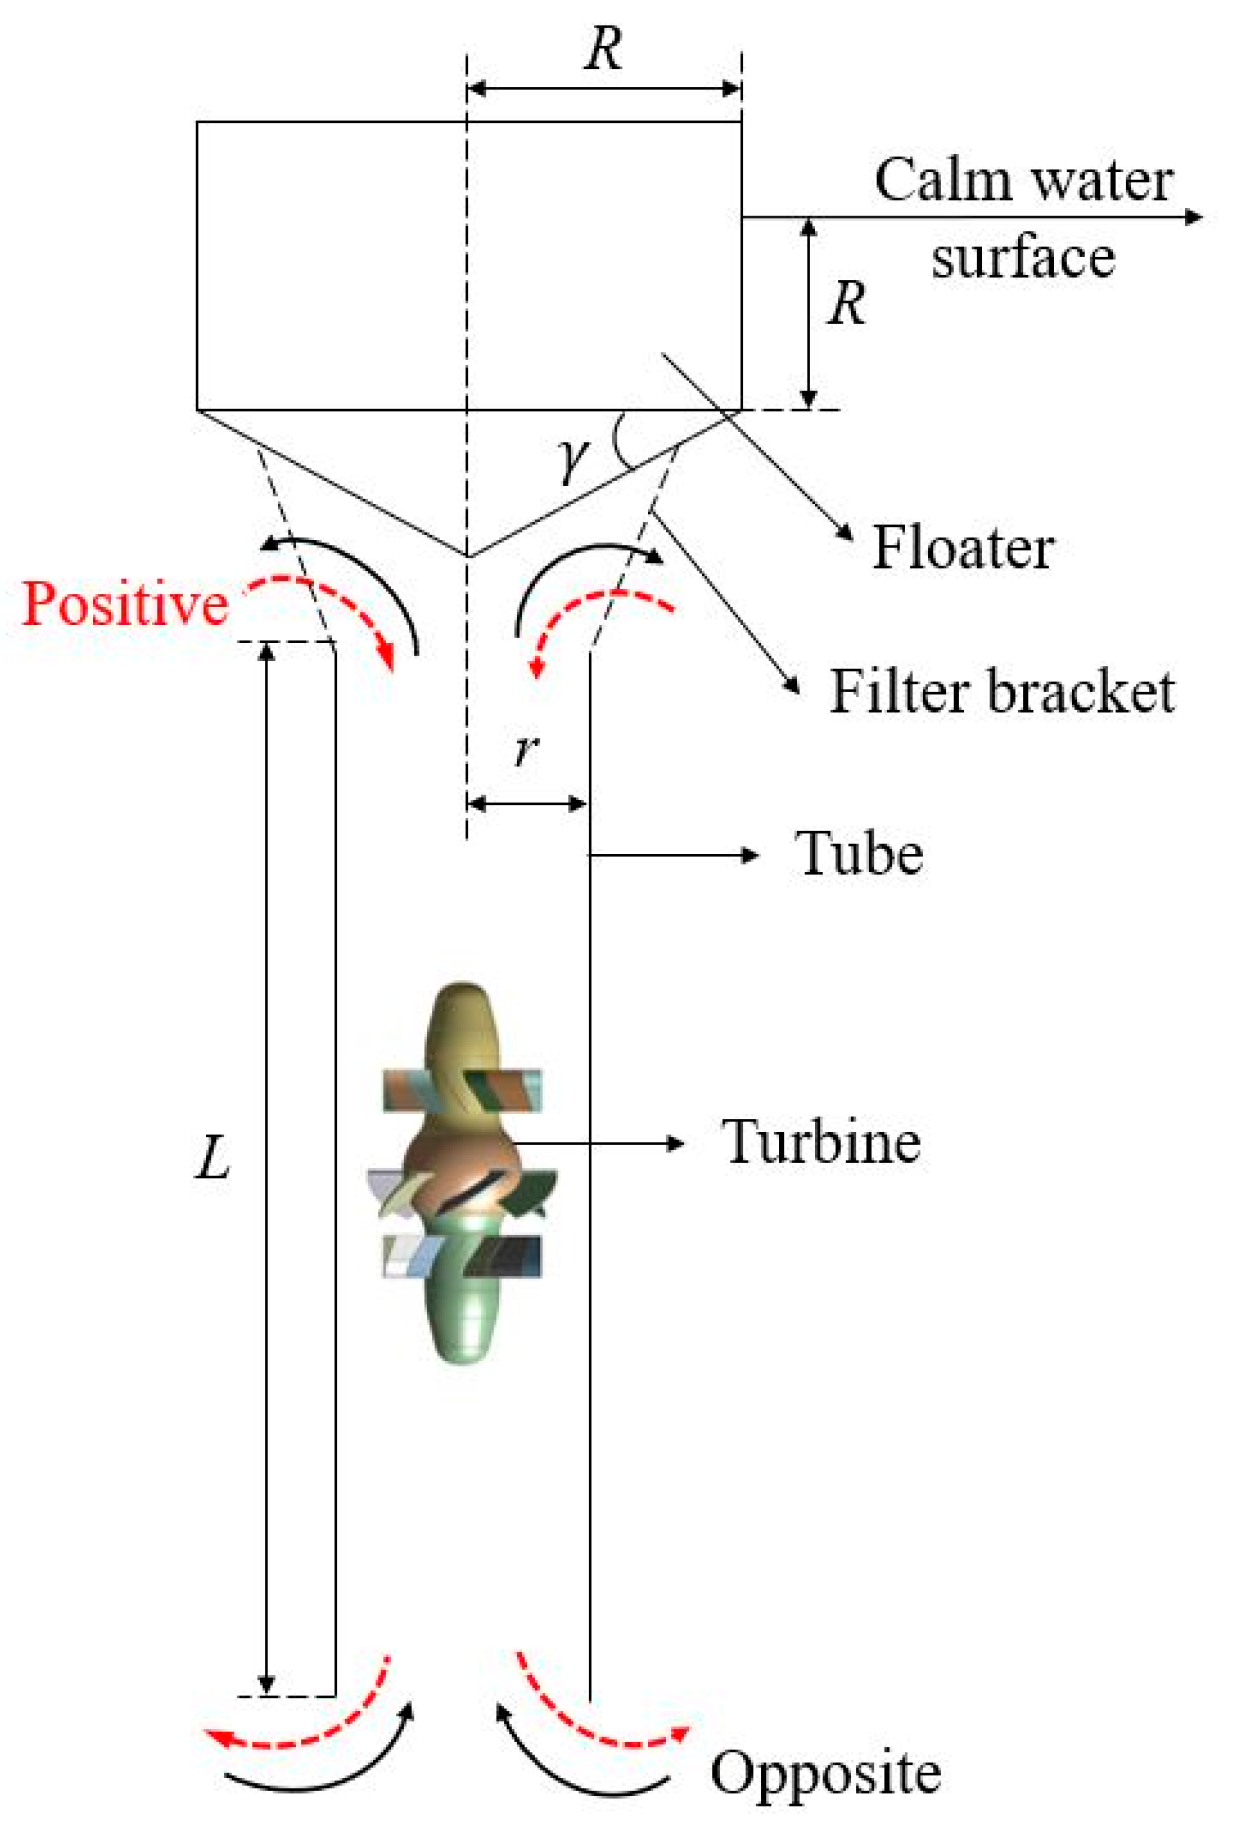
The proposed water hydraulic drive WEC mainly includes a floater and a vertical tube suspended in sea water, which is similar to the IPS buoy [29], oscillating up and down under the action of waves. The tube is rigidly connected to the floater through the filter bracket which is formed by welding the support structure arranged in intervals. An axial flow turbine, as a PTO element, is located in the middle of the tube and moves with the floater at the same amplitude. When the floater oscillates in heave, the water contained inside the tube drives the turbine under the action of inertia force. The energy is obtained from ocean waves when the water in the tube moves relative to the floater. The basic working principle and structural parameters are represented in Figure 1.
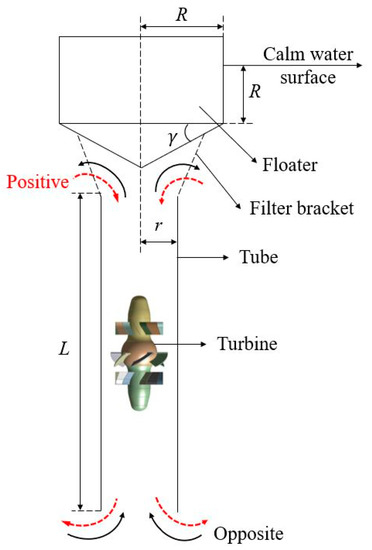
Figure 1.
Structural parameters and working principle of the wave-energy converter (WEC).
The floater consists of a cylindrical buoy and an inverted cone, both of radius . The submerged depth of the cylindrical part equal to radius below the surface of calm water. The base angle of the conical part of the floater equal to . The tube, with radius and length , is submerged vertically in seawater of a certain depth (relatively large) and open at both ends. Considering the barrier of the tube wall, the water column contained in the tube can be considered independent of the direct action of wave load.
The water column contained in the tube will be resisted by external seawater when it flows out or into the tube, which can be equivalent to the added mass of the water column. The added mass of the water in the tube, assuming the radius is and the thickness of the two ends of the wall is negligible, is [30]. Here, is an approximated distance of the water column that can be considered as independent of wave frequency .
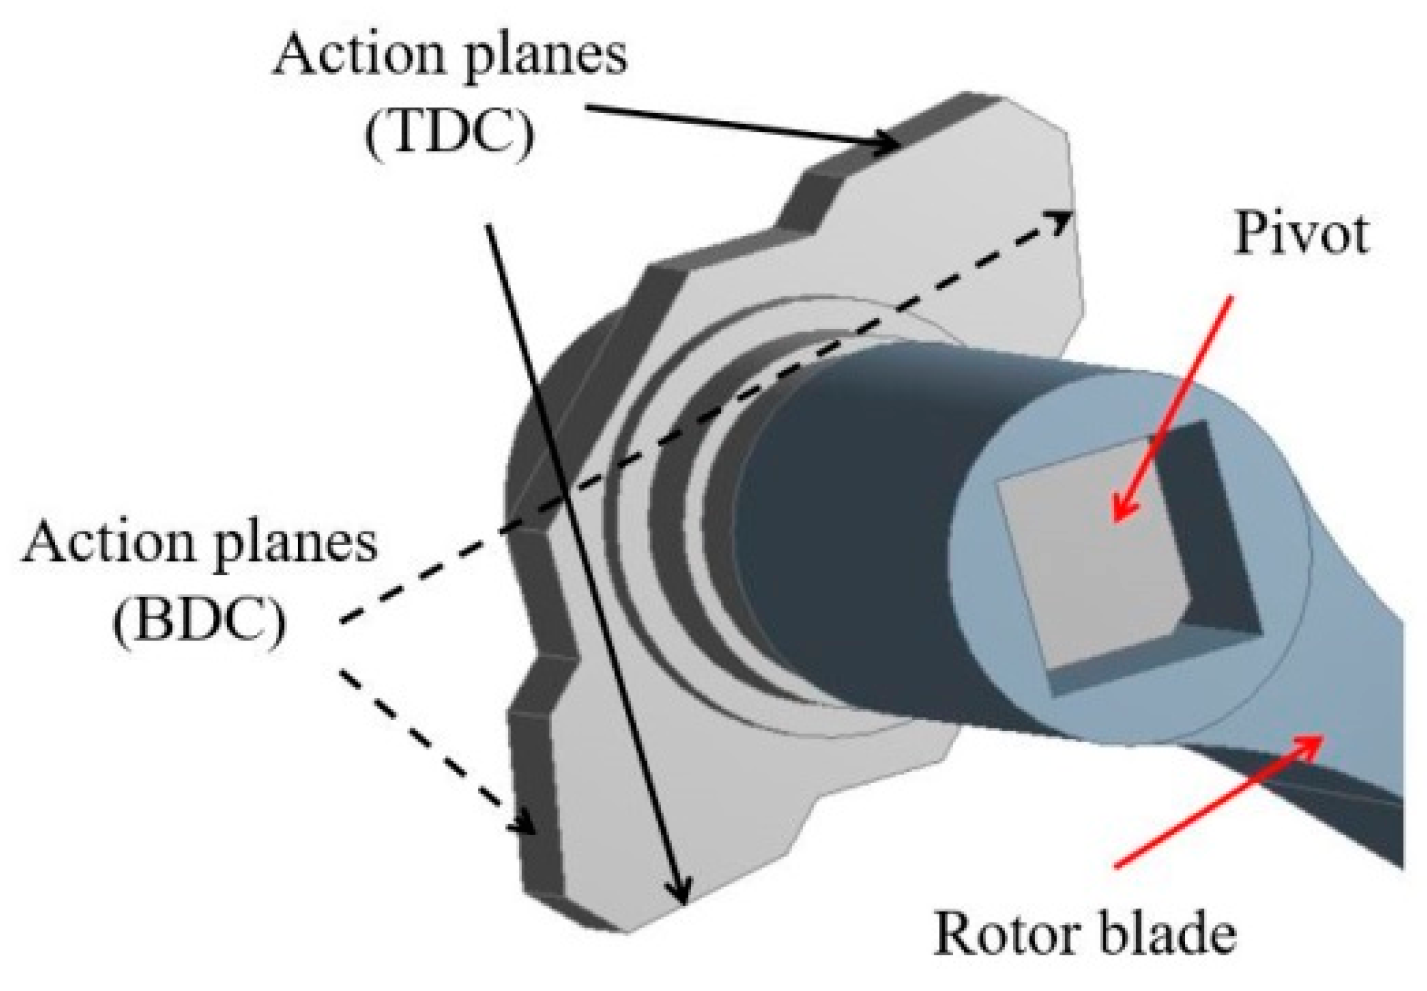
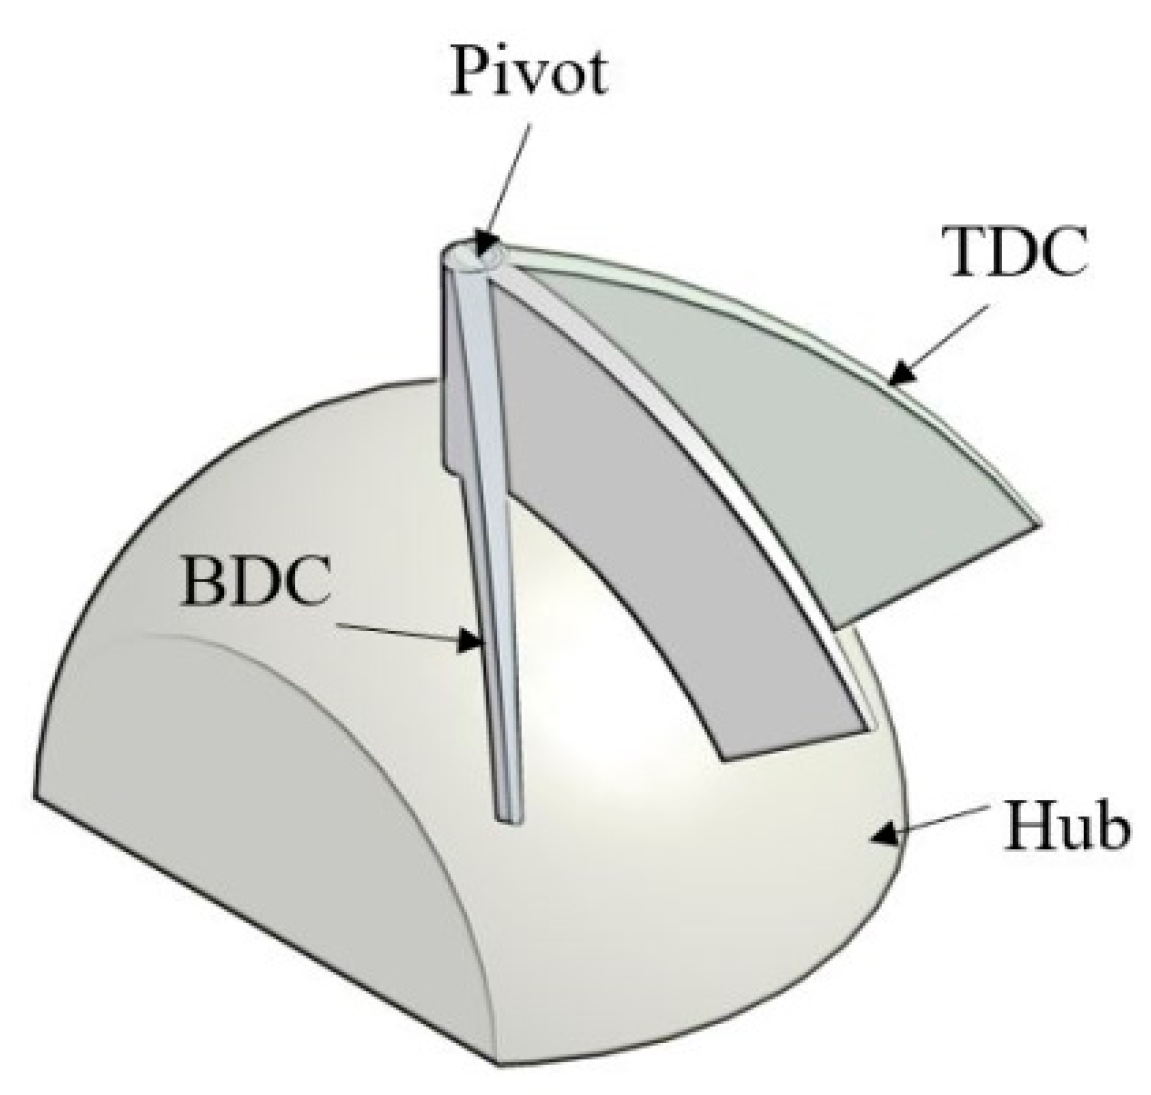
The turbine, which is capable of self-rectifying, has a rotor with fan blades and the rotor blades are installed in the hub through a pivot mounted near the blade root; hence, they are able to swing back and forth within two set angles, which are restricted by pre-installed mechanical stops. Both action planes of the mechanical stops located in the rotor hub come into contact with the inner wall of the hub when the rotor blades reach the limit position (see Figure 2). The oscillation range of the rotor blade is from the top dead center (TDC) to the bottom dead center (BDC) (see Figure 3). The rotor blades are mounted on a spherical hub to keep the hub clearance constant while the blade rotates. The outer casing is also spherical to ensure a stable tip clearance.
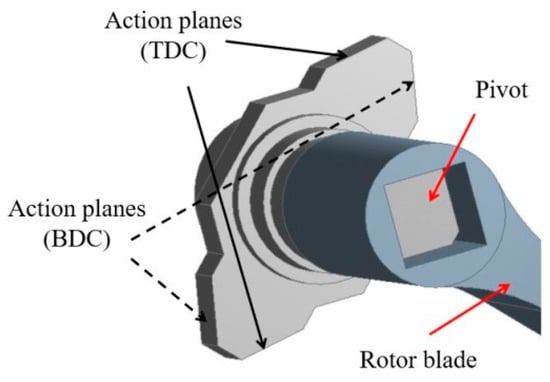
Figure 2.
Action planes of the mechanical stops.
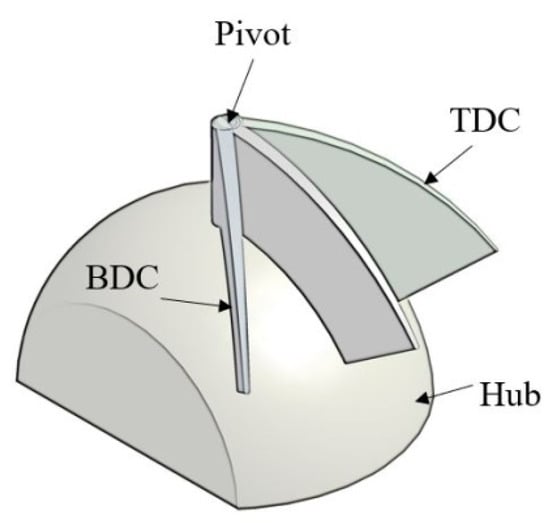
Figure 3.
Self-rectifying turbine with self-pitching controlled blades.
The guide vanes sets are installed on each sides of the hub. Alternately, the rotor blades swing in hydrodynamic action of water column in the tube, and automatically select the correct positions for efficient operation whenever the water changes direction. When the water is moving in a positive direction, the rotor blades rotate from TDC to BDC under the action of hydrodynamic force. On the contrary, the rotor blades rotate from BDC to TDC when the water moves in the opposite direction, as shown in Figure 1. Therefore, the rotation direction of the rotor will not change when the water direction varies.
In present work, a simplified computational model is adopted, which assumes that the motion of the floater is restricted to the direction of heave and the effect of radiation from both ends of the tube on the wave field is negligible. If the turbine part is replaced by a compact piston, the water column contained in the tube should move with the same amplitude as the floater. Therefore, the force driving the movement of the water column in the tube should be the same as that of the turbine according to the law of conservation of energy.
2.2. Hydrodynamic Analysis
The heaving motions of the floater (obviously includes the turbine and tube) is denoted by the coordinate, with in the equilibrium position (calm water surface) and increasing upwards. Let be the oscillation displacement of the water column in the tube relative to the floater. The energy conversion characteristics of the water turbine are mainly determined by the flow rate and rotation velocity, while the flow rate through the runner is related to the relative speed of the water column in the tube. In order to describe the performance of the turbine, a linearized PTO is assumed that can be represented as follows:
where the constant is the equivalent PTO damping and the time-dependent power obtained by the turbine is .
Since the wave scale and the scale of floater motions is small relative to the wave length, the hydrodynamic analysis could be performed by using the linearized water wave theory. In fact, hydrodynamic analysis under linear wave conditions has been studied in other similar WEC devices [29,31,32]. The motion equations of the floater under the condition that the harmonic waves frequency is can be obtained as follows:
where and are the mass and added mass of the floater, respectively; is the sum of mass and added mass of the water column in the tube, is radiation damping for the floater, is seawater density, 1025 ; is acceleration of gravity, 9.81 ; and S is the cross-sectional area of the cylinder tangent to the calm water surface, represents the action load of random waves, is the vertical load of the turbine that drive water column contained in the tube to oscillate relative to the tube.
The hydrodynamic coefficients and and the wave action load fe are relative to the shape of the floater and the wave frequency . Considering the assumption of the linearized water wave theory, the WECs can be seen as a normal sinusoidal wave load with frequency acting on a linear system [33]. The time-dependent periodic wave excitation force, the motion of the floater and the relative motion of the water column in the tube can be described similarly in Equation (6):
where , and are complex amplitudes and , is the incoming wave amplitude and is the coefficient of action load. The magnitude of can be involved radiation damping coefficient by the Haskind relation [34]:
By introducing the representation of complex amplitude, the following frequency-domain equations can be easily obtained:
For incoming wave frequency and the magnitude of action load , the absolute value of the complex amplitudes and can be yielded by solving the both of linearized frequency domain Equations (8) and (9):
Through simple analysis, it is not difficult to obtain that the displacement of floater and the relative displacement of the water in the tube are only related to wave frequency and PTO damping . Based on the assumption of a linear time-harmonic system, the time average power obtained from the water turbine (PTO), , is half of the maximum power, . The relationship between the two can be described as follows [35].
2.3. Torque Characteristics of the Power Take-Off (PTO)
Having obtained the maximum absorb power of PTO, the torque characteristics of the turbine blades can be further analyzed. As is known, the power obtained by the hydraulic turbine can be expressed by the mechanical torque and rotational angular velocity .
Since the linear speed of wave motion is relatively low, the hydraulic turbine shows the characteristics of low rotational velocity and high torque after absorbing wave energy when acceleration devices are not present. One of the main purposes of this paper is to study the reliability of the water hydraulic drive WEC, and the hydraulic turbine is the torque transmission component of the WEC. Therefore, it is necessary to consider the maximum stress characteristics of the critical parts (e.g., blades) of the hydraulic turbine. Material fatigue is the most common fault mode of a hydraulic turbine [36]. Duo to the continuous propagation of the cracks, the turbine parts will gradually fail under the action of alternating and cyclic load. For the purpose of developing the stress characteristics of fatigue-critical components, the maximum power that the turbine can absorb during each wave period should be considered when reliability analysis is carried out.
It is assumed that the water hydraulic drive WEC is installed with turbines, and each turbine carries blades which bear an alternating maximum stress during a wave period. The maximum torque, , sustained by a single blade at the wave frequency can be expressed as follows:
The position and magnitude of the maximum alternating stress of a single blade under each wave condition can be determined by finite element analysis. As the constant speed control strategy is relatively easy to implement in the robust operation of the turbine and the technology is relatively mature [37], the study in this paper is based on the assumption that the rotational velocity of the turbine remains constant. In order to achieve the specified service life, the maximum alternating stress in the critical parts can be adjusted through the number of turbines, , the number of blades, , as well as the PTO damping, .
3. Reliability Modelling of Fatigue Failure
The methods, of which the reliability model of fatigue failure can be performed, are the objective of this chapter. The SN-curves approach in combination with the PM-rules for considering sequence-independent linear damage accumulation, is an appropriate strategy when the condition monitoring is not present. SN curves indicate the relationship between the maximum cycles number and the failure stress of fatigue critical location. The SN-curves method has been widely used in ocean engineering design [38], which is more embodied in the reliability assessment of offshore wind turbines (OWTs) and WECs in recent years.
3.1. Fatigue Assessments
The parametric equations considering the bilinear SN curves can be expressed as follows [21]:
where represents the cycles number causing fatigue failure, is the corresponding stress amplitude, , , as well as are material parameters (structure intensity and crack growth) about the SN curves.
Considering the stress range can be performed based on action load (e.g., torque) through the FEA method:
where is the stress coefficient corresponding to the torque load of . In addition, the stress intervals of fatigue critical components, which are divided into groups, are assumed. The intervals number of failure stress falling to the group each year is denoted by . (, ) is obtained by analyzing the statistical wave data of previous years. The fatigue failure state calculation equation based on signs using P-M rules can be expressed as:
where and are the characteristic values of and ( is the first order origin moment of minus two standard deviation of ), is the cycles number each year of stress intervals under a wave condition with and , is the probability of a particular wave condition determined from and .
The fatigue design factor (FDF) value, which is used to evaluate the reliability of fatigue critical details, can be expressed as:
where is the fatigue life for fatigue design; is the service life of the offshore facility, typically 20 years for wave energy converter. The reliability of the device and its safety indices could be performed using the load value obtained by finite element analysis, and the limit state equation is written [20]:
where indicates the service time (), and are stochastic variables determined by the SN curve, represents the modelling uncertainty based on P-M rules, represents the stress range given and . The modelling uncertainty XM, which is approximately follows LN (logarithmic normal) distributed, is composed of wave condition uncertainty and action load uncertainty. The uncertainty of SCF (stress concentration factor), , which is considered to follow LN distributed, contains the geometry uncertainty and fatigue critical location uncertainty.
According to the particularity of working environment of wave energy converters, the representative SN curves of offshore installment with cathodic protection are considered [38]. Table 1 describes partial recommended parameters of stochastic variables applied to fatigue estimation. The values of the COV (coefficient of variation) are used to reduce the inaccuracy caused by the uncertainty of the stochastic variables.

Table 1.
Partial parameters of stochastic variables. (D: deterministic, CV: characteristic value, COV: coefficient of variation).
It is worth mentioning that the above stochastic variable models are taken into account the assumption that the annual variation of wave load can be ignored. However, developing appropriate control strategies can greatly reduce such variations.
3.2. Determination of Reliability Assessment Indices
Generally, material properties of the installment, wave loads as well as environmental features are uncertain. However, these factors are not considered in the traditional deterministic analysis. It is a feasible scheme to establish parameterized stochastic model by using a probability approach, which can consider the variables’ uncertainty. The typical uncertainty of system behavior mainly includes epistemic uncertainties and aleatory uncertainties. The first may be avoided by acquiring more real operational data and more insight into the mechanism. However, the second is inevitable due to the physical properties of the material [20].
The probability of failure, , can be expressed as the following equation:
Having acquired the probability expression of fatigue failure for critical components, the FORM can be applied to assess the corresponding reliability indices. FORM makes the stochastic parameters follow the standard normal distribution independent of each other by a special transformation approach. The basic principle of the approach is that stochastic variables can be approximately represented by their first- and second-order origin moments. The reliability indices could be evaluated by the moment of stochastic variables based on limit state equation. The probability function of failure can be expressed as:
where represents the function follows standard normal distribution; is the reliability index of the fatigue critical components, which is determined by the shortest failure distance in the state space. Mathematically, it can be expressed as [39]:
where and are mean value and standard deviation, respectively; The subscripts and represent the strength and load effect, i.e., the first term and all the following terms in Equation (2). The typical values of and the corresponding probability of failure for standard normal distribution, , as shown in Table 2.

Table 2.
Typical values of and .
For time-dependent failure probabilities, , the annual probability of failure , which is the probability of surviving reliably to time , can be developed as follows [40]:
where is equal to 1 year. Obviously, the annual reliability index .
3.3. Target Reliability Level for Fatigue Failure
The target reliability level needs to be defined when performing reliability-based analysis. Target reliability level is significantly determined by the impact of the failure mode and the implementation location, such as casualty risk and property damage. If the designed reliability indices are less than the target value, the fatigue critical components under consideration will not be able to withstand the applied alternating stress. The wave-energy converters have the characteristics of low environmental impact, no fire hazard and few casualties since they are operating unmanned. This indicates that the failure of WECs results mainly in economic influences. The acceptable annual reliability index (see Reference [20]) considering various cost of condition monitoring strategies on basis of the consequences for certain failure mode, as shown in Table 3. Because the WECs are operating unattended, the corresponding costs for condition monitoring are higher than for offshore oil and gas platforms. Hence, the acceptable target annual reliability values of 3.1–3.7 are appropriate, which is consistent with the target reliability evaluation range of OWTs.

Table 3.
Acceptable annual reliability index, .
In addition to considering the annual reliability of the failure mode, focusing on the cumulative reliability over the entire life cycle is also an important indicator. The magnitude of , typically from 2.3 to 3.1 for offshore structures, is largely determined by the implementation of condition monitoring based on the limit state equation [20]. The minimum values range of can be mapped from OWTs to WECs because of the similar failure consequences (almost no casualties and environmental pollution). Table 4 shows the cumulative and annual reliability indices for OWTs in different corrosive environments [21], which can be used as a useful reference for fatigue design of WECs.

Table 4.
Reliability indices in different corrosive environment.
The principles of fatigue design are determined by the extent of condition monitoring, the installation location of critical components and the consequences of fatigue failure. The floating WECs are far away from the land, and have been operated in the vast ocean for a long time. The fatigue critical components (e.g., turbine) are in an inaccessible area, in which is difficult to take measurements for condition monitoring during service. Therefore, the FDF values are recommended to be 3 according to Reference [41].
From what has been discussed above, the minimum accumulated reliability index of 2.4–3.1 and the minimum annual reliability index of 3.1–3.7 are appropriable for required values of fatigue design factor. These values can reduce the probability of failure and compensate the uncertainties of the device’s operation.
4. Wave Characteristics and Fatigue-Critical Details
In this section, the primary purpose is to acquire the characteristic period of the planned deployment location by analyzing the wave climate of the target sea area (South China Sea), so as to provide theoretical support for the selection of PTO damping of the water hydraulic-drive WEC. Secondly, a whole FEA model of turbine blade is developed using the ANSYS 19.0 software package to obtain the fatigue-critical location and the maximum stress amplitude under alternating loads.
4.1. Analysis of Wave Climate
Ocean waves are generally considered to consist of variety stochastic wave conditions, which includes a series of wave sequences with different frequencies as well as amplitudes. In addition, the spectral moments function could be utilized to determine significant wave height, , and average energy period, , on the basis of the spectral moment [12].
where is the variance density spectrum, is the wave frequency; both of them are depended on the relationship of DSD (Doppler-Shifted-Dispersion). Therefore, the and of ocean waves can be estimated from the frequency domain as:
and
For deep water waves, the included power potential per unit wave-front can be calculated as follows [42]:
where ρ is the seawater density, is gravitational acceleration.
The 22-year wave data in South China Sea, with the span of 1988–2009, were performed according to the WAVEWATCH-III (WW3) model [11]. Table 5 shows that the 3-hourly wave energy statistics data (times) and probability of occurrence (%) of and in South China Sea. The background color scale represents the occurrence probability of the wave condition.

Table 5.
Three-hourly wave energy statistics data (upper data, times) and probability of occurrence (underlying data, %).
As can be seen from Table 5, the most probable average significant wave height values are below 3.5 m and that most of values are in the 0.5–2.5 m range. The wave periods are basically scattered at the interval of 4.5–8.5 s.
According to the contents of Table 5 and Equation (30), the energy distribution probabilities, , of each wave condition can be obtained by the following Equation.
where and are the wave power and occurrences of the wave condition in group , respectively; is the total number of groups.
The wave-power levels (kW/m) and energy distribution probabilities (%) at each wave condition can be estimated as shown in Table 6. The background color scale illustrates the energy distribution probability. The maximum wave power is distributed in of 1.5–3.5 m and of 6.5–8.5 s. It also can be seen that in wave condition with = 2.5 m and = 6.5 s, the largest energy contribution, which account for about 15.24% of the total wave energy, is obtained.

Table 6.
Wave-power levels (upper data, kW/m) and energy distribution probabilities (underlying data, %).
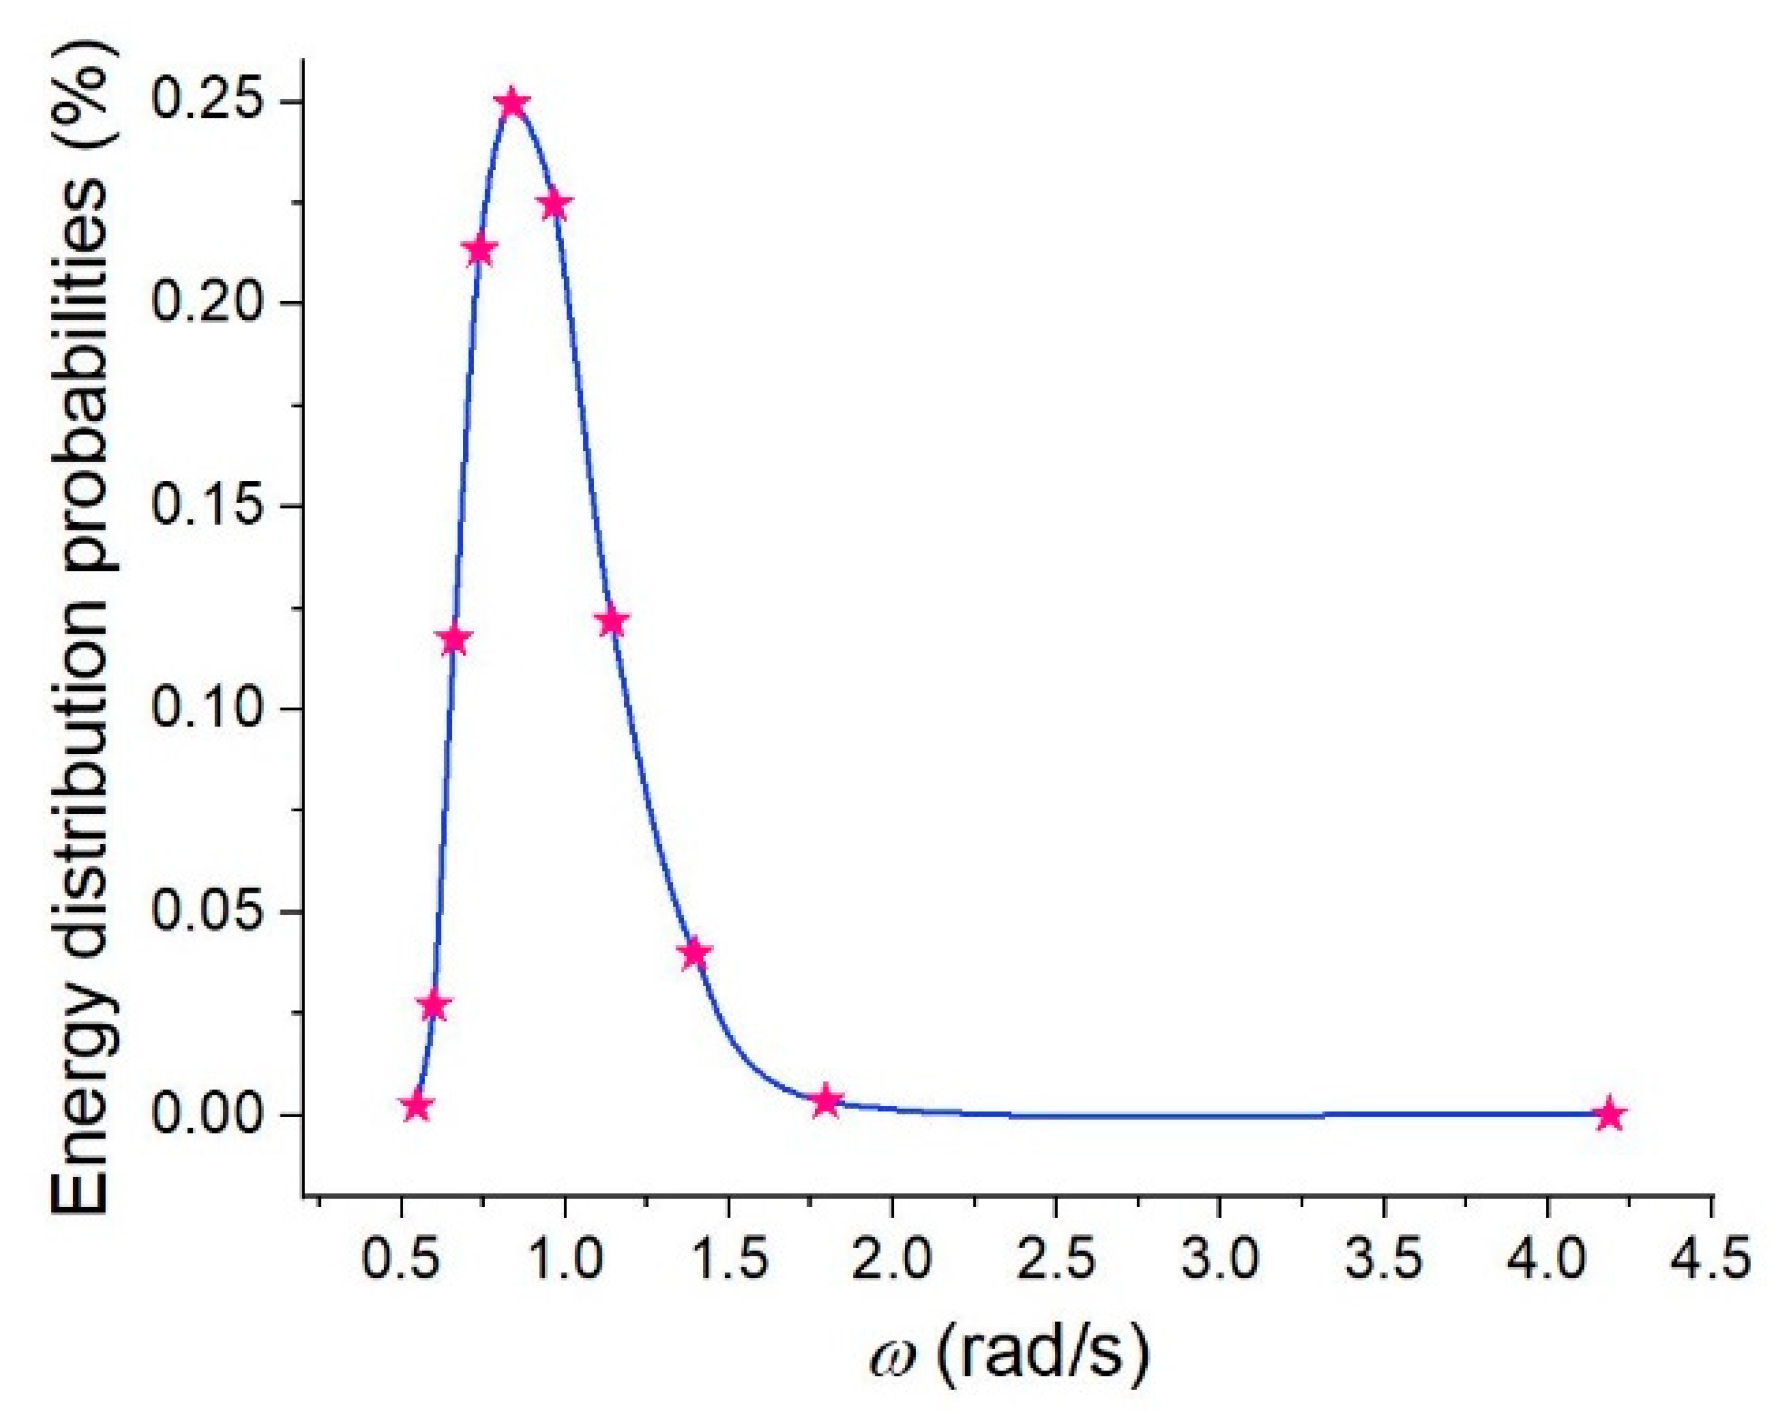
Figure 4 illustrates that the fitting curve of energy distribution probabilities under different wave frequencies. The energy contained in wave conditions with a frequency of 0.837 rad/s (average energy period ) accounts for about 25% of the total wave energy in South China Sea. Therefore, the proposed WEC should achieve maximum efficiency in this wave condition.
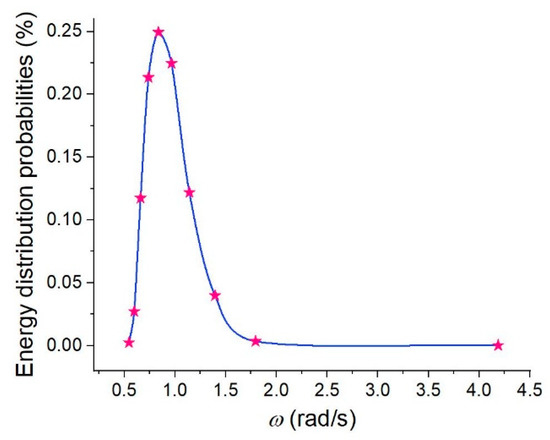
Figure 4.
Energy distribution probabilities under different wave frequencies.
4.2. Finite-Element Analysis (FEA) Model of Turbine Blade
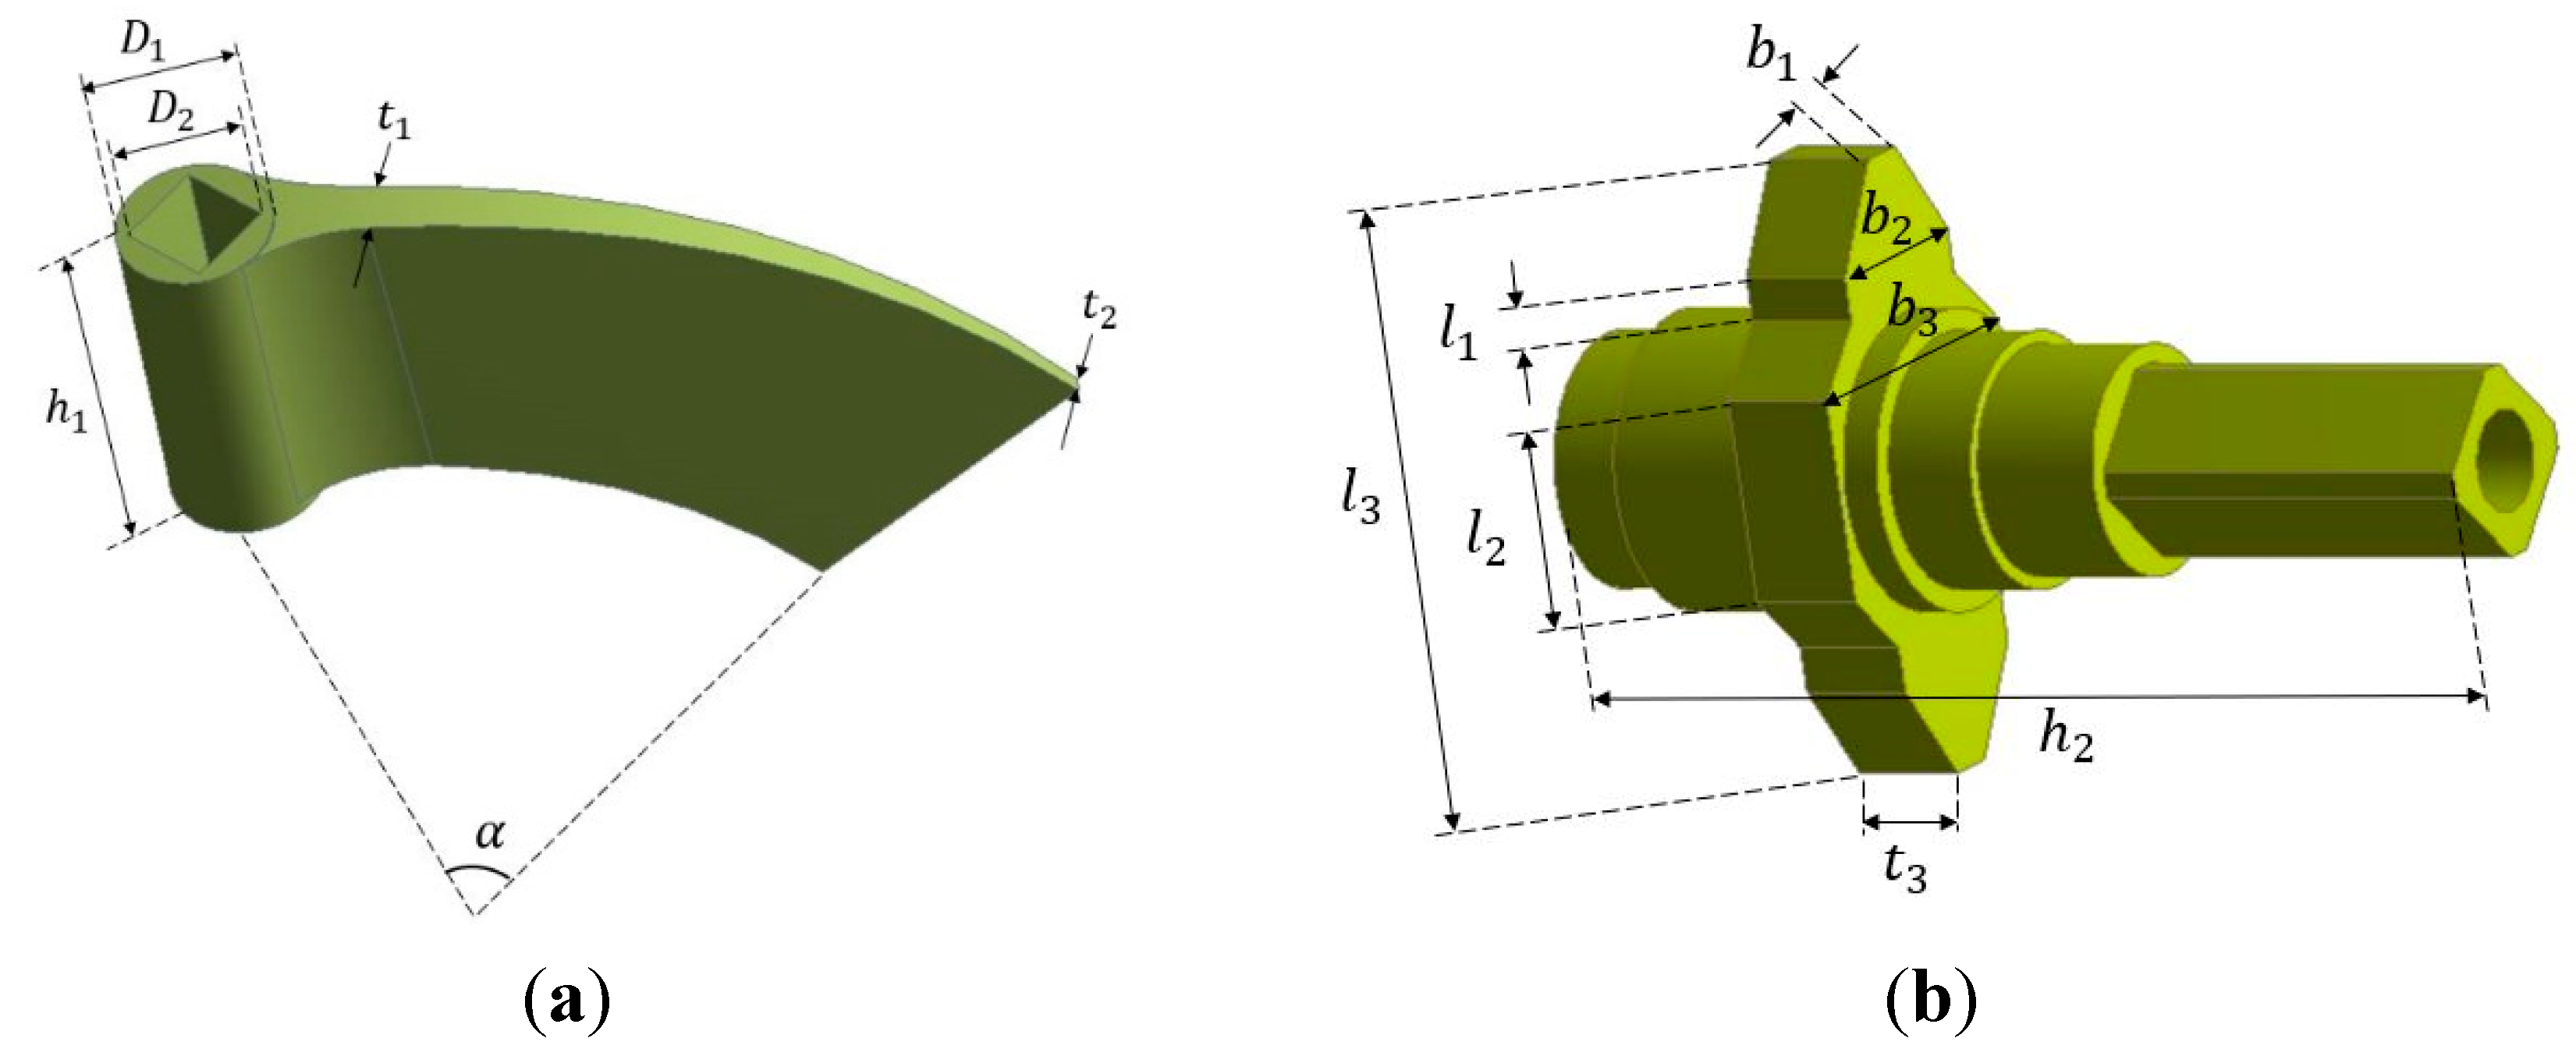
The single blade system of the turbine is composed of a fan blade and a limit switch with mechanical stop function, as depicted in Figure 5. The basic design parameters of the blade system are provided in Table 7.
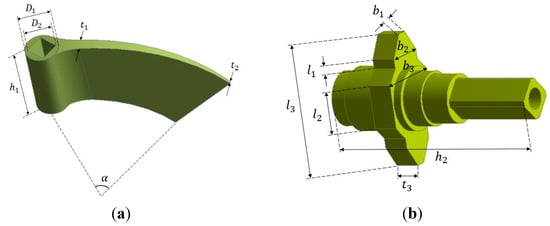
Figure 5.
Single blade system. (a) Fan blade; (b) limit switch.

Table 7.
Basic design parameters.
Based on the purpose of illustrating the application scope of the proposed method, the turbine blade and limit switch are considered to be made of structural steel (S355) widely used in offshore implementations, in this study. Table 8 shows that the main performance parameters of S355 steel.

Table 8.
Main performance parameters.
In order to obtain the maximum stress position of the turbine blade, a numerical simulation was carried out using the Mechanical APDL solver in the software of ANSYS Workbench. Two different boundary conditions are considered in present paper, that is fixed support and moment loads. Both of the action planes of the limit switch are supported with fixed support to restrict its free rotation (see Figure 2). The moment load boundary conditions, whose values are obtained by analyzing the 42 wave conditions mentioned in Section 4.1, are applied to the blade system.
Mesh generation is an important part in the establishment of finite element model, and an unstructured mesh technology was used for generating the volume meshes. Generally, the precision of numerical calculations is improved by increasing the mesh number. However, a quite dense mesh results in burdensome calculations and seriously effects the efficiency of simulation. Therefore, it is reasonable to generate an appropriate number of meshes with acceptable computational accuracy.
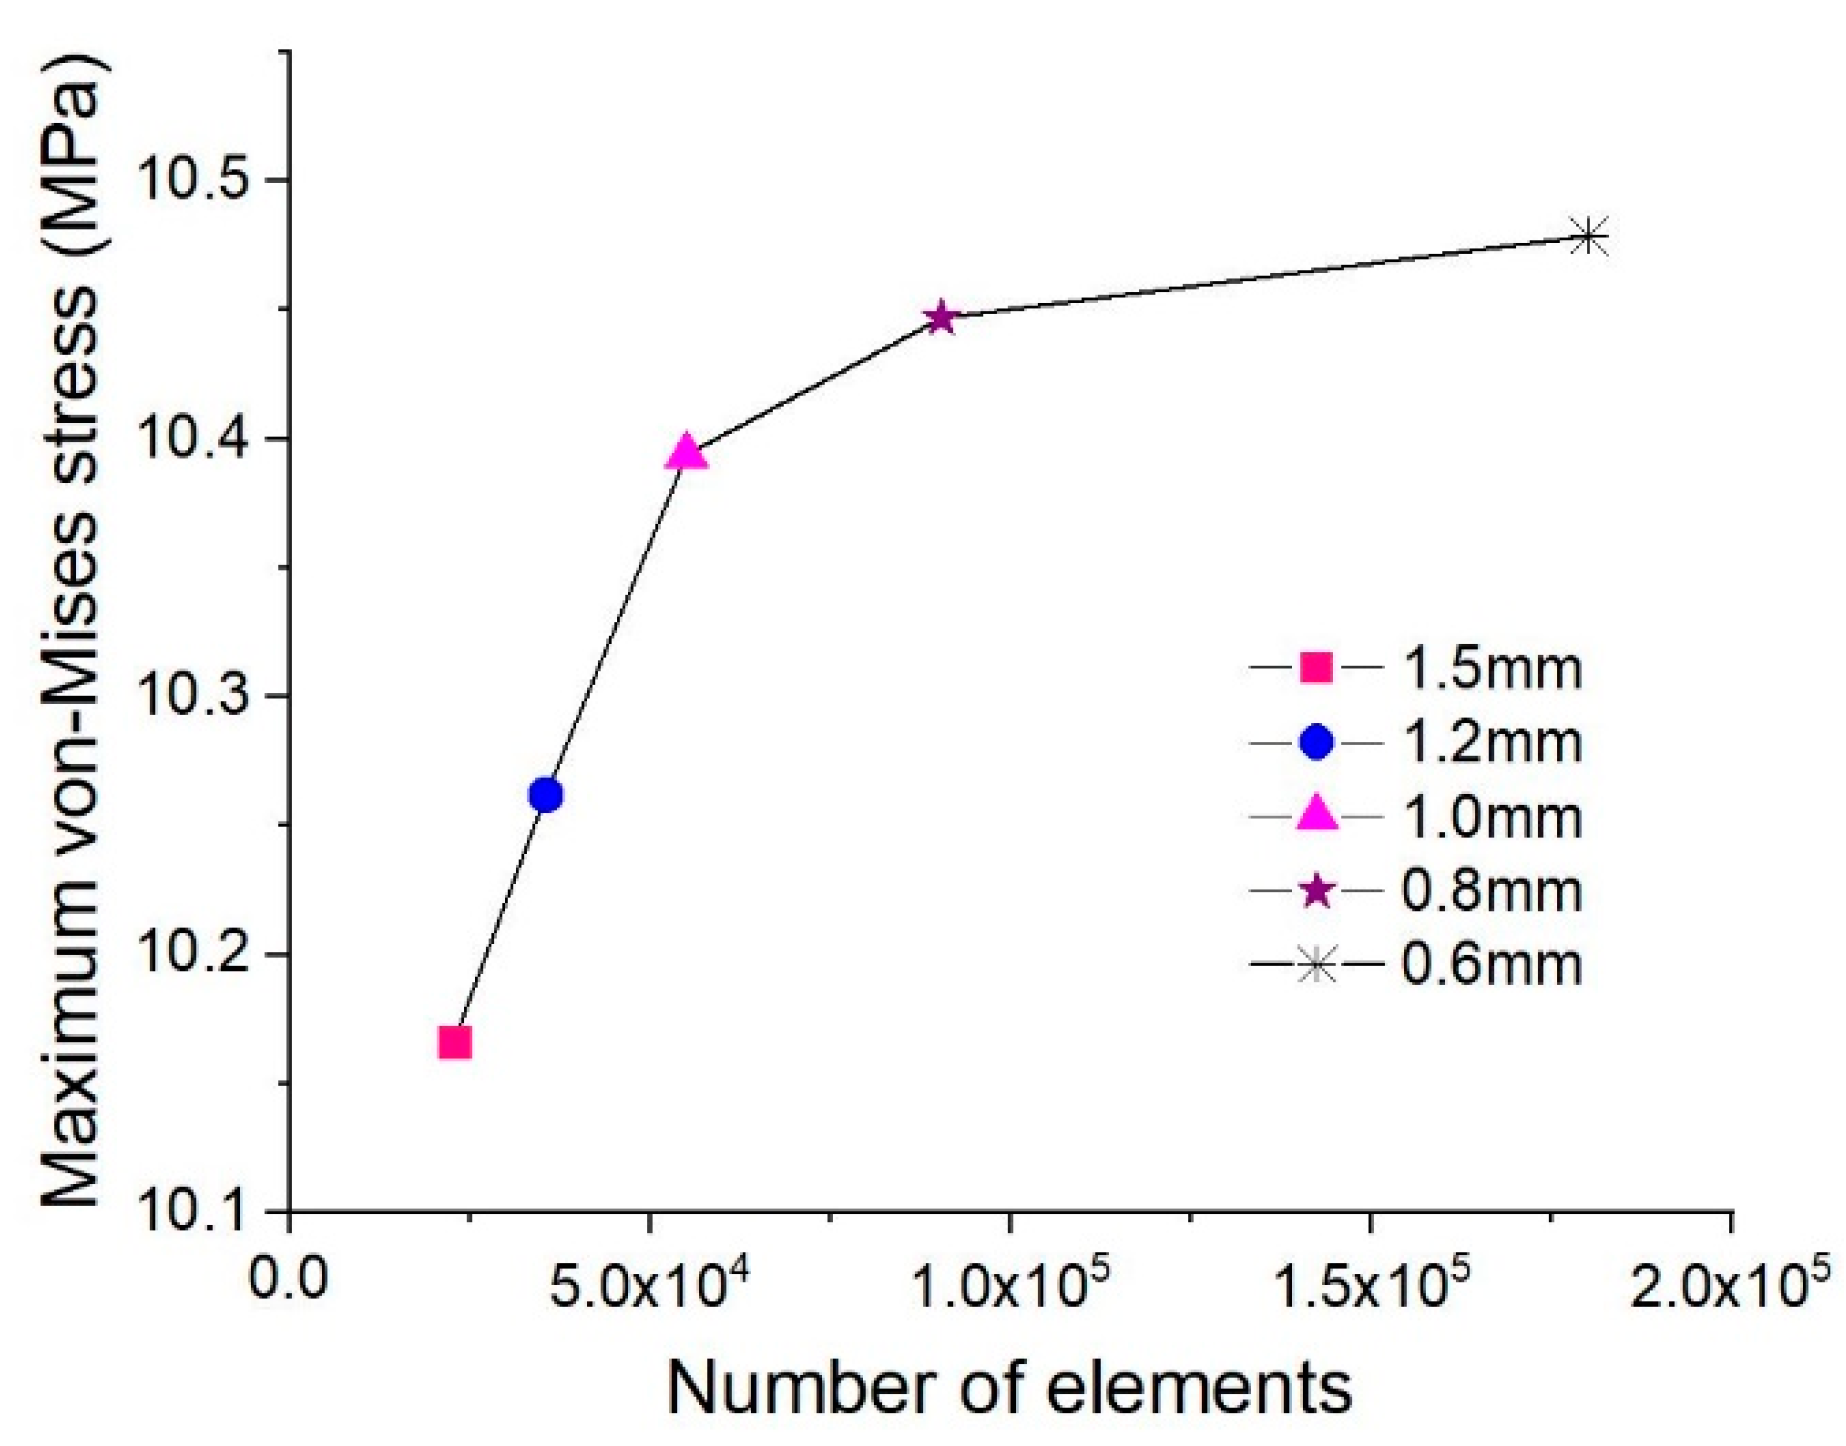
A mesh independence validation was performed to find the appropriately converged solutions. The whole blade system was discretized into mesh cells of 22,700; 35,500; 55,100; 90,400; and 180,100 approximately by changing the base size of the mesh element. In this section, the turbine blade was analyzed under wave fatigue loads generated in the South China Sea, which has a significant wave height of 1.5 m and average energy period of 7.5 s. The estimated applied torque load is calculated from the analytical model with and (see Section 2.2 and Section 2.3).
Figure 6 shows the relationship of the maximum Von Mises stress and the number of elements. Specific mesh information as shown in Table 9.
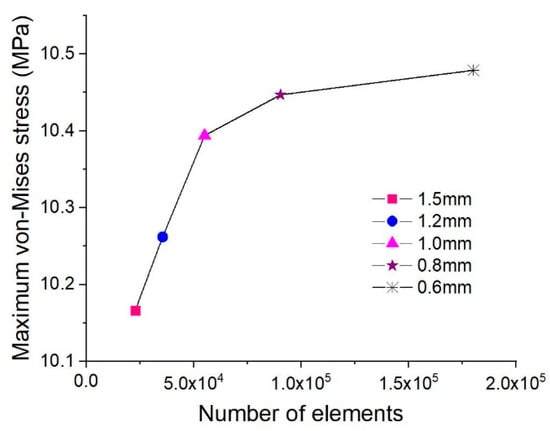
Figure 6.
Mesh independence validation.

Table 9.
Mesh analysis information.
The maximum Von Mises stress tends to be stable when the element size is 0.8 mm, which has a relative difference (0.31%) when compared to a denser meshing, as shown in Figure 6 and Table 8. Therefore, we choose to use a moderate number of mesh cells (90,400) to save computing resources and improve work efficiency.
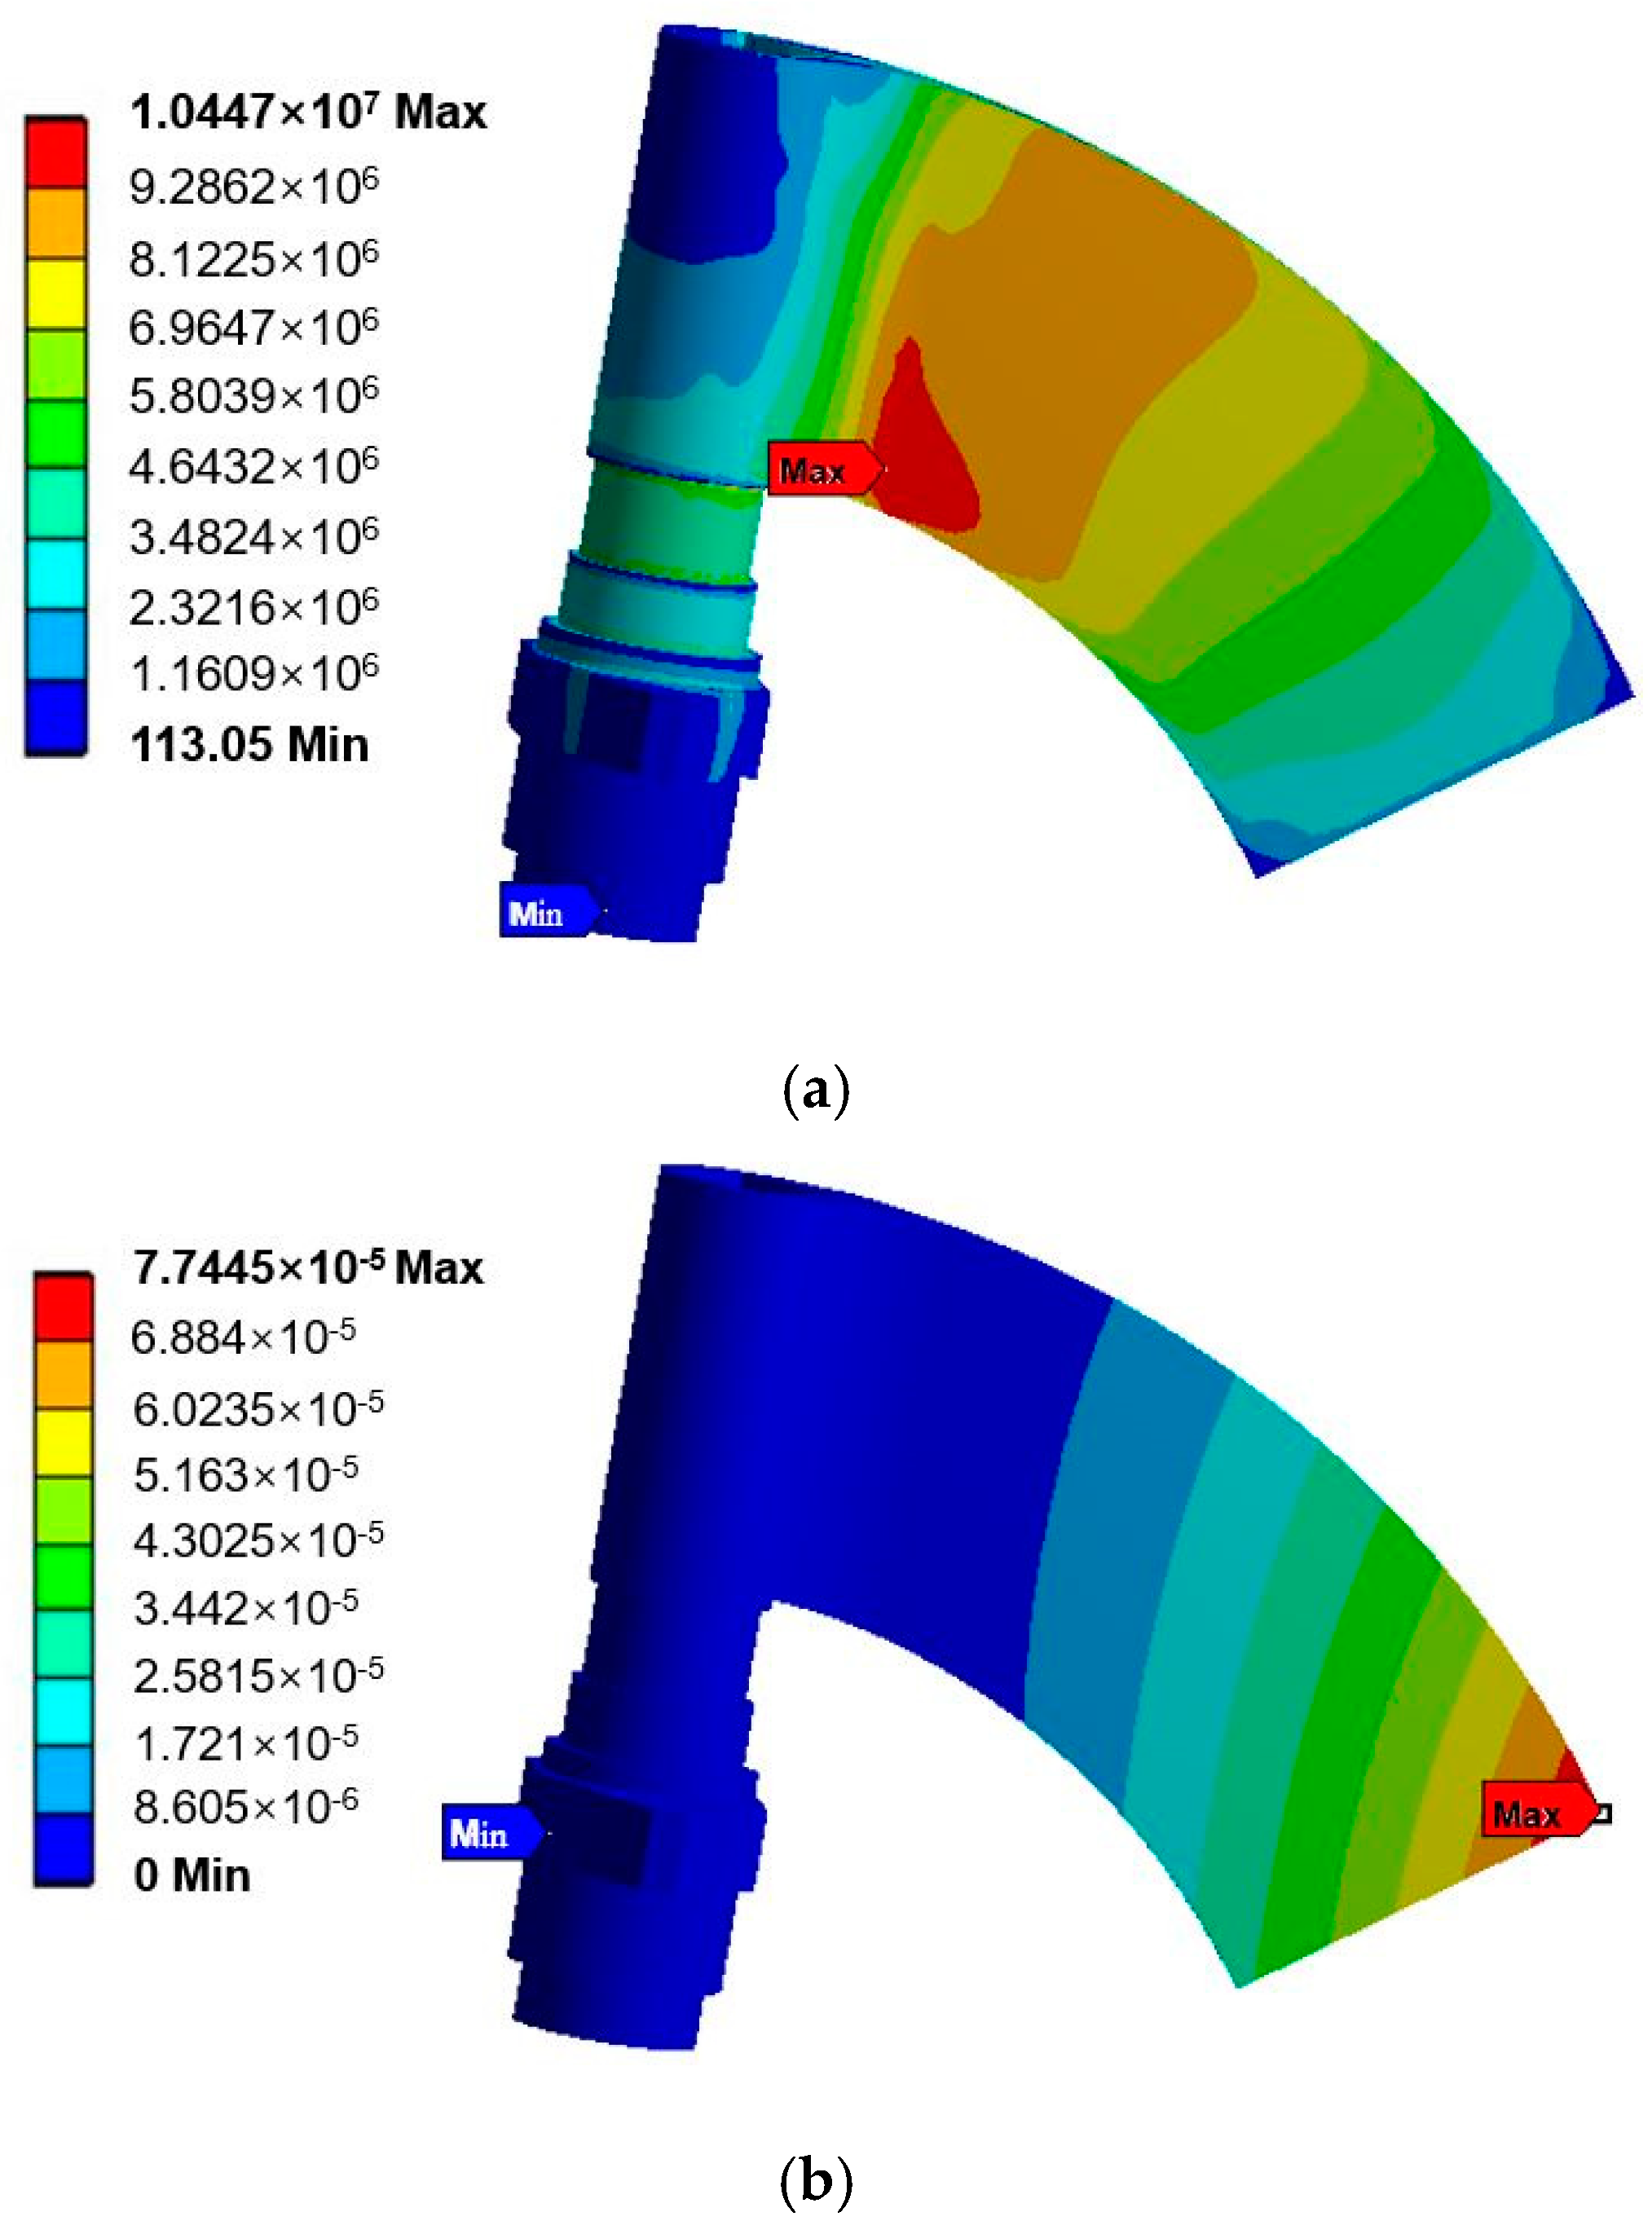
Simulation analysis shows that the blade root bears the maximum Von Mises stress (consider stress concentration) and the blade tip obtains the maximum deformation when the blade system is subjected to moment load, as shown in Figure 7. Therefore, the blade root is the fatigue critical detail of the blade system, and increasing its thickness can effectively improve the fatigue strength of the blade.
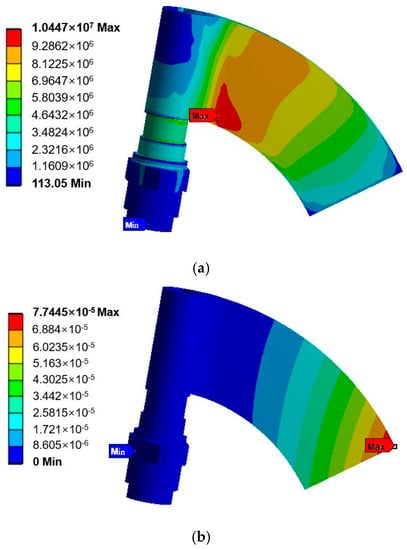
Figure 7.
Fatigue critical detail. (a) Von Mises stress (Pa); (b) deformation (m).
5. Results and Discussion
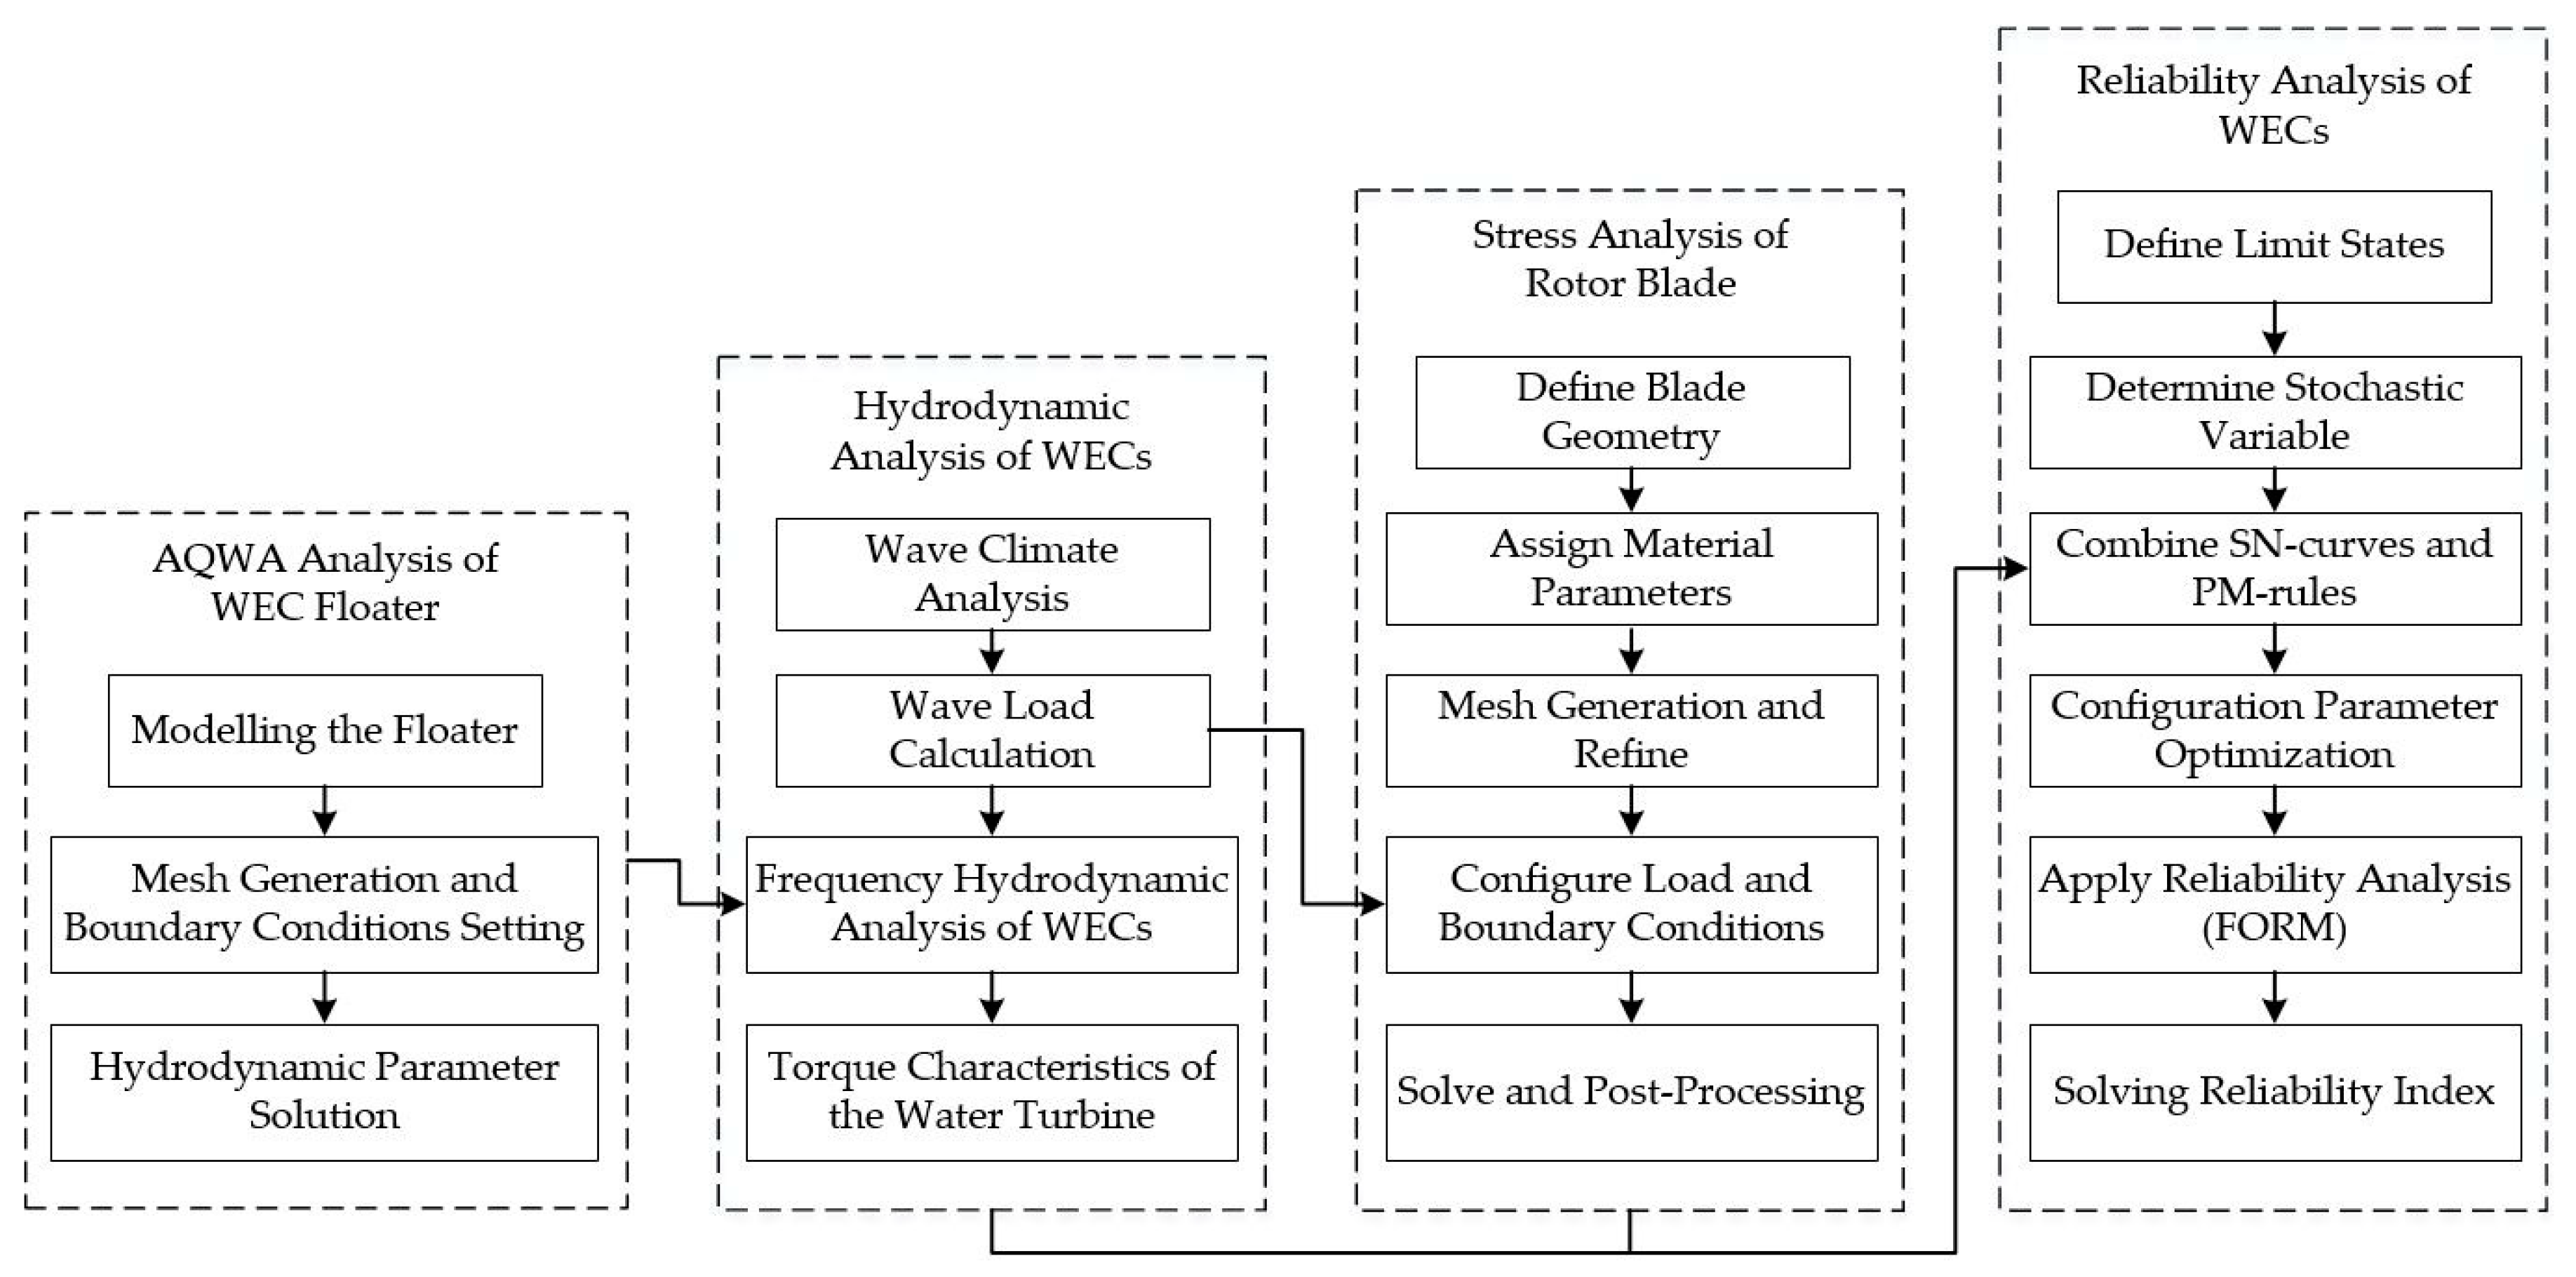
The reliability assessment of water hydraulic drive WEC is carried out in this section. The reliability index of the proposed WEC is evaluated by means of frequency domain hydrodynamic analysis, finite element analysis, wave climate analysis and reliability analysis. The flowchart of the reliability analysis is illustrated in Figure 8.
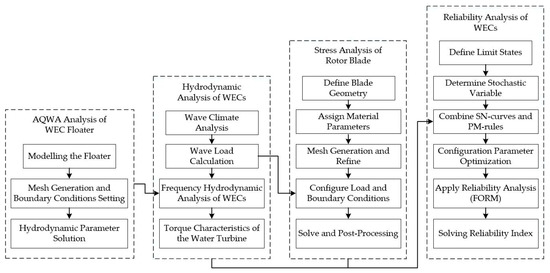
Figure 8.
Flowchart of the reliability analysis.
In order to make the calculated results more specific, it is assumed that the structural parameters of the proposed floater of water hydraulic drive WEC are described in Table 10.

Table 10.
Structural parameters of the floater.
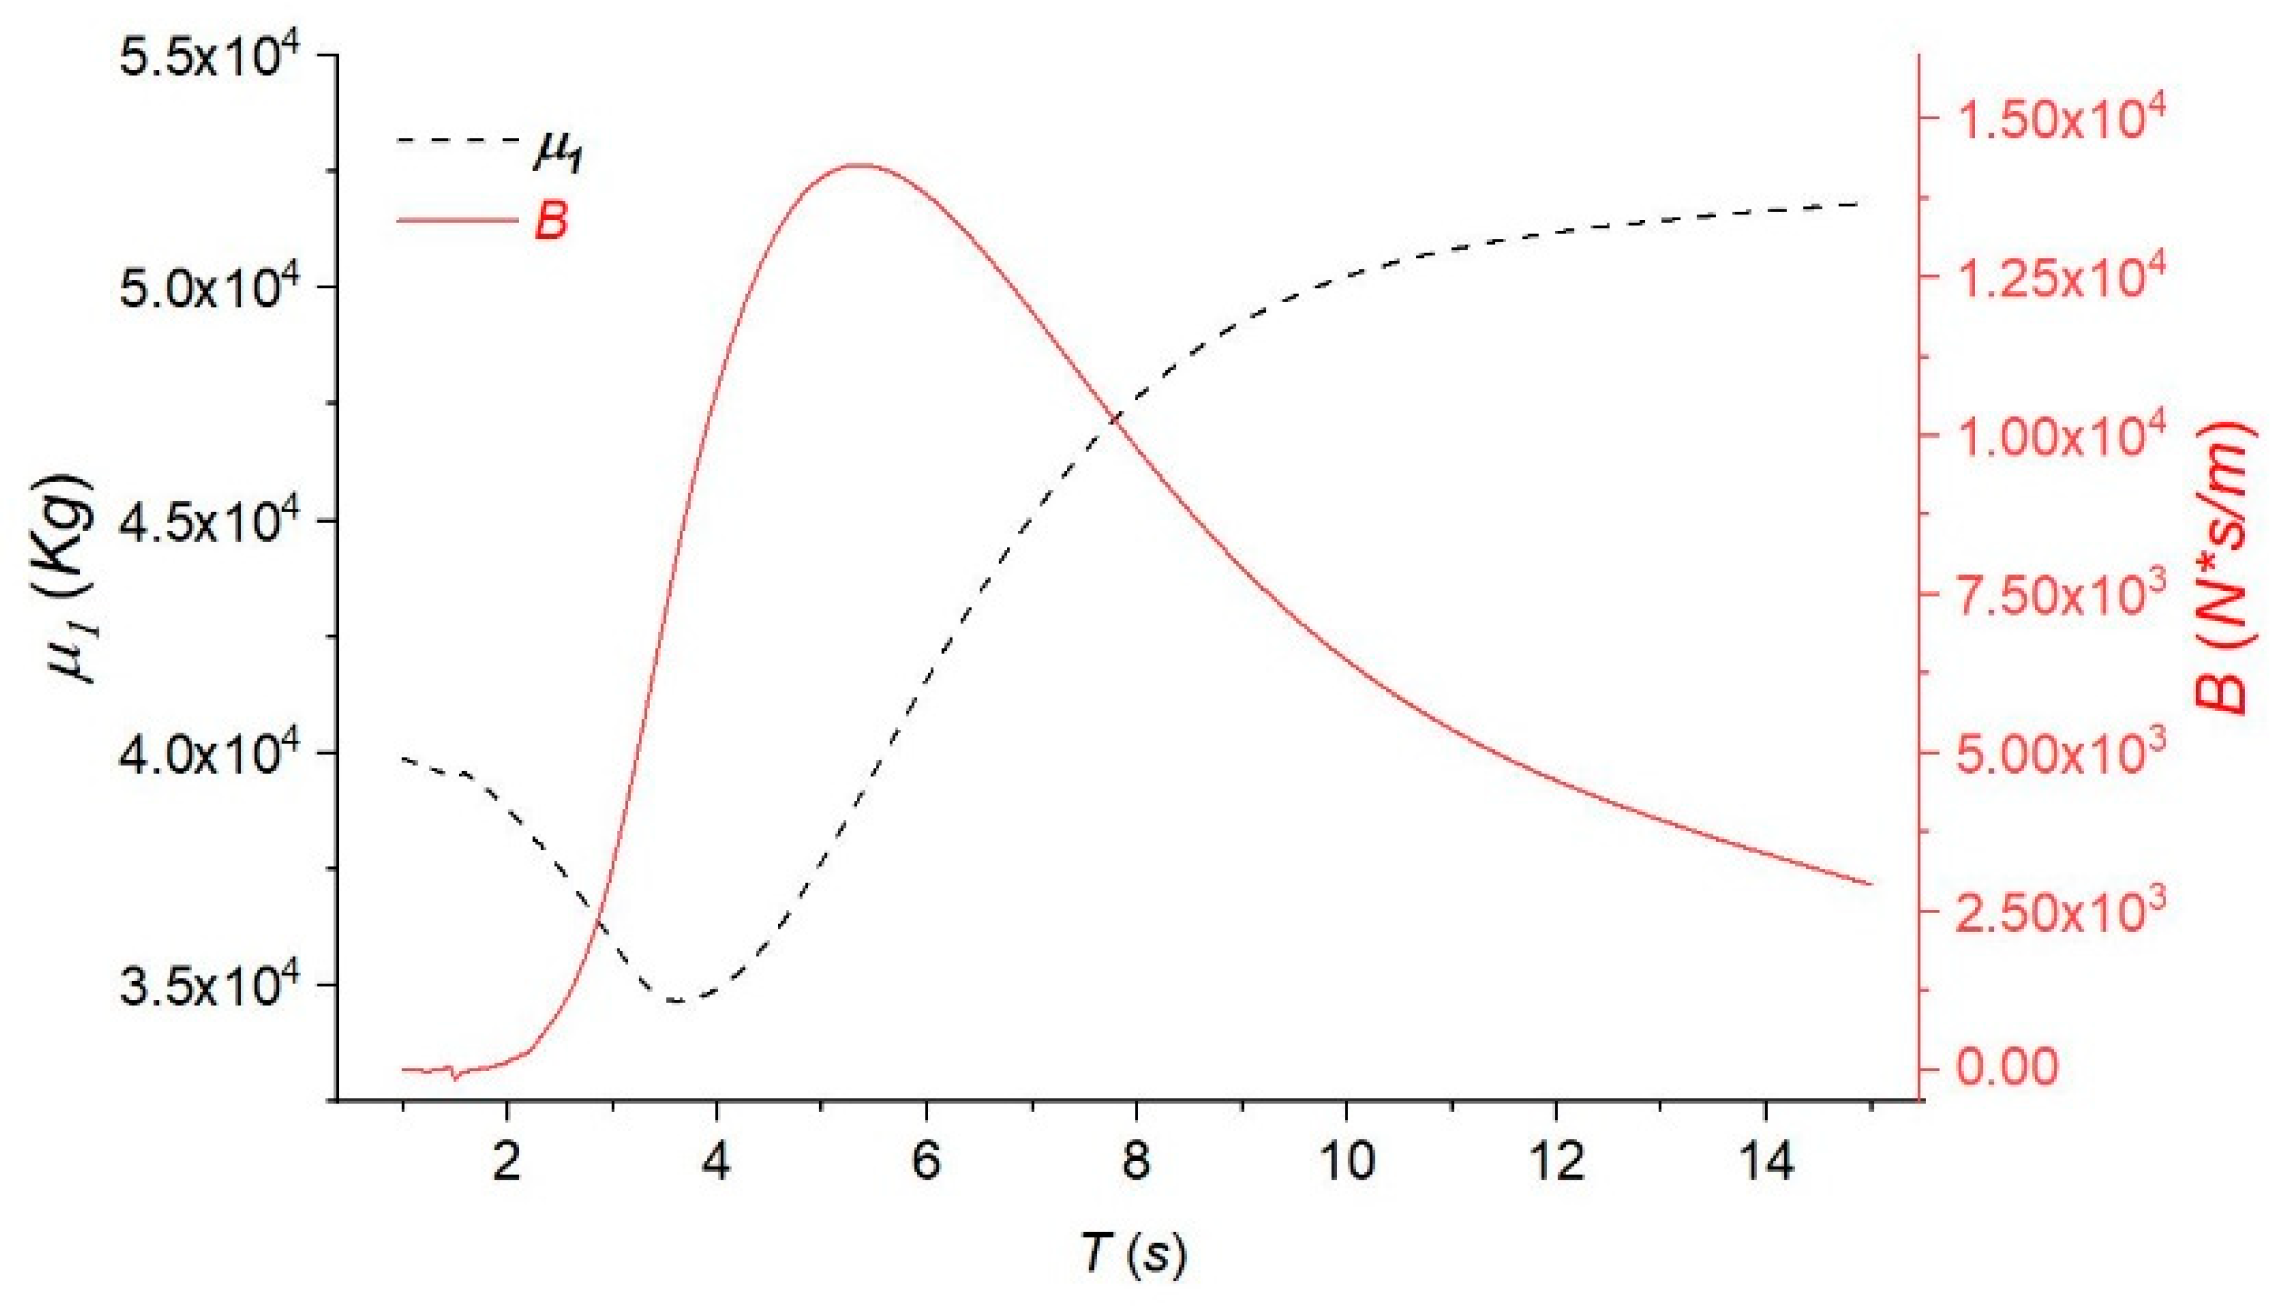
The added mass and the radiation damping coefficient were calculated by the software ANSYS AQWA for different wave frequencies and the condition of infinite depth. The plots of and versus wave period is shown in Figure 9. It is easy to see that the radiation damping coefficient of the floater tends to rise first and then fall with the increase of the wave period, and the maximum value is obtained at = 5.3 s. However, the added mass shows an opposite trend, and the minimum value is obtained at a wave period of 3.5 s.
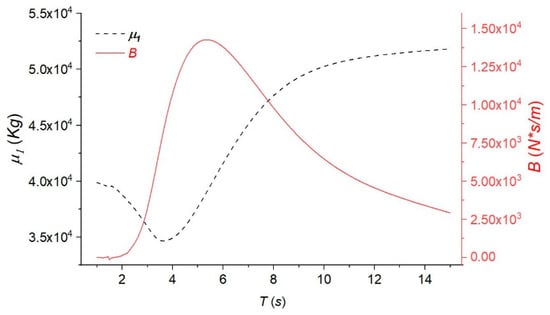
Figure 9.
Plots of added mass and radiation damping versus energy period .
5.1. Optimized PTO Damping
Since the proposed water hydraulic drive WEC is planned to be installed in the South China Sea, the design parameters of the device must be adapted to the characteristics of the sea conditions in the designated sea area. According to the analysis in Section 4.1, the wave energy contained in the wave condition with a period of 7.5 s is the largest. Therefore, one of the focuses in this section is to make the WEC obtains the maximum power under this wave condition.
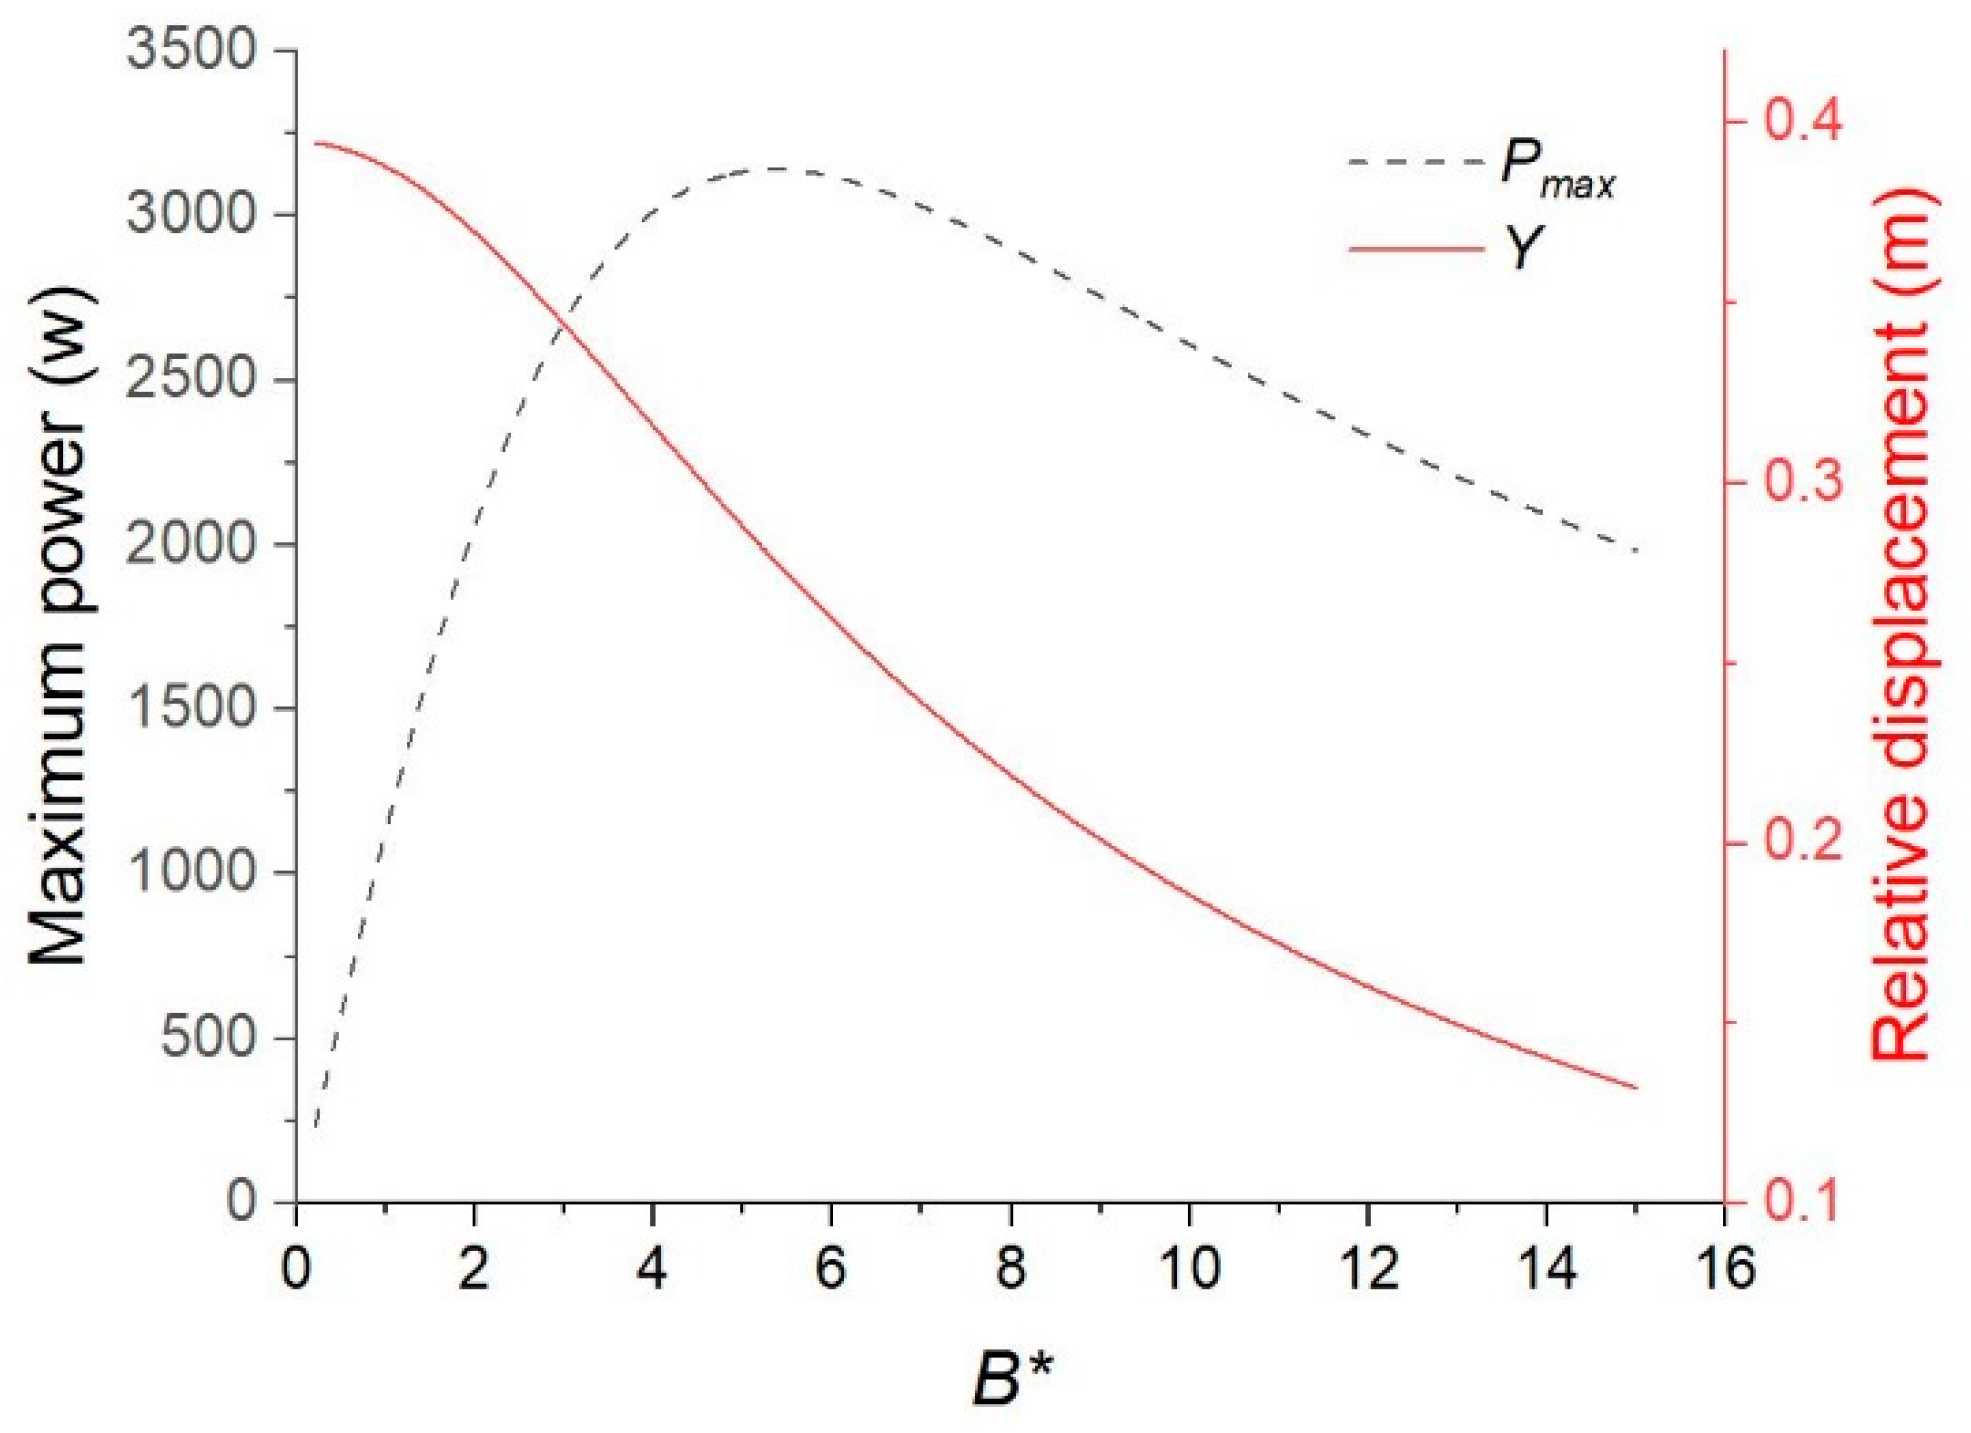
Figure 10 illustrates the curves of the maximum power, , absorbed by the turbine and the relative displacement of the water column contained in the tube, , under different dimensionless coefficients . Obviously, the maximum power absorbed by the water hydraulic drive WEC is obtained in , which can be achieved through a reasonable design of water turbine.
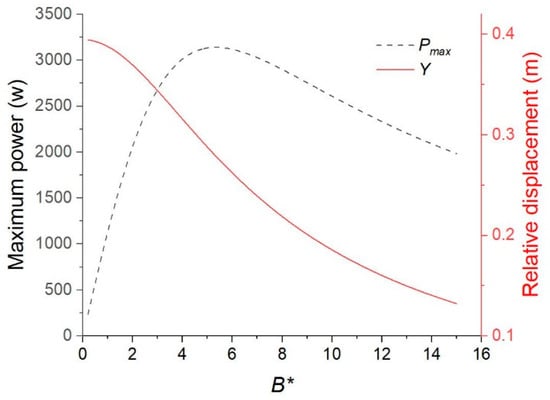
Figure 10.
Curves of and Y versus , for T = 7.5 s and = 1 m.
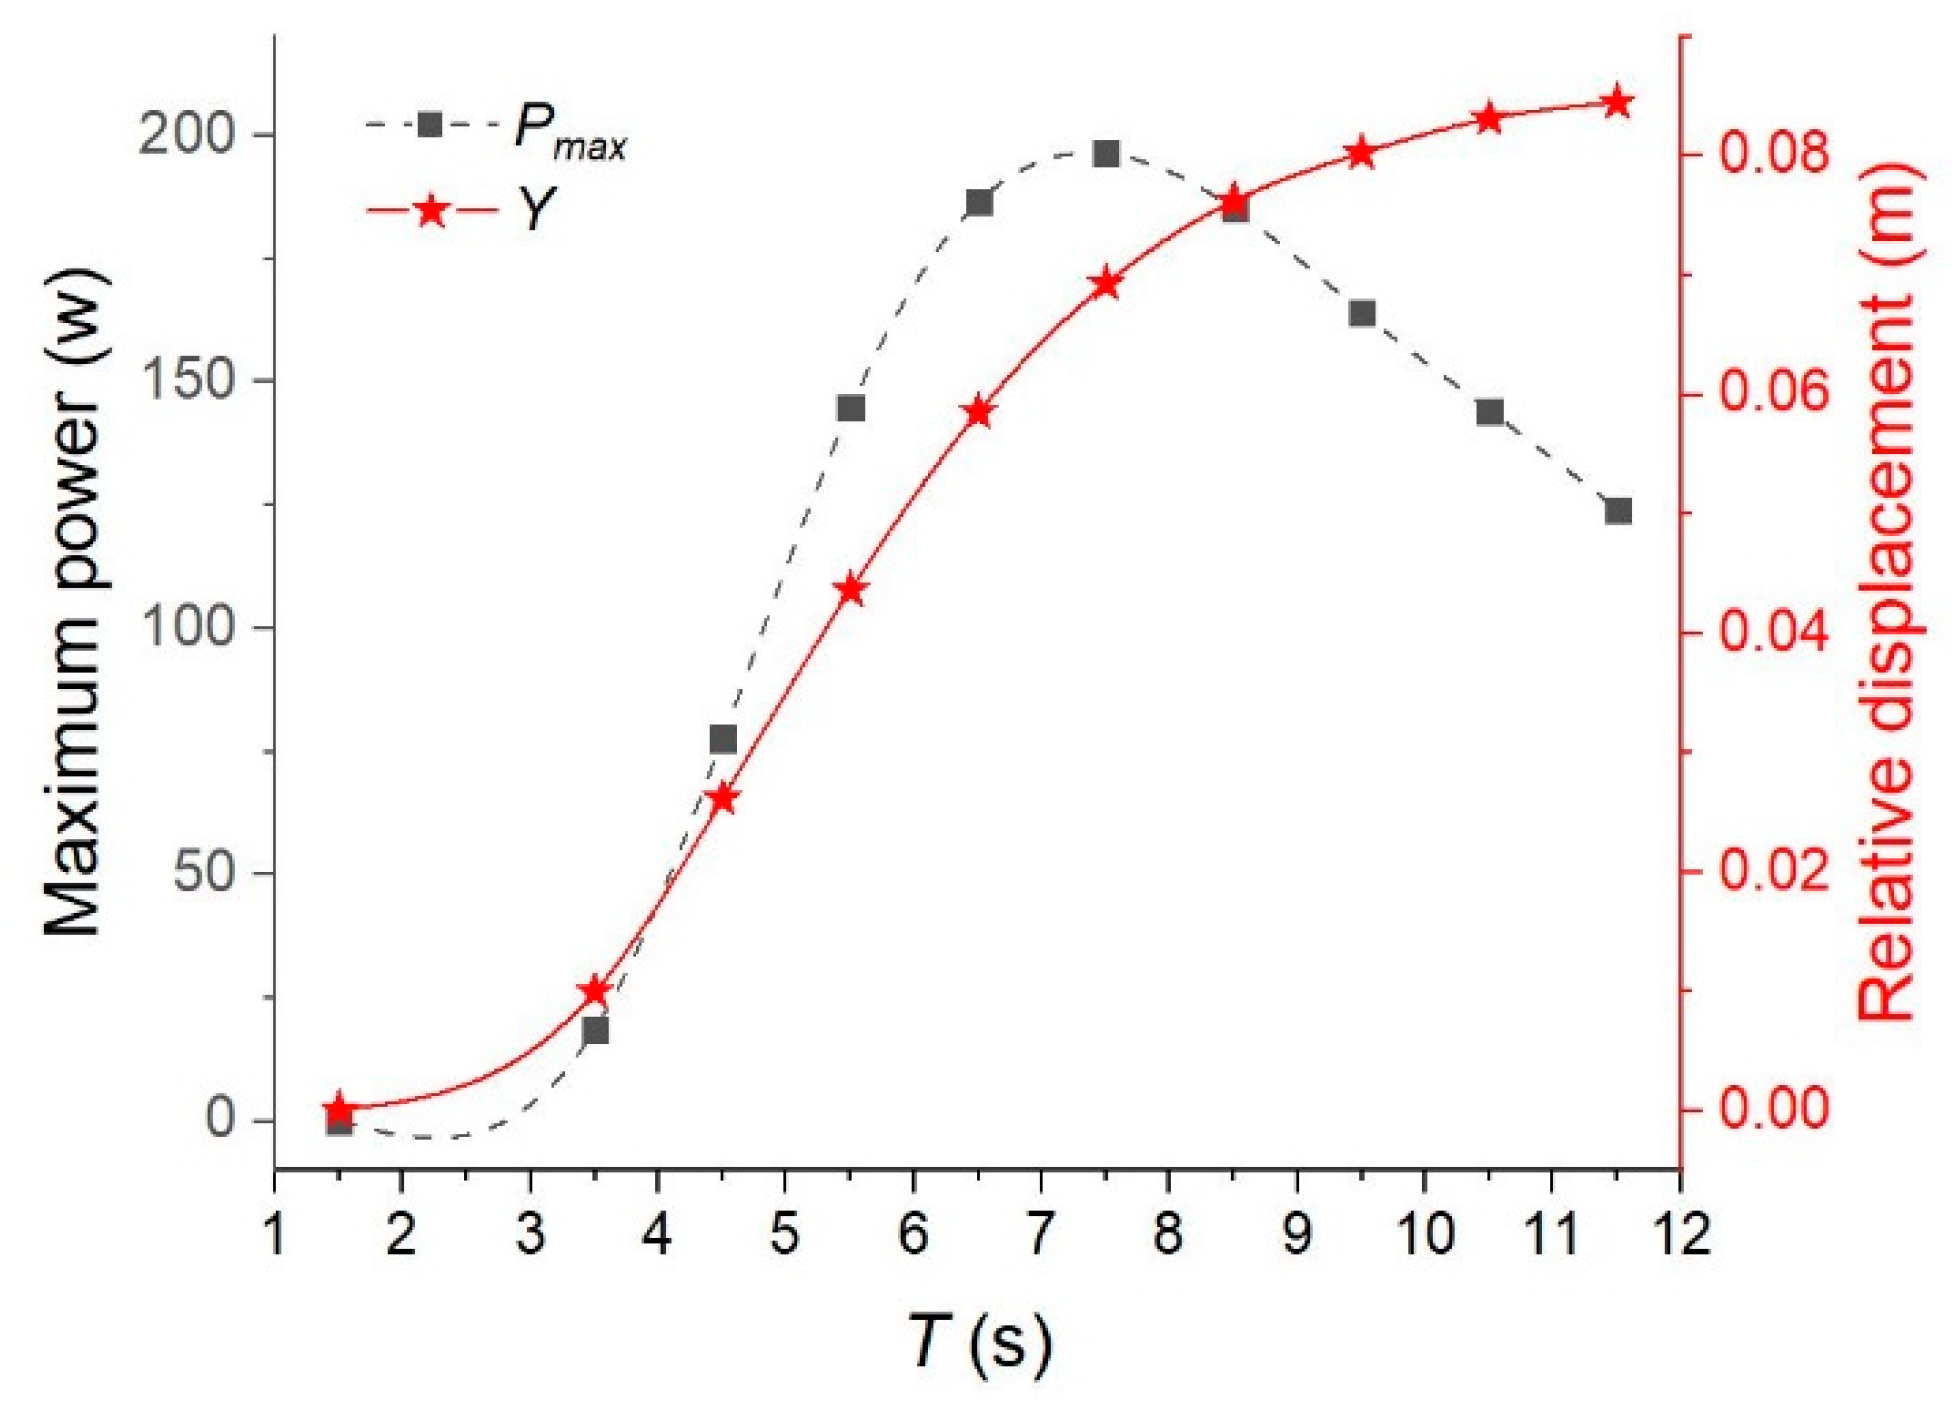
The equivalent PTO damping is invariable as the rotational angular velocity of the designed turbine is constant. Therefore, the optimized PTO damping obtained under the wave condition with the period of 7.5 s should be applied to other situations if the rotational speed control strategy is adopted. The relationship between the maximum absorbed power of the turbine and relative displacement of oscillating water column and the wave periods is plotted in Figure 11. It is shown that the optimized PTO damping can enable the turbine to obtain the maximum power when the wave period is 7.5 s. Thus, it is realized that the maximum absorption of wave energy under the most energetic wave conditions.
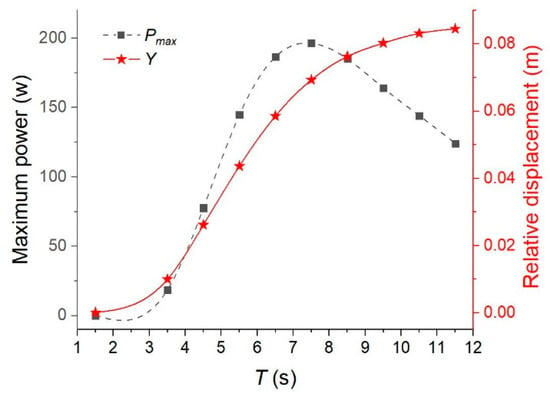
Figure 11.
Plots of and Y versus T, for and = 0.25 m.
5.2. Fatigue Reliability
The reliability index can represent the reliability level of the devices, which is a probabilistic assurance of component reliability. In fatigue design, the reliability index is closely related to time because the cumulated cycles number of fatigue loads increased with the service time. Without considering the probability of occurrence of the wave condition with period , the cycle number, , of fatigue loads per year can be calculated by the following Equation:
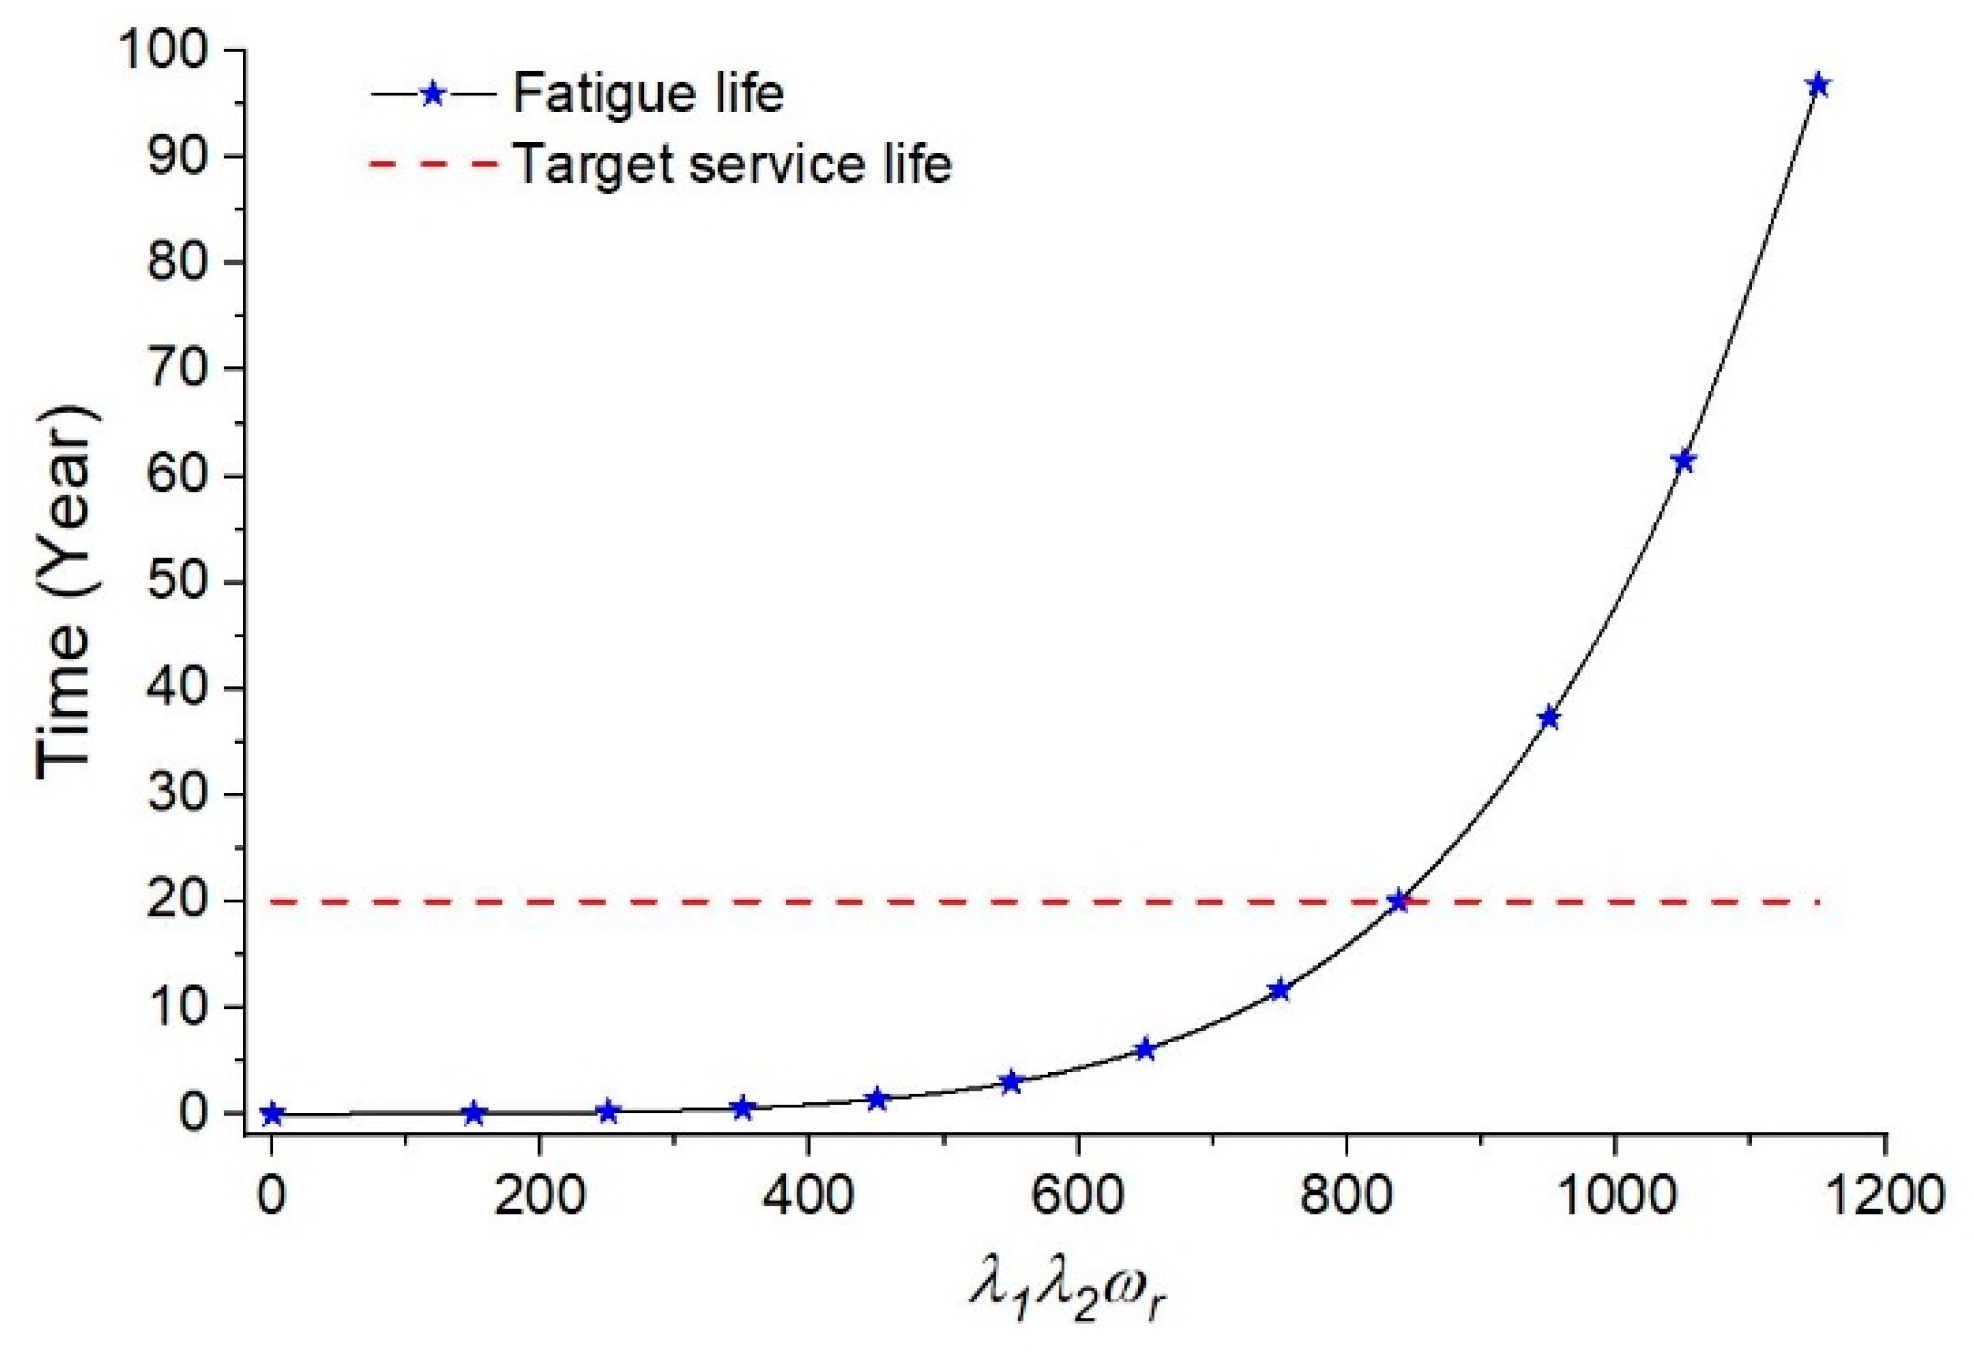
For structural steels, the stress and strain show a linear relationship when the stress in the components is less than Young’s modulus. Therefore, the maximum stress of the turbine blade under the action of moment load is proportional to the applied moment. Based on the simulation analysis of the finite element model established in Section 4.2, the maximum Von Mises stress of the blade system under the action of unit moment load (Nm) is 3.731MPa. A turbine performance analysis with variable configuration parameters, , is carried out, which can be used to study the fatigue life of the blade system in combination with the SN-curve approach and limit state equation. By solving Equation (20), it can be obtained that the service life of the water turbine blade can exceed 20 years under the condition of 839 (FDF = 3), as shown in Figure 12. The application value of this conclusion is that the target service life of the WEC can be realized through reasonable adjustment of the turbine configuration parameters on basis of the reliability approach.
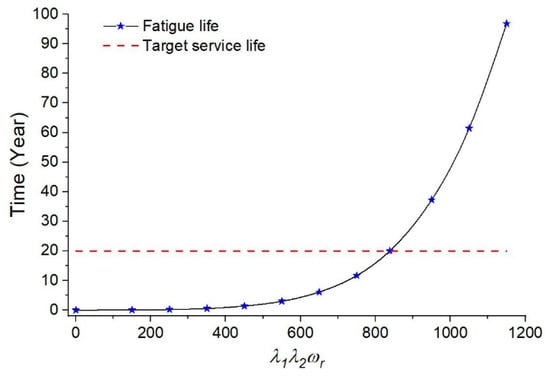
Figure 12.
Plots of the fatigue life and configuration parameters .
In view of the lower linear speed of wave motion, the rotational velocity of the direct drive water turbine is generally lower than other WECs, e.g., an oil hydraulic system. Therefore, the optimal configuration parameters of the water turbine considered in this paper are shown in Table 11.

Table 11.
Optimal configuration parameters of the water turbine.
The calculated cumulative reliability index for the WEC in stochastic wave condition is described in Figure 13. As predicted, the reliability index declined monotonously with service life. However, the blade system does not achieve the target reliability level, , recommended for other marine projects (see Section 3.3). Therefore, a calibrated minimum target cumulative reliability index of 2.1 for moving components of water hydraulic drive WEC is recommended in this paper (FDF = 3).
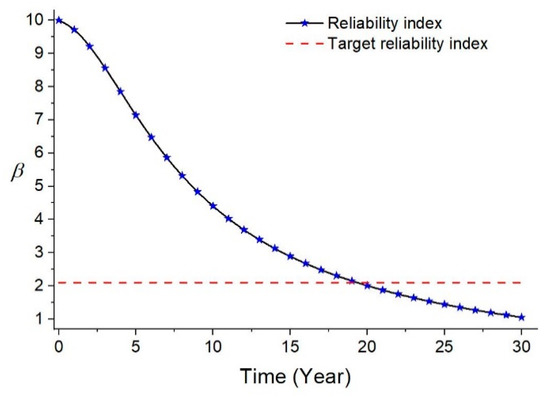
Figure 13.
Cumulative reliability index trend.
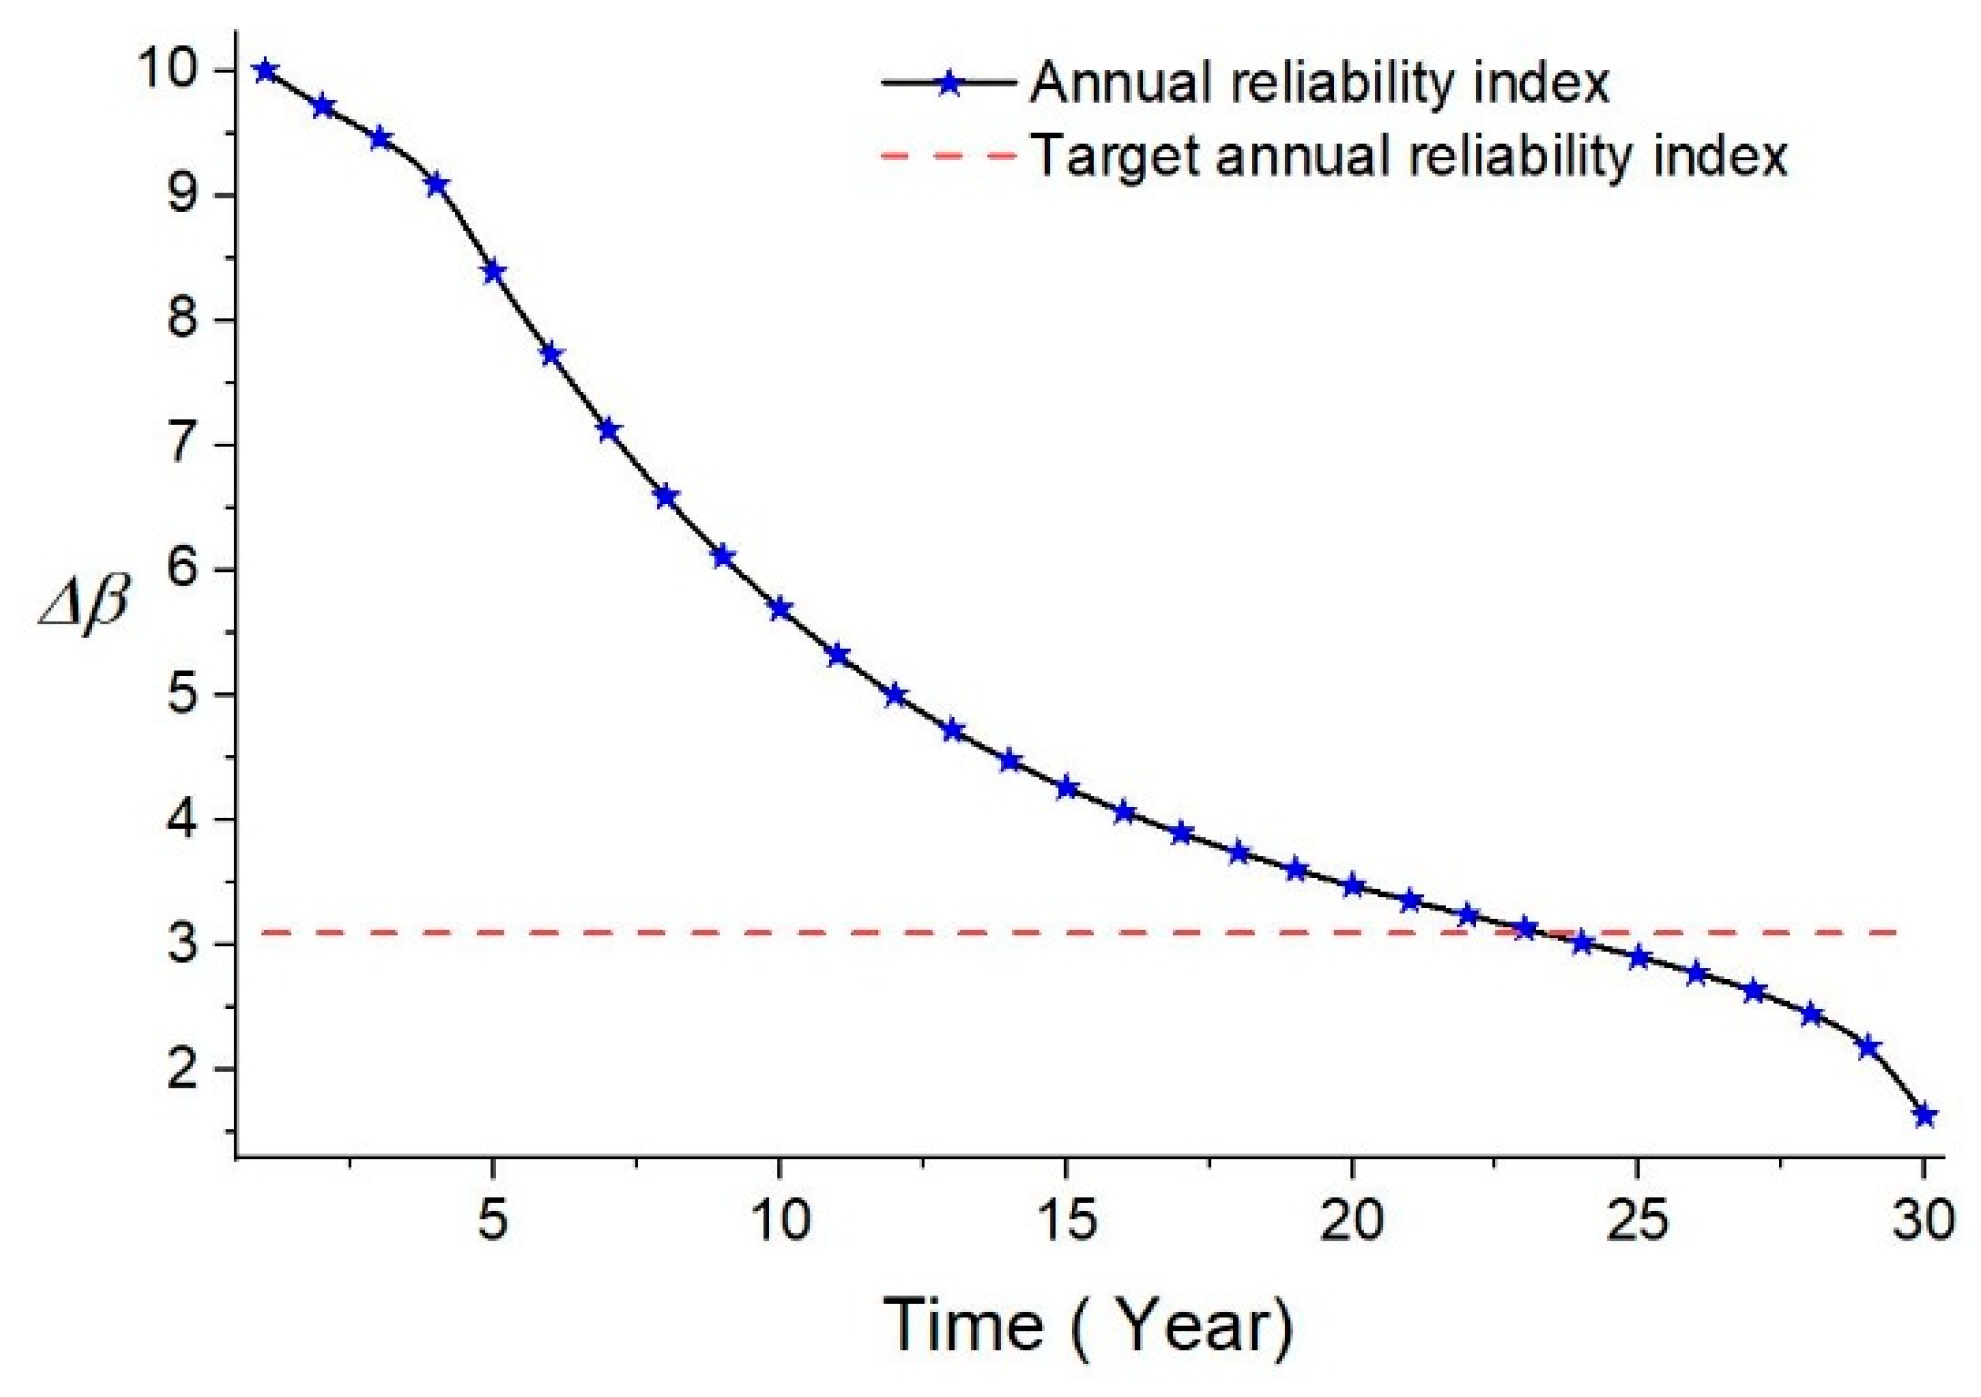
Figure 14 shows that the annual reliability index trend of the WEC under the specific fatigue load. It can be observed that the turbine blade achieves the 20-year design life with the annual reliability index . This is consistent with the range of annual reliability index, , proposed in literature [20].
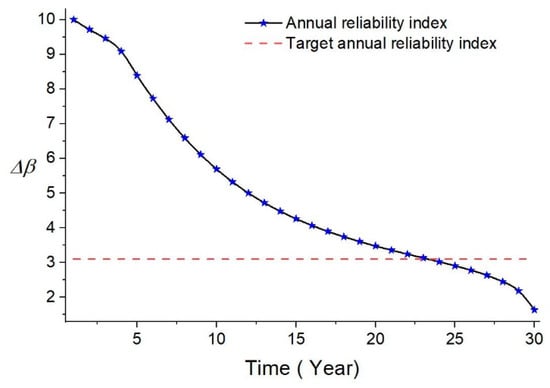
Figure 14.
Annual reliability index trend.
In the present section, reliability assessment based on probabilistic method has been carried out for different configuration parameters of the water turbine, which can be used to improve the reliability design of the proposed WEC under the condition of meeting the target service life. It must be pointed out that the coefficients of variation of stochastic variables are derived from the recommendation of previous references, some of which assumed values for the proposed water hydraulic drive WEC when more realistic data was not available. In addition, the efficiency of the water turbine is not considered when the torque loads of the blade system are calculated in this work, and the reliability analysis results are relatively conservative. The detailed reliability data can be obtained through experimental methods and real-time monitoring systems, which should be conducive to establish more accurate reliability models of stochastic variables.
6. Conclusions
In this paper, a structure design and frequency domain analysis of the water hydraulic-drive WEC has been developed and used to assess the fatigue reliability of system-critical details. A reliability model based on the SN-curves and linear damage cumulative theory is proposed and solved, considering the uncertainty of the model parameters. The FORM is developed to assess the reliability indices, and the configuration parameters of the turbine blade system are obtained through reliability assessment. The following conclusions can be obtained based on previous analysis:
- The frequency domain analysis method can effectively evaluate both the average and maximum power absorbed by the water hydraulic drive WEC, which provides a theoretical basis for the improvement of the system performance under random wave conditions.
- The wave condition with = 2.5 m and = 6.5 s contains the largest energy contribution, which accounts for about 15.24% of the total wave energy in the South China Sea. The energy contained in the wave condition with a period of 7.5 s accounts for about 25% of the total energy.
- The blade root is the fatigue critical detail bearing the maximum Von Mises stress, and the blade tip obtains the maximum deformation under the moment load.
- Optimized PTO damping, , obtained under the wave condition with the period of 7.5 s enables the turbine to obtain the maximum absorbed power under random wave conditions.
- Fatigue life of the water turbine can reach the design service life of 20 years as the configuration parameters meet the condition 839 (FDF = 3). The cumulative reliability index, , and annual reliability index, , are recommended as 2.1 and 3.5, respectively.
The reliability assessment method employed and analyzed in the present paper is able to effectively evaluate the reliability of the water hydraulic-drive WEC and calibrate the preliminary structure parameters based on probabilistic methods. The proposed method can be extended to relevant engineering design of marine-energy development and utilization.
Author Contributions
H.L. and S.T. were responsible for conceptualization, date curation, writing and formal analysis. W.W. was responsible for funding acquisition, investigation and validation. L.M. and H.M. were responsible for project administration and visualization. G.Z. and J.L. was responsible for methodology and software.
Funding
This work is supported by National Natural Science Foundation (NNSF), Youth Fund Project of China under Grant 61603407.
Acknowledgments
The authors would like to acknowledge with the utmost sincerity the financial support from “Key projects of PLA (BY113C001)”, “Key research and development plan of China (2016YFC0305001)”.
Conflicts of Interest
The authors declare no conflicts of interest.
References
- Wang, D.D.; Sueyoshi, T. Climate change mitigation targets set by global firms: Overview and implications for renewable energy. Renew. Sustain. Energy Rev. 2018, 94, 386–398. [Google Scholar] [CrossRef]
- Yang, X.; Liu, N.; Zhang, P.; Guo, Z.; Ma, C.; Hu, P.; Zhang, X. The current state of marine renewable energy policy in China. Mar. Policy 2019, 100, 334–341. [Google Scholar] [CrossRef]
- Lehmann, M.; Karimpour, F.; Goudey, C.A.; Jacobson, P.T.; Alam, M.-R. Ocean wave energy in the United States: Current status and future perspectives. Renew. Sustain. Energy Rev. 2017, 74, 1300–1313. [Google Scholar] [CrossRef]
- O’Hagan, A.M.; Huertas, C.; O’Callaghan, J.; Greaves, D. Wave energy in Europe: Views on experiences and progress to date. Int. J. Mar. Energy 2016, 14, 180–197. [Google Scholar] [CrossRef]
- Kolios, A.; Di Maio, L.F.; Wang, L.; Cui, L.; Sheng, Q. Reliability assessment of point-absorber wave energy converters. Ocean Eng. 2018, 163, 40–50. [Google Scholar] [CrossRef]
- Lin, Y.; Bao, J.; Liu, H.; Li, W.; Tu, L.; Zhang, D. Review of hydraulic transmission technologies for wave power generation. Renew. Sustain. Energy Rev. 2015, 50, 194–203. [Google Scholar] [CrossRef]
- Zheng, C.W.; Li, C.Y. Variation of the wave energy and significant wave height in the China sea and adjacent waters. Renew. Sustain. Energy Rev. 2015, 43, 381–387. [Google Scholar] [CrossRef]
- de O. Falcao, A.F. Wave energy utilization: A review of the technologies. Renew. Sustain. Energy Rev. 2010, 14, 899–918. [Google Scholar]
- Chen, X.; Wang, K.; Zhang, Z.; Zeng, Y.; Zhang, Y.; O’Driscoll, K. An assessment of wind and wave climate as potential sources of renewable energy in the nearshore Shenzhen coastal zone of the South China Sea. Energy 2017, 134, 789–801. [Google Scholar] [CrossRef]
- Yaakob, O.; Hashim, F.E.; Omar, K.M.; Din, A.H.M.; Koh, K.K. Satellite-based wave data and wave energy resource assessment for South China Sea. Renew. Energy 2016, 88, 359–371. [Google Scholar] [CrossRef]
- Zheng, C.-W.; Pan, J.; Li, J.-X. Assessing the China Sea wind energy and wave energy resources from 1988 to 2009. Ocean. Eng. 2013, 65, 39–48. [Google Scholar] [CrossRef]
- Wang, Z.; Duan, C.; Dong, S. Long-term wind and wave energy resource assessment in the South China sea based on 30-year hindcast data. Ocean. Eng. 2018, 163, 58–75. [Google Scholar] [CrossRef]
- Liliana, R.; Florin, O. The performance of some state-of-the-art wave energy converters in locations with the worldwide highest wave power. Renew. Sustain. Energy Rev. 2016, 75, 1348–1362. [Google Scholar]
- Wang, L.; Isberg, J.; Tedeschi, E. Review of control strategies for wave energy conversion systems and their validation: The wave-to-wire approach. Renew. Sustain. Energy Rev. 2018, 81, 366–379. [Google Scholar] [CrossRef]
- Sheng, W. Wave energy conversion and hydrodynamics modelling technologies: A review. Renew. Sustain. Energy Rev. 2019, 109, 482–498. [Google Scholar] [CrossRef]
- Diaconu, S.; Rusu, E. The Environmental Impact of a Wave Dragon Array Operating in the Black Sea. Sci. World J. 2013, 2013, 1–20. [Google Scholar] [CrossRef]
- Weinstein, A.; Fredrikson, G.; Parks, M.J. AquaBuOY-the offshore wave energy converter numerical modeling and optimization. In Proceedings of the Oceans ’04 MTS/IEEE Techno-Ocean ’04 (IEEE Cat. No.04CH37600), Kobe, Japan, 9–12 November 2004; pp. 1854–1859. [Google Scholar]
- Ferri, F.; Ambühl, S.; Fischer, B.; Kofoed, J.P. Balancing Power Output and Structural Fatigue of Wave Energy Converters by Means of Control Strategies. Energies 2014, 7, 2246–2273. [Google Scholar] [CrossRef]
- Liu, Y.; Frangopol, D.M. Time-dependent reliability assessment of ship structures under progressive and shock deteriorations. Reliab. Eng. Syst. Saf. 2018, 173, 116–128. [Google Scholar] [CrossRef]
- Ambühl, S.; Ferri, F.; Kofoed, J.P.; Sørensen, J.D. Fatigue reliability and calibration of fatigue design factors of wave energy converters. Int. J. Mar. Energy 2015, 10, 17–38. [Google Scholar] [CrossRef]
- Màrquez-Dominguez, S.; Sørensen, J.D. Fatigue Reliability and Calibration of Fatigue Design Factors for Offshore Wind Turbines. Energies 2012, 5, 1816–1834. [Google Scholar] [CrossRef]
- Ambühl, S.; Kofoed, J.P.; Sørensen, J.D. Stochastic modeling of long-term and extreme value estimation of wind and sea conditions for probabilistic reliability assessments of wave energy devices. Ocean Eng. 2014, 89, 243–255. [Google Scholar] [CrossRef]
- Ransley, E.; Greaves, D.; Raby, A.; Simmonds, D.; Jakobsen, M.; Kramer, M. RANS-VOF modelling of the Wavestar point absorber. Renew. Energy 2017, 109, 49–65. [Google Scholar] [CrossRef]
- Hohenbichler, M.; Rackwitz, R. First-order concepts in system reliability. Struct. Saf. 1983, 1, 177–188. [Google Scholar] [CrossRef]
- Huang, X.; Li, Y.; Zhang, Y.; Zhang, X. A new direct second-order reliability analysis method. Appl. Math. Model. 2018, 55, 68–80. [Google Scholar] [CrossRef]
- Li, X.; Liu, Z.; Tang, Y.; Gao, X.; Ma, Y.; Tao, S. Reliability analysis of the security and stability control device based on the Monte Carlo method. Energy Procedia 2018, 145, 9–14. [Google Scholar] [CrossRef]
- Payne, G.S.; Taylor, J.R.; Bruce, T.; Parkin, P. Assessment of boundary-element method for modelling a free-floating sloped wave energy device. Part 1: Numerical modelling. Ocean Eng. 2008, 35, 333–341. [Google Scholar] [CrossRef][Green Version]
- Payne, G.S.; Taylor, J.R.; Bruce, T.; Parkin, P. Assessment of boundary-element method for modelling a free-floating sloped wave energy device. Part 2: Experimental validation. Ocean Eng. 2008, 35, 342–357. [Google Scholar] [CrossRef]
- Falcão, A.F.; Cândido, J.J.; Justino, P.A.; Henriques, J.C. Hydrodynamics of the IPS buoy wave energy converter including the effect of non-uniform acceleration tube cross section. Renew. Energy 2012, 41, 105–114. [Google Scholar] [CrossRef]
- Evans, D.V. The Oscillating Water Column Wave-energy Device. IMA J. Appl. Math. 1978, 22, 423–433. [Google Scholar] [CrossRef]
- Bozzi, S.; Miquel, A.M.; Scarpa, F.; Antonini, A.; Archetti, R.; Passoni, G.; Gruosso, G. Wave energy production in Italian offshore: Preliminary design of a point absorber with tubular linear generator. In Proceedings of the 2013 International Conference on Clean Electrical Power (ICCEP), Alghero, Italy, 11–13 June 2013; pp. 203–208. [Google Scholar]
- Antonini, A.; Gaeta, M.A.; Lamberti, A. Wave-induced devices for the oxygenation of deep layer: A physical investigation. In Proceedings of the 33rd International Conference on Coastal Engineering 2012 (ICCE), Santander, Spain, 1–6 July 2012. [Google Scholar]
- Tampier, G.; Grueter, L. Hydrodynamic analysis of a heaving wave energy converter. Int. J. Mar. Energy 2017, 19, 304–318. [Google Scholar] [CrossRef]
- Falnes, J. Ocean Waves and Oscillating Systems; Cambridge University Press: Cambridge, UK, 2002. [Google Scholar]
- Liang, C.; Zuo, L. On the dynamics and design of a two-body wave energy converter. Renew. Energy 2017, 101, 265–274. [Google Scholar] [CrossRef]
- Dorji, U.; Ghomashchi, R. Hydro turbine failure mechanisms: An overview. Eng. Fail. Anal. 2014, 44, 136–147. [Google Scholar] [CrossRef]
- Dulău, M.; Bică, D. Simulation of Speed Steam Turbine Control System. Procedia Technol. 2014, 12, 716–722. [Google Scholar] [CrossRef]
- DNV RP-C203. Fatigue strength analysis of offshore steel structures. Det Norske Veritas. 2001. Available online: https://wenku.baidu.com/view/ce2a55323968011ca300911e.html (accessed on 2 November 2019).
- Choi, S.K.; Grandhi, R.V.; Canfield, R.A. Reliability-Based Structural Design; Springer Science & Business Media: Berlin, Germany, 2006. [Google Scholar]
- Ambühl, S.; Kramer, M.; Sørensen, J.D. Reliability-Based Structural Optimization of Wave Energy Converters. Energies 2014, 7, 8178–8200. [Google Scholar] [CrossRef]
- DNV/Carbon Trust. Guidelines in design and operation of wave energy converters. Det Norske Veritas. 2005. Available online: https://docplayer.net/21805382-Guidelines-on-design-and-operation-of-wave-energy-converters.html (accessed on 2 November 2019).
- Besio, G.; Mentaschi, L.; Mazzino, A. Wave energy resource assessment in the Mediterranean Sea on the basis of a 35-year hindcast. Energy 2016, 94, 50–63. [Google Scholar] [CrossRef]
© 2019 by the authors. Licensee MDPI, Basel, Switzerland. This article is an open access article distributed under the terms and conditions of the Creative Commons Attribution (CC BY) license (http://creativecommons.org/licenses/by/4.0/).

