Abstract
Power grid investment behavior (PGIB) is a necessary prerequisite to ensure safe and reliable power supply. The supervision of PGIB is an important measure to reduce electricity price. It helps to release the dividends of the new power system reform and promote the sustainable development of the power industry. However, for a long time, China’s regulation of PGIB was relatively weak, lacking clear supervision awareness and effective supervision methods. On the basis of clarifying the contents of PGIB supervision, this paper establishes an evaluation index system for the compliance of PGIB from the government supervision perspective, involving four dimensions and 14 secondary indicators. Furthermore, a hybrid evaluation model based on the combined decision-making trial and evaluation laboratory method (DEMATEL-ANP), analytical network process method, and vague set is proposed. The results reveal that the control over cost and efficiency of the PGIB in China is not enough. According to the results, this paper puts forward the indicators that close attention should be paid to and the work priorities in China’s supervision of PGIB, which has certain practical value for the implementation of new power system reform and the sustainable development of Chinese power industry.
1. Introduction
Power grid investment behavior (PGIB) is the core business of power grid enterprises, the basis of the stable operation of power systems, and also an important guarantee for social and economic development. The scientific supervision of PGIB can contribute to rationalizing the transmission and distribution price system, as well as reducing the price of electricity consumption, thereby promoting the optimal allocation of resources and stimulating the vitality of the real economy [1].
In March 2015, a new round reform of power system in China was launched, which established the reform plan of “promoting the marketization of generation and sale side, and strengthening government supervision of the power grid link” [2]. For PGIB, the task of “strengthening the supervision of investment behavior, cost, and investment operating efficiency of power grids” was clearly presented [3]. Since the implementation of the new power reform, the process of the power market construction steadily advanced, and obvious marketization effects was achieved on the power generation side and power sale side [4]. However, the supervision of the monopoly link to the power grid is insufficient [5].
After the new power reform, scholars chose different subjects and perspectives to study the related issues of the development of China’s power industry. There were many studies focused on the marketization of the power industry. Around the theme of irrationality in the electricity pricing mechanism, Reference [6] used the fundamental theory of electricity economics to analyze the pricing methods and the forms of China’s power market with the reform of electric power industry, and pointed out the characteristics and main problems of China’s existing tiered electricity pricing. Reference [7] proposed an inter-regional electricity transaction model to illustrate the new pricing mechanism. Reference [8] constructed transmission reliability indices and a unified cross-regional transmission pricing model based on the cross-regional electricity trading, electrical regime, and price polices in China. There were also many scholars that studied the theme of transaction mode and operation strategy of the power retailers and generators in the electricity market. Reference [9] constructed a master–slave game model considering bilateral contract transactions between multiple generators and large consumers, and gave the solution of Nash equilibrium solution of the game, such that both generators and consumers can benefit from participating in the game. Reference [10] considered China’s new electricity reform and related policies as a prerequisite, carried out a depth analysis of the power generation and sales companies bidding model, and put forward a game strategy of a single sales company and multiple power producers that considered network constraints based on the principle of dark auction in game theory.
In addition to the marketization of power industry, as the main cost of power grid enterprises, PGIB has an important impact on the approval of transmission and distribution prices, which should be strictly monitored by the government. However, at present, whether from the perspective of government or academic research, attention to the supervision of PGIB is relatively limited. Specifically, from the perspective of government functions, the supervision of the electric power industry in China is mainly carried out by the National Development and Reform Commission (NDRC), the State-Owned Assets Supervision and Administration Management Commission of the State Council (SASAC), the National Energy Administration (NEA), and other auxiliary departments. Among them, the SASAC is the owner of the power grid enterprise assets; thus, its supervision aims at maintaining and increasing the value of state-owned assets, and does not involve industrial supervision. As a national macro-control department, the NDRC’s supervision of the power industry is mainly based on industry strategic planning and terminal supervision such as electrovalence, but does not focus on the PGIB. The NEA is responsible for the formulation and implementation of industry specific policies, but there is no systematic regulatory document for the regulation of PGIB. However, the above-mentioned regulatory authorities are yet to form a synergistic supervision of PGIB [11]. In addition, China’s power grid enterprises have high administrative level and monopoly status, which increase the information asymmetry between the government and enterprises, bring many obstacles to the implementation of regulatory policies, and lead to the high cost of power grid enterprises and the difficulty of rationalizing the pricing mechanism of power transmission and distribution [3].
From the perspective of academic research, the studies were mainly related to the macro description and analysis of the current situation and development direction of supervision. Reference [12] pointed out that the current situation of China’s energy legislation could not meet the requirements of coordination of economic, security, and ecological objectives of power regulation. Reference [2] argued that China’s regulatory capacity should be comprehensively enhanced from three aspects: (1) strengthening the incentive supervision of transmission and distribution links, (2) vigilance against market forces, and (3) strengthening the overall planning of electricity reform and environmental policies. The abovementioned researches did not provide a feasible regulatory approach for the supervision of PGIB.
Evaluating the investment behavior of the power grid is an effective way to grasp the actual situation of power grid investment and to implement the regulatory policy. At present, there are many studies on comprehensive evaluation, and the methods of empowerment models and evaluation models are relatively rich. Reference [13] illustrated the application of fuzzy ANP (analytic network process) along with fuzzy cost analysis in selecting research and development (R&D) projects. Reference [14] proposed a new completion method for an incomplete pairwise comparison matrix (iPCM) based on the decision-making and trial evaluation laboratory (DEMATEL) method. Reference [15] proposed a smartphone improvement for promoting the product value to satisfy the customers’ needs with a hybrid a hybrid Multiple Criteria Decision Making (MCDM) model, which combines DANP (DEMATEL-based ANP) and Vlse Kriterijumska Optimizacija Kompromisno Resenje (VIKOR). In Reference [16], the fuzzy comprehensive evaluation theory was adopted for multi-factor assessment of environmental quality in two commercial swine buildings using real measurement data. The above researches lay a good methodological foundation for the study of this paper. However, most of the researches on power grid project evaluation were based on serving enterprise decision-making, and chose a certain angle, such as risk [17,18,19], technology [20,21,22], and economy [23,24,25], to carry out. There is still a lack of relevant research from the perspective of government supervision to assess whether the power grid investment projects are reasonable and whether the cost is compliant, i.e., compliance with PGIB.
From the above literature review, the following can be found:
1) The marketization of the power industry and the supervision of PGIB are both important tasks of China’s new power reform. However, the former was paid more attention, while research on the latter is relatively inadequate.
2) In a limited number of researches on the supervision of PGIB, scholars mainly described the current situation and problems of supervision, but did not propose effective supervision methods.
3) Comprehensive evaluation is an effective way to implement supervision, and researches of the theoretical system are substantial. However, there is a lack of relevant literature to judge whether the PGIB meets the regulatory requirements from the perspective of government supervision.
Therefore, in the context of strengthening the supervision on PGIB, this paper clarifies the content of supervision on investment behavior of power grid, which provides premise hypothesis and evaluation basis for the establishment and application of evaluation model. On this basis, an evaluation index system is constructed, which involves four evaluation dimensions, that is, construction scale, cost level, operating efficiency and investment benefit, which can fully reflect the situation of PGIB. Furthermore, a hybrid evaluation model based on DEMATEL-ANP and vague set techniques is applied to accomplish the evaluation of a certain power grid investment project. On a whole, the contributions of this paper include the following:
1) From the perspective of government supervision, the content of supervision of investment projects is clarified in this paper, and an index system for scientific evaluation of whether the PGIB meets the regulatory requirements is constructed accordingly. The research results can enrich the existing researches on the supervision of PGIB and have certain practical value for the implementation of regulatory policies.
2) By using DEMATEL-ANP and a fuzzy evaluation method based on vague set, a hybrid evaluation model is constructed, which can fully consider the correlation among the indicators, and is applicable to China’s current situation where it is difficult to collect relate information of PGIB.
The rest of this paper is organized as follows: Section 2 describes the concept and content of the supervision of PGIB; Section 3 introduces the evaluation index system and the proposed hybrid evaluation model; Section 4 represents the evaluation results of two certain PGIB projects, and carries out the sensitivity analysis of evaluation results to verify the feasibility and stability of the model; finally, Section 5 summarizes the research contents and findings of this paper.
2. The Concept and Contents of the Supervision of Power Grid Investment Behavior
2.1. The Concept of the Supervision of PGIB
Before China’s Power Industry Reform in 2002, the investment types of power grid enterprises could be divided into two categories: main business investment and auxiliary business investment. The main business refers to the transmission, distribution, and delivery of electric power, and supply-related power services. The auxiliary business refers to non-core businesses relative to the main business. Accordingly, the asset types of power grid enterprises can be roughly divided into three categories, i.e., non-commercial assets, power-assisted enterprises, and diversified enterprises. Among them, non-commercial assets refer to welfare units established within the grid enterprises, such as schools, hospitals, and canteens; power-assisted enterprises include the units of power design, construction, repair, and power equipment manufacturing; diversified enterprises refer to hotels, real estate, and securities that are invested in and operated by power grid enterprises [26,27].
As for PGIB, this paper defines it as the investment behavior for the new construction, expansion, and technical upgrading of power transmission and transformation projects in the monopolistic power grid link, including the planning, equipment acquisition, construction, and operation of power grid projects.
For power grid enterprises, the PGIB is the core business, and enterprises have a relatively great right to independent investment to a certain extent. However, for the whole society, the PGIB is an important guarantee for the safety and reliability of electricity consumption and an important pillar to promote the healthy development of society. Meanwhile, it directly affects the level of electricity price and is a key link to realize the optimal allocation of resources in the whole society. Therefore, it is necessary to supervise the PGIB.
The concept of PGIB supervision is given in this paper; that is, in order to ensure the scientific, rational, and efficient implementation of PGIB, regulators regulate and restrict the PGIB of enterprises according to relevant laws and regulations.
2.2. The Contents of the Supervision of PGIB
The basic function of PGIB is to guarantee power supply. The goal of the new power reform in China is to establish a market system of the power industry, reduce power cost, and rationalize the price formation mechanism [3]. Around the above two points, as a basic task of the power reform in China, the supervision of PGIB should follow three basic principles, i.e., “guaranteeing reliable power supply”, “promoting industry development”, and “releasing the dividend of electricity reform”.
In addition, although the Chinese government is yet to formulate relevant documents on the supervision measures for PGIB, it conducted a spot check on typical PGIB and published a regulatory report. For example, the Supervision Report on Investment Effectiveness of 10 Typical Ultrahigh Voltage (UHV) Alternating Current (AC) Power Grid Projects in Zhejiang and Fujian Province, which was issued by the NEA in April 2018 [28], supervised and reviewed 10 typical PGIB projects in terms of planning implementation, operation effectiveness, and investment efficiency.
Therefore, according to the tasks of the new power reform, the principles of the supervision of PGIB, and the contents of the supervision report issued by the government, this paper clarifies the contents of supervision of PGIB in light of several aspects.
(1) Supervising the scale of power grid investment projects
The reasonable scale of grid investment projects should satisfy the regional load demand, ensure safe and reliable power supply, leave a certain margin for regional economic development and load growth, and not lead to excessive investment, which can avoid the waste of social resources and the increase in power supply costs [29]. To supervise the scale of power grid investment projects, on one hand, governments should manage the investment planning of power grids, so as to make the construction of power grids adapt to economic and social development; on the other hand, governments need to ensure that the grid investment behavior matches grid planning.
In the past, the Chinese government delegated the function of power grid planning to power grid enterprises and third-party organizations, and the government was responsible for examination and approval. As China enters the stage of high-quality development, economic growth is gradually shifting from a scale–speed type to a quality–benefit type. The growth rate of electricity demand exceeds expectations and the elasticity coefficient of electricity fluctuates sharply. In order to ensure the rationality and safety of power grid planning, the government should take the initiative to assume the leadership of power grid planning, and accurately predict power demand [30].
Furthermore, the government should examine and verify the completed power grid projects. Regulators should evaluate whether the project construction matches the power grid planning and whether the project scale matches the local economic and social development.
(2) Supervising investment cost of power grid
Controlling the investment cost of power grids is not only the inherent requirement of improving the efficiency and management of power grid enterprises, but also the necessary premise of forming a scientific and reasonable transmission and distribution pricing system [31].
Because Chinese power grid enterprises have monopoly characteristics, and they invest many auxiliary businesses, the monopoly power extends to competitive sectors. Although a relatively perfect bidding management method was formulated for the construction process of power grid projects, there are many auxiliary power enterprises invested in by power grid enterprises participating in equipment procurement and construction. The monopoly extension of power grid enterprises leads to the market-oriented link transforming into a channel for the transmission of internal interests of power grid enterprises, which leads to the high investment cost of power grids.
Therefore, it is a key content of China’s PGIB supervision to deepen the government supervision of the project construction process, strengthen the supervision of equipment procurement, construction, and other links, and curb the irregularities and uneconomical phenomena in the investment behavior of power grids.
(3) Supervising investment efficiency of power grid
For a long time, China’s power grid enterprises had the motivation to make large investments, and the audit of power grid investment projects was relatively loose. Therefore, it failed to fully consider and actively adapt to the changes in power demand, and paid insufficient attention to the operational efficiency after the completion of the project. Moreover, the government’s supervision of the efficiency of power grid investment was only carried out in some regions, and an effective supervision system is yet to be formed, resulting in the excessive and inefficient PGIB being difficult to contain. For example, Reference [28] clearly pointed out that the maximum power and transmission efficiency of some projects is not up to expectation, and the operating efficiency needs to be further improved.
Based on this, when the power grid project’s construction process is completed and put into operation, it is indispensable to improve the supervision of its operating efficiency. This can help the government more intuitively grasp the basic operation of power grid investment projects and, to a certain extent, reflect the rationality of power grid planning, project investment scale, and transmission and distribution costs.
(4) Supervising investment benefit of power grid
Power grid investment has strong social attributes, and the protection and promotion of regional power supply services is a fundamental value of power grid projects. Therefore, from the perspective of government supervision, evaluating the contribution of grid investment projects to the upgrading of power supply services, regional economic development, and technological progress of the industry is an important part of grid investment benefit supervision.
At the same time, with the rapid growth of new energy generation capacity in China, the phenomena of water abandonment, wind abandonment, and light abandonment became important problems to be solved urgently for the high-quality development of the power industry. Therefore, the contribution of power grid project construction to new energy consumption also became another important part of current power grid investment benefit supervision.
3. Evaluation Model of Power Grid Investment Behavior
3.1. Constructing the Evaluation Index System
Based on the above analysis, this paper constructs an evaluation index system for evaluating the compliance of PGIB from the perspective of government regulation by selecting four dimensions, i.e., project construction scale, project cost level, project operating efficiency, and project investment benefit, as shown in Table 1.

Table 1.
Power grid investment behavior (PGIB) compliance evaluation index system.
According to Table 1, in the dimension of project construction scale, considering the intrinsic relationship between social and economic development and the scale of power grid construction, and the matching degree between the actual situation of project construction and power grid planning [32], this paper designs three indicators: matching degree with power grid planning, demand degree of project construction, and reasonable degree of project scale. In view of the dimension of project cost level, on the one hand, this paper pays attention to financial norms and chooses two indicators: project cost normative index and single cost expenditure normative index. On the other hand, from the perspective of cost leanness, two indicators are designed, namely, project cost-saving index and maintenance cost-saving index [33], so as to stimulate grid companies to reduce investment costs by comparing project costs with the average level of society. In the project operating efficiency dimension, three indicators are selected: annual equivalent average load rate, annual maximum load rate, and power supply reliability rate [34]. Furthermore, the project investment benefit dimension mainly focuses on four indicators: contribution degree of power supply service promotion, contribution degree of regional economic development, contribution degree of industrial development progress, and contribution degree of new energy absorption [35,36].
The index system established above is in agreement with the contents of PGIB supervision, and is consistent with the focus of the government on PGIB in Reference [28]. The four primary indicators, from the perspective of scale, cost, efficiency, and benefit, realize the supervision of investment planning, project construction, and operation of PGIB. At the same time, there is a certain correlation among the indicators. For example, when the project construction scale is much larger than the demand, the load rate of the project will be reduced, thus limiting its operation efficiency. Moreover, when the project cost is too high, the transmission and distribution price will be raised, which will affect the power supply service promotion and other benefit indicators.
3.2. Indicator Weight Determination Method Based on DEMATEL-ANP
Based on the certain correlations among the four primary indicators in the above index system. The improved ANP method (DEMATEL-ANP combination weighting method) is used to determine the weight of each index [37]. Specifically, the DEMATEL method is used to determine the correlations between the indicators before using ANP method to determine the indicator weights [38]. Subsequently, the ANP networks are constructed and the weight can be solved by ANP method, which can overcome the subjectivity of the traditional ANP method, and improve the objectivity and reliability of the weight results [39]. The specific steps are as follows:
Step 1: Judge the degree of interaction between the primary indicators. Numbers 0–4 are used to indicate the influence degree of the primary indicators [40]. Number 0 means no influence, and number 4 means great influence. On this basis, the direct influence matrix is constructed, where represents the influence degree of the first-level index on, ,.
Step 2: Calculate the standard influence matrix. According to the direct influence matrix , the standard influence matrix is obtained as follows:
The comprehensive influence matrix reflects the causality of the primary indexes in the whole system [37], and the specific calculation methods are as follows:
where is the unit matrix.
Step 3: Calculate the centrality and causality of the indicators. On the basis of obtaining the comprehensive influence matrix , the sum of elements in each row of is defined as the influence degree , and the sum of elements in each column of is the influence degree of the corresponding index [41]. The calculation formulas are as follows:
Furthermore, is defined as the centrality of the indicator, which indicates the position and function of the system. Similarly, is defined as the causality of the indicator to judge the interaction between the indicator and other indicators in the system. If the value of is positive, it means that the indicator has a greater impact on other indicators; thus, it is called the cause factor. If the value of is negative, it means that the element is greatly affected by other indicators; thus, it is called the result factor.
Step 4: Draw causality diagram of primary indicators based on the values of and, which can clearly identify the relationship between first-level indicators and their importance [37].
Step 5: Draw ANP network structure according to causality diagram and combine with the actual situation of secondary indicators. The ANP network structure consists of a control layer and network layer. The control layer includes the target layer and criterion layer. The network layer is composed of element sets (primary indicators) and elements (secondary indicators) dominated by the control layer. Each element set is not independent, and the elements dominate each other.
Step 6: Construct judgment matrix. Assuming that, in the ANP network structure, the criterion of target G in the control layer is , and the network layer contains elements sets , the judgment matrix is constructed under the criterion . Control layer elements () are taken as the criteria, and the element in is taken as the sub-criteria; then, the indicators in the element set are compared according to the degree of influence on . On this basis, the normalized eigenvector can be obtained, which is called the sort vector of network elements. The above steps are repeated for to get matrix as shown below.
Step 7: Calculate weighted supermatrix. The interacting sorting vectors of all network layer elements are combined with supermatrix , which is under the criteria. The weighted supermatrix is obtained by normalizing each column of . In the weighted supermatrix, the sum of each column element is 1. Then, the supermatrix is stabilized, and the limit relative ranking vector is calculated: . If the limit converges and the result is unique, column is the limit relative order of each element in the network layer corresponding to element under the criterion, i.e., the weight value of each element relative to the highest objective.
3.3. Fuzzy Comprehensive Evaluation Based on Vague Set
Fuzzy comprehensive evaluation mainly uses the principle of fuzzy transformation and maximum membership degree to deal with the evaluation index quantitatively. The fuzzy comprehensive evaluation method relatively does not rely on prior data [42]. The PGIB compliance evaluation index system conducted in this paper contains some qualitative indicators, and the detailed data of the current PGIB are mostly grasped by the power grid enterprises, shown as a “black box” to the outside world. In addition, the membership degree of traditional fuzzy theory does not satisfy additivity, and it is easy to lose intermediate information by taking large or small operations, which leads to the distortion of evaluation results. Therefore, this paper chooses a fuzzy comprehensive evaluation method based on vague set.
Vague set is an extension of fuzzy set. Fuzzy set extends the concept of membership to the [0, 1] interval, but the theory of vague set holds that the membership of every element can be divided into two aspects: support and opposition, that is, true membership and false membership [43]. Assuming that is a universe and represents any element, a vague set in can be represented by a true membership function and a false membership function . Furthermore, is the lower bound of the membership degree of derived from the evidence supporting , is the lower bound of the negative membership degree of derived from the evidence opposing , and the uncertainty part is . Then, and can relate the real number in the interval [0, 1] to each element in , i.e., , .
For the convenience of discussion, this paper records as and as , i.e., . If , the vague set degenerates into a fuzzy set; if or , the vague set degenerates into a normal set [44]. Specifically, the steps to evaluate the investment behavior of the power grid by using the fuzzy comprehensive evaluation method based on vague set are as follows:
Step 1: Set a corresponding evaluation statement rating for each evaluation indicator of PGIB compliance. Referring to the purpose of evaluating the compliance of PGIB, this paper conducts the corresponding commentary set , which contains five grades: (1) completely meets supervision requirements; (2) relatively meets supervision requirements; (3) barely meets supervision requirements; (4) relatively cannot meet supervision requirements; (5) completely cannot meet supervision requirements. Meanwhile, a certain number of experts are invited to choose appropriate linguistic variables to express their opinions.
Step 2: Construct the evaluation matrix of the vague set. Experts are invited to judge each indicator according to the given commentary set. If is used to represent any of them, and the commentary set is , the evaluation matrix based on vague set between the evaluation index system and the commentary set can be constructed.
In the formula, denotes the vague value of the commentary rating corresponding to the indicator , and . Then, relevant experts are organized to select each index according to the commentary set. In order to express the hesitation degree of experts more truthfully, experts are allowed to abstain. For example, 10 experts evaluate a certain index . If six experts think it can completely meet supervision requirements, two experts think it can relatively meet supervision requirements, one expert thinks it can barely meet supervision requirements, and one expert gives up evaluation, then can be . The vague evaluation of all indicators can be obtained accordingly, and then the vague set evaluation matrix of the whole index system can be constructed.
Step 3: Carry out the comprehensive evaluation based on the vague set according to the weight of the index system and the evaluation matrix of the vague set. Firstly, two basic operational formulas on vague set are introduced: multiplication and finite operation.
Assuming that is a real number in the interval [0, 1], and that and B are both elements of the vague set, , , then the following applies:
In the formulas, is the operation symbol of multiplication of vague set matrices, and is the finite operation symbol of the vague set. The comprehensive evaluation results based on vague set are as follows:
In the formulas, is the comprehensive evaluation result based on vague set and is the vague value of the commentary rating corresponding to the evaluation object [45].
Step 4: Judge the evaluation results according to the principle of maximum degree of membership. Since the vague value is an interval number, the relative scoring function can be used as the ranking rule of the membership degree of vague set. The formula is as follows:
Intuitively speaking, without considering abstention, as the proportion of the object to be evaluated under a certain evaluation grade () in all cases increases, so does the probability that the subject to be evaluated belongs to the commentary rating. If, considering the influence of the abstention part, the above formula shows that the abstention part is subdivided infinitely according to the ratio of , then the unknown information does not affect the judgement of the evaluation object according to the membership degree of the commentary rating.
4. Case Study
4.1. Overview of the Cases
In order to better verify the applicability of the above evaluation model, this paper selected two power grid investment projects. Project 1 was the Xi-Zhe power grid project in Reference [28], and Project 2 was a power transmission and transformation project in Shanxi Province.
Project 1 was an ultra-high voltage project put into operation in 2014. The investment amount approved by the government was 23.855 billion yuan, the estimated investment of the project was 19.693 billion yuan, and the actual investment was 18.388 billion yuan.
Project 2 was a power transmission and transformation project. The total investment amount was 65.98 million yuan, and its construction included three sub-projects, i.e., the new construction of a 110-kV substation (include two new 40-MVA main transformers, two 110-kV outgoing lines, two 35-kV outgoing lines, six 10-kV outgoing lines, and four 10-MVar shunt capacitors), the 110-kV line project (include 46.4-km 110-kV lines and 142 power poles), and the supporting communication engineering (include 49.3-km optical cables). In the construction, the project adopted the 110-C-8 general substation design scheme of the State Grid Corporation, and it was located in mountainous and hilly areas with an elevation between 900 m and 1600 m, where transportation conditions are not good.
The PGIB projects were relatively large, and there were great uncertainties and incompleteness in the acquisition of indicator data that affected the evaluation results. Therefore, in order to ensure the smooth implementation of the evaluation work, this paper conducted a questionnaire survey of experts in related fields to verify and analyze the abovementioned PGIB compliance evaluation model.
4.2. The Results of Indicator Weight
For the above two items, the index weight was the same. Firstly, the relationship between the primary indicators in the index system established in this paper was analyzed using the DEMATEL method. For the four primary indicators proposed in this paper, according to expert judgment, the direct impact matrix was given as follows:
According to Equations (1) and (2), the comprehensive influence matrix could be calculated as follows:
The centrality () and causality () of the primary indicators are shown in Table 2.
Table 2.
The centrality and causality of the primary indicators.
From the comprehensive matrix T and Table 2, it can be seen that there was an influence relationship between the primary indicators in the evaluation index system constructed in this paper. The indicators project construction scale and project cost level were the cause factors, and their impacts on other indicators were greater than the impacts received by other indicators. Conversely, project operating efficiency and project investment benefit were the result factors, and their impacts on other indicators were less than the impact received by other indicators. Based on this, the causality diagram of primary indicators could be drawn, and the interaction among the four first-level indicators is shown in Figure 1 [46].
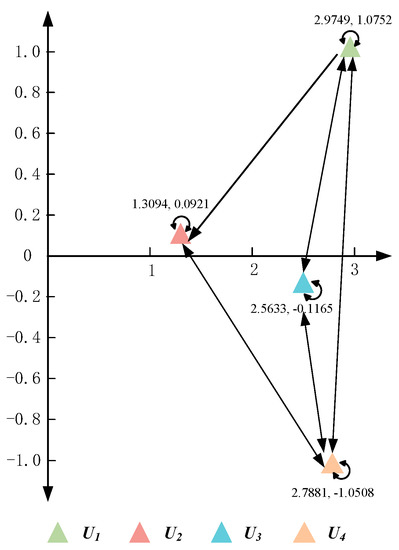
Figure 1.
The correlation between the primary indicators.
According to the causality diagram of the primary indicators and the actual situation of secondary indicators, the ANP network structure could be drawn as shown in Figure 2 (the interaction among indicators is specified in Table A1, Appendix A). Then, the weight coefficients of all secondary indicators could be calculated using the Super Decision software, as shown in Table 3.
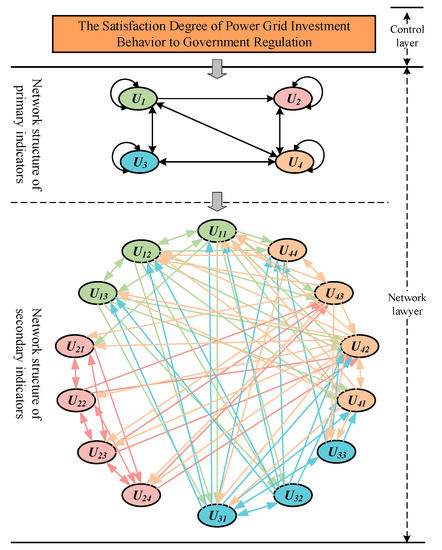
Figure 2.
Network hierarchy of the index system.
Table 3.
Analytic network process (ANP) weight results of the secondary indicator.
From the weight results in Table 3, it can be seen that, among the 14 secondary indicators, the indicators whose weight value was more than 0.1 were as follows: annual equivalent average load rate (0.1430) and construction cost social deviation index (0.1134); those whose weight value was between 0.08 and 0.1 were as follows: matching degree with power grid planning (0.0843), demand degree of project construction (0.0920), and contribution degree of regional economic development (0.0857). Analysis of the above results showed that weights of primary indicators project cost level, project construction scale, and project operating efficiency were more than the weight of project investment benefit, indicating that the investment scale, investment cost, and operational efficiency of PGIB was more valued from the perspective of government supervision.
4.3. Fuzzy Evaluation Results Based on Vague Sets
4.3.1. Fuzzy Evaluation Results of Project 1
For the selected power grid investment projects, this paper invited relevant officials, scholars, and experts from government regulatory agencies, universities, professional research institutions, and project construction units to give the vague evaluation values from the perspective of government supervision.
In this paper, a total of 20 experts in related fields were invited (the expert information is shown in Table A2, Appendix A), and each expert gave a satisfaction degree rating of the selected projects to the regulatory requirements of each evaluation indicator. Among them, as mentioned above, the project’s satisfaction degree rating was divided into five levels: completely meets supervision requirements (), relatively meets supervision requirements (), barely meets supervision requirements (), relatively cannot meet supervision requirements (), and completely cannot meet supervision requirements (). On this basis, considering the evaluation results given by all experts, the vague evaluation of each indicator could be constructed.
Project 1 was firstly taken an example. For the evaluation index in sub-evaluation index system , four experts thought that Project 1 completely met supervision requirements, nine experts thought that the project relatively met supervision requirements, four experts thought that the project barely met supervision requirements, one expert thought that the project relatively could not meet supervision requirements, no expert thought that the project completely could not meet supervision requirements, and two experts abstained. According to the construction rule of vague set, the corresponding vague value evaluation of the index would be: .
Similarly, the vague evaluation of all indicators in the evaluation index system could be obtained, and the vague set evaluation matrix of the evaluation index system could be formed, as shown in Table 4 (the expert evaluation results of secondary indicators are shown in Table A3, Appendix A).
Table 4.
Vague value of secondary indicators (Project 1).
According to Equations (7)–(10), the weighted vague commentary of each indicator of the index system could be obtained by multiplying the evaluation matrix based on the vague set in Table 4 with the weight of the index system. Then, the vague commentary on each satisfaction degree rating of Project 1 for the regulatory requirements could be calculated through the finite sum calculation, as shown in Table 5.
Table 5.
Comprehensive evaluation result of vague value (Project 1).
According to the evaluation results in Table 5 and the scoring function given by Equation (11), the scoring value of the corresponding commentary rating could be obtained as , , , 0.2481, and , where it can be seen that . Therefore, the evaluation result of this power grid investment project was “barely meets supervision requirements”.
Specifically, as shown in Table 6, in the dimension of project construction scale, , , , , and 0.0047, it can be seen that . Therefore, the evaluation result of the dimension of project construction scale was “relatively meets supervision requirements”. In the dimension of project cost level, , 0.0842, , 0.0572, and 0.0154, it can be seen that . Therefore, the evaluation result of the dimension of project cost level was “barely meets supervisory requirements”. In the dimension of project operating efficiency, , , , , and , it can be seen that . Therefore, the evaluation result of the dimension of project operating efficiency was “relatively cannot meet supervision requirements”. In the dimension of project investment benefit, , , , , and 0.0089, it can be seen that . Therefore, the evaluation result of the dimension of project investment benefit was “rarely meets supervisory requirements”.
Table 6.
The evaluation rating of each evaluation dimension (Project 1).
In conclusion, from the perspective of government supervision, the overall evaluation result of Project 1 was “barely meets supervision requirements”. The reason for this evaluation result was that the evaluation result of the dimension of project operating efficiency was “relatively cannot meet supervision requirements”. In the regulatory report released by the government, it was pointed out that the utilization hours of the Project 1 were low, and there were outages during operation. Therefore, the evaluation result in this paper is consistent with the description of Project 1 in the regulatory report.
4.3.2. Fuzzy Evaluation Results of Project 2
Similar to the evaluation process of Project 1, the vague set evaluation matrix of the evaluation index system could be formed, as shown in Table 7 (the expert evaluation results of secondary indicators are shown in Table A4, Appendix A).
Table 7.
Value of secondary indicators (Project 2).
Then, vague commentary on each satisfaction degree rating of Project 2 for the regulatory requirements could be calculated through the finite sum calculation, as shown in Table 8.
Table 8.
Comprehensive evaluation result of Vague value (Project 2).
According to the evaluation result in Table 8, the scoring value of the corresponding commentary rating could be obtained as , , , 0.1414, and , where it can be seen that . Therefore, the evaluation result of this power grid investment project was “relatively meets supervisory requirements”.
Specifically, as shown in Table 9, in the dimension of project construction scale, , , , 0.0327, and 0.0218, it can be seen that . Therefore, the evaluation result of the dimension of project construction scale was “completely meets supervision requirements”. In the dimension of project cost level, , 0.1004, , 0.0437, and 0.0091, it can be seen that . Therefore, the evaluation result of the dimension of project cost level was “barely meets supervisory requirements”. In the dimension of project operating efficiency, , , , , and , it can be seen that . Therefore, the evaluation result of the dimension of project operating efficiency was “relatively meets supervision requirements”. In the dimension of project investment benefit, , , 0.0487, , and 0.0086, it can be seen that . Therefore, the evaluation result of the dimension of project investment benefit was “relatively meets supervisory requirements”.
Table 9.
The evaluation rating of each evaluation dimension (Project 2).
According to the evaluation result, as a small-scale PGIB project, the construction scale of Project 2 was well controlled, but the project cost control rarely met the regulatory requirements of the government. This proves the reason for the Chinese government taking Shanxi Province as the pilot of transmission and distribution price reform to strictly control the investment cost of PGIB.
4.4. Sensitivity Analysis
In this part, a sensitivity analysis was carried out to measure the impact of changes in the expert evaluation of key indicators on the final evaluation results. In order to display the results of sensitivity analysis more intuitively, different satisfaction degree ratings were assigned corresponding scores, as shown in Table 10.
Table 10.
The score of different satisfaction degree rating.
Then, the evaluation result of Project 2 could be quantified as follows:
According to Equation (12), can be calculated as.
Three secondary indicators with the largest weights were selected, that is, U12, U23, and U31, and then the expert evaluation result of the corresponding indicators (see Table A3, Appendix A) was adjusted as follows:
(1) Let , (if , let ), and calculate the final evaluation score ;
(2) Let , (if , let ), and calculate the final evaluation score ;
(3) Let , (if , let ), and calculate the final evaluation score ;
(4) Let , (if , let ), and calculate the final evaluation score ;.
(5) Let , (if , let ), and calculate the final evaluation score ;
(6) Let , (if , let ), and calculate the final evaluation score .
The final evaluation score of each scheme is shown in Table 11, and the sensitivity diagram of selected secondary indicators is described in Figure 3.
Table 11.
The score value of each scheme (Project 2).
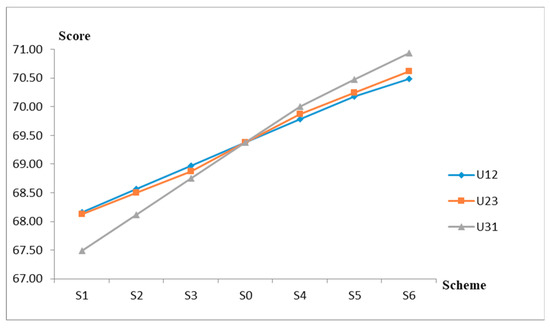
Figure 3.
Sensitivity diagram of selected secondary indicators.
According to Figure 3, among the three secondary indicators selected, U31 had the most obvious impact on project evaluation results, followed by U23 and U12. The result of the sensitivity analysis was consistent with the weight of the secondary indicators, which verifies the applicability and stability of the model.
5. Conclusions
With the further advancement of China’s electric power system reform, it will be an urgent task to promote the healthy development of the electric power industry and the high-quality development of social economy to strengthen the government’s supervision of the power grid. From the perspective of government supervision, according to the task of power system reform and the concerned contents in the government supervision report, this paper clarified the contents of the supervision of PGIB. Then, an index system for evaluating the PGIB was constructed, which involved four dimensions called project construction scale, project cost level, project operating efficiency, and project investment benefit. On this basis, a fuzzy comprehensive evaluation model based on DEMATEL-ANP and vague set techniques was developed, so as to provide a methodological reference for the government to implement the task of power grid investment supervision.
Application of the evaluation model was examined in the case study of typical PGIB projects of China, and the stability of the model was verified by sensitivity analysis. According to the empirical results, the two projects mentioned above could both meet the requirements of government regulation in the construction scale, but needed to be improved in the investment cost and operation efficiency. Problems reflected in the evaluation results basically conformed to the overall situation of the current PGIB in China, which is characterized by high cost and low efficiency.
Compared with previous research, this paper provided an evaluation model for the government's supervision of PGIB from the perspective of methodology. The index system constructed in this paper can cover all aspects of PGIB. The DEMATEL-ANP weight determination method can fully reflect the correlation among scale, cost, efficiency, and benefit of PGIB. The fuzzy comprehensive evaluation model can effectively deal with the current situation where the government and society do not grasp the specific data of PGIB. The evaluation model conducted in this paper can reflect whether the PGIB project meets the supervision requirements, and provide guidance for the government’s next supervision work. However, at the same time, it also has some limitations, which are described below.
Firstly, due to the insufficiency of the policy documents on the supervision of PGIB, there were many qualitative indicators in the index system established in this paper. With the continuous improvement of regulatory policies, the index system can be expanded and enriched. For example, according to different voltage levels and project types, the corresponding indicators and calculation methods can be formulated; through the project investment data, the evaluation indicators of project bidding process and construction process can be refined to restrict the internal benefit transmission of monopoly power grid enterprises, and the quantitative indicators can be added to make the evaluation results more objective.
Secondly, the method of fuzzy comprehensive evaluation employed in this paper was adapted to the current phenomenon of insufficient information related to the investment behavior of power grids in China. However, its evaluation result was greatly influenced by experts, and the objectivity and accuracy were limited compared with the quantitative evaluation method. Moreover, it played a limited role in guiding the deep implementation and the specific work of the supervision of PGIB. With the continuous completion of regulatory data, the quantitative evaluation method for the supervision of PGIB can be researched, for example, using the matter-element extension method and linear weighting method to further improve the accuracy of the single project evaluation result. In addition, the Technique for Order Preference by Similarity to an Ideal Solution (TOPSIS) method and VIKOR method can be used to evaluate multiple PGIB projects, so as to provide a reference for government departments to formulate incentive policies
Lastly, the evaluation model in this paper, as well as the case study results, can provide some method support for the government to strengthen the supervision of PGIB, allowing supervision work to be carried out. Specifically, the government should put forward supervision measures, and conduct a general survey of PGIB to carry out statistical analysis of the basic information.
In summary, the government should strengthen the supervision of PGIB as soon as possible, and curb the over-investment and inefficient investment. Furthermore, with the gradual improvement of the government’s supervision of PGIB, it will be of great value to research more precise evaluation methods for further improving the level of government supervision, so as to promote the healthy development of the power industry.
Author Contributions
All authors contributed to this paper. Y.L. (Yanbin Li) and Y.L. (Yun Li) initiated the project and provided guidance for the methods; F.Z. and B.L. conceptualized and designed the research method used in this paper; F.Z. performed the empirical analysis and wrote the paper; Z.L. was responsible for the investigation and expansion of the literature review.
Funding
This paper was supported by the Beijing social science foundation research base project (Grant No. 17JDGLA009), the President fund of China national institute of standardization (Grant No. 572019Y-6774), the Fundamental Research Funds for the Central Universities under No. 2019QN075, and the “Natural Science Foundation of China Project” (Grant No. 71471058).
Acknowledgments
This paper was supported by the Beijing Key Laboratory of New Energy and Low-Carbon Development (North China Electric Power University), Beijing.
Conflicts of Interest
The authors declare no conflicts of interest.
Appendix A
Table A1.
Influence relationship among secondary indicators.
Table A1.
Influence relationship among secondary indicators.
| Secondary Indicator | Influence Relationship | |
|---|---|---|
| U11 | ,,,,,,,, | ,,,,,,, |
| U12 | ,,,,,,, | ,,,,,,, |
| U13 | ,,,,, | ,,,,, |
| U21 | ,, | ,,,, |
| U22 | ,,,, | ,,, |
| U23 | ,,,, | ,,,, |
| U24 | ,,,,, | ,,,, |
| U31 | ,,,,,,, | ,,,,,,, |
| U32 | ,,,,,, | ,,, |
| U33 | ,, | ,,, |
| U41 | ,,,,, | ,,,,,, |
| U42 | ,,,,,,,,, | ,,,,,,,,,, |
| U43 | ,,,,,, | ,,,,, |
| U44 | ,,, | ,,,,, |
Table A2.
Expert information. NDRC—National Development and Reform Commission; SASAC—State-Owned Assets Supervision and Administration Management Commission of the State Council; NEA—National Energy Administration; CEC—China Electricity Council; EPPEI—China Electric Power Planning and Engineering Institute.
| Expert Code | Information | |
|---|---|---|
| Work Unit | Work/Research Field | |
| Tsinghua University | Electrical Engineering and Automation | |
| Tsinghua University | Electrical Engineering and Automation | |
| North China Electric Power University | Technical Economics | |
| North China Electric Power University | Technical Economics | |
| North China Electric Power University | Project Management | |
| North China Electric Power University | Energy Policy | |
| NDRC | Energy Policy | |
| NDRC | Energy Policy | |
| NDRC | Electricity Price Supervision | |
| SASAC | Asset Management of Power Grid Enterprises | |
| SASAC | Asset Management of Power Grid Enterprises | |
| NEA | Electricity Price Supervision | |
| NEA | Energy System and Law | |
| NEA | Energy System and Law | |
| CEC | Electricity Law | |
| CEC | Standard of Electric Power Industry | |
| CEC | Standard of Electric Power Industry | |
| EPPEI | Power Grid Planning | |
| EPPEI | Power Grid Planning | |
| EPPEI | Standardization of Electric Power Planning and Design | |
Table A3.
Expert evaluation results of secondary indicators.
Table A3.
Expert evaluation results of secondary indicators.
| Primary Indicator | Secondary Indicator | The Number of Experts | |||||
|---|---|---|---|---|---|---|---|
| NV1 | NV2 | NV3 | NV4 | NV5 | Abstention | ||
| U1 | U11 | 4 | 9 | 4 | 1 | 0 | 1 |
| U12 | 3 | 7 | 5 | 2 | 1 | 2 | |
| U13 | 3 | 8 | 6 | 2 | 0 | 1 | |
| U2 | U21 | 6 | 7 | 5 | 1 | 0 | 1 |
| U22 | 1 | 3 | 6 | 7 | 2 | 1 | |
| U23 | 3 | 6 | 8 | 2 | 0 | 1 | |
| U24 | 2 | 4 | 6 | 4 | 2 | 2 | |
| U3 | U31 | 0 | 3 | 6 | 8 | 2 | 1 |
| U32 | 0 | 2 | 7 | 8 | 2 | 1 | |
| U33 | 0 | 0 | 6 | 9 | 4 | 1 | |
| U4 | U41 | 1 | 2 | 8 | 8 | 0 | 1 |
| U42 | 2 | 4 | 7 | 5 | 1 | 1 | |
| U43 | 2 | 5 | 7 | 2 | 2 | 2 | |
| U44 | 2 | 6 | 6 | 3 | 1 | 2 | |
Table A4.
Expert evaluation results of secondary indicators.
Table A4.
Expert evaluation results of secondary indicators.
| Primary Indicator | Secondary Indicator | The Number of Experts | |||||
|---|---|---|---|---|---|---|---|
| NV1 | NV2 | NV3 | NV4 | NV5 | Abstention | ||
| U1 | U11 | 5 | 4 | 4 | 3 | 2 | 2 |
| U12 | 6 | 5 | 4 | 3 | 2 | 1 | |
| U13 | 5 | 4 | 4 | 3 | 2 | 2 | |
| U2 | U21 | 3 | 5 | 8 | 2 | 1 | 1 |
| U22 | 4 | 9 | 4 | 2 | 0 | 1 | |
| U23 | 1 | 3 | 9 | 3 | 1 | 3 | |
| U24 | 1 | 8 | 6 | 3 | 0 | 2 | |
| U3 | U31 | 4 | 7 | 4 | 2 | 1 | 2 |
| U32 | 3 | 9 | 4 | 2 | 0 | 2 | |
| U33 | 6 | 8 | 4 | 1 | 0 | 1 | |
| U4 | U41 | 2 | 8 | 3 | 4 | 1 | 2 |
| U42 | 4 | 7 | 3 | 2 | 1 | 3 | |
| U43 | 1 | 4 | 9 | 4 | 0 | 2 | |
| U44 | 1 | 2 | 11 | 3 | 1 | 2 | |
References
- Yang, S. Some Understandings on the Supervision of Power Grid Investment. China Energy News, 19 June 2017. [Google Scholar]
- Zhen, X.; Wu, S. Supervision Capacity Building in Electric Power System Reform: Necessity and Measures. Price: Theory Pract. 2018, 1, 10–14. [Google Scholar]
- National Development and Reform Commission. Some Opinions on Further Deepening the Reform of Electric Power System. Available online: http://tgs.ndrc.gov.cn/zywj/201601/t20160129_773852.html (accessed on 15 March 2015).
- China Daily. Great Strides in the Marketization of Electric Power. Available online: http://www.xinhuanet.com//2018-07/19/c_1123146635.htm (accessed on 19 July 2018).
- Why Is It Difficult to Curb Excessive and Inefficient Grid Investment? Available online: http://www.sohu.com/a/151067323_244948 (accessed on 22 June 2017).
- Wang, C.; Zhou, K.; Yang, S. A review of residential tiered electricity pricing in china. Renew. Sustain. Energy Rev. 2017, 79, 533–543. [Google Scholar] [CrossRef]
- Peng, X.; Tao, X. Cooperative game of electricity retailers in China’s spot electricity market. Energy 2018, 145, 152–170. [Google Scholar] [CrossRef]
- Huang, H.; Yang, D.; He, M. Unified Transmission Pricing Model for Cross-regional Electricity Trading Considering Reliability. Autom. Electr. Power Syst. 2017, 41, 51–59. [Google Scholar]
- Wu, C.; Gao, B.; Tang, Y.; Wang, Q. Master-slave Game Based Bilateral Contract Transaction Model for Generation Companies and Large Consumers. Autom. Electr. Power Syst. 2016, 40, 56–62. [Google Scholar]
- Zhou, X.; Gao, Y.; Yang, W.; Guo, S. Bidding strategy of electricity market considering network constraint in new electricity improvement environment. J. Eng. 2017, 2017, 1640–1645. [Google Scholar] [CrossRef]
- Wang, W. Reform Path of China’s Electricity Regulatory System under New Power Reform. J. Party Sch. Cent. Comm. C.P.C 2016, 20, 108–112. [Google Scholar]
- Zhang, Z. Dimensions of Ecological Objectives of Energy Regulation and the Legal Expression—Centered on Power Regulation. Forensic Stud. 2018, 35, 84–93. [Google Scholar]
- Mohanty, R.P.; Agarwal, R.; Choudhury, A.K.; Tiwari, M.K. A fuzzy ANP-based approach to R&D project selection: A case study. Int. J. Prod. Res. 2005, 43, 5199–5216. [Google Scholar]
- Zhou, X.; Yong, H.; Yong, D.; Chan, F.T.S.; Ishizaka, A. A DEMATEL-based completion method for incomplete pairwise comparison matrix in AHP. Ann. Oper. Res. 2018, 271, 1045–1066. [Google Scholar] [CrossRef]
- Hu, S.; Lu, M.; Tzeng, G. Exploring smart phone improvements based on a hybrid MCDM model. Expert Syst. Appl. 2014, 41, 4401–4413. [Google Scholar] [CrossRef]
- Xie, Q.; Ni, J.Q.; Su, Z. Fuzzy comprehensive evaluation of multiple environmental factors for swine building assessment and control. J. Hazard. Mater. 2017, 340, 463–471. [Google Scholar] [CrossRef] [PubMed]
- Aldeen, M.; Saha, S.; Alpcan, T.; Evans, R.J. New online voltage stability margins and risk assessment for multi-bus smart power grids. Int. J. Control 2015, 88, 1338–1352. [Google Scholar] [CrossRef]
- Lin, Z.; Pan, K.; Zhou, M.; Zhou, M.; Tan, D.; Bai, H. Risk Assessment Model and Method of Urban Distribution Network Considering Real-time and Potential Factors. Autom. Electr. Power Syst. 2017, 41, 48–55. [Google Scholar]
- Rao, R.; Zhang, X.; Shi, Z.; Luo, K.; Tan, Z.; Feng, Y. A Systematical Framework of Schedule Risk Management for Power Grid Engineering Projects’ Sustainable Development. Sustainability 2014, 6, 6872–6901. [Google Scholar] [CrossRef]
- Fan, W.; Ping, H.; Liu, Z. Multi-attribute node importance evaluation method based on Gini-coefficient in complex power grids. IET Gener. Transm. Distrib. 2016, 10, 2027–2034. [Google Scholar]
- Saeh, I.S.; Mustafa, M.W.; Mohammed, Y.S.; Almaktar, M. Static Security classification and Evaluation classifier design in electric power grid with presence of PV power plants using C-4.5. Renew. Sustain. Energy Rev. 2016, 56, 283–290. [Google Scholar] [CrossRef]
- Ye, S.; Wei, G.; Ma, L.; Zhang, Y. Power Supply Capacity Evaluation of DC Distribution Network with Distributed Generation. Autom. Electr. Power Syst. 2017, 9, 58–64. [Google Scholar]
- He, Y.; Liu, W.; Jiao, J.; Guan, J. Evaluation method of benefits and efficiency of grid investment in China: A case study. Eng. Econ. 2018, 63, 66–86. [Google Scholar] [CrossRef]
- Adefarati, T.; Bansal, R.C. Reliability and economic assessment of a microgrid power system with the integration of renewable energy resources. Appl. Energy 2017, 206, 911–933. [Google Scholar] [CrossRef]
- Cao, Y.; Wang, X.; Li, Y.; Tan, Y.; Xing, J.; Fan, R. A comprehensive study on low-carbon impact of distributed generations on regional power grids: A case of Jiangxi provincial power grid in China. Renew. Sustain. Energy Rev. 2016, 53, 766–778. [Google Scholar] [CrossRef]
- The State Council. Circular of the State Council on the Reform Plan of Printing Power System. Available online: http://www.gov.cn/zhengce/content/2017-09/13/content_5223177.htm (accessed on 10 February 2015).
- Polaris Power Net. The Core of Electric Power System Reform: Separation of Main and Secondary. Available online: http://news.bjx.com.cn/html/20120806/378313.shtml (accessed on 6 August 2012).
- Nation Energy Administration. Supervision Report on Investment Effectiveness of 10 Typical UHV AC Power Grid Projects in Zhejiang and Fujian Province. Available online: http://zfxxgk.nea.gov.cn/auto92/201804/t20180408_3138.htm (accessed on 5 March 2018).
- Li, X.; OuYang, L.; Zhu, X.; Li, P.; Peng, G. Application of GRA in distribution network building size evaluation. J. Electr. Power Sci. Technol. 2007, 22, 61–66. [Google Scholar]
- Luo, Y.; Li, Y. Comprehensive Decision-Making of Transmission Network Planning Based on Entropy Weight and Grey Relational Analysis. Power Syst. Technol. 2013, 37, 77–81. [Google Scholar]
- Mo, J.; Zhou, J. Cost Analysis and Control in the Whole Process of Capital Construction in Power Grid Enterprises. Enterp. Manag. 2017, 2, 71–72. [Google Scholar]
- Li, X.; Peng, G.; Zhu, X.; OuYang, L. Fuzzy Synthetic Evaluation Method of Planning Size of Distribution Grid. Proc. Csu-Epsa 2008, 20, 70–77. [Google Scholar]
- Chen, Q.; Zhang, J.; Li, X.; Yang, J. Research on Investment of Power Grid Project Based on Life Cycle. Mod. Electr. Power 2011, 10, 80–84. [Google Scholar]
- Sun, Q.; Ge, X.; Liu, L.; Xu, X.; Zhang, Y.; Niu, R.; Zeng, Y. Review of Smart Grid Comprehensive Assessment Systems. Proc. Csu-Epsa 2011, 23, 105–110. [Google Scholar] [CrossRef]
- Fang, Y.; Wang, X.; Shi, J.; Wu, X.; Yan, H. Research on Operation and Economic Efficiency Evaluation of Provincial Power Grid With Integrated Renewable Energy. Power Syst. Technol. 2017, 41, 2138–2145. [Google Scholar]
- Gao, F. Research on the social benefit evaluation method of UHV power grid. Syst. Prot. Control 2016, 44, 12–17. [Google Scholar]
- Tsai, W.H.; Hsua, W. A novel hybrid model based on DEMATEL and ANP for selecting cost of quality model development. Total Qual. Manag. Bus. Excell. 2010, 21, 439–456. [Google Scholar] [CrossRef]
- Tsai, S.B. Using the DEMATEL model to explore the job satisfaction of research and development professionals in china’s photovoltaic cell industry. Renew. Sustain. Energy Rev. 2018, 81, 62–68. [Google Scholar] [CrossRef]
- Feng, Y.; Hong, Z.; Tian, G.; Tan, J.; Hu, H. Environmentally Friendly MCDM of Reliability-based Product Optimisation Combining DEMATEL-based ANP, Interval Uncertainty and Vlse Kriterijumska Optimizacija Kompromisno Resenje (VIKOR). Inf. Sci. 2018, 442, 128–144. [Google Scholar] [CrossRef]
- Chen, I.S. A revised Inno-Qual performance system for higher education: the integrated applications of DEMATEL and ANP. J. Oper. Res. Soc. 2012, 63, 478–488. [Google Scholar] [CrossRef]
- Su, C.M.; Horng, D.J.; Tseng, M.L.; Chiu, A.S.; Wu, K.J.; Chen, H.P. Improving sustainable supply chain management using a novel hierarchical grey-DEMATEL approach. J. Clean. Prod. 2016, 134, 469–481. [Google Scholar] [CrossRef]
- Lee, A.H.I. A fuzzy AHP evaluation model for buyer–supplier relationships with the consideration of benefits, opportunities, costs and risks. Int. J. Prod. Res. 2009, 47, 4255–4280. [Google Scholar] [CrossRef]
- Lu, S.; Bao, H.; Pan, H. Urban water security evaluation based on similarity measure model of Vague set. Int. J. Hydrogen Energy 2016, 41, 15944–15950. [Google Scholar] [CrossRef]
- Hou, G.Y.; Tang, D.S. Fuzzy Comprehensive Evaluation of Water Resources Carrying Capacity based on Vague Method. Appl. Mech. Mater. 2014, 501, 2040–2044. [Google Scholar] [CrossRef]
- Yong, L.I.; Zhu, M.; Jia, L.I. Evaluation method of urban water security assurance capability for emergency rescue based on similarity measure of Vague sets. J. Hydraul. Eng. 2009, 40, 608–613. [Google Scholar]
- Xue, W.; Li, B.; Yang, Y.; Zhao, H.; Xu, N. Evaluating the Effectiveness of New and Old Kinetic Energy Conversion from an Electric Power Economics Perspective: Evidence on the Shandong Province of China. Energies 2019, 12, 1174. [Google Scholar] [CrossRef]


© 2019 by the authors. Licensee MDPI, Basel, Switzerland. This article is an open access article distributed under the terms and conditions of the Creative Commons Attribution (CC BY) license (http://creativecommons.org/licenses/by/4.0/).